Sustainable Tourism Development in Protected Areas of Rivers and Water Sources: A Case Study of Jiuqu Stream in China


1
Department of Recreation and Sports Management, National Chin-Yi University of Technology, Taichung 41170, Taiwan
2
Division of Neurosurgery, Department of Surgery, Changhua Christian Hospital, Changhua 50006, Taiwan
*
Author to whom correspondence should be addressed.
Sustainability 2020, 12(13), 5262; https://doi.org/10.3390/su12135262
Submission received: 2 June 2020
/
Revised: 16 June 2020
/
Accepted: 23 June 2020
/
Published: 29 June 2020
(This article belongs to the Special Issue Socio-Environmental Vulnerability Assessment for Sustainable Management)
Abstract
:This paper discusses the status quo of tourism and policy development regarding the Jiuqu Stream in China from different stakeholder perspectives. By combining field investigations, questionnaires, and statistical examinations of collected data, 812 samples were analyzed using multivariate analysis. The results indicate that increased visibility, employment opportunities, and real estate values in the scenic areas along the river will attract residents to return for future development, while public safety and conservation policies, featured architecture and tourism signage planning, increased cost of living, and waste and pollution will cause disincentives. Visitors will be attracted by the natural and ecological features, transportation planning, unique local culture, and events. Recreational facilities and architectural planning, merchandise lacking characteristics, tourist consumer expenditure, smoke and pollution from motor vehicles, and how it feels to interact with residents will influence the desire to visit the place. Development of an area should consider the different needs of every stakeholder in terms of recreational facilities, local infrastructure, expenditure and income, public safety and health, waste disposal, ecology and environmental conservation, tourism, and the quality of life.
1. Introduction
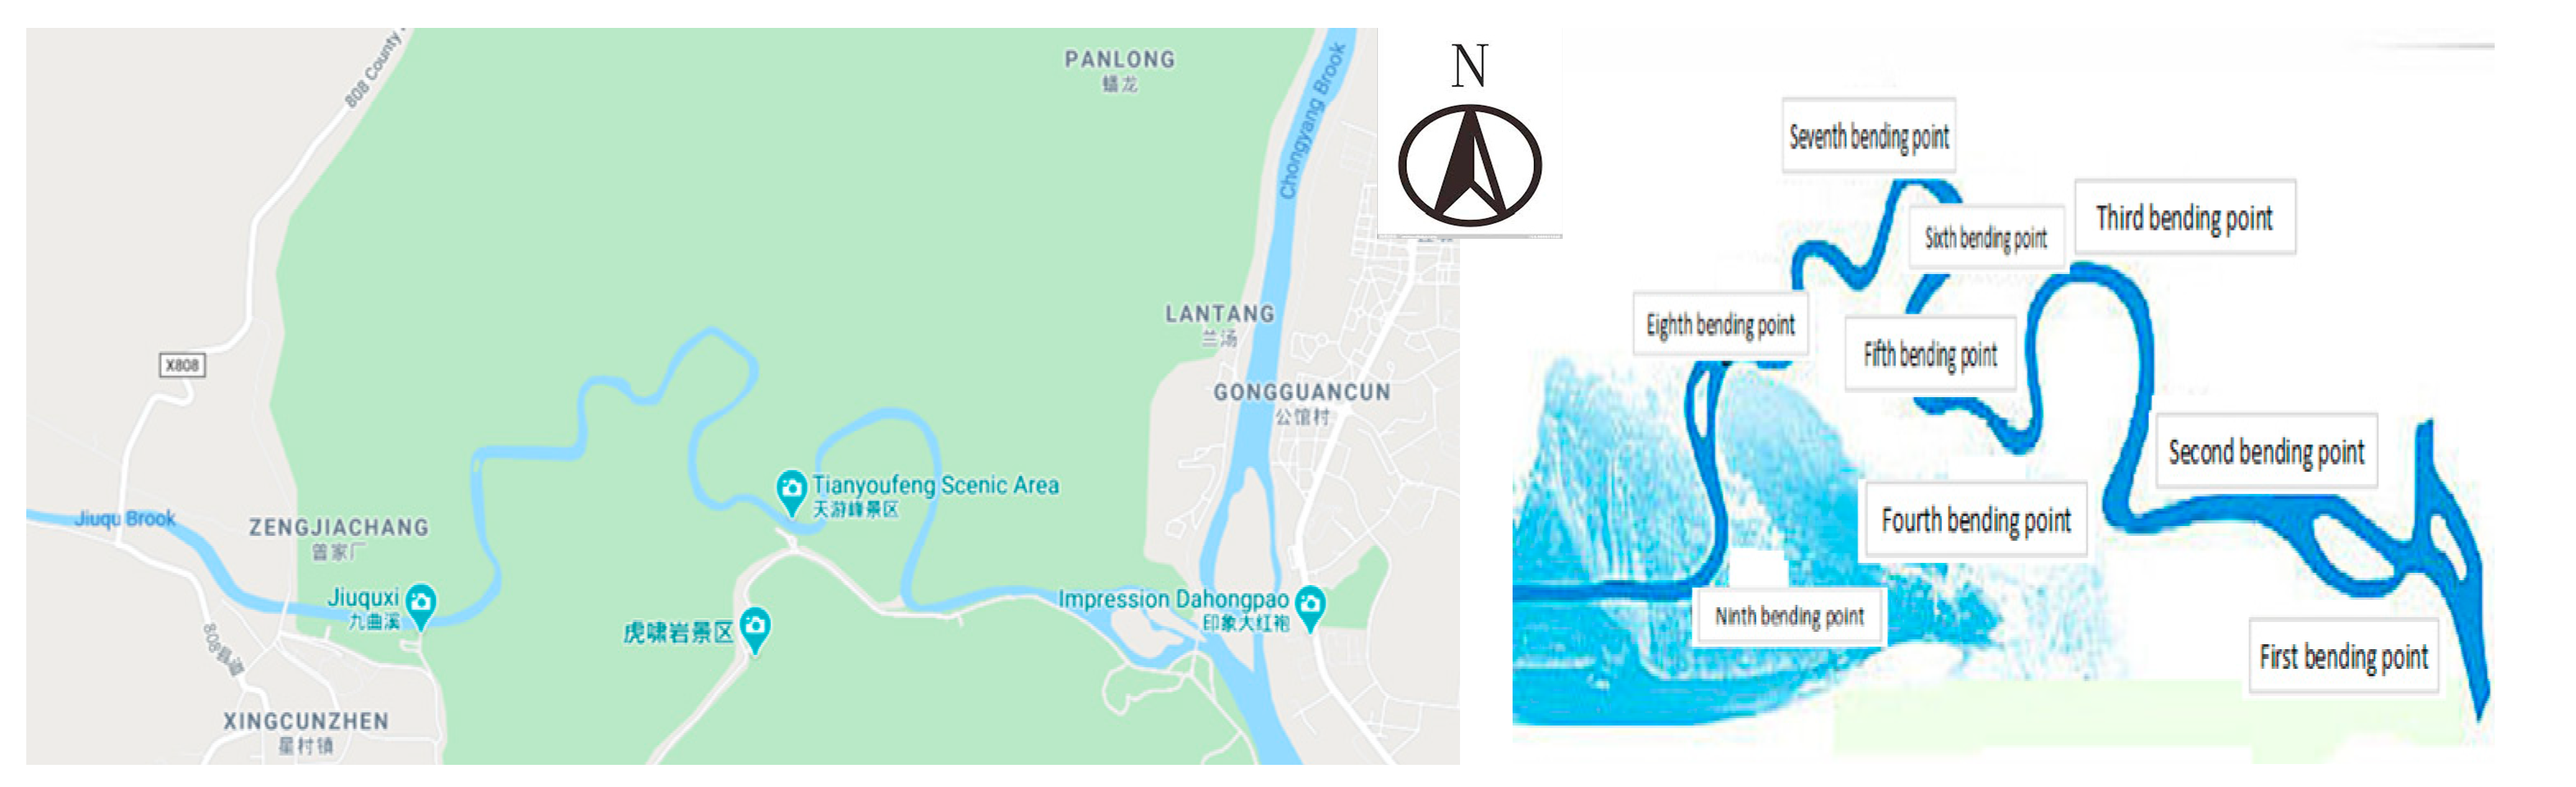
The Jiuqu Stream is located among peaks and valleys on Mount Wuyi in the Fujian Province, China, and it is 60 km long. The crisscrossing surrounding peaks and boulders shaped the stream into the nine bends from which its name is derived (Jiuqu means “nine bends” in Chinese), as shown in Figure 1. Rich in natural resources, history, and culture, the Jiuqu Stream is a World Heritage site [1]. In addition to the booming local tea industry, enterprises are encouraged to invest in setting up hotels. Taking advantage of the Jiuqu River’s water resources, bamboo rafting experiences can be set up from Seongchon Township to explore the surrounding natural ecological resources. In addition, tourism can be promoted by combining the ancient features of Taoist monuments, such as the Wuyi Temple, with the art and cultural performances (Impression Dahongpao). According to 2018 statistics, the stream attracted 15,146,900 tourists and created approximately 43.5 billion USD in business opportunities [2], demonstrating the enthusiastic development of local tourism.
Decision-making affects the direction and efficacy of tourism development [3]. Local development can promote economic improvement that increases living standards for residents and the health of the surrounding environment, but it can have negative outcomes [4]. These changes can be explored from economic, social, and environmental perspectives [5].
Exploring changes from the economic perspective involves examining cost of living, industrial construction, and village development [6] to understand concerns regarding employment, wages, consumerism, construction, industries, facilities, prices, premiums, health, culture and creativity, recreation, community feedback, and strategy coordination [6,7,8].
Social investigations involve tourism facilities, community development, living atmosphere, and cultural public safety [6] to understand community recognition, service and activity quality, political participation, tourism organizational planning, cultural and architectural traits, public safety enforcement, community facilities, and public interactions [9,10,11,12,13].
The environmental perspective involves tourism and recreational facilities and natural ecology to understand concerns of public transportation, parking and recreational areas, tourists’ environmental literacy, waste volume, forest lands and ecological habitats, automotive exhaust, water supply, and air quality.
Decision-making—in terms of the economy, society, and environment—can be investigated jointly by using policy announcements, public sentiment, economic development, online marketing, medical facilities, industry distribution, public safety, maintenance of historical sites, community assistance and development, tourism resource chains, public facility management, environmental campaigns, industrial traits, ecological conservation, environmental education, personnel training, travel planning, development monitoring, and traffic management [6,14].
After activities conclude [4,15,16], the resulting changes from impacts and effects can be collected from resident and tourist experiences [6,7,8,9,10,11,12,13,14]. Residents’ perspectives offer insight into changes in the area [6,7,8,9,10], whereas tourists’ perspectives can reveal shortcomings in development [11,12,13]; simultaneous investigations of both residents’ and tourists’ perspectives can generate detailed understanding of shortcomings [6,12,13,14]. These investigations can help decision-makers resolve challenges and achieve balanced sustainable development. Therefore, the researchers collected and analyzed the perceptions of residents and tourists on development near Jiuqu Stream and identified shortcomings in the developmental status quo.
The Earth’s ecological environment provides an abundance of natural resources, sufficient to fulfill the needs of all life on the planet [13]. To meet their needs for survival, human beings exploit natural resources to varying degrees in order to acquire them [17]. Although the goals and expectations are different for different individuals, for human beings, acquiring natural, ecological, social, humanistic, and economic resources to improve individual living standards is a universal goal [18]. This is also the case with tourism behavior and development.
The phenomenon of tourism is a result of the development of human technology and civilization, which has increased the efficiency of work and transportation, generating leisure time. The local tourism resources are used as an appeal to attract tourists to visit and spend money in the hope of gaining relaxation and satisfying their psychological needs [7,17,19,20,21,22,23]. The residents expect tourism development to stimulate local economic development, increase job opportunities, and improve the quality of life [4,24,25,26]. With tourism development as the main axis, they both interact with each other in the same region, in different positions, at different times, in different spaces, and with different resources, expecting to improve the psychological needs and status of individuals [27,28]. Although differences in needs and perceptions exist between the two stances [17,27], there have been many research reports on the effectiveness of tourism development from the perspective of residents [21,22,23]. However, there are quite a few researchers who investigate the defects of development through tourists [26,27]. However, not many researchers have explored the issue from the perspectives of both residents and tourists, and there is also a lack of studies on the development of river or stream tourism. Therefore, the investigators believe that sequentially understanding the feelings of residents and tourists towards the current situation of the development area and then analyzing the differences between them in terms of the local development, in order to obtain common or different viewpoints, can help to obtain more appropriate improvement suggestions [13,28]. Suggestions are then proposed based on this study’s findings to provide a reference for relevant agencies and to improve the sustainable development goals for Jiuqu Stream.
In order to properly address this study, the following research questions have been raised:
- Research Objective 1: What impact do residents feel on the current economic, social, and environmental development?
- Research Objective 2: What impact do tourists feel on the current economic, social, and environmental development?
- Research Objective 3: What impact did the two groups have on the current economic, social, and environmental development?
2. Methods and Instruments
2.1. Study Framework and Hypotheses
This study aimed to understand and compare the perceptions of residents and tourists on tourism strategies and developmental effects on Jiuqu Stream. Future developmental trends and suggestions for Jiuqu Stream are also proposed.
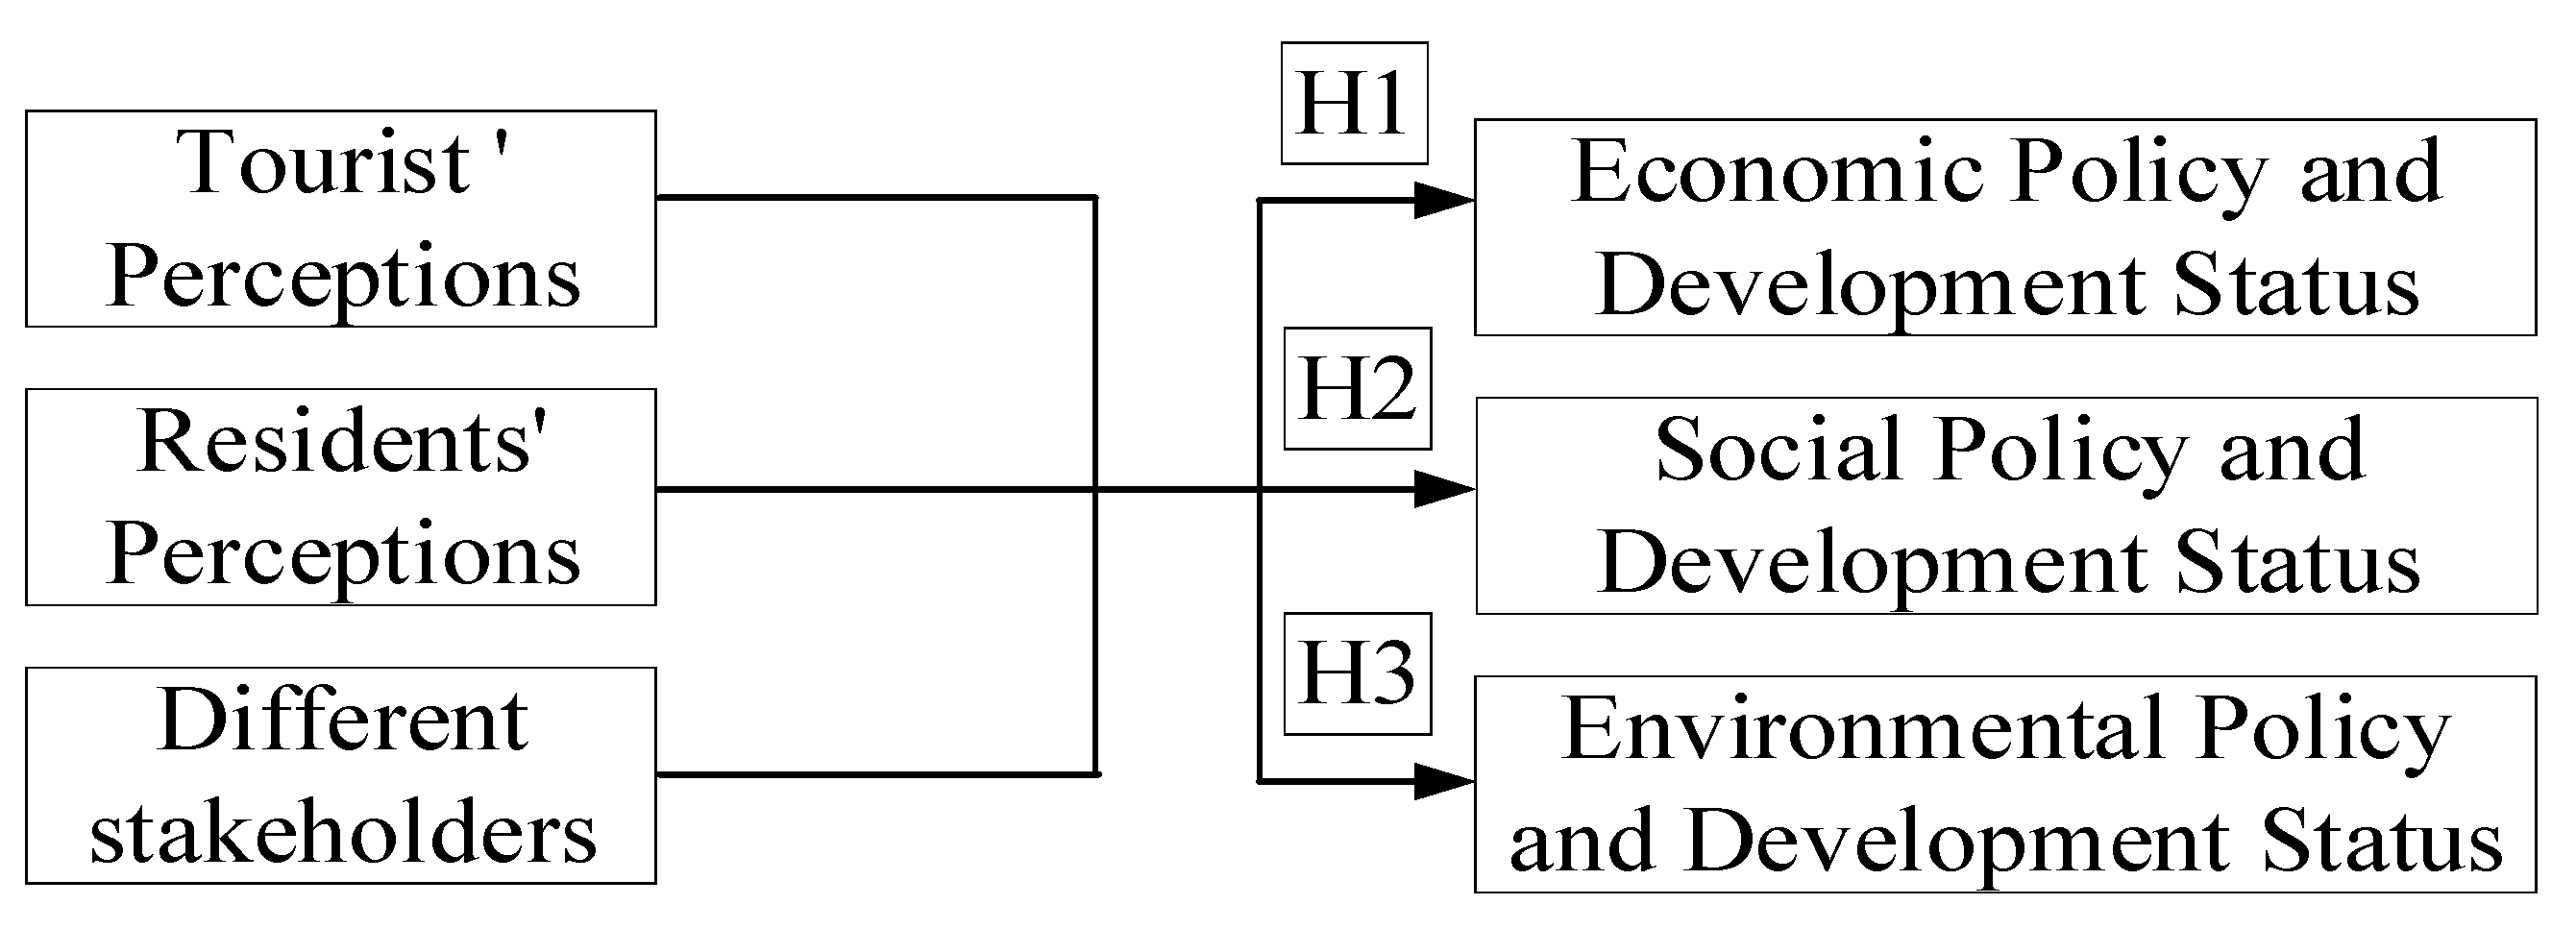
The perceptions of residents, tourists, and both groups on tourism and strategic development for Jiuqu Stream were collected. Resident and tourist opinions were obtained from the data to address developmental challenges and enable facilities to meet residents’ and tourists’ expectations. This study was developed [16] using questionnaire tools referenced from relevant literature [3,4,5,6,7,8,9,10,11,12,13,14,15], case studies, the researchers’ experiences, common understandings between residents and tourists [6,22,24,26,27], multiple research methods, data collection [29], and data comparison and testing by performing induction, organization, and analysis [30]. Collecting accurate and reasonable information can enable the revision of strategic and development planning for the Jiuqu Stream. Figure 2 presents the research framework based on the study goal and theoretical review.
On the basis of this research framework, this study developed the following three hypotheses: (1) Residents have a Tourism and Policy Development Status of consistent awareness; (2) tourists have a Policy Development Status of consistent awareness; (3) different stakeholders have the same correct understanding of the status of cognitive tourism development.
2.2. Study Procedure and Instruments
The research used mixed research methods. The survey outline was formulated by referring to research theory and literature [1,2,3,4,5,6,7,8,9,10,11,12,13,14,15,16]. Adopted the concepts of existing theories, explained the research results, and sought the opinions of experts and scholars. We compiled a questionnaire on the current situation of tourism development, which is divided into 40 questions: Economy (15), society (15), and environment (10), as shown in Table 1.
The questionnaire was designed using a five-point Likert’s scale, with 1 representing “strongly disagree” and 5 representing “strongly agree”. Fifty questionnaires were distributed for pre-testing. When Kaiser-Meyer-Olkin (KMO)> 0.06 and the p-value in the Bartlett test is less than 0.01 (p < 0.01), this indicates that the scale is suitable for continued factor analysis [31]. Then, the coefficient α is greater than 0.60. Tests show that the questionnaire has good reliability [32].
Economy (15) had a KMO > 0.627, with a Bartlett approximate χ2 value of 274.688, a degree of freedom (df) of 120, and a significance of 0.000 (p < 0.001), and was therefore suitable for factor analysis. The explainable variations of the scale were 10.339%, 3.418%, and 3.223%, and the total explainable variation was 16.98%. After factor analysis and considering the understanding of the actual current situation of economic development, all were retained. Three aspects were named: Cost of living (3), industrial construction (5), and village development (7). They contained a total of 15 questions, and the three scales were 0.603, 0.601, and 0.600, respectively.
Society (15) had a KMO > 0. 688, with a Bartlett approximate χ2 value of 413.731, a df of 105, and a significance of 0.000 (p < 0.001) and was therefore suitable for factor analysis. The explainable variations of the scale were 15.559%, 4.050%, and 3.65%, and the total explainable variation was 23.259%. After factor analysis and considering the intention of understanding the actual current situation of economic development, all were retained. Three aspects were named: Community building (6), living atmosphere (5), and cultural public safety (4). They contained a total of 15 questions, and the three scales were 0.644, 0.656, and 0.707, respectively.
Environment (110) had a KMO > 0. 914, with a Bartlett approximate χ2 value of 1280.57, a df of 55, and significance of 0.000 (p < 0.001), and was therefore suitable for factor analysis. The explainable variations of the scale were 47.496% and 7.834%, and the total explainable variation was 55.331%. After factor analysis, all were retained. Two aspects were named: Tourism and recreational facilities (4) and natural ecology (6). They contained a total of 10 questions, and the scales were 0.859 and 0.855.
Based on the results of the above analysis, it can be seen that the questions in the tourism and policy development awareness questionnaire designed by this study are all reliable. Afterwards, we analyzed the survey’s reliability with statistical verification and analyzed the results with descriptive analyses and t-tests, as shown in Table 2.
Next, interviews were used to supplement the sample information. With the consent of the respondents, six participants were interviewed, including local tourism practitioners, residents, and scholars with travel experience with regard to the Jiugqu River using the semi-structured design and open interviews to obtain their opinions on the analysis results presented in the survey, as shown in Table 3.
After the participants verified the accuracy of the recorded content, the researchers integrated the information of the questionnaire, analyzed the results, and completed the research paper through the processes of induction, organization, and analysis [10,29]. Finally, a multivariate validation analysis method was adopted to combine the information obtained from different research subjects, theories, and methods to validate multiple data from multiple perspectives and to compare the results of different studies [29,30] in order to acquire accurate knowledge and implications. Ultimately, we hope to explore the current state of the Jiuqu River’s tourism development from the perspectives of both residents and visitors, and to offer suggestions for improvement based on the views of both.
2.3. Study Scope and Limitations
Jiuqu Stream is located between the peaks and valleys of Wuyi Mountain, Fujian Province, China, and is 60 kilometers long. The criss-crossing peaks and boulders shape the river into nine bends; the surrounding natural ecology is diverse, the mountain landscape is diverse, and it has become the main tourist area for major tourists. The surrounding Xing-cun Town and Gong-guan Village are the closest towns to the Jiuquxi Scenic Area. The area also takes Jiuqu Stream and surrounding tourist attractions as tourist destinations to improve local development.
The study sample was collected from October 2019 and completed in February 2020. Initially, questionnaires were collected on site. Due to cost, manpower, and material considerations, as well as restricted working hours of residents and visitors’ willingness to be interviewed, the survey was conducted using random sampling. Interviews were conducted right after seeking the consent of the participants. However, due to the outbreak of COVID-19, the sampling was changed to an online questionnaire platform, and since it was not easy to confirm the respondents, snowball sampling was used instead. Summing up the above explanations, it is unlikely that more comprehensive information can be obtained due to the limitations of the sample background. If this results in any discrepancy in the study, it will be taken into consideration for the further study.
3. Analysis of Results
3.1. Descriptive Characteristics of the Sample
Based on the analysis of the 812 samples, the Jiuqu Stream is considered a well-known tourist area with rich natural ecology and numerous historic sites. The area is popular for light tourist activities (42.4%) and among women (57.6%). Average consumer expenditure per visit was 420–700 USD (36.5%). Most tourists (68%) arranged two trips to visit local scenery per year (35.5%), as shown in Table 4.
3.2. Perceptions of Economic Strategies and Developmental Efficacy
Respondents responded based on the content of the questionnaire. Statistical verification analysis was used. A score of 1 indicates strong disagreement, and a score of 5 indicates a strong agreement. Because residents, tourists, and other stakeholders had inconsistent perceptions of economic strategies and development efficacy, Hypothesis 1 did not hold, as shown in Table 5.
The government uses the natural environment, cultural monuments, and agricultural products to develop tourism and corresponding industries that enhance real-estate value and create employment and business opportunities. However, tourist facilities and resources are primarily targeted towards tourists; residents are few and scattered, and transportation in mountainous areas is inconvenient. Residents lacked access to transportation, resource pipelines, or tourism premiums, and protection policies could not be implemented. As a result, residents perceived improvements in employment opportunities, the tourism industry, and real-estate prices, but they believed that efficacy in expenditures and costs, tourism premiums, and protection policies were lacking.
Rich natural resources as well as rafting and performance activities expand travel options. In addition, improvements to medical care also increase tourists’ willingness to visit a destination. However, remote locations, insufficient tourist facilities, and crude town facilities affect tourists’ willingness to consume. Therefore, tourists perceived improvements in income, medical care, and leisure opportunities, but they felt that efficacy in expenditures, costs, and development feedback were lacking.
As a result, stakeholder perceptions of employment opportunities, salary income, tourist facilities, real-estate prices, and medical services differed, causing divergences (p < 0.001), as shown in Table 6.
Tourist and medical facilities were sufficient to meet tourist needs and increase their willingness to consume. These facilities indirectly provided employment opportunities to area residents. However, jobs in the tourism industry have long work hours and low pay, and residents live far from these workplaces, thereby increasing their cost of living. Figure 3 demonstrates the perceptions of social strategies and developmental efficacy.
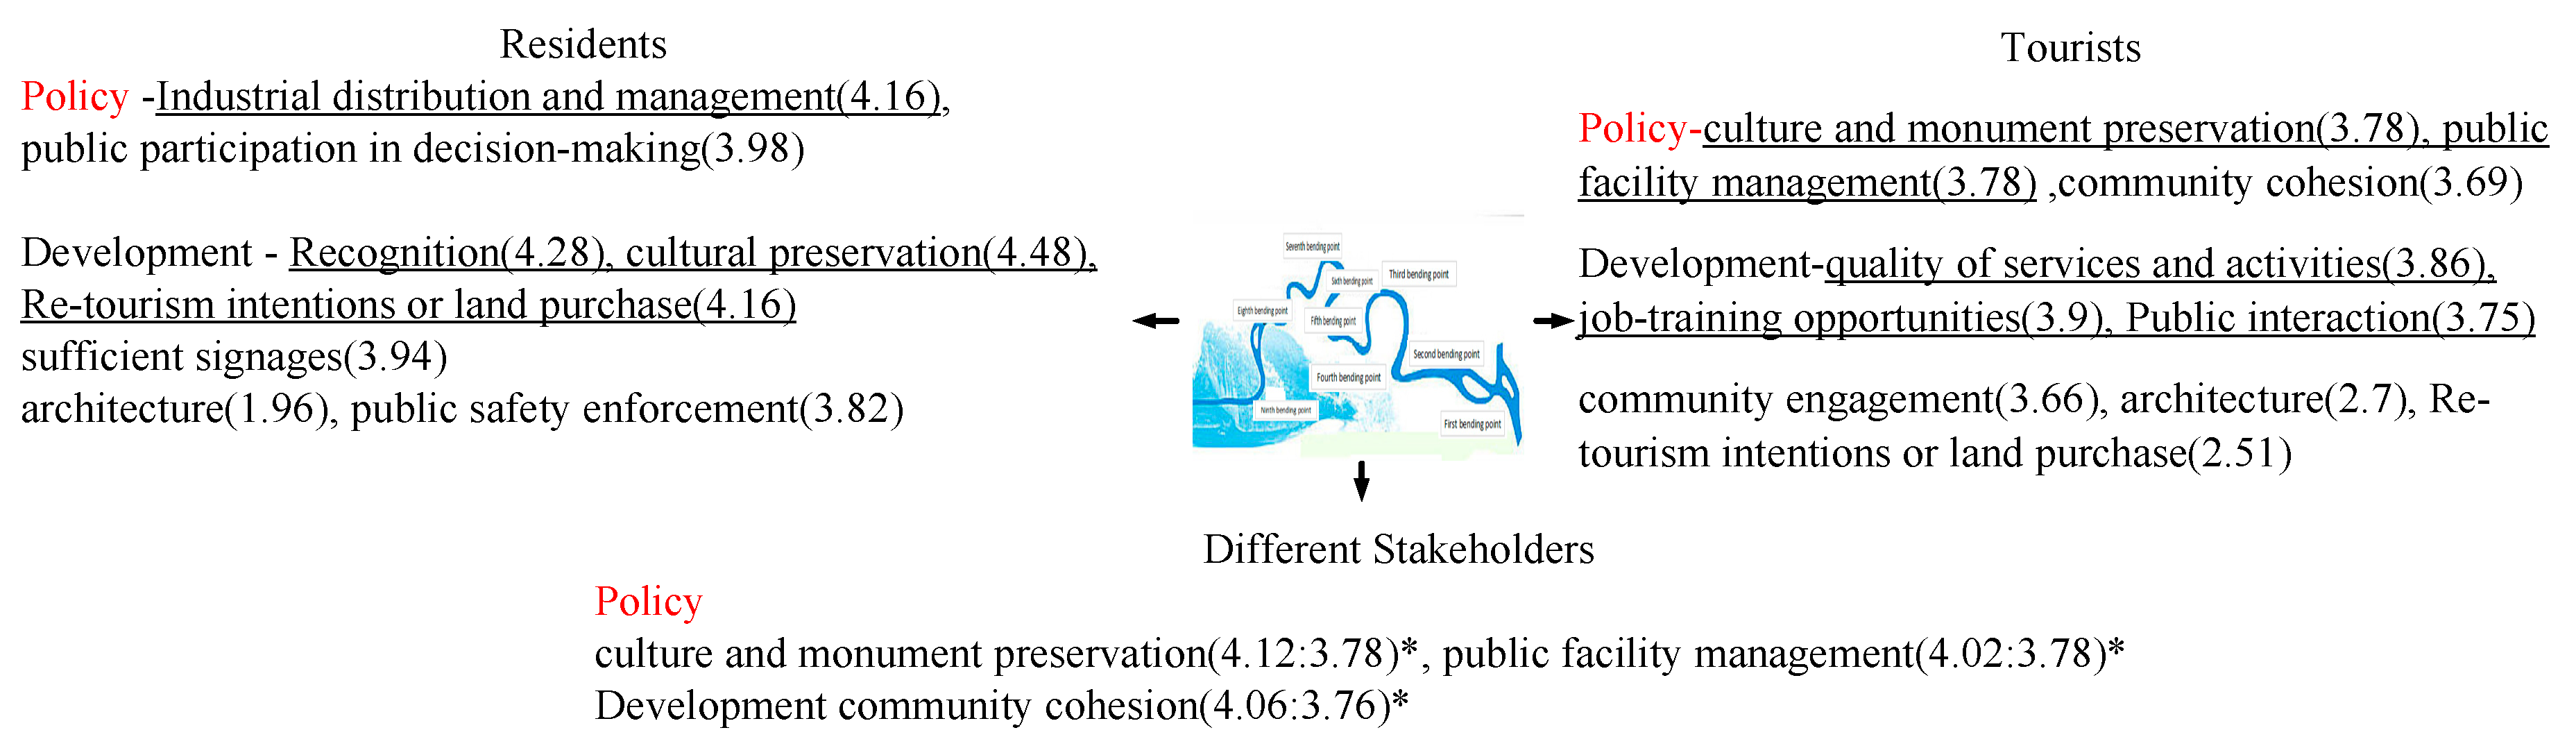
3.3. Perceptions of Social Strategies and Developmental Efficacy
Respondents responded based on the content of the questionnaire. Statistical verification analysis was used. A score of 1 indicates strong disagreement, and a score of 5 indicates strong agreement.
Because residents, tourists, and other stakeholders had inconsistent perceptions of social strategies and developmental efficacy, Hypothesis 2 did not hold, as shown in Table 7.
Government relocation of residents can protect the environment by preserving culture, creating business opportunities by attracting tourists, and increasing residents’ willingness to invest. However, the preservation of monuments and public safety is jeopardized in large and remote scenic areas, which have insufficient signage, buildings, and marketing traits and small and scattered residential populations, leading to shortages in staffing to maintain the scenic area. As a result, residents perceived increased recognition, cultural preservation, and willingness to revisit and acquire property, but they felt that efficacy in architecture, signages, and public safety enforcement were lacking.
The government’s integration of local cultures and industries attracted corporate investments and created high-quality tourist environments. However, the small and scattered residential population caused staffing shortages for maintaining the large scenic area, and government control of decision-making has caused low public involvement in policy. As a result, tourists perceived increases activity quality, job-training opportunities, and public interaction, but they felt that efficacy in architecture, community participation, and willingness to revisit and acquire property were lacking.
As a result, stakeholders perceived signages and public safety planning, job-training opportunities, architecture, and revisiting and property acquisitions differently, leading to divergences (p < 0.001), as shown in Table 8.
Abundant natural resources and historic buildings primarily attract tourists and create business opportunities. However, signage and facilities were for shuttle services and tourist centers because tourists are unfamiliar with the geography of the scenic area, thereby increasing the risk to visitor safety because of the area’s size. Figure 4 demonstrates the perceptions of social strategies and developmental efficacy.
3.4. Perceptions of Environmental Strategies and Developmental Efficacy
Respondents responded based on the content of the questionnaire. Statistical verification analysis was used. A score of 1 indicates strong disagreement, and a score of 5 indicates strong agreement.
Residents, tourists, and different stakeholders had inconsistent perceptions of environmental strategies and developmental efficacy; therefore, Hypothesis 3 did not hold, as shown in Table 9.
Comprehensive bus services in the scenic area help residents commute. However, large numbers of tourists rapidly increase automotive transportation and human-made waste, and the small local population has insufficient cleaning personnel, thereby increasing the amount of waste in the scenic area. As a result, residents perceived adequate ecological and tourist transportation planning, but they felt apprehension regarding waste disposal and automotive exhaust problems.
Comprehensive ecological management and transportation planning can protect the environment and reduce transportation time, thereby increasing willingness to travel. However, because of the scenic area’s large size, transportation time increased, and the few residents and staff cannot easily maintain facilities and the environment or manage waste. As a result, tourists perceived comprehensive ecological protections and tourism transportation planning as well as problems of waste disposal and automotive exhaust.
As a result, different stakeholders had divergent views on waste disposal, water sources, lakes, flora, biological habitats, noise pollution, and external ecological threats (p < 0.001), as shown in Table 10.
The local area is mountainous and has dense forests, clear water, and a beautiful natural environment. However, the large increase in tourists and vehicles coupled with tourists’ boisterousness and environmental illiteracy have caused environmental destruction. Figure 5 demonstrates the perceptions of environmental strategies and developmental efficacy.
4. Conclusions and Recommendations
4.1. Conclusions
Every stakeholder has different demands in terms of recreational facilities, local infrastructure, expenditure and income, public safety and health, waste disposal, and ecological and environmental conservation, as well as tourism and the quality of life. Residents’ willingness to return to their hometowns for development depends on the visibility, employment opportunities, and the growth of real estate. Public safety and protection policies, insurance expenses, construction, inadequate signage, increased cost of living, and waste and pollution are the deterrents to residents returning for future development. Tourists are attracted by the natural and ecological features, well-planned transportation, and unique local culture and events, but are usually deterred by poor recreational facilities and architectural planning, merchandise lacking characteristics, high tourist consumer expenditure, smoke and pollution from motor vehicles, and unpleasant encounters with locals.
4.2. Recommendations
- Community development and local facilities should be improved while valuing public sentiment in mutually beneficial situations for the government and residents.
- Environmental sanitation requires improvement by defining construction and cultural traits and resolving waste and pollution problems.
- Tourism management, marketing, and service quality require improvement, and travel itineraries should be developed to enhance residents’ employment skills; travel safety should be enhanced, and signage, waste, and noise pollution problems should be addressed. Water sources, lakes, and flora environments should be maintained to increase residents’ and tourists’ willingness to invest and travel in the area.
- The development of ecotourism in other regions and countries warrants study from different perspectives.
- Political, social, and industrial developments warrant investigation from different perspectives to collect comprehensive research data.
Author Contributions
Conceptualization, C.-H.H. and H.-H.L.; methodology, H.-H.L.; software, H.-H.L.; validation, C.-H.H. and H.-H.L. and S.J.; formal analysis, H.-H.L.; investigation, H.-H.L.; resources, H.-H.L.; data curation, H.-H.L.; writing—original draft preparation, H.-H.L.; writing—review and editing, H.-H.L.; visualization, C.-H.H.; supervision, C.-H.H.; project administration, C.C.H.; funding acquisition, S.J. All authors have read and agreed to the published version of the manuscript.
Funding
This research received no external funding.
Conflicts of Interest
The authors declare no conflict of interest
References
- Ministry of Culture and Tourism of the People’s Republic of China (2020). Overview of the 2018 Tourism Market. Available online: http://zwgk.mct (accessed on 31 March 2020).
- NPTA.CN. Jiuqu Stream in Mt. Wuyi. 2019. Available online: http://www.npta.cn/spots/show_82.html (accessed on 3 March 2020).
- Kingdon, J.W. Agendas, Alternatives, and Public Policies; Addison-Wesley: Boston, MA, USA, 1995. [Google Scholar]
- Ap, J.; Crompton, J.L. Developing and testing a tourism impact scale. J. Travel Res. 1998, 37, 120–130. [Google Scholar] [CrossRef]
- Johnson, J.D.; Snepenger, D.J.; Akis, S. Residents’ perceptions of tourism development. Ann. Tour. Res. 1994, 21, 629–642. [Google Scholar] [CrossRef]
- Lin, H.H. The Study on Tourism Policy, Current Development Status, and Impact Perception of Sun Moon Lake. Doctoral Dissertation, DaYeh University, Institute of Environmental Engineering Department, Changhua, China, 2019. [Google Scholar]
- Lankford, S.V.; Howard, D.R. Developing a Tourism Impacts Attitude Scale. Ann. Tour. Res. 1994, 21, 121–139. [Google Scholar] [CrossRef]
- Rothman, R. Residnets an dtransients: Community reaction to seasonal visitors. J. Travel Res. 1978, 16, 8–13. [Google Scholar] [CrossRef]
- Husbands, W. Social status and perception of tourism in Zambia. Ann. Torusim Res. 1989, 16, 237–253. [Google Scholar] [CrossRef]
- Gursoy, D.; Jurowski, C.; Uysal, M. Resident Attitudes: A structural modeling approach. Ann. Tour. Res. 2002, 20, 79–105. [Google Scholar] [CrossRef]
- de Waal, F. Are we Smart Enough to Know How Smart Animals Are? Wilson Hall Auditorium: Harrisonburg, VA, USA, 2017. [Google Scholar]
- Paulo, E.J.; Belmiro, V.P. Olfactory information from the path is relevant to the homing process of adult pigeons. Behav. Ecol. Sociobiol. 2017, 72, 5. [Google Scholar] [CrossRef]
- Lin, H.; Lee, S.; Perng, Y. Investigation about the Impact of Tourism Development on a Water Conservation Area in Taiwan. Sustainability 2018, 10, 2328. [Google Scholar] [CrossRef] [Green Version]
- Anderson, J.E. Public Policy-Making; CBS College Publishing: New York, NY, USA, 1990. [Google Scholar]
- Jurowski, C.; Uysal, M.; Williams, D.R. A theoretical analysis of host community resident reactions to tourism. J. Travel Res. 1997, 36, 3–11. [Google Scholar] [CrossRef]
- Strauss & Corbin. Basics of Qualitative Research: Grounded Theory Procedures and Techniques; Sage: Newbury Park, CA, USA, 1990. [Google Scholar]
- Schreiber, R.L.; Diamond, A.W.; Peterson, R.T.; Cronkite, W. Save the Birds; Cambridge, University Press: Lanham, MD, USA, 1987; p. 384. ISBN 10: 0395511720. [Google Scholar]
- Otto, J.E.; Ritchie, J.R.B. The service experience in tourism. Tour. Manag. 1996, 17, 165–174. [Google Scholar] [CrossRef]
- Goffi, G.; Cladera, M.; Osti, L. Sun, Sand, and… Sustainability in Developing Countries from a Tourists’ Perspective. The Case of Punta Cana. Sustainability 2020, 12, 4743. [Google Scholar] [CrossRef]
- Zhang, A.; Zhong, L.; Xu, Y.; Wang, H.; Dang, L. Tourists’ Perception of Haze Pollution and the Potential Impacts on Travel: Reshaping the Features of Tourism Seasonality in Beijing, China. Sustainability 2015, 7, 2397–2414. [Google Scholar] [CrossRef] [Green Version]
- Tsai, K.-T.; Lin, T.-P.; Lin, Y.-H.; Tung, C.-H.; Chiu, Y.-T. The Carbon Impact of International Tourists to an Island Country. Sustainability 2018, 10, 1386. [Google Scholar] [CrossRef] [Green Version]
- Butler, R.W. The concept of a tourist area cycle of evolution: Implications for management of resources. Can. Geogr. 1980, 24, 5–12. [Google Scholar] [CrossRef]
- Campón-Cerro, A.M.; Folgado-Fernández, J.A.; Hernández-Mogollón, J.M. Rural Destination Development Based on Olive Oil Tourism: The Impact of Residents’ Community Attachment and Quality of Life on Their Support for Tourism Development. Sustainability 2017, 9, 1624. [Google Scholar] [CrossRef] [Green Version]
- Galeote, L.C.; Mestanza, J.G. Qualitative Impact Analysis of International Tourists and Residents’ Perceptions of Málaga-Costa Del Sol Airport. Sustainability 2020, 12, 4725. [Google Scholar] [CrossRef]
- Katsikari, C.; Hatzithomas, L.; Fotiadis, T.; Folinas, D. Push and Pull Travel Motivation: Segmentation of the Greek Market for Social Media Marketing in Tourism. Sustainability 2020, 12, 4770. [Google Scholar] [CrossRef]
- Perdue, R.R.; Long, P.T.; Allen, L. Resident support for tourism developments. Ann. Tour. Res. 1990, 14, 420–429. [Google Scholar] [CrossRef]
- Lin, Z.; Chen, Y.; Filieri, R. Resident-tourist value co-creation: The role of residents’ perceived tourism impacts and life satisfaction. Tour. Manag. 2017, 61, 236–442. [Google Scholar] [CrossRef] [Green Version]
- Riu, A.S.; Caldés, R.G.; Donada, J.T. Furthering Internal Border Area Studies: An Analysis of Dysfunctions and Cooperation Mechanisms in the Water and River Management of Catalonia, Aragon and the Valencian Community (Spain). Sustainability 2019, 11, 4499. [Google Scholar] [CrossRef] [Green Version]
- Anselm, L. Strauss, Juliet, Corbin. In Basics of Qualitative Research: Grounded Theory Procedures and Techniques, 2nd ed.; Sage: Newbury Park, CA, USA, 1998. [Google Scholar]
- Janesick, V.J. The Choreography of Qualitative Research Design: Minuets, Improvisations, and Crystallization. In Handbook of Qualitative Research; Denzin, N.K., Lincoln, Y.S., Eds.; Sage: Thousand Oak, CA, USA, 2000; pp. 379–399. [Google Scholar]
- Ajzen, I. The Theory of Planned Behavior. Organ. Behav. Human Decis. Process. 1991, 50, 179–211. [Google Scholar] [CrossRef]
- Devellis, R.F. Scale Development: Theory and Applications; Sage: Newbury Park, CA, USA, 1991. [Google Scholar]
Figure 1.
Location and characteristics of the Jiuqu Stream in China.

Figure 2.
Study framework.

Figure 3.
Perceptions of economic strategies and developmental efficacy. *: p < 0.01 (Residents: Tourists); attractive, repulsive force.
Figure 3.
Perceptions of economic strategies and developmental efficacy. *: p < 0.01 (Residents: Tourists); attractive, repulsive force.

Figure 4.
Perceptions of social strategies and developmental efficacy. *: p < 0.01; residents; tourists; attractive, repulsive forces.
Figure 4.
Perceptions of social strategies and developmental efficacy. *: p < 0.01; residents; tourists; attractive, repulsive forces.

Figure 5.
Perceptions of environmental strategies and developmental efficacy. *: p < 0.01; residents; tourists; attractive, repulsive forces.
Figure 5.
Perceptions of environmental strategies and developmental efficacy. *: p < 0.01; residents; tourists; attractive, repulsive forces.


Table 1.
Initial questionnaire issue preparation.
| Residents | Tourists | ||
|---|---|---|---|
| Economic | Cost of living | Increase job opportunities | Multiple job opportunities |
| Increase income | Consumption increase | ||
| Increase the cost of living | Increase consumption costs | ||
| Industry construction | Increase sightseeing facilities | Increase sightseeing facilities | |
| Increased tourism industry | Increased tourism industry | ||
| Combination of industrial characteristics | Sufficient industrial specialty commodities | ||
| Increased leisure opportunities | Increased leisure opportunities | ||
| Have preferential measures | Have preferential measures | ||
| Village development | Increased public construction | Adequate public construction | |
| Enterprise feedback | Industry Promotion | ||
| Land and price increases | Rent and price increases | ||
| Medical and health improvement | Adequate medical and health level | ||
| Government communication platform | Sufficient tourism complaint platform | ||
| Tourism and conservation policy | Adequate tourism and conservation policies | ||
| Development of creative products | Diversified creative products | ||
| Increase job opportunities | Multiple job opportunities | ||
| Social | Company building | Increase visibility | Increased visibility |
| Increase service quality | Service quality improvement | ||
| Increase activity quality | Event quality improvement | ||
| Increase community development and willingness to participate | Popular community development and willingness to participate | ||
| Tourism indicators increase | Adequate tourism index | ||
| Increase the choice of tourist facilities | Multiple choices of tourist facilities | ||
| Youth’s willingness to return home | Youth return to employment increases | ||
| Life | Educational vocational training opportunities | Diversified educational vocational training opportunities | |
| Monuments and cultural preservation | Monuments and cultural preservation | ||
| Community environment commercialization | Community environment commercialization | ||
| Tourist friendly | Travellers’ friendly spending attitude | ||
| Good interaction between tourists and residents | Good interaction between tourists and residents | ||
| Cultural security | Increase the security staff | Adequate police staff | |
| Increase willingness to purchase | Increase in willingness to travel again | ||
| Increase visibility | Increased visibility | ||
| Environmental | Tourist rest facilities | Water pollution | Water pollution |
| River pollution | River pollution | ||
| Vegetation change | Vegetation is scarce | ||
| Biological habitat change | Biomass changes | ||
| Steam locomotive, oil, and smoke pollution | Steam locomotive pollution | ||
| Noise and garbage pollution | Increased noise and garbage | ||
| Alien species threat | Increased alien species | ||
| Natural ecosystems | Tourist transportation | Convenient transportation | |
| Parking space | Ample parking | ||
| Tourism environment destruction | The tourist environment is damaged | ||
| Water pollution | Water pollution | ||
Table 2.
Constructs involved in the questionnaire on perceptions of the impact of residents and tourism on the Jiuqu Stream.
Table 2.
Constructs involved in the questionnaire on perceptions of the impact of residents and tourism on the Jiuqu Stream.
| Construct | Subfacet | Issues of Perceptions about the Impact of Tourism | Cronbach’s α |
|---|---|---|---|
| Economic | Cost of living | Employment opportunities, income, expenditures | 0.60−0.62 |
| Industrial construction | Tourism facilities, tourism industries, Commodities combining local characteristics and products, leisure opportunities, tourism premiums | 0.60−0.61 | |
| Village development | Facility maintenance, development feedback, real-estate prices, medical care, community communications, political participation, cultural and creative products | 0.59−0.63 | |
| Social | Community building | Recognition, quality of services and activities, community engagement, sufficient signage, travel and recreational alternatives, organizational capacity | 0.63−0.66 |
| Living atmosphere | Young people returning, job-training opportunities, cultural preservation, architecture, tourist attitudes | 0.63−0.71 | |
| Cultural public safety | Public interaction, public safety enforcement, Re-tourism intentions or land purchase | 0.58−0.65 | |
| Environmental | Tourism and recreational facilities | Waste disposal, transportation, parking and recreational areas, environmental damage by tourists | 0.85−0.89 |
| Natural ecology | Water resources, lakes, flora, biological habitats, automotive exhaust, noise pollution, external ecological threats | 0.85−0.86 |
Table 3.
Background and interview topics.
| Gender | Length of Stay/Seniority | Occupation | Gender | Length of Stay/Seniority | Occupation |
|---|---|---|---|---|---|
| male | 30 | Residents | male | 12 | prof |
| female | 28 | Residents | male | 6 | prof |
| male | 25 | Residents | female | 15 | tourist guide |
| interview topics Description | |||||
| |||||
Table 4.
Descriptive characteristics of the participants.
| Identity | |||
|---|---|---|---|
| Identity | Percentage | Age | Percentage |
| Residents | 32% | Under 20 | 5.4% |
| Tourists | 68% | 21–30 | 33.5% |
| Gender | Percentage | 31–40 | 17.2% |
| Male | 42.4% | 41–50 | 13.3% |
| Female | 57.6% | 51–60 | 11.3% |
| Over 61 | 19.2% | ||
| Spending on Trips and Number of Tours | |||
| Annual trips | Percentage | Travel Consumption (USD) | Percentage |
| 1 | 19.2% | 140下 | 8.9% |
| 2 | 35.5% | 140–420 | 30.5% |
| 3 | 27.1% | 420–700 | 36.5% |
| 4 | 14.8% | 700–1120 | 11.8% |
| 5 | 3.4% | 1120–1700 | 9.9% |
| 1700上 | 2.2% | ||
| Tourist purpose | |||
| Tourism | 42.4% | Administrative affairs | 9.9% |
| Shopping consumption | 14.8% | Fire safety | 3.0% |
| Work | 13.8% | Academic research | 2.5% |
| Leisure and sport | 13.8% | ||
Table 5.
Residents’ and tourists’ perceptions of current economic development.
| Facets | Highest | M | Lowest | M | |
|---|---|---|---|---|---|
| Residents | Price of people | Job opportunity | 4.26 | Cost of expenditure | 3.86 |
| Industry construction | Tourism industry | 4.06 | Sightseeing discount | 3.96 | |
| Village development | Land price | 4.40 | Protection policy | 3.96 | |
| Tourist | Price of people | Income | 3.94 | Cost | 3.88 |
| Industry construction | Leisure opportunities | 3.78 | Building | 3.71 | |
| Village development | Health and medical facilities | 3.84 | Feedback measures | 3.63 | |
Table 6.
Recognition of economic development status by persons with different rights.
| Issue | Resident | Passenger | T | p-Value | |||
|---|---|---|---|---|---|---|---|
| M | SD | M | SD | ||||
| Price of people | Job | 4.26 | 0.565 | 3.91 | 0.369 | 5.075 | 0.000 * |
| Income | 4.16 | 0.650 | 3.94 | 0.367 | 2.967 | 0.000 * | |
| Cost | 3.86 | 0.535 | 3.88 | 0.443 | −0.294 | 0.082 | |
| Industry construction | Building | 3.98 | 0.553 | 3.71 | 0.561 | 3.012 | 0.002 * |
| Business | 4.06 | 0.620 | 3.72 | 0.531 | 3.778 | 0.371 | |
| Spot color combination | 4.04 | 0.699 | 3.75 | 0.544 | 3.090 | 0.467 | |
| Fallow machine | 4.00 | 0.535 | 3.78 | 0.490 | 2.723 | 0.050 | |
| Grace | 3.96 | 0.638 | 3.75 | 0.541 | 2.258 | 0.602 | |
| Village development | Installation protection | 4.02 | 0.589 | 3.75 | 0.541 | 2.977 | 0.108 |
| Circulation | 3.98 | 0.685 | 3.63 | 0.549 | 3.701 | 0.484 | |
| Land and kitchen | 4.40 | 0.639 | 3.83 | 0.535 | 6.221 | 0.002 * | |
| Hygiene | 4.26 | 0.694 | 3.84 | 0.488 | 4.689 | 0.000 * | |
| Mizonori cooperation | 4.16 | 0.584 | 3.77 | 0.506 | 4.533 | 0.649 | |
| Policy | 4.08 | 0.601 | 3.69 | 0.579 | 4.137 | 0.041 | |
| Protective measures | 3.96 | 0.638 | 3.77 | 0.519 | 2.105 | 0.986 | |
| Creative products | 4.14 | 0.606 | 3.75 | 0.517 | 4.416 | 0.772 | |
* = p < 0.001.
Table 7.
Residents’ and tourists’ perceptions of social development.
| Figure | Highest | M | Lowest | M | |
|---|---|---|---|---|---|
| Residents | Company building | Popularity | 4.28 | Indicator satisfaction | 3.94 |
| Life | Cultural preservation | 4.48 | Building style | 1.96 | |
| Cultural security | Replay | 4.16 | Public security management | 3.82 | |
| Tourist | Company building | Activity quality | 3.86 | Community involvement | 3.66 |
| Life | Vocational training opportunities | 3.90 | Building style | 2.70 | |
| Cultural security | Public interaction | 3.75 | Re-travel | 2.51 | |
Table 8.
Recognition of social development status by different stakeholders.
| Issue | Resident | Passenger | t | p-Value | |||
|---|---|---|---|---|---|---|---|
| M | SD | M | SD | ||||
| Company building | Popularity | 4.28 | 0.536 | 3.79 | 0.509 | 5.826 | 0.237 |
| Service quality | 4.00 | 0.535 | 3.77 | 0.493 | 2.788 | 0.024 | |
| Activity quality | 4.00 | 0.639 | 3.86 | 0.505 | 1.632 | 0.434 | |
| Community involvement | 3.98 | 0.622 | 3.66 | 0.552 | 3.445 | 0.033 | |
| Adequate indicators | 3.94 | 0.818 | 3.82 | 0.488 | 1.220 | 0.000 * | |
| Recreational choices | 4.04 | 0.570 | 3.73 | 0.529 | 3.582 | 0.053 | |
| Increased organization | 4.18 | 0.629 | 3.76 | 0.500 | 4.844 | 0.130 | |
| Life | Youth return home | 4.42 | 0.538 | 3.82 | 0.527 | 6.911 | 0.027 |
| Vocational training opportunities | 4.42 | 0.538 | 3.90 | 0.455 | 6.669 | 0.000 * | |
| Cultural preservation | 4.48 | 0.544 | 3.80 | 0.574 | 7.321 | 0.185 | |
| Building style | 1.96 | 0.402 | 2.70 | 0.918 | −0.516 | 0.000 * | |
| Tourist attitude | 3.94 | 0.424 | 3.86 | 0.501 | 0.981 | 0.055 | |
| Cultural security | Public interaction | 3.88 | 0.480 | 3.75 | 0.507 | 1.655 | 0.020 |
| Public security management | 3.82 | 0.482 | 3.37 | 0.523 | 5.433 | 0.002 * | |
| Re-travel | 4.16 | 0.738 | 2.51 | 0.954 | 11.182 | 0.006 * | |
*: p < 0.01.
Table 9.
Residents’ and tourists’ perceptions of the current situation of environmental development.
Table 9.
Residents’ and tourists’ perceptions of the current situation of environmental development.
| Facets | Highest | M | Lowest | M | |
|---|---|---|---|---|---|
| Residents | Tourist rest facilities | Tourist transportation | 4.36 | Garbage placement | 1.88 |
| Natural ecosystems | Steam locomotive fume | 2.30 | Alien species threat | 1.94 | |
| Tourists | Tourist rest facilities | Tourist transportation | 3.75 | Garbage placement | 2.46 |
| Natural ecosystems | Steam locomotive fume | 2.60 | Biological habitat | 2.34 | |
Table 10.
Recognition of environmental development status by different stakeholders.
| Issue | Resident | Tourist | t | p-Value | |||
|---|---|---|---|---|---|---|---|
| M | SD | M | SD | ||||
| Tourist rest facilities | Water source | 2.28 | 0.536 | 2.53 | 0.866 | 1.917 | 0.000 * |
| River | 2.06 | 0.240 | 2.42 | 0.809 | 3.141 | 0.000 * | |
| vegetation | 2.00 | 0.202 | 2.37 | 0.784 | 3.260 | 0.000 * | |
| Biological habitat | 1.96 | 0.198 | 2.34 | 0.736 | 3.602 | 0.000 * | |
| Steam locomotive fumes | 2.30 | 0.678 | 2.60 | 0.781 | 2.443 | 0.021 | |
| Noise pollution | 2.00 | 0.350 | 2.52 | 0.795 | 4.502 | 0.000 * | |
| Alien species threat | 1.94 | 0.373 | 2.57 | 0.923 | 4.685 | 0.000 * | |
| Natural ecosystems | Garbage placement | 1.88 | 0.521 | 2.46 | 0.770 | 5.001 | 0.000 * |
| Tourist transportation | 4.36 | 0.631 | 3.75 | 0.553 | 6.513 | 0.037 | |
| Parking space | 3.80 | 0.700 | 3.54 | 0.550 | 2.746 | 0.190 | |
| Tourist environmental destruction | 3.40 | 1.030 | 3.15 | 1.018 | 1.501 | 0.672 | |
*: p < 0.01.
© 2020 by the authors. Licensee MDPI, Basel, Switzerland. This article is an open access article distributed under the terms and conditions of the Creative Commons Attribution (CC BY) license (http://creativecommons.org/licenses/by/4.0/).
Share and Cite
MDPI and ACS Style
Hsu, C.-H.; Lin, H.-H.; Jhang, S. Sustainable Tourism Development in Protected Areas of Rivers and Water Sources: A Case Study of Jiuqu Stream in China. Sustainability 2020, 12, 5262. https://doi.org/10.3390/su12135262
AMA Style
Hsu C-H, Lin H-H, Jhang S. Sustainable Tourism Development in Protected Areas of Rivers and Water Sources: A Case Study of Jiuqu Stream in China. Sustainability. 2020; 12(13):5262. https://doi.org/10.3390/su12135262
Chicago/Turabian StyleHsu, Chin-Hsien, Hsiao-Hsien Lin, and Shangwun Jhang. 2020. "Sustainable Tourism Development in Protected Areas of Rivers and Water Sources: A Case Study of Jiuqu Stream in China" Sustainability 12, no. 13: 5262. https://doi.org/10.3390/su12135262
Note that from the first issue of 2016, this journal uses article numbers instead of page numbers. See further details here.