Structural Properties of the Static Armor during Formation and Reestablishment in Gravel-Bed Rivers

State Key Laboratory of Hydraulics and Mountain River Engineering, Sichuan University, Chengdu 610065, China
*
Author to whom correspondence should be addressed.
Water 2020, 12(7), 1845; https://doi.org/10.3390/w12071845
Submission received: 26 April 2020
/
Revised: 4 June 2020
/
Accepted: 6 June 2020
/
Published: 28 June 2020
(This article belongs to the Special Issue Fluvial Hydraulics and Applications)
Abstract
:The formation and reestablishment of bed structural properties in the static armor layer is an important research subject. To address this issue, we conducted a series of static armor layer experiments in a laboratory flume that focused on formation and reestablishment. Through an automatic measurement system, we obtained a real-time bed load transport rate. The bed surface elevation at different flow intensities was obtained using a PTS (Photo Terrain Scanning) system. The results show that the formation and reestablishment of the bed load transport rate in the static armor layer increased from zero to its peak before decaying. The bed structure response was found to be highly dependent on the unevenness of the bed surface elevation. The bed surface elevation of a static armor layer in a laboratory flume is considered as a two-dimensional random field. In a two-dimensional random field, the changes in bed elevation are characterized using statistical parameters. Statistical parameters are evaluated from precise digital elevation models (DEMs) of bed surfaces. Experimental results provide the change of probability distribution functions (PDFs) and second-order structure functions of bed elevations between formation and reestablishment after breaking the static armor layer. By quantitatively analyzing the changes in these statistical parameters, we quantified the difference between the bed structure in the static armor layer formation and the new static armor layer formed after being broken. Thus, this finding reveals that the bed structure of the static armor layer formed by different flow intensities is different, and this difference can be quantified using statistical methods.
1. Introduction
River channels downstream from dams form static armor layers caused by clear-water wash. The armor layer protects the riverbed and is important for the stability of the river channel. However, the flood control requirements can increase flow discharge and break the armor layer, inducing bed incision as well as scour at river banks or instream structures [1,2,3,4,5]. Stable armor layers commonly occur in poorly-sorted gravel-bed rivers when the imposed bed shear stress is less than the critical shear stress needed to initiate particle motion on the bed surface [6,7,8].
A significant amount of research has been conducted on the formation of the armor layer by laboratory and field investigations [9,10,11,12,13,14,15,16]. Some scholars’ studies have attempted to investigate the breakup and reestablishment of armor layers in the field and laboratory [8,17,18]. Vericat et al. (2006) described the breakup and reestablishment of an armor layer in a large regulated river with field observations, suggesting that the magnitude of a flood controls the degree of armoring on the riverbed [8]. Orrú et al. (2016) studied armor layer breakup and reestablishment with laboratory experiments using a trimodal mixture composed of a 1 mm sand fraction and two gravel fractions (6 mm and 10 mm) [18]. There are also other factors that affect the stability of the static armor layer, such as dynamic lift, backwater, and local scour [19,20,21]. The formation and breaking processes of the static armor layer often occur in nature. Paying attention to the changes in bed stability in these processes has significance for guiding the riverbed evolution process and engineering construction.
The stability of the armor layer is closely related to the surface structure in gravel-bed rivers. At present, research on surface roughness of gravel-bed rivers is divided into three types. The first type measures the characteristic particle size of the bed’s surface layer using different methods to represent the riverbed’s roughness [22]. The second type uses the equivalent particle size to establish contact with surface roughness [23,24]. Both methods are based on the mutual difference between particles, and the influence of the bed surface structure is not considered. Therefore, the third type studies the roughness of riverbed surfaces by using statistical rules in accordance with the random field [25,26,27,28,29,30,31,32,33,34]. At present, the improvement of terrain scanning technology has made the study of gravel-bed rivers into a more elaborate research stage. Terrestrial laser scanning (TLS) is used in a large number of field trials [35,36,37,38]. The improvement of imaging technology [39,40] has also provided some convenience for the study of gravel-bed rivers. Using high-precision photographs, high-precision terrain elevation models can be generated to study the surface of gravel riverbeds.
Although some models [41,42,43] can be used to predict bed load sediment transport rates or bed shear stress, these models do not adequately consider the effects of grain hiding and bed structure. Moreover, scholarship that has analyzed the influence of bed structure has only focused on qualitative analysis, rarely quantifying it to a numerical value. Therefore, the quantification of the bed structure is of great significance in improving the predication accuracy of the sediment transport rate model. This work used a series of replicated flume experiments to determine the change in bed surface structure in the static armor layer’s formation and reestablishment. The main objective was to quantify the role of the bed structure in the formation and reestablishment of the static armor layer by using mathematical tools. This work considered the bed surface elevation as a two-dimensional random field. Then, we analyzed the differences between formation and establishment of static armor layer via statistical parameters (probability distribution functions, PDFs) and a two-order structure function to explore a mathematical indicator that can quantify the difference.
2. Materials and Methods
2.1. Experimental Setup
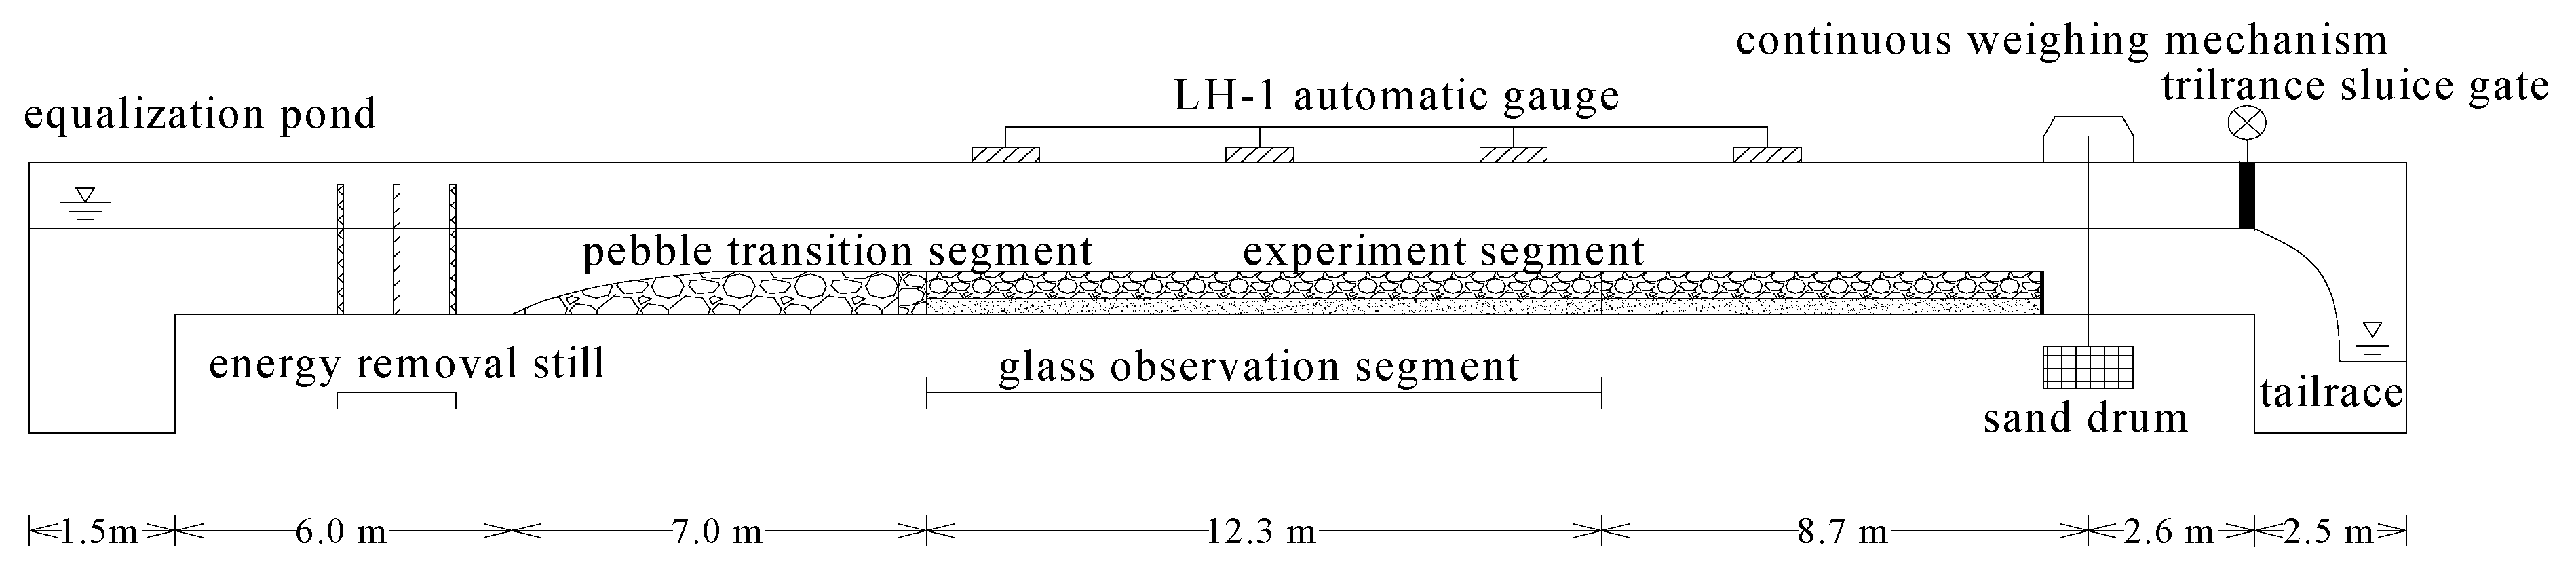
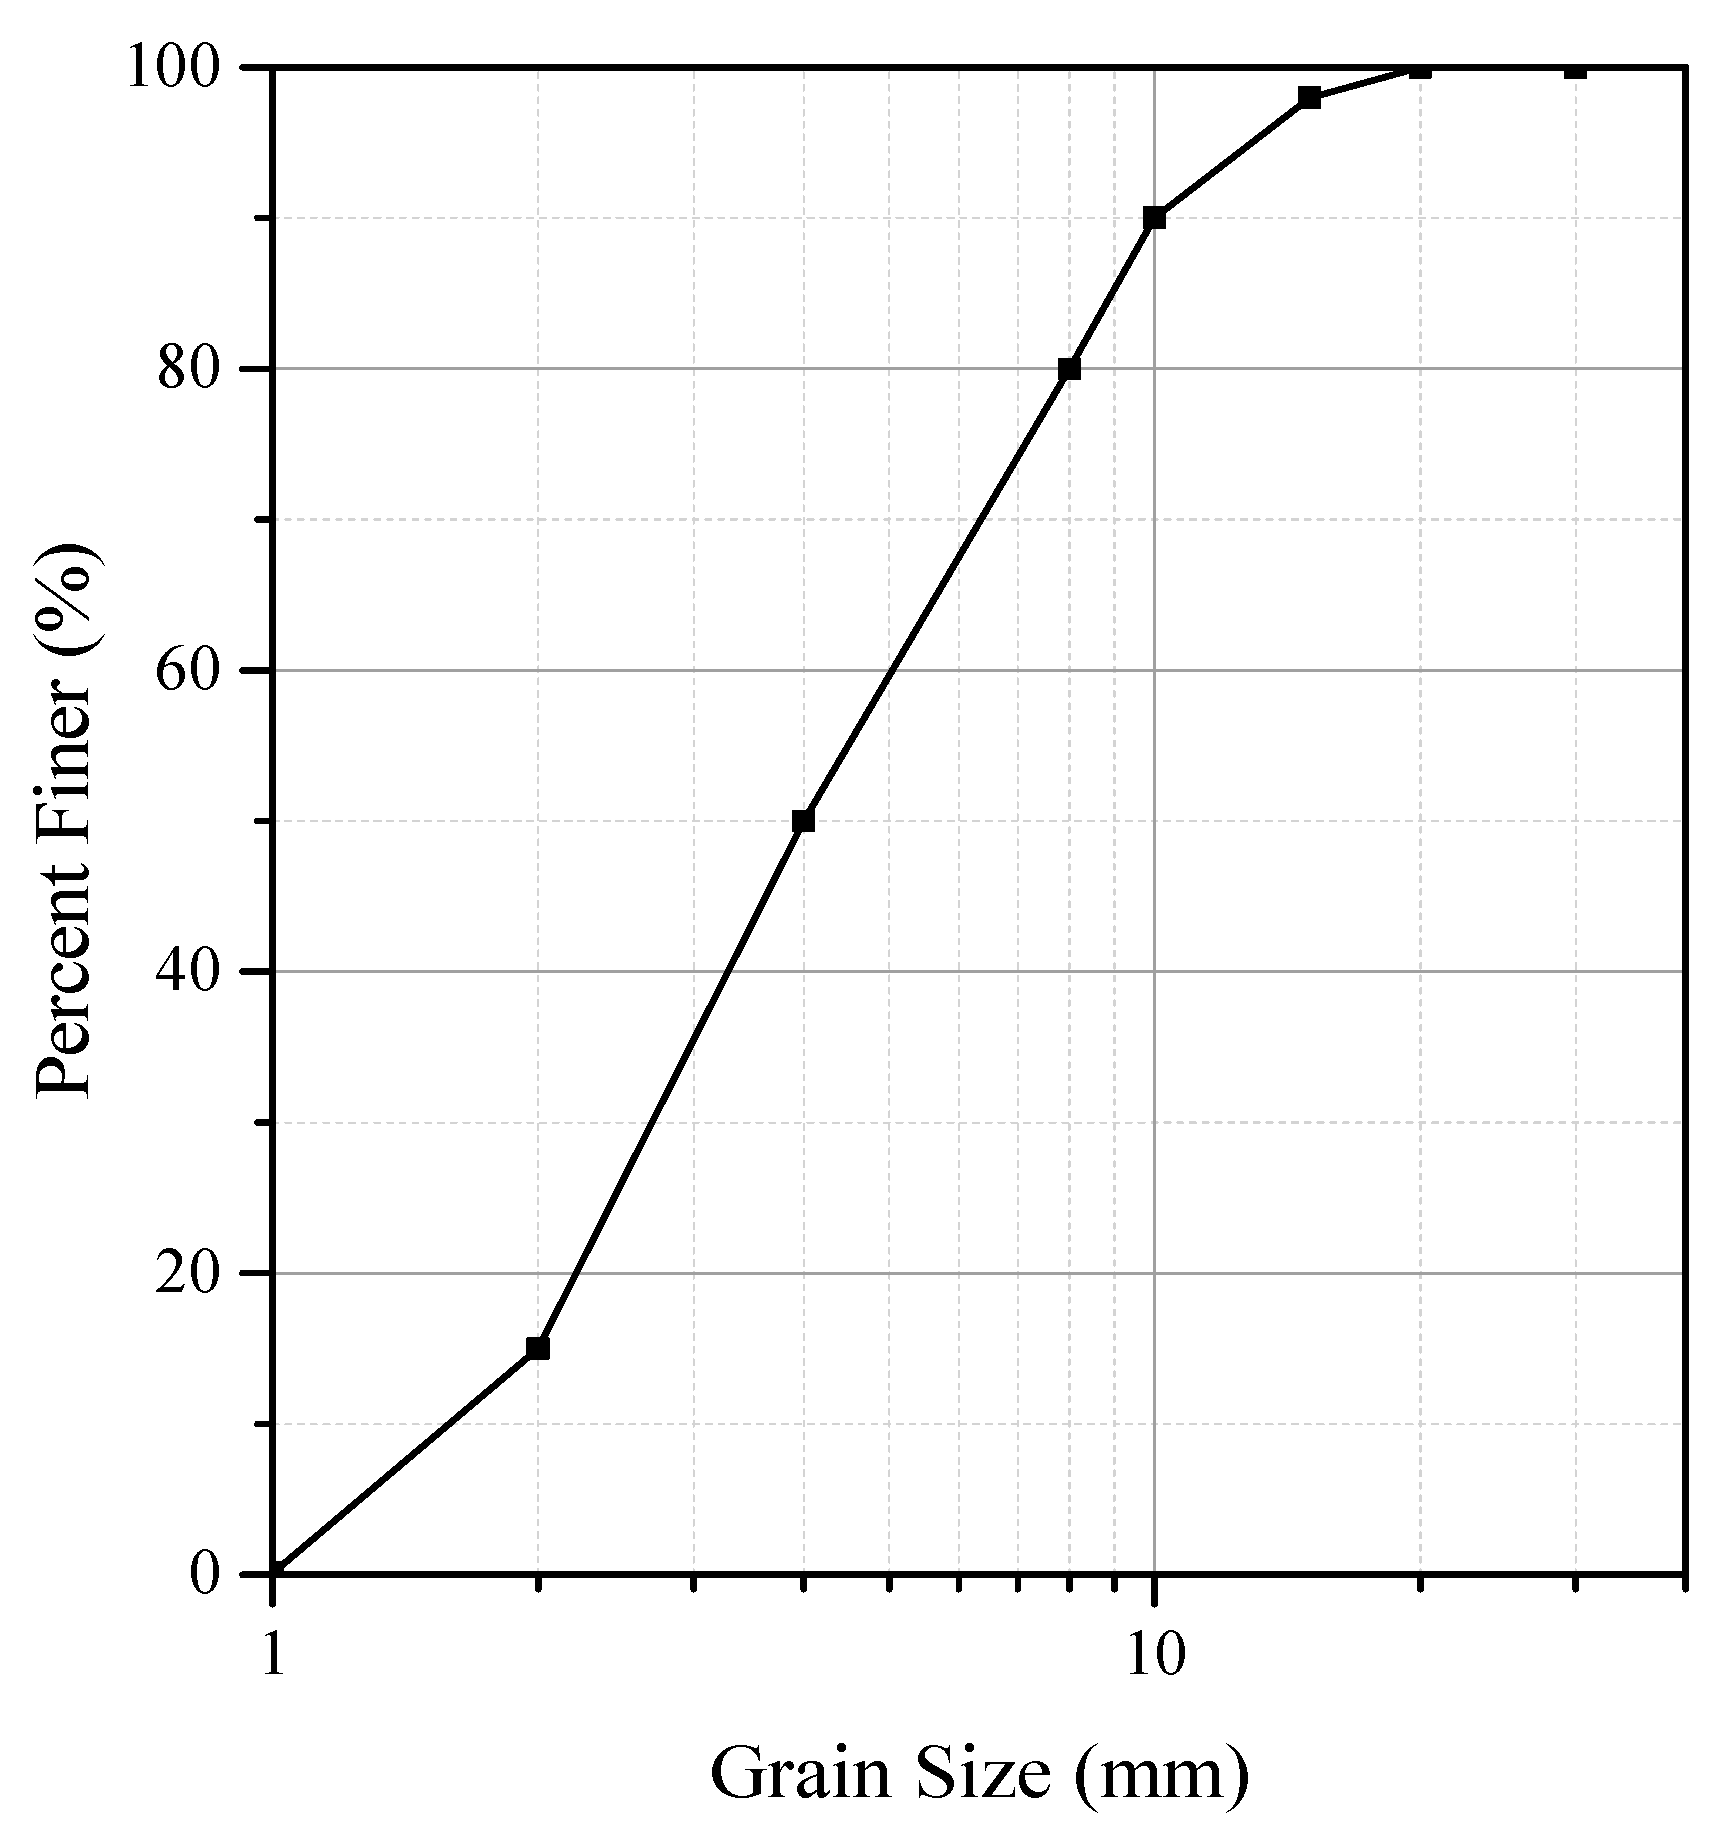
Experiments were conducted in a 37 m long, 1 m wide, and 0.6 m deep flume (Figure 1) at the State Key Laboratory of Hydraulics and Mountain River Engineering, Sichuan University, China. The actual effective length of the flume was 21 m, with a 12.3 m glass section in the middle of the flume. The rest of the flume was concrete. At the flume starting point, the bed was immobile for the first 7 m downstream and was divided into two parts. The first part was a 6.5 m long gravel transition segment with grain sizes between 20 mm and 25 mm. The other part was 0.5 m long with grain sizes of approximately 15–20 mm at the front of the flume. A layer of bed material (15 cm deep) was placed along the flume to serve as an initial bed material mixture. The flume bed material was composed of a non-uniform sediment with a median grain size (D50 = 4 mm) and a distribution truncated at 1 and 16 mm (Figure 2) (σg =1.98; σg is the standard deviation, (D84/D16)0.5 and D84 = 8 mm).
The experiments were carried out under conditions of clear-water washing. Then, a steady flow discharge continued for a period of at least 24 h until a static armor layer was formed. Venditti’s criterion argues that when the bed load transport rate decreases to 3%–6% of the peak value, the static armor layer is formed [44]. Four different initial flows formed four stable static armor layers and increased the flow intensity to 1.2 times the flow intensity when the armor layer was initially formed. This ensured that the static armor layer was completely broken. In each case, the initial slope and the bed surface grain size distribution were the same. The experimental runs differed in the discharge only (the flow intensity used the riverbed shear stress τ to characterize flow intensity). Table 1 summarizes the hydraulic conditions for each set of the experiments.
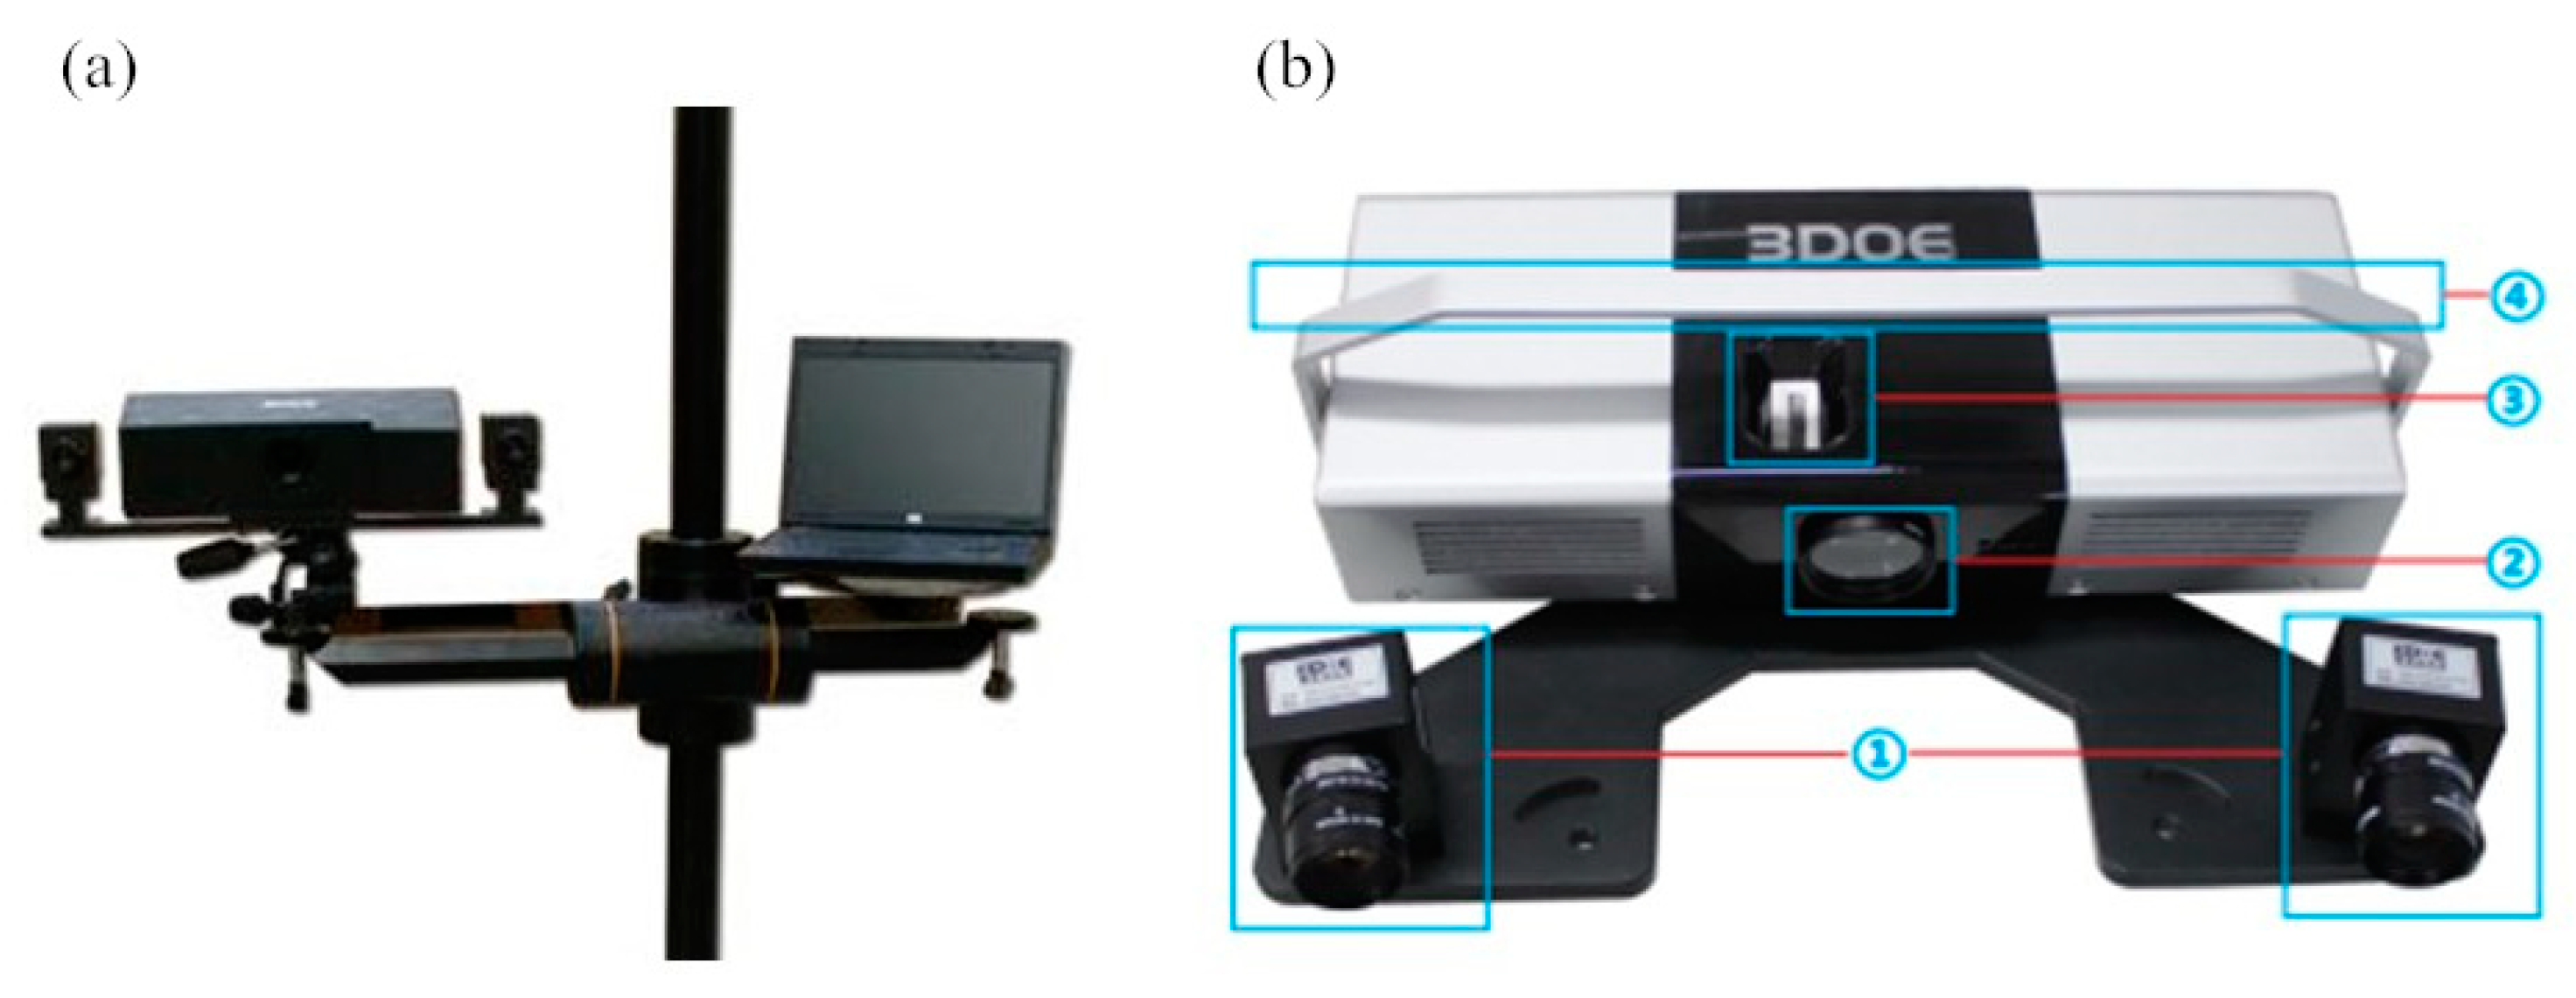
The upstream water supply was controlled by a water pump measured with a rectangular sharp-crested weir. The downstream water level was controlled with a tailgate located at the flume’s downstream end. No sediment was supplied from upstream during the experiments. At the flume’s downstream end, the transported bed load was monitored with a continuous weighing mechanism that captured the sediment exiting the flume in a basket. In the end, the flume was suspended from a load cell that recorded the weight of collected materials at 1 s intervals. The water surface elevation was monitored using four automatic gauges (Model LH-1), which each had a hammer at one end. Point measurement of the water level was achieved using a water level measurement every 1 s. The bed surface topography was monitored using a PTS series 3D scanning system (Figure 3). The 3D scanner used structured light scanning technology, which has a short scanning time, high data quality, and high density. The measurement results were output to conventional CAD/CAM (Computer Aided Design/ Computer Aided Manufacturing)software to generate digital models and CNC (Computerized Numerical Control) processing codes. The bed elevation was measured every 1 m along the longitudinal direction of the flume. The scanning accuracy of this instrument was 0.02–0.05 mm. The single bed scanning area was 60 cm × 60 cm and there were about scanning points about 300,000. The digital elevation models (DEMs) used on the riverbed surface were obtained using these point clouds. At the end of each run, we sampled and sieved the sediment particles on the bed surface at 17 m and 21 m from the flume’s starting point. First, we used red paint to spray a 20 cm × 20 cm square area on the target area, and then used tweezers and a brush to carefully peel off the bed surface with red marks on the bed. Lastly, we dried and sieved the sediment to obtain the grain-size distribution of the bed surface.
Run 1-0 was purely for degradation. The bed load transport rate rapidly increased to the peak and decayed until the bed load transport rate value reached zero. Eventually, the bed formed a stable static armor layer. Run 1-1 was the stage in which the armor layer was completely broken. At this time, the bed load transport rate restarted from zero and reached its peak value before beginning to decay. Run 1-0 and Run 1-1 formed a complete formation and destruction process within the static armor layer. In this complete cycle, the bed load sediment transport rate underwent a process of first increasing to the peak, decreasing to zero, and increasing again to the peak (not equal to the previous peak) before decreasing. Figure 4a shows the bed load transport rate of Run 1. The figure shows that when the flow intensity (Q = 68.7 L/s) increased to 1.2 times the initial flow intensity (Q = 50 L/s), the maximum bed load transport rate rapidly increased and the static armor layer was broken. After that, we used a new flow intensity (Q = 67.8 L/s) to form a new static armor layer, then used 1.2 times the previous flow intensity (Q = 88 L/s) to destroy it, as shown in Figure 4b (Run 2). Figure 4c,d shows the change of the bed load transport rate with time in Run 3 and Run 4. The bed load transport process in Runs 3 and 4 was similar to that of Runs 1 and 2. Four sets of experiments used different initial flow discharges to form four different static armor layers, which were then increased by 1.2 times the corresponding flow intensity of the armor layer to ensure complete destruction of the static armor layer.
2.2. Analytical Methods
As a first step in our analysis, the detrended DEMs were used to estimate probability distribution functions (PDFs) by first removing the mean bed elevations and then building smoothed histograms using 100 bins. The second step of our investigation of surface structure was the evaluation of structure functions. The second-order structure function (slao called semivariogram) is a unique tool for statistics [25,26,27,28,29,30,31,32,33,34]. It describes both the structure and randomness of regionalized variables. When Δx or Δy exceeded a certain value, ψ, the value of the second-order structure function, did not increase. This value of z(xi) took xi as the center and the range ψ as the radius. There was a correlation between any two directions—z(xi + nδx) or z(yi + mδx). The surface of the gravel riverbed was closely related to the correlation of different positions on the riverbed due to the unevenness between the particles and formation of various arrangements (such as cluster structure, line structure, triangle structure, etc.) The second-order structural function of riverbed elevation can be used to analyze the changes in the bed structure on the gravel-bed surface.
For this purpose, we applied the generalized second-order structure function:
where and are the spatial lags (maximum set at ±300 mm); and are the sampling intervals (both 1 mm) in the longitudinal and transverse directions, respectively; and n = 1,2,3…N and m = 1,2,3…M. N and M are the number of samples (300 and 300, respectively) in the same two directions. Low values of D(Δx, Δy)/2σz2 indicate high levels of correlation between bed levels with a longitudinal and transverse lag in Δx and Δy. As the value of D(Δx, Δy)/2σz2 increased, the degree of correlation decreased. When D(Δx, Δy)/2σz2 reached 1, the bed elevation had no correlation at such lags. It can be reasonably assumed that the bed topography was randomly organized. D(Δx, Δy)/2σz2 larger than 1 were associated with a negative correlation [30]. The second-order structure function of a globally homogeneous random field has the following relationship with the correlation function :
where σ is standard deviation of bed elevations. The D values are normalized with 2σz2 and plotted as a surface to show the variation in the structure function with regard to the sampling lags in different directions.
3. Results
3.1. Probability Distribution Functions of the Bed Surface Elevation
At present, there are many parameters that can indicate, to a certain extent, the bed structure. In this section, we selected the probability distribution functions (PDFs) of the bed elevation to analyze changes in the bed structure. The DEMs were used to estimate PDFs by first removing the mean bed elevations and then building smoothed histograms using 100 bins. There was an obvious difference in bed elevation PDFs between the armor layer formation and reestablishment after breaking the static armor layer. The surface elevation distribution can provide useful information about surface structure.
Figure 5 shows the probability distribution functions of the bed elevation at different locations in the four sets of experiments (x = 17# and 21#, where x is the distance from the starting point of the flume). It can be seen that in each experiment, the initial physically-screened bed produced PDFs, which were relatively narrow and symmetrical. This is representative of a large number of elevation data points that were very close to the mean value. When the experiment was pure degradation (armor layer formation process), the movement intensity of the small particles on the riverbed was greater than the large ones. With time, the bed load transport rate gradually decreased to zero and a stable static armor layer was formed. In this process, the sediment particles left on the surface of the riverbed were rearranged to form a new bed surface structure and the riverbed’s surface elevation also changed. Therein, the riverbed was no longer flat, so the PDFs also changed at this time. The asymmetry also became wider, which meant that the standard deviation was getting bigger. When the flow intensity increased enough to destroy the riverbed surface’s static armor layer, the sediment particles on the riverbed were put back into motion. Therefore, the sediment transport rate once again formed a peak and decayed, causing the sediment particles to reorganize and arrange themselves until the riverbed reached a steady state. As the flow intensity increased, the interaction between particles and flow increased, and the riverbed’s sediment arrangement became more complicated. Therefore, the elevation of the riverbed changed more severely, becoming more uneven. Thus, the PDFs became even less symmetrical and the shape grew wider.
3.2. Second-Order Structure Functions of the Bed Elevation
3.2.1. Overall Change in the Second-Order Structure Function
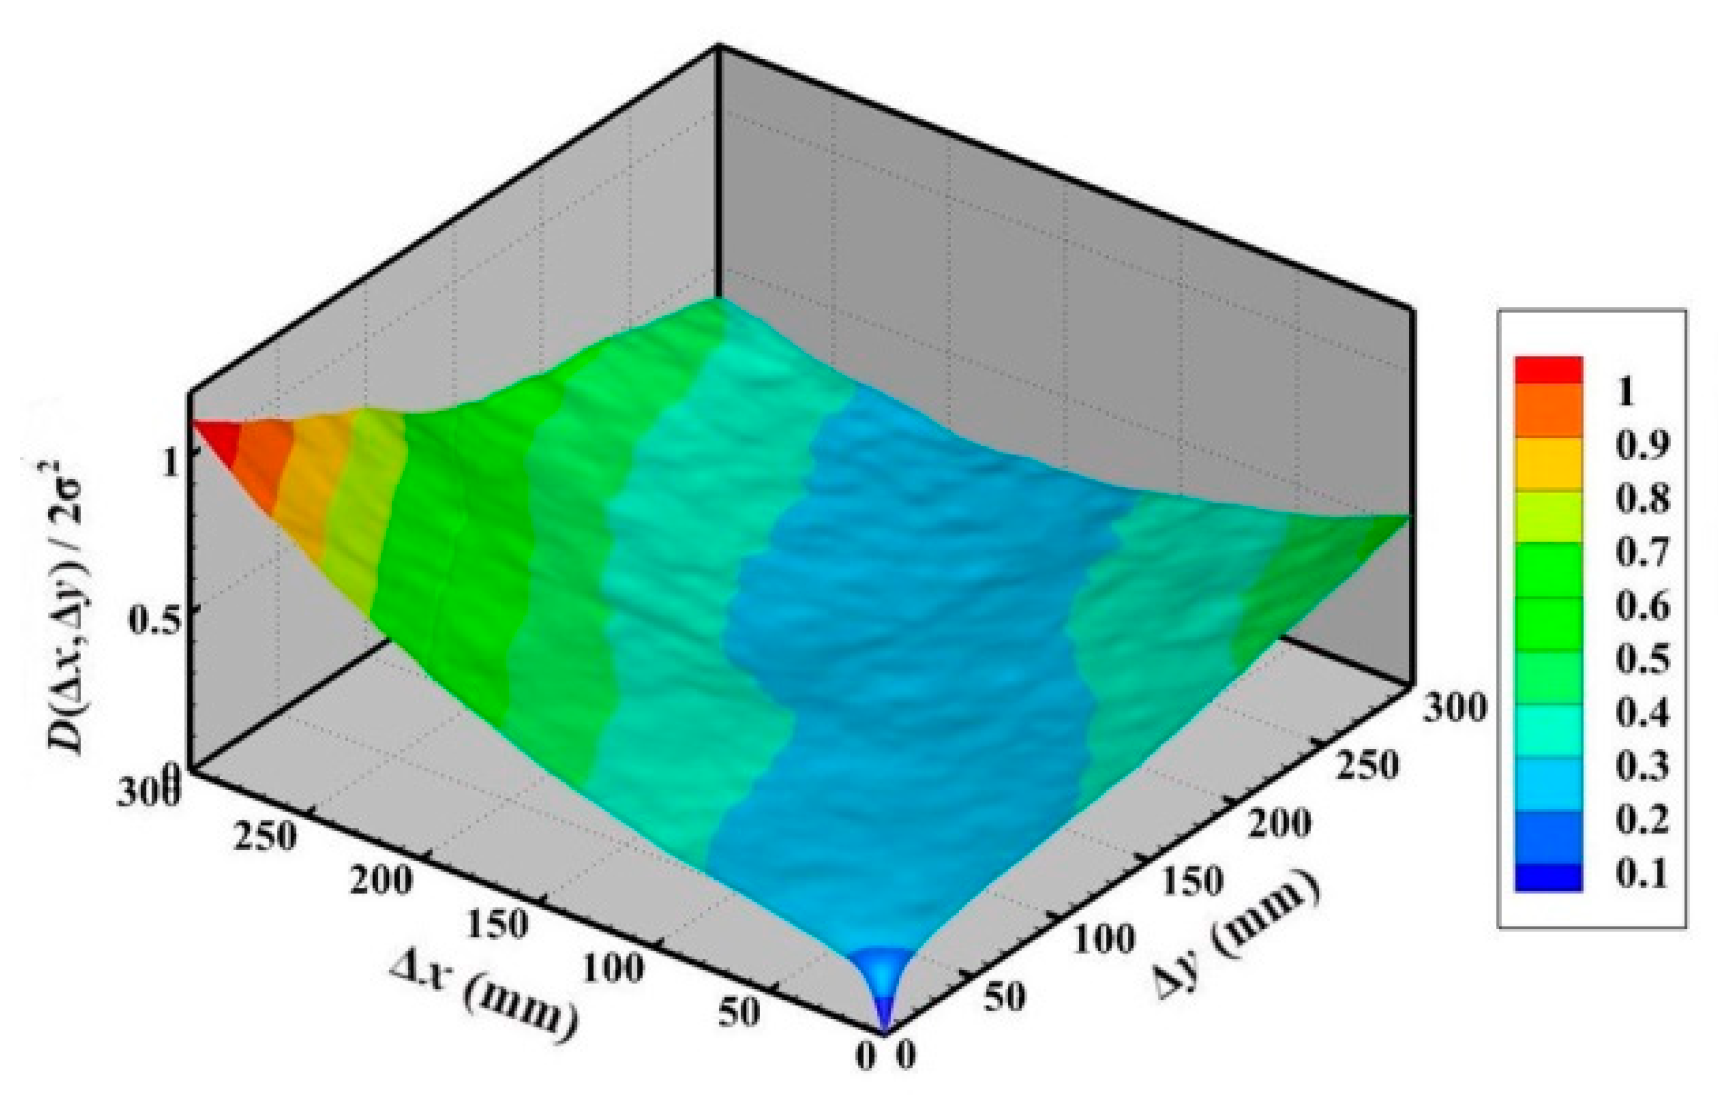
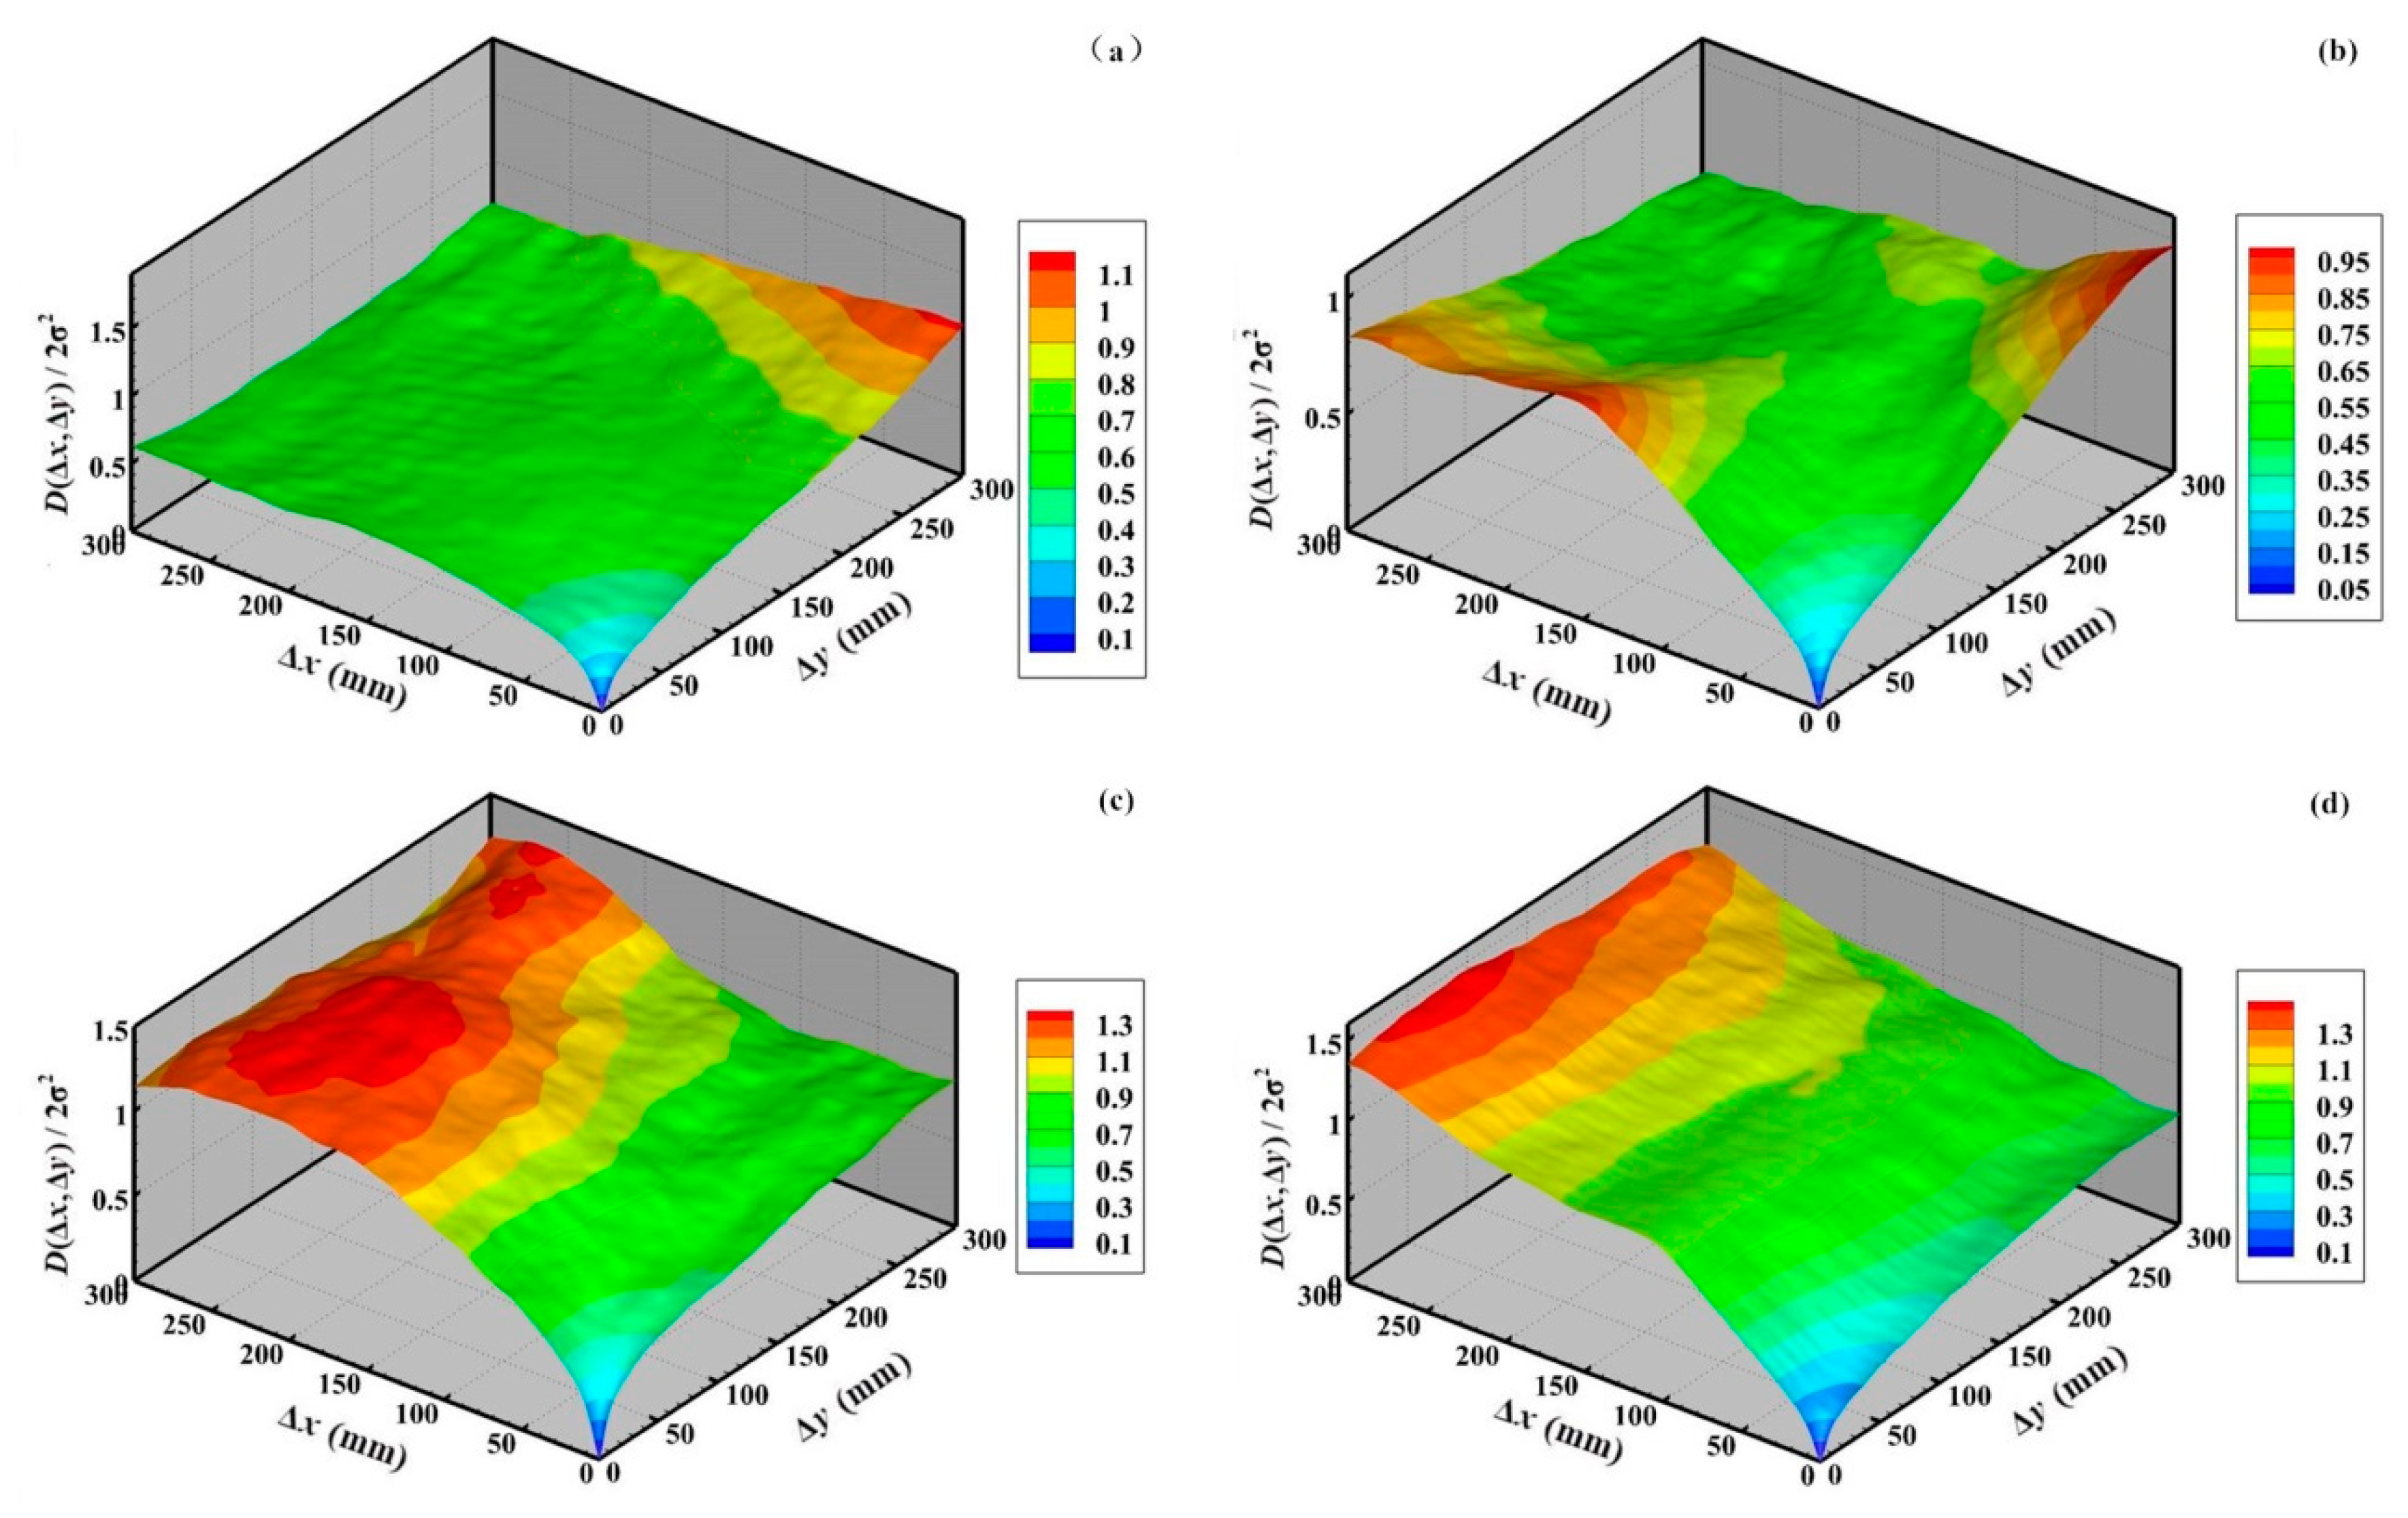
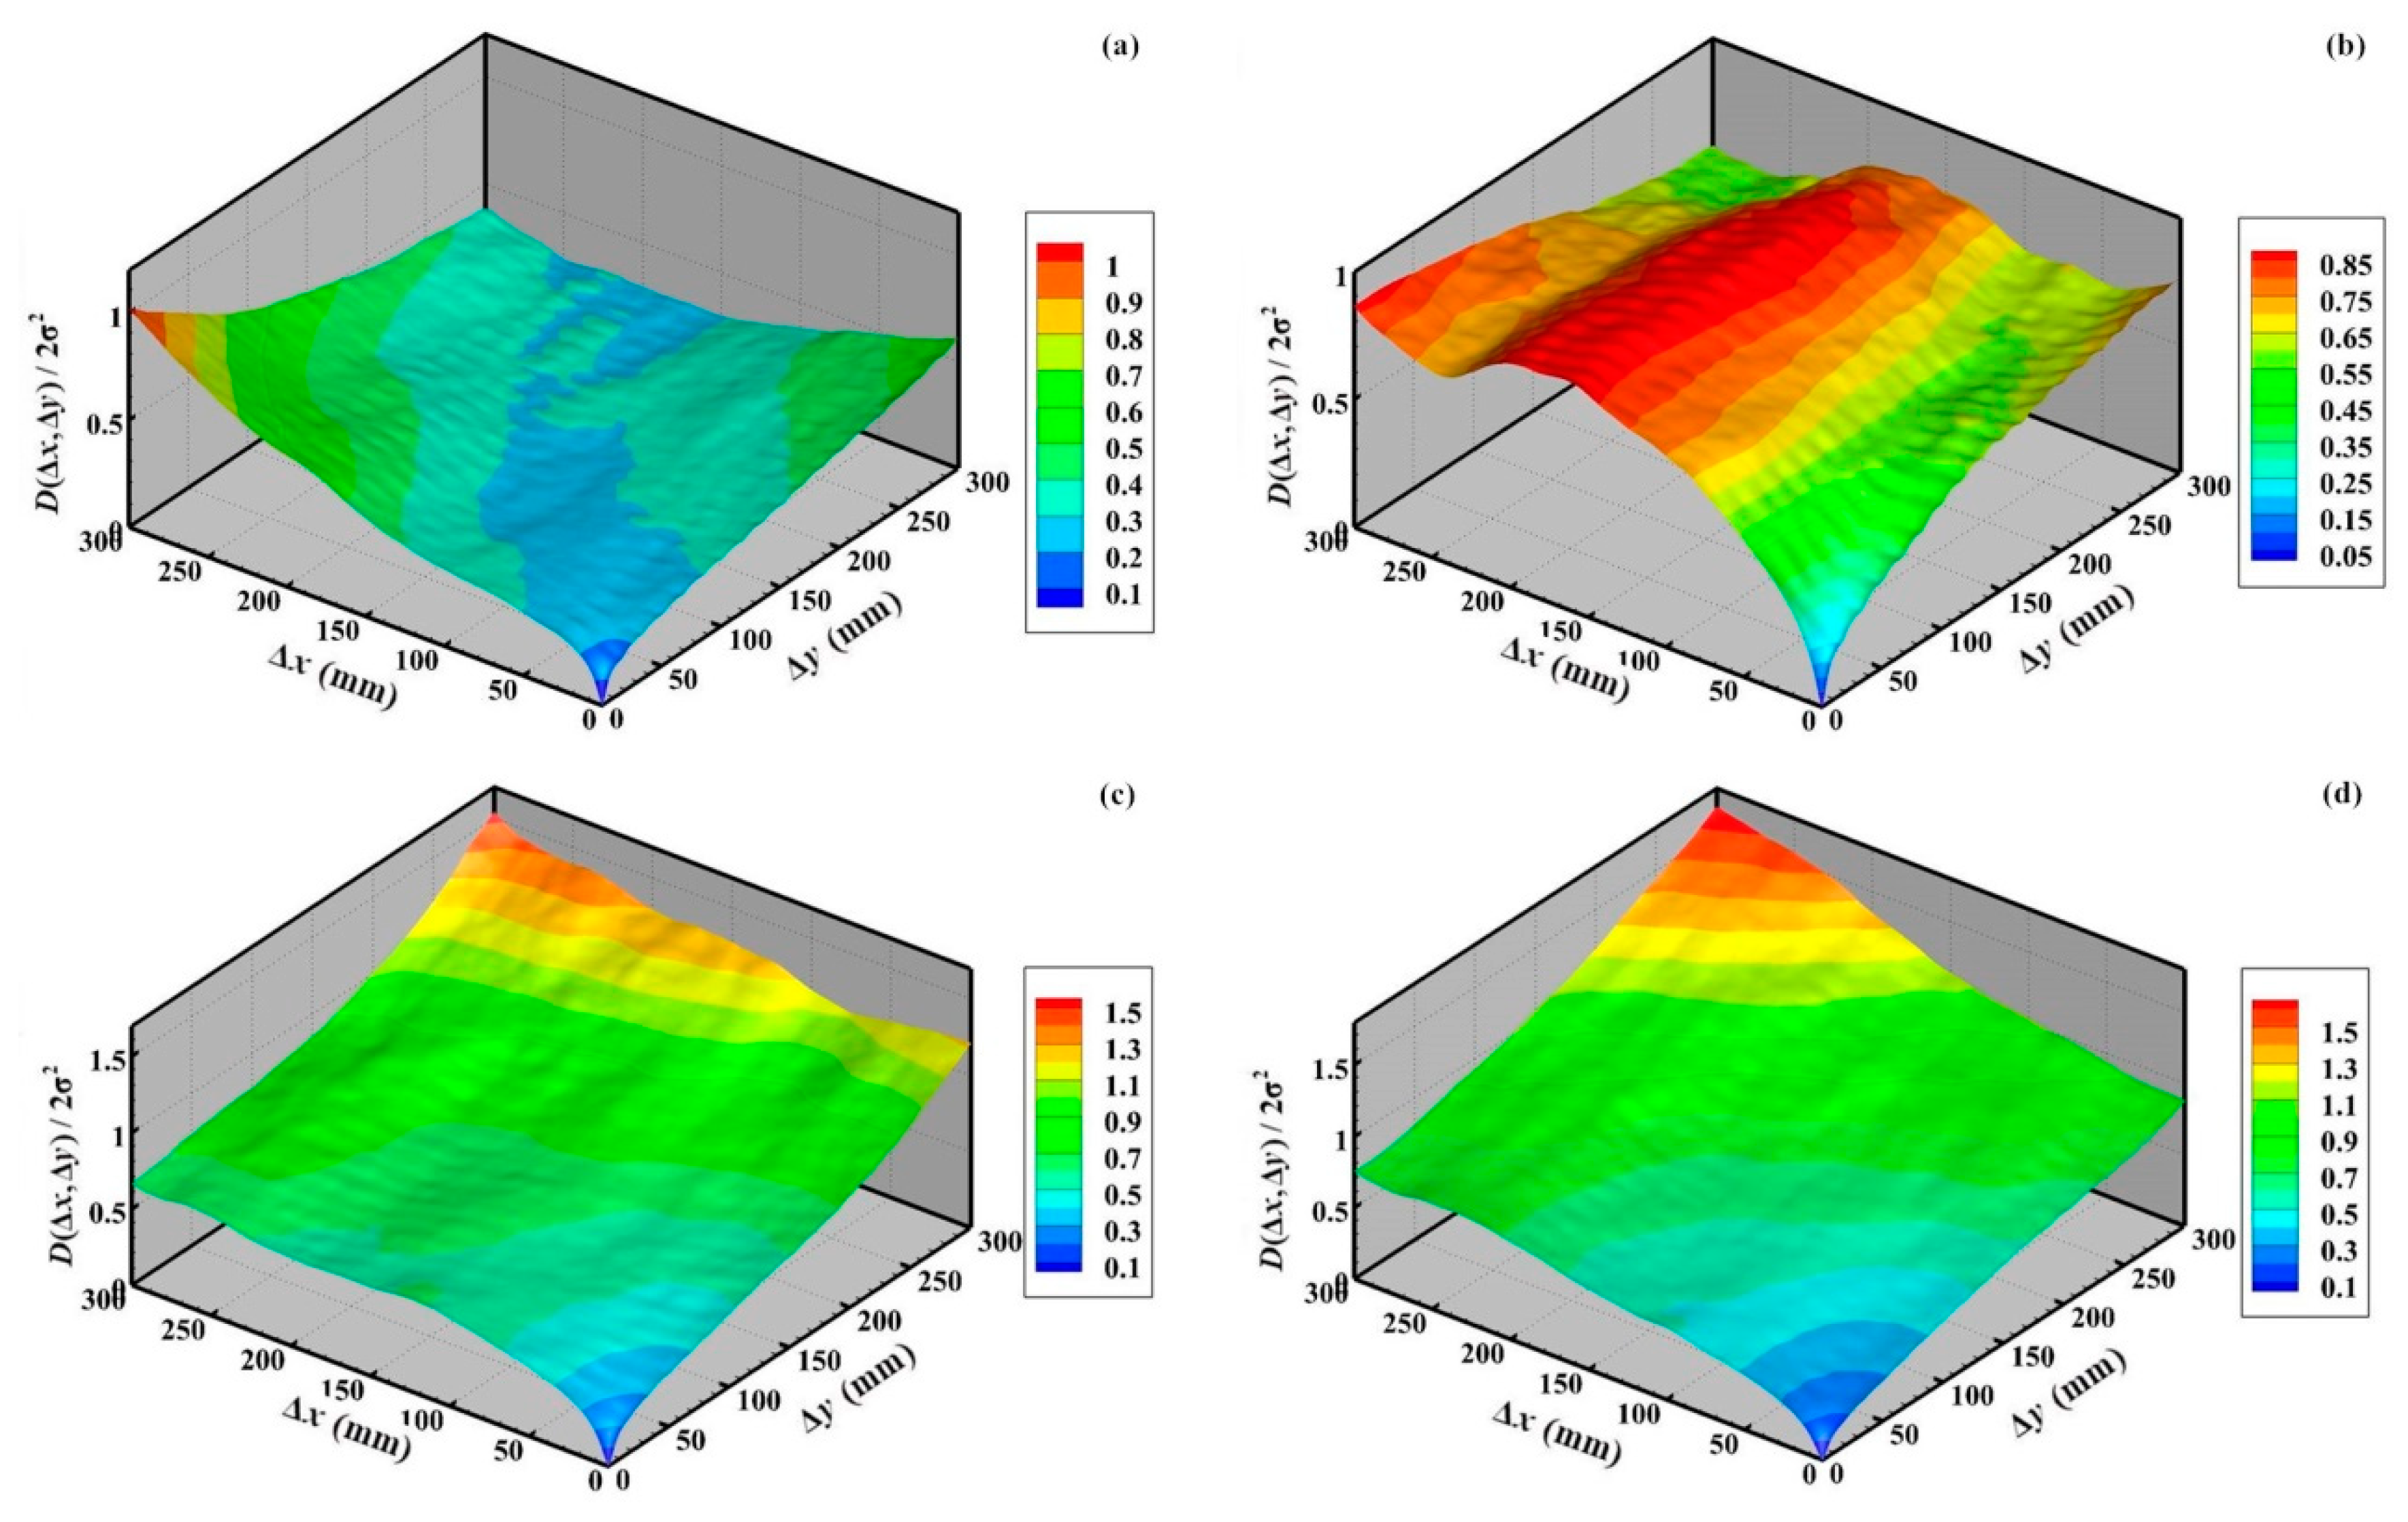
When flow conditions changed, the bed structure and values of the second-order structure functions became different. Three fundamental types (i.e., the initial bed surface, armor layer formation surface, and breakup surface) were presented at the measurement location. Figure 6, Figure 7 and Figure 8 show the second-order structure functions of the riverbed under different experiments at x = 21#. The first type was an artificially flattened original bed surface (a bed surface that has not been washed by flow is relatively smooth). The second type was the pure degradation in the upstream without sediment supply (pure degradation occurs when there is little to no sediment being supplied from upstream). The bed load transport rate dropped quickly to near zero. The third type was the bed surface that formed after the flow intensity increased and the armor layer was broken. The bed load transport rate process was similar to the second type and was also rapidly reduced to zero.
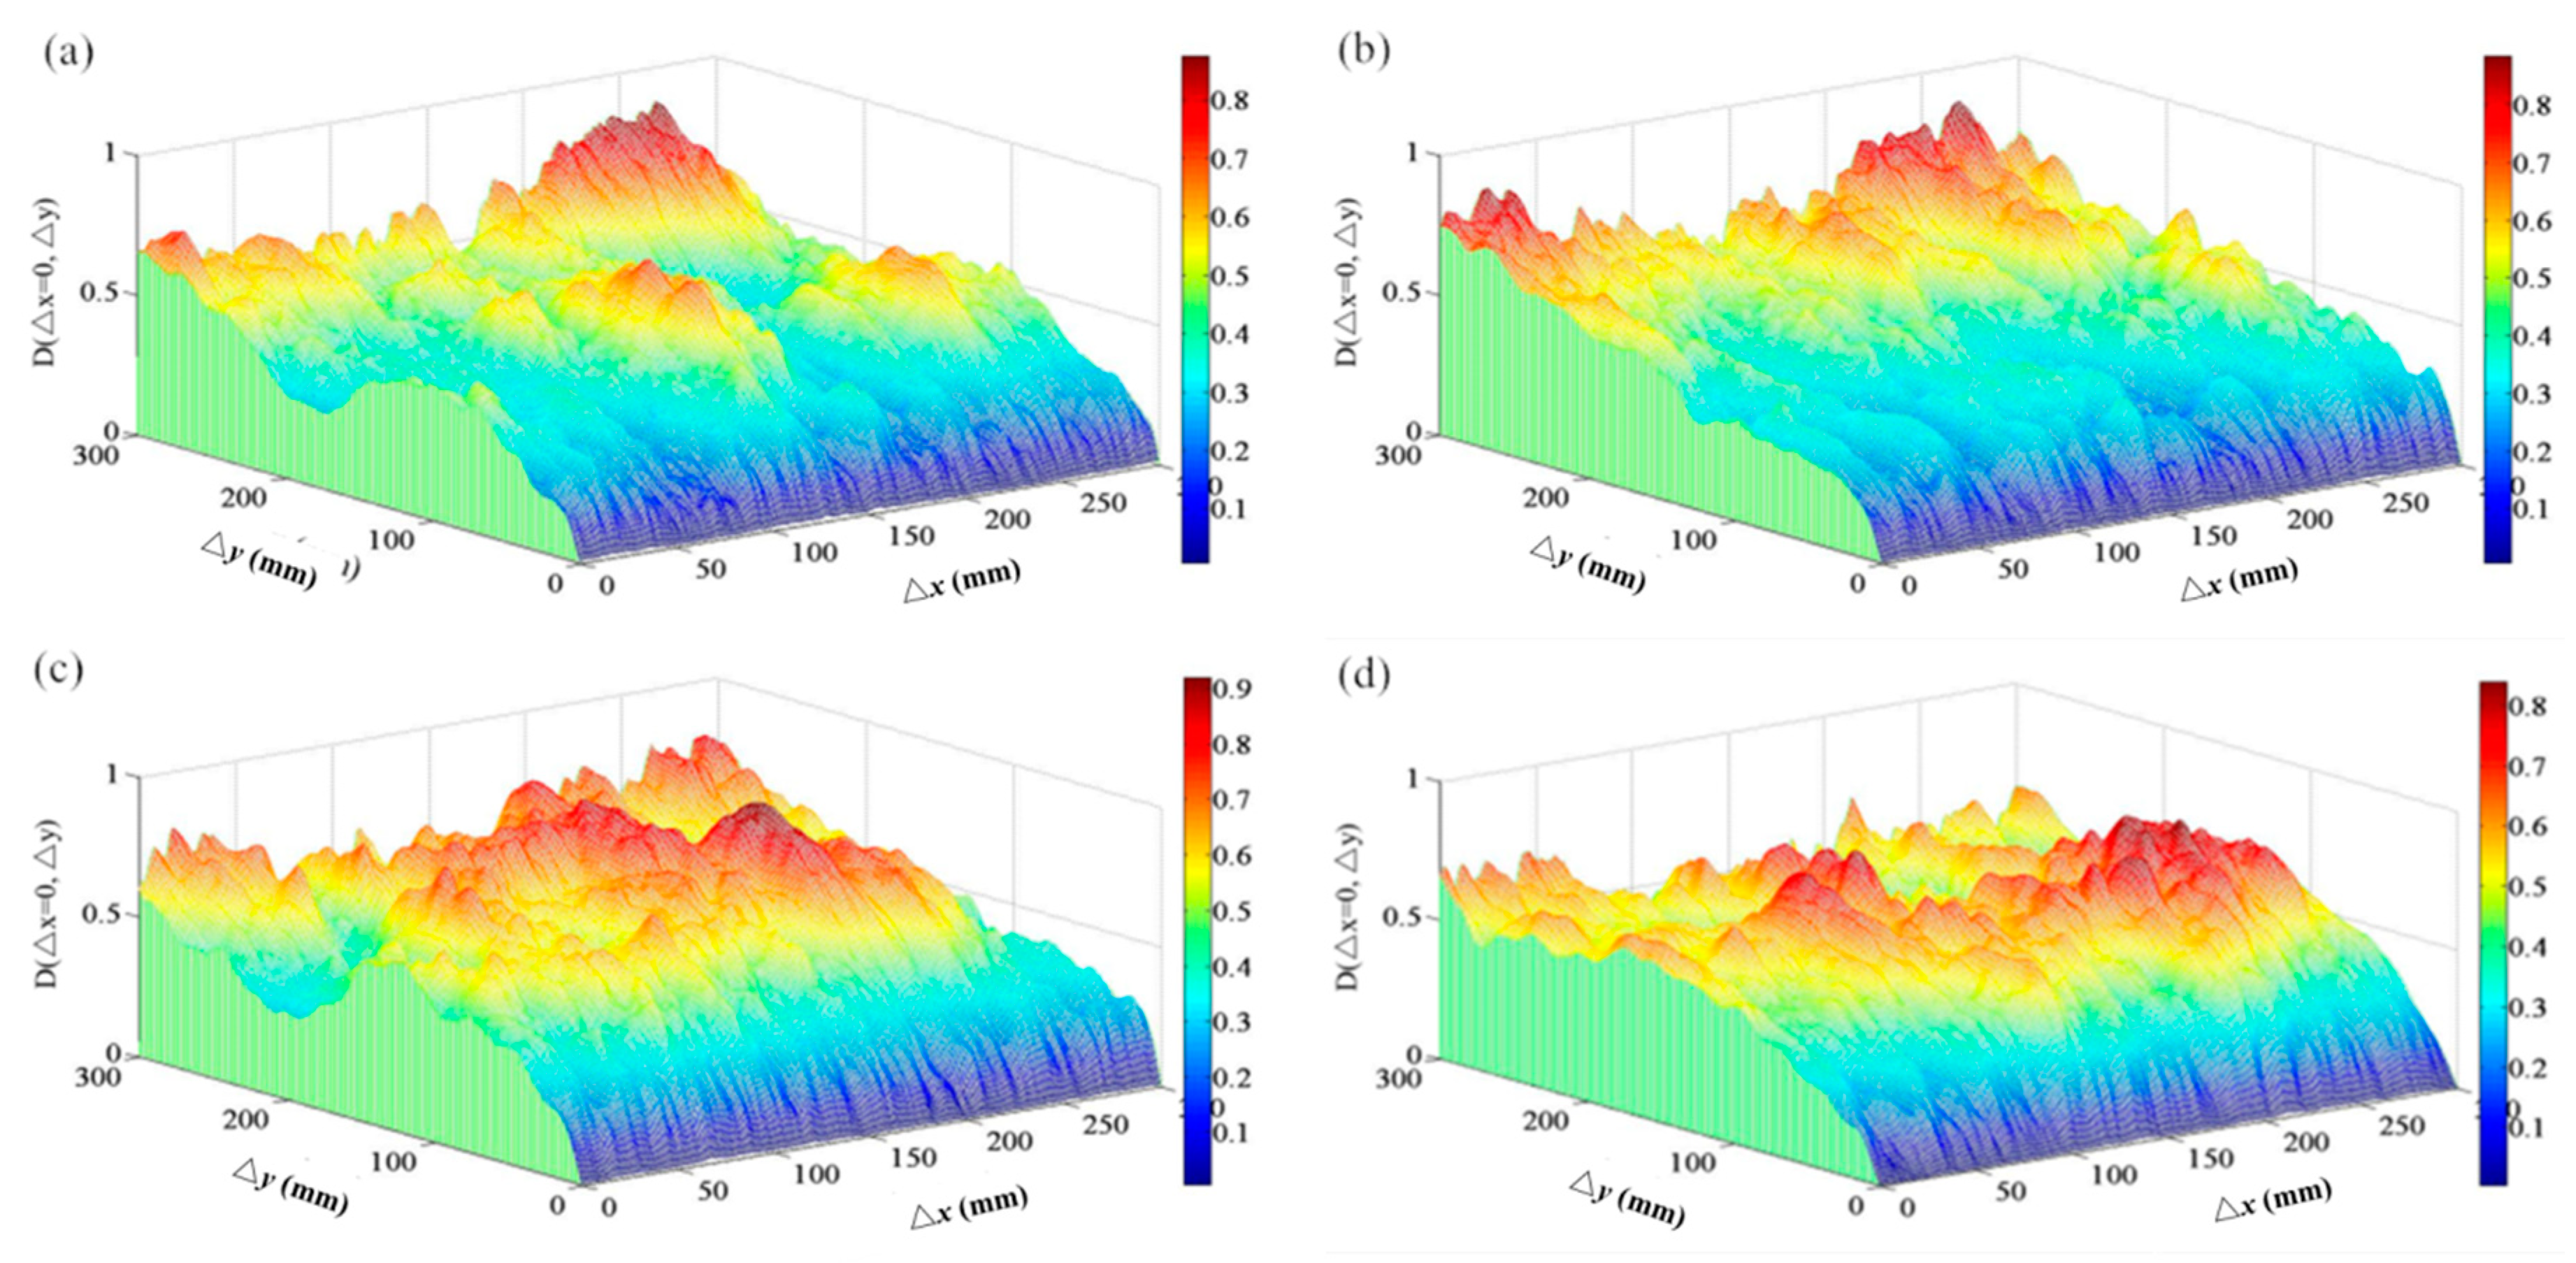
When the bed surface was not washed (Figure 6), the bed surface was relatively smooth. Whether the small or large particles were evenly scattered on the riverbed, the hidden exposure between the large and small particles was not reflected. The change in elevation at different locations on the riverbed was relatively small. The entire second-order structure function plot shows a relatively smooth shape. As Δx and Δy increased, the value of D(Δx, Δy)/2σz2 also increased. In other words, as the sampling interval increased, the interaction between the particles gradually decreased. The second type was the pure degradation in the upstream part without sediment supply (Figure 7a–d). Under the scouring of the constant flow intensity, all sizes of sediment particles were put into motion. However, due to the selection effect, the proportion of small-grain sediments was much higher than that of large-grained sediments. The proportion of large-grained sediments increased in the bed and the concealment effects of large-grained sediments on small-grained sediments were enhanced. Various forms of clusters formed between the large and small particles, and the final bed load transport rate gradually approached zero. The third type was the pure degradation of the static armor layer reestablishment (plots presented in Figure 8a–d). After the static armor layer was destroyed, the bed surface became more complicated under the action of flow. Thus, the second-order structure functions of the bed became more complicated. The D(Δx, Δy)/2σz2 value of the static armor layer after the breaking increased with Δx and Δy, the second-order structure function became more unsmooth, and the undulation grew larger.
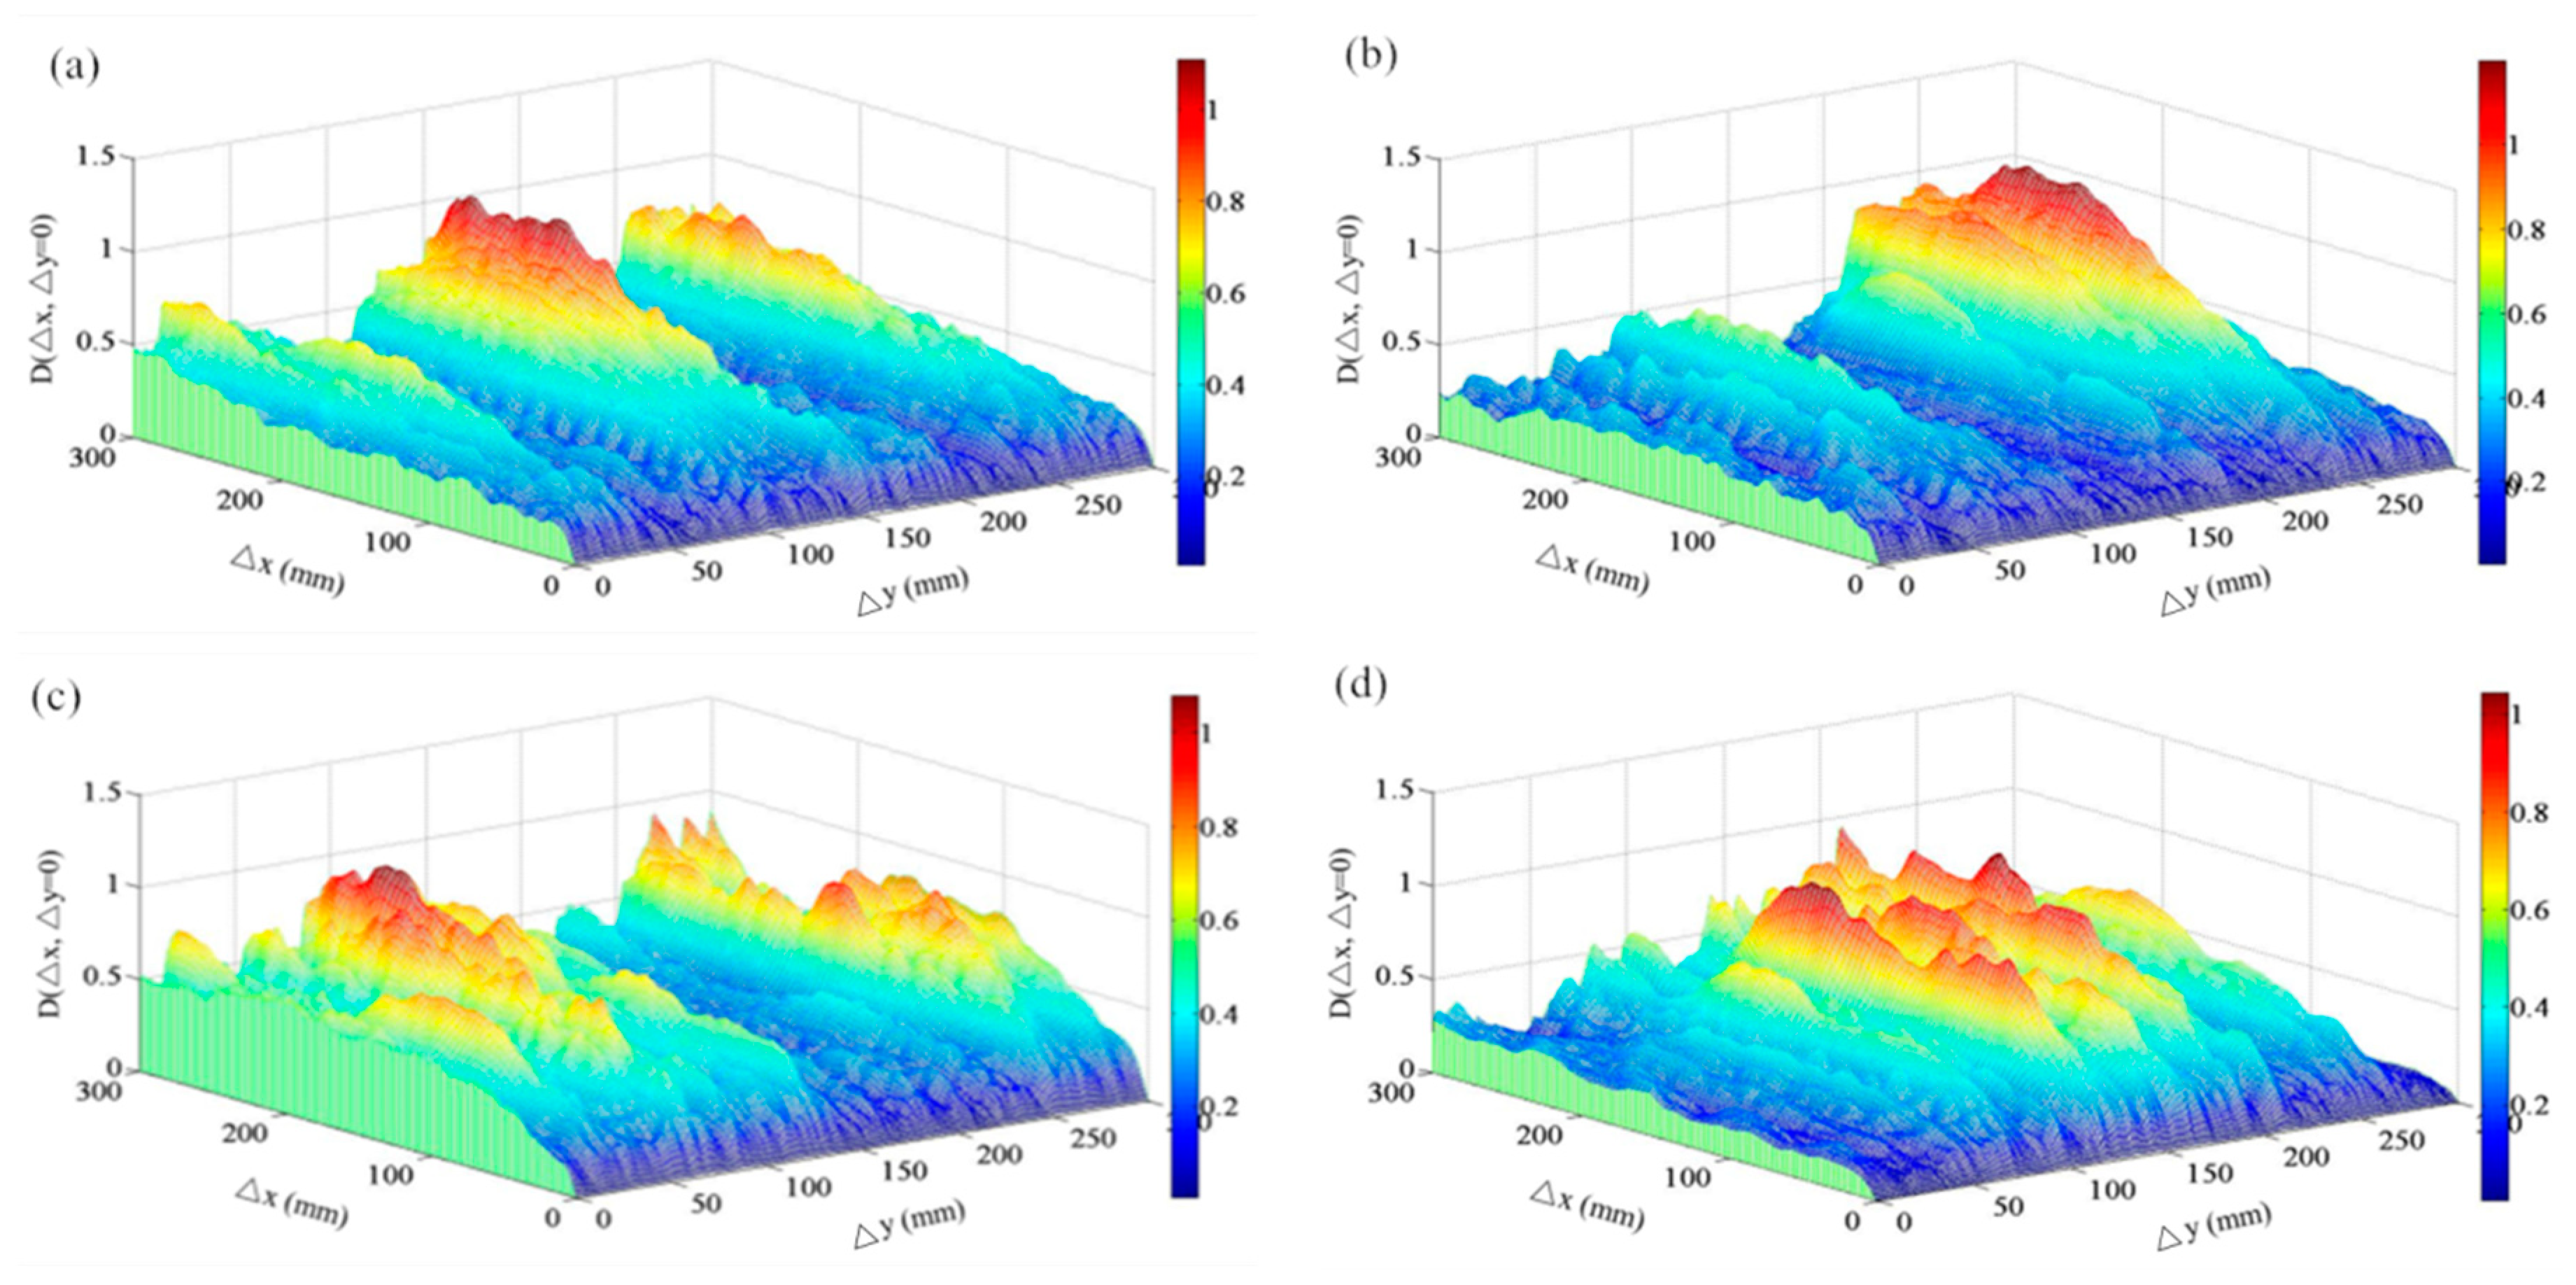
3.2.2. The Second-Order Structure Function Change Along the Longitudinal Direction
Figure 9 shows the second-order structure function of the bed elevation when the bed is in the initial state along the longitudinal direction. It shows that the value of the second-order structure function was stable in the longitudinal direction, concentrated between 0.3 and 0.4. Because the bed did not experience flow erosion, it appeared uniform in all directions. When the static armor layer formed, the second-order structure function changed greatly. In Run 3, the value of D(Δx, Δy)/2σz2 decreased in the longitudinal direction, which meant that the interaction between the particles increased. In general, after the riverbed roughened, the second-order structure function decreased in the longitudinal direction, becoming non-uniform. As the sampling interval increased, the riverbed variability increased. The reason for the decrease here was because the riverbed had a certain organizational structure, which strengthened the connection between the particles in space and the difference between them in the riverbed. Figure 10 shows the change of the second-order structure function in the longitudinal direction during the formation and reestablishment after the static armor layer was broken in Run 3 and Run 4. The flow intensity increased until it exceeded 1.2 times the intensity of the initial formation of the static armor layer and thus the second-order structure function of the riverbed had a greater change in the longitudinal direction. The value became smaller, which explains why the connection between points further increased. This also reflects why the riverbed structure gradually strengthened in the process
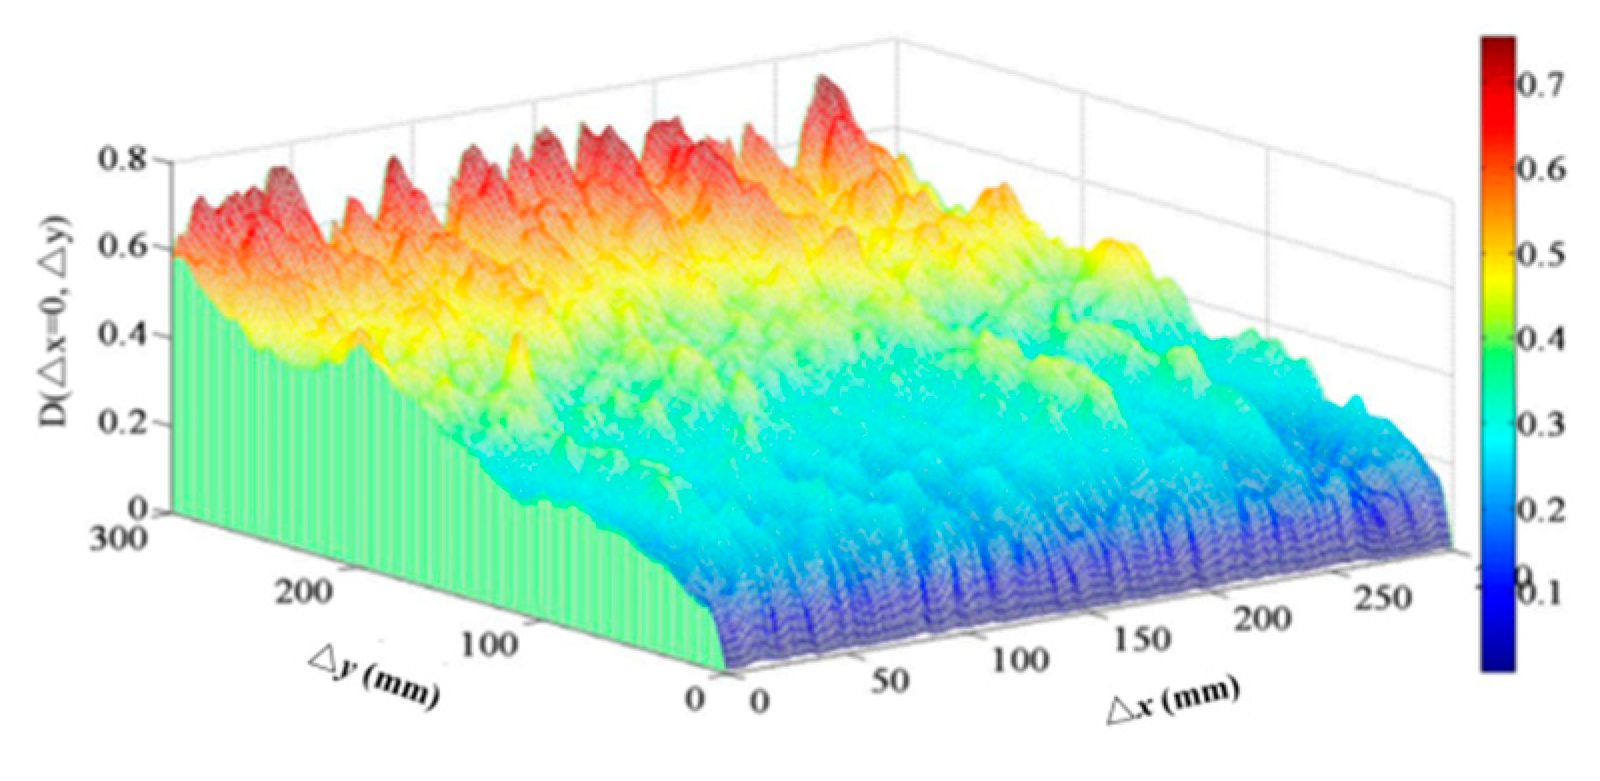
3.2.3. The Second-Order Structure Function Change along the Transverse Direction
Figure 11 shows the change in the second-order structure function of the riverbed when the bed was in initial state along the transverse direction. In the transverse direction, y, the parameter showed an upward trend with an increased sampling interval; the value was about 0.8 or less. However, when the static armor layer was formed (Figure 12), it was found that the second-order structural function of the bed elevation in the transverse direction was still not very large and the values were relatively concentrated, i.e., there was no particular difference between the sampling points of the riverbed in this direction. This is because the scouring effect of the flow was mainly reflected in the direction of the downstream flow. However, the shaping effect in the lateral direction was small. Therefore, when the flow intensity changed, the second-order structure function of the riverbed elevation changed a little in the lateral direction.
4. Discussion
We conducted a series of armoring and destructive flume experiments with no sediment supply in the upstream. The initial bed materials and slope of the run were the same, and only the flow discharge was different. Previous studies of armor formation and static armor layer destruction focused more on the reconstruction period, the physical mechanism of the destruction process, and critical instability [8,17,18]. Scholars have also studied the structural properties of mobile armors formed at different flow strengths in gravel-bed rivers [45]. However, research on the statistical characteristics of the riverbed after the formation and reconstruction of the static armor layer was lacking. We obtained the riverbed surface elevation data of the formation and destruction stages of the static armor layer through terrain scanning, and analyzed and studied the riverbed structure using statistical methods.
4.1. Bed Surface Coarsening Characteristics
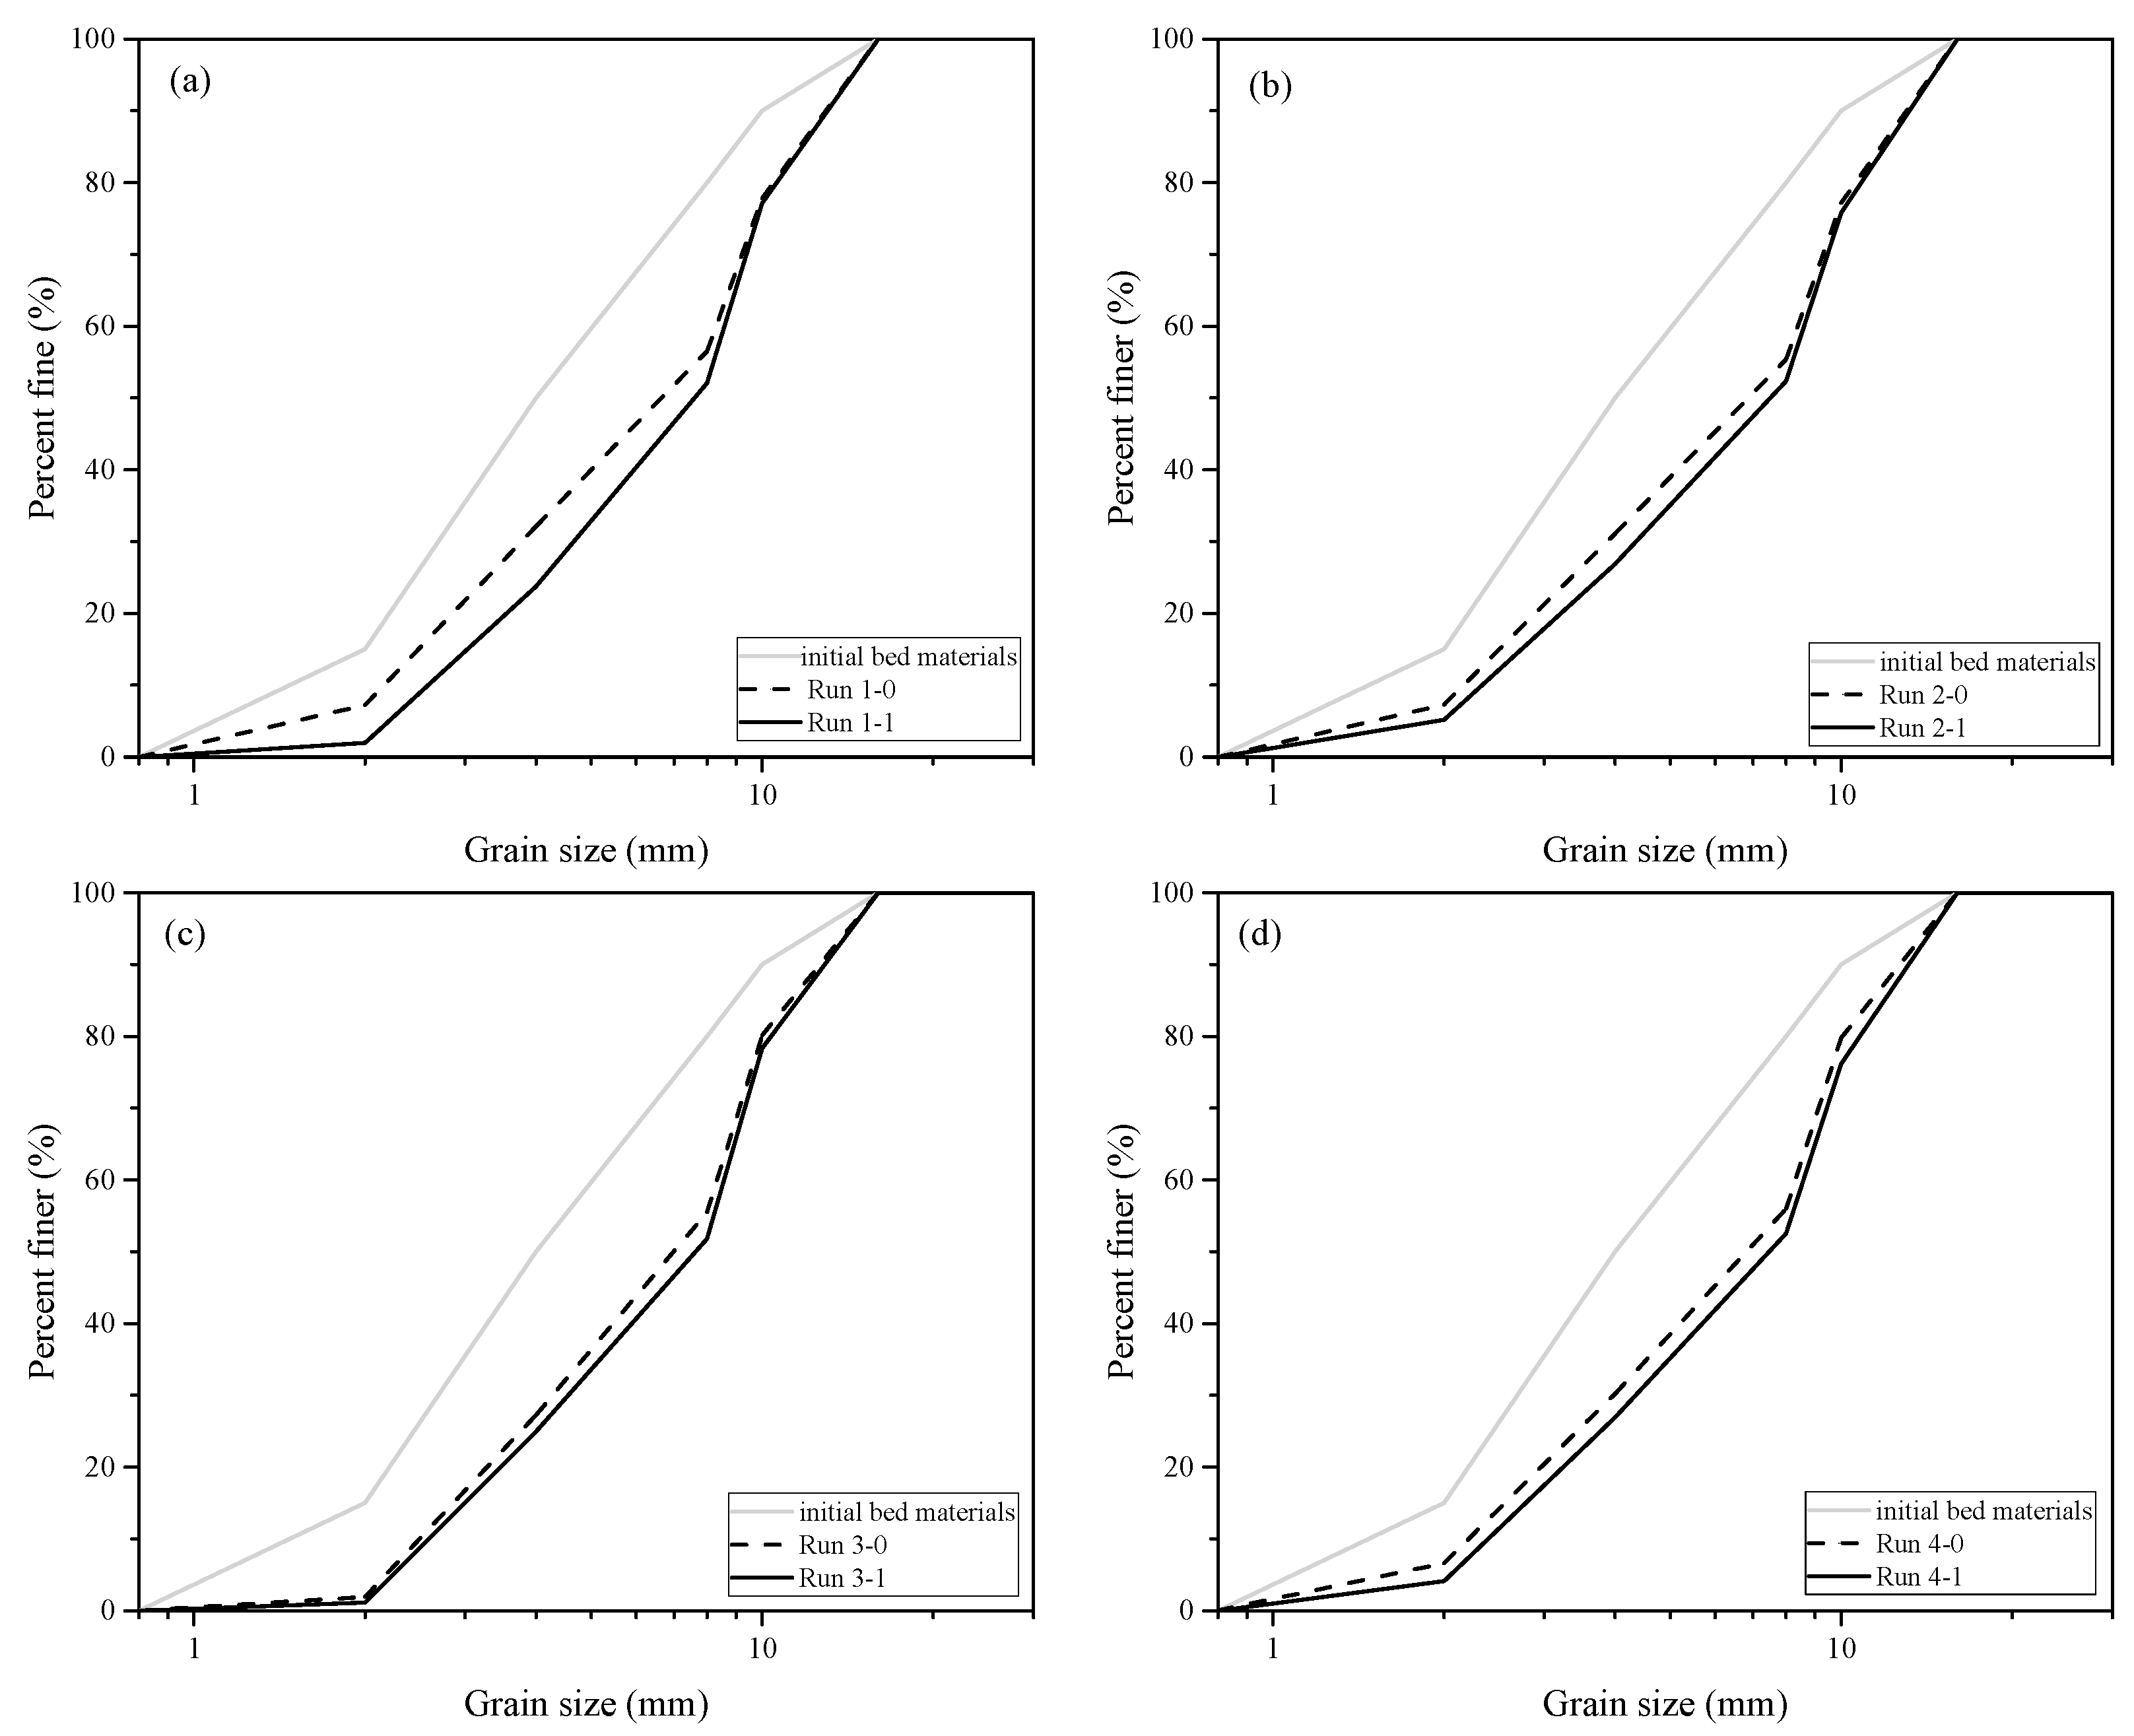
The grain size composition of the armor layer surface can intuitively reflect changes in the bed surface. Figure 13 shows the armor layer’s grain size distribution in Runs 1–4. The median particle size D50 of the initial bed materials was 4 mm and the D50 of the bed surface increased to 6.5–7 mm after the formation of the static armor layer. When the new armor layer formed after the static armor layer broke, the median particle size, D50, increased to 7.4–7.8 mm. During the formation of the static armor layer, as the flow intensity increased, the bed surface became coarser, and the riverbed became more stable. These results are closely related to the increase in the proportion of large particles in the bed surface [11]. Therefore, river roughness can be characterized by the riverbed surface’s characteristic particle size (i.e., D50 or D84), but the characteristic particle size can only represent the proportion of the riverbed particle size and cannot quantify the interactions between different particles on the riverbed [22]. It is for the above reasons that studying the arrangement and concealed exposure of different sediment particles on the riverbed is an important part of understanding the static armor layer’s formation and destruction processes [28,33,35].
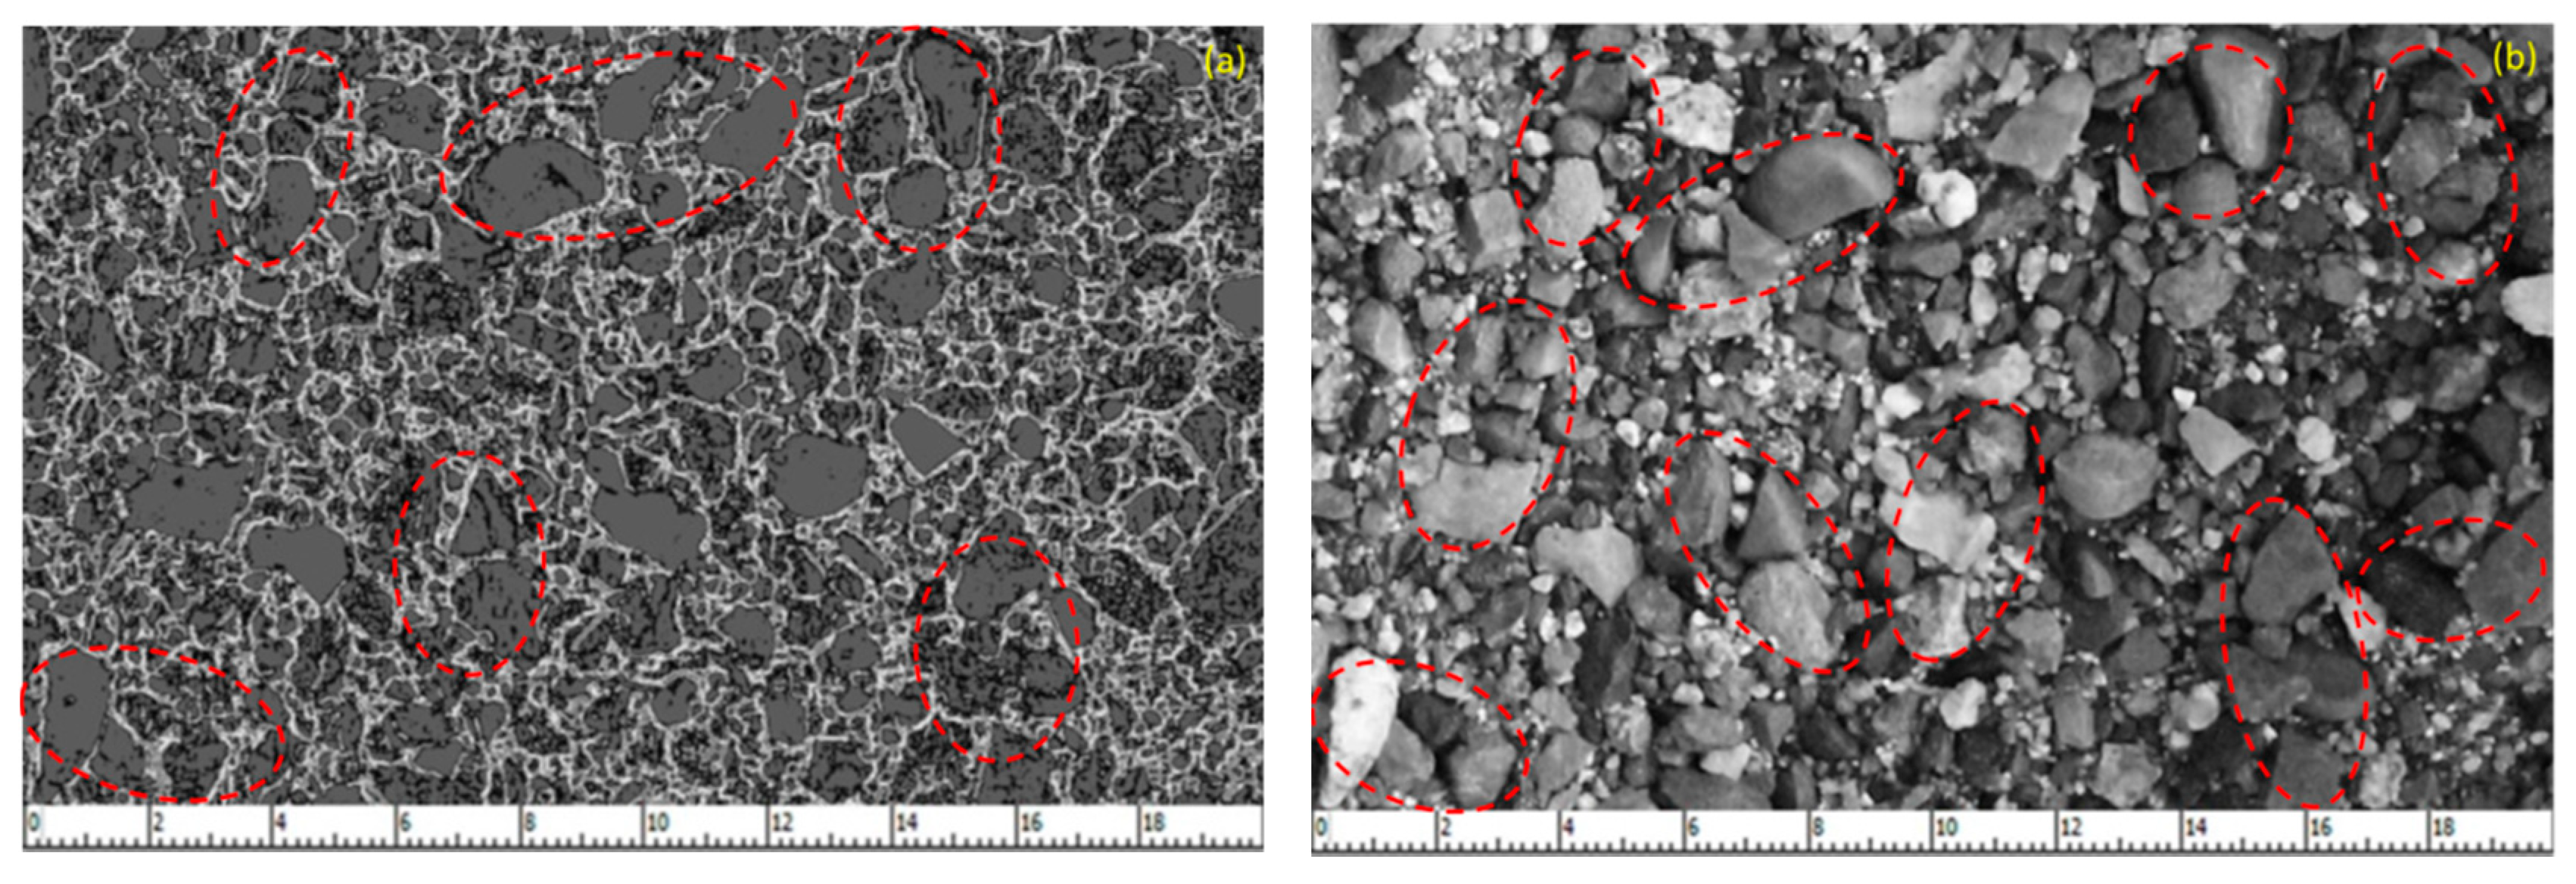
The arrangement of sediment particles and formation of the bed structure on the riverbed is the result of an interaction between the flow and the bed surface [10,11,12]. Therefore, the statistical characteristics of the riverbed can be further quantitatively analyzed. Figure 14 shows the partially surface morphology of the riverbed after roughening. Further, the figure shows that various particle aggregates (red dotted circles in the figure) formed in the static armor layer. Figure 14a shows that cluster-like structures easily formed around large-grained sediments on the riverbed. The irregular cluster-like structures together with bed coarsening (increasing particle size of D50 or D84) improved the bed surface stability. Figure 14b is an actual picture of the central position of riverbed, where we can more clearly observe various structures formed by large and small particles on the riverbed. These aggregates are an important factor in maintaining the riverbed’s stability. Because of the existence of these aggregates, the correlation between the elevations of different points of the riverbed is strengthened. Therefore, to some extent, the statistical parameters of the riverbed elevation can be used to reflect changes in the riverbed structure [11,12,40].
4.2. Bed Surface Structural Properties
The probability density functions of the bed surface elevations were plotted. Initially, these curves were narrow, yet as time progressed in pure degradation cases, the curves became progressively flatter and skewness increased [30,34,40,45]. With the change in flow intensity, there was a greater interaction between surface layer and flow, and the bed elevation changed drastically in two stages (i.e., formation and reestablishment). Although the probability density curves showed some evidence of change occurring on the bed topography, it failed to provide a reliable tool to represent particle stability and the degree of organization of mobile beds [30,40]. In principle, it did not carry enough information on the bed structure.
Therefore, the second-order structure function was adopted because it distinguished different bed structures [30,40,45]. The second-order structure function proved able to reliably show that the grain scale structure developed with coherence in both longitudinal and transverse directions in the degradation phases (i.e., the static armor layer formation and destruction). In the static armor layer’s formation and destruction stages, the D(Δx, Δy)/2σz2 value changed, which reflected the changes in bed structure during this process (Figure 8). The value of the static armor layer’s broken stage was smaller than the value of the corresponding formation stage. As the flow intensity increased, the interaction between the flow and the bed surface strengthened. After the static armor of the bed surface broke, the unevenness of the riverbed elevation further increased, and the relationship between the particles increased. Thus, the value became smaller after it broke. In turn, we can use these differences to quantify changes in the bed structure during the static armor layer’s formation and destruction.
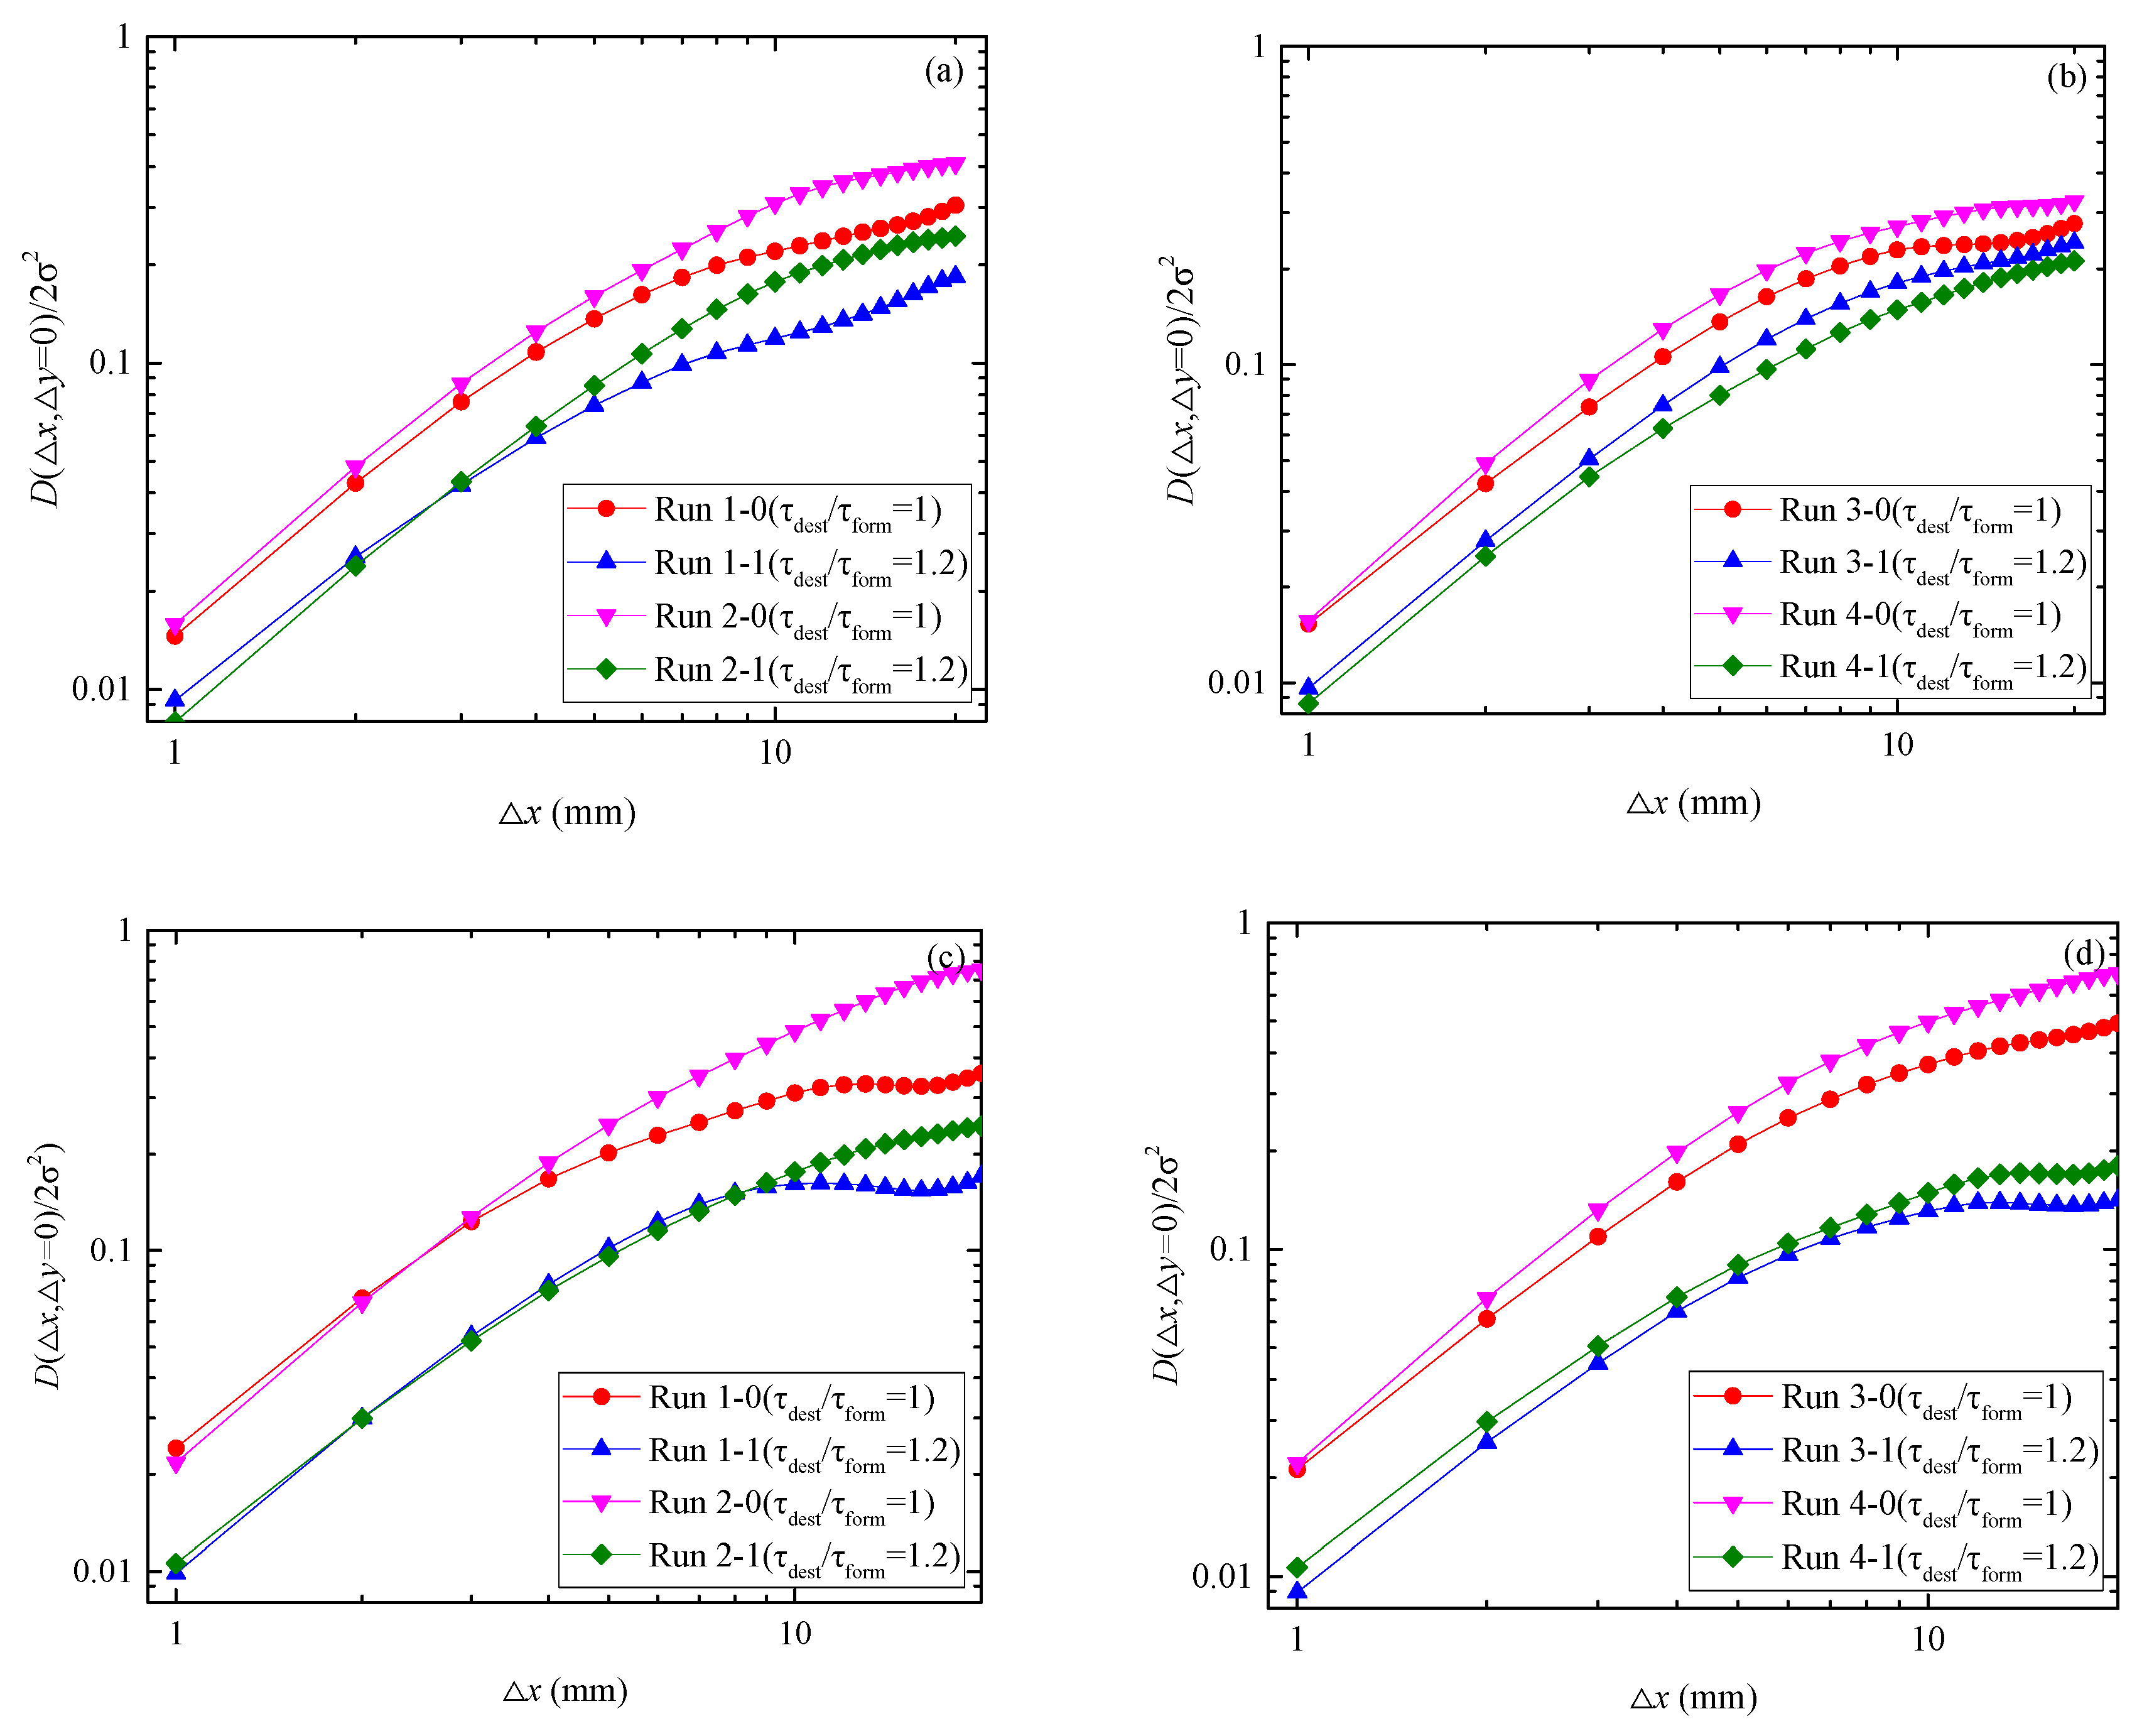
In the longitudinal direction, there was a strong streamwise coherence [30,40], particularly at the smaller lateral lags (as Figure 10). This indicates the presence of distinct longitudinal grain-scale structures. We compared the static armor layer formation and destruction with the second-order structure function at different locations (17# and 21#) and plotted the difference in the same graph (Figure 15). The difference in D(Δx, Δy)/2σz2 values reflected the degree of the riverbed’s deformation, which in turn reflected the degree of change in the bed structure. The difference between each group was relatively close, which means that when the increase in flow intensity was the same, the change in bed structure also changed around a certain standard. These findings provide us with new ideas for quantifying the bed structure. We believe that in this process, the change in the bed structure can be expressed by the difference in D(Δx, Δy)/2σz2 values. As shown in Figure 16, the difference in D(Δx, Δy)/2σz2 of our experiment (the amplitude increase in shear stress is 20%) was relatively stable. The data points were basically concentrated (0.12 (17#) and 0.24 (21#)). When the riverbed position was different, the ΔD(Δx, Δy)/2σz2 was also different in its two states (the two states are the formed and destroyed armor layer). However, the ΔD(Δx, Δy)/2σz2 was the same when the increase in flow intensity was at the same position and close to a certain value. Our findings also show that in the static armor layer’s destruction process, the influence of the bed structure became larger, and the stability of the riverbed after the formation of the new static armor layer improved.
5. Conclusions
This paper investigated the bed load transport rate and bed surface elevation changes in the static armor layer’s formation and reformation after breaking. By taking the bed surface elevation as a random two-dimensional field, the variation of some statistical parameters (including probability distribution functions and second-order structure functions) of the bed elevation were obtained, and the changes of the bed structure of the two processes were also obtained. The key findings of this study are as follows:
- (1)
- The static armor layer’s formation process was similar to the reestablishment process after breaking of the static armor layer. The bed load transport rate increased rapidly from zero to the peak and then slowly decayed. As the flow intensity increased, the peak value of bed load transport rate also increased.
- (2)
- The probability distribution function of bed elevation underwent some adjustments between the static armor layer’s formation and reestablishment. Although the probability distribution function curve showed evidence of change in bed topography, this parameter failed to provide a reliable tool to represent particle stability and the degree of mobile bed organization. This parameter only reflected the changes in bed structure to a certain extent, but it did provide sufficient information for the changes.
- (3)
- The second-order structure functions were effectively quantified between the bed structure’s formation and reestablishment of the static armor layer. With regard to the increase in flow intensity, the difference in bed structure between the static armor layer’s formation and reestablishment was a relatively stable value. When the flow intensity increased by 20%, the previously formed stable static armor layer broke and the two-order structural function difference became relatively stable (0.12 (17#) and 0.24 (21#)). The difference in bed structure of the armor layer formed by different flow intensities was quantified using this parameter’s difference.
Author Contributions
Methodology, Q.W.; software, Y.P.; writing—original draft preparation, Q.W.; writing—review and editing, R.N. and K.Y.; supervision, R.N. and K.Y.; All authors have read and agreed to the published version of the manuscript.
Funding
This study was supported by the National Natural Science Foundation of China (51779163, 51539007).
Conflicts of Interest
The authors declare no conflict of interest.
References
- Wang, L.; Melville, B.W.; Whittaker, C.N.; Guan, D. Temporal Evolution of Clear-Water Scour Depth at Submerged Weirs. J. Hydraul. Eng. 2020, 146, 06020001. [Google Scholar] [CrossRef]
- Wang, L.; Melville, B.W.; Shamseldin, A.Y.; Nie, R. Impacts of Bridge Piers on Scour at Downstream River Training Structures: Submerged Weir as an Example. Water Resour. Res. 2020, 56, e2019WR026720. [Google Scholar] [CrossRef]
- Wang, L.; Melville, B.W.; Whittaker, C.N.; Guan, D. Scour Estimation Downstream of Submerged Weirs. J. Hydraul. Eng. 2019, 145, 06019016. [Google Scholar] [CrossRef]
- Wang, L.; Melville, B.W.; Guan, D. Effects of Upstream Weir Slope on Local Scour at Submerged Weirs. J. Hydraul. Eng. 2018, 144, 04018002. [Google Scholar] [CrossRef]
- Wang, L.; Melville, B.W.; Guan, D.; Whittaker, C.N. Local Scour at Downstream Sloped Submerged Weirs. J. Hydraul. Eng. 2018, 144, 04018044. [Google Scholar] [CrossRef]
- Chin, C.O.; Melville, B.W.; Raudkivi, A.J. Streambed armoring. J. Hydraul. Eng. 1994, 120, 899–918. [Google Scholar] [CrossRef]
- Gomez, B. Effects of particle shape and mobility on stable armor development. Water Resour. Res. 1994, 30, 2229–2239. [Google Scholar] [CrossRef]
- Vericat, D.; Batalla, R.J.; Garcia, C. Breakup and reestablishment of the armour layer in a large gravel-bed river below dams: The lower Ebro. Geomorphology 2006, 76, 122–136. [Google Scholar] [CrossRef]
- Dietrich, W.E.; Kirchner, J.W.; Ikeda, H.; Iseya, F. Sediment supply and the development of the coarse surface layer in gravel-bedded rivers. Nature 1989, 340, 215–217. [Google Scholar] [CrossRef]
- Church, M. Geomorphic response to river flow regulation: Case studies and time-scales. Regul River. 1995, 11, 3–22. [Google Scholar] [CrossRef]
- Church, M.; Hassan, M.A.; Wolcott, J.F. Stabilizing self-organized structures in gravel-bed stream channels: Field and experimental observations. Water Resour. Res. 1998, 34, 3169–3179. [Google Scholar] [CrossRef]
- Hassan, M.A.; Church, M. Experiments on surface structure and partial sediment transport on a gravel bed. Water Resour. Res. 2000, 36, 1885–1895. [Google Scholar] [CrossRef]
- Hassan, M.A.; Egozi, R.; Parker, G. Experiments on the effect of hydrograph characteristics on vertical grain sorting in gravel bed rivers. Water Resour. Res. 2006, 42. [Google Scholar] [CrossRef]
- Piedra, M.M.; Haynes, H.; Hoey, T.B. The spatial distribution of coarse surface grains and the stability of gravel riverbeds. Sedimentology 2012, 59, 1014–1029. [Google Scholar] [CrossRef]
- Heays, K.G.; Friedrich, H.; Melville, B.W. Laboratory study of gravel-bed cluster formation and disintegration. Water Resour. Res. 2014, 50, 2227–2241. [Google Scholar] [CrossRef]
- Curran, J.C.; Waters, K.A. The importance of bed sediment sand content on the structure of a static armor layer in a gravel bed river. J. Geophys. Res. Earth Surf. 2014, 119, 1484–1497. [Google Scholar] [CrossRef] [Green Version]
- Wang, T.; Liu, X. The breakup of armor layer in a gravel-bed stream with no sediment supply. In Advances in Water Resources and Hydraulic Engineering; Springer: Berlin/Heidelberg, Germany, 2009; pp. 919–923. [Google Scholar]
- Orrú, C.; Astrid, B.; Uijttewaal, W.S.J. Armor breakup and reformation in a degradational laboratory experiment. Earth Surf. Dyn. 2016, 4, 461–470. [Google Scholar] [CrossRef] [Green Version]
- Spiller, S.M.; Rüther, N.; Friedrich, H. Dynamic Lift on an Artificial Static Armor Layer during Highly Unsteady Open Channel Flow. Water 2015, 7, 4951–4970. [Google Scholar] [CrossRef] [Green Version]
- Zhang, N.; Zhang, Q.; Wang, K.H.; Zou, G.; Jiang, X.; Yang, A.; Li, Y. Numerical Simulation of Wave Overtopping on Breakwater with an Armor Layer of Accropode Using SWASH Model. Water 2020, 12, 386. [Google Scholar] [CrossRef] [Green Version]
- Pandey, M.; Chen, S.C.; Sharma, P.K.; Ojha, C.S.P.; Kumar, V. Local Scour of Armor Layer Processes around the Circular Pier in Non-Uniform Gravel Bed. Water 2019, 11, 1421. [Google Scholar] [CrossRef] [Green Version]
- Wolman, M.G. A method of sampling coarse river-bed material. Eos Trans. AGU 1954, 35, 951–956. [Google Scholar] [CrossRef]
- Bathurst, J.C. Flow resistance estimation in mountain rivers. J. Hydraul. Eng. 1985, 111, 625–643. [Google Scholar] [CrossRef]
- Wiberg, P.L.; Smith, J.D. Velocity distribution and bed roughness in high-gradient streams. Water Resour. Res. 1991, 27, 825–838. [Google Scholar] [CrossRef]
- Furbish, D.J. Conditions for geometric similarity of coarse stream-bed roughness. Math Geosci. 1987, 19, 291–307. [Google Scholar] [CrossRef]
- Robert, A. Statistical properties of sediment bed profiles in alluvial channels. Math Geosci. 1988, 20, 205–225. [Google Scholar] [CrossRef]
- Robert, A. Boundary roughness in coarse-grained channels. Prog. Phys. Geogr. 1990, 14, 42–70. [Google Scholar] [CrossRef]
- Robert, A. Fractal properties of simulated bed profiles in coarse-grained channels. Math Geosci. 1991, 23, 367–382. [Google Scholar] [CrossRef]
- Clifford, N.J.; Robert, A.; Richards, K.S. Estimation of flow resistance in gravel-bedded rivers: A physical explanation of the multiplier of roughness length. Earth Surf. Process. Landf. 2010, 17, 111–126. [Google Scholar] [CrossRef]
- Marion, A.; Tait, S.J.; Mcewan, I.K. Analysis of small-scale gravel bed topography during armoring. Water Resour. Res. 2003, 39. [Google Scholar] [CrossRef]
- Aberle, J.; Nikora, V. Statistical properties of armored gravel bed surfaces. Water Resour. Res. 2006, 42. [Google Scholar] [CrossRef]
- Lane, S.N. Roughness–time for a re-evaluation? Earth Surf. Process. Landf. 2005, 30, 251–253. [Google Scholar] [CrossRef]
- Hardy, R.J.; Lane, S.N.; Lawless, M.R.; Best, J.L.; Elliott, L.; Ingham, D.B. Development and testing of a numerical code for treatment of complex river channel topography in three-dimensional CFD models with structured grids. J. Hydraul. Res. 2005, 43, 468–480. [Google Scholar] [CrossRef]
- Carney, S.K.; Bledsoe, B.P.; Gessler, D. Representing the bed roughness of coarse-grained streams in computational fluid dynamics. Earth Surf. Process. Landf. 2006, 31, 736–749. [Google Scholar] [CrossRef]
- Heritage, G.L.; Milan, D.J. Terrestrial Laser Scanning of grain roughness in a gravel-bed river. Geomorphology 2009, 113, 4–11. [Google Scholar] [CrossRef]
- Baewert, H.; Martin, B.; Bryk, A.; Rascher, E.; Schmidt, K.H.; Morche, D. Roughness determination of coarse grained alpine riverbed surfaces using Terrestrial Laser Scanning data. Z. Geomorphol. 2014, 58, 81–95. [Google Scholar] [CrossRef]
- Westoby, M.J.; Dunning, S.A.; Woodward, J.; Rascher, E.; Schmidt, K.H.; Morche, D. Sedimentological characterization of antarctic moraines using UAVs and structure-from-motion photogrammetry. J. Glaciol. 2015, 61, 1088–1102. [Google Scholar] [CrossRef] [Green Version]
- Bertin, S.; Friedrich, H. Field application of close-range digital photogrammetry (crdp) for grain-scale fluvial morphology studies. Earth Surf. Process. Landf. 2016, 41, 1258–1269. [Google Scholar] [CrossRef]
- Detert, M.; Kadinski, L.; Weitbrecht, V. On the way to airborne gravelometry based on 3D spatial data derived from images. Int. J. Sediment Res. 2018, 33, 87–95. [Google Scholar] [CrossRef]
- Bertin, S.; Friedrich, H. Effect of surface texture and structure on the development of stable fluvial armors. Geomorphology 2018, 306, 64–79. [Google Scholar] [CrossRef]
- Recking, A. Simple method for calculating reach-averaged bed-load transport. J. Hydraul. Eng. 2013, 139, 70–75. [Google Scholar] [CrossRef]
- López, R.; Vericat, D.; Batalla, R.J. Evaluation of bed load transport formulae in a large regulated gravel bed river: The lower Ebro (NE Iberian Peninsula). J. Hydrol. 2014, 510, 164–181. [Google Scholar] [CrossRef] [Green Version]
- Sidiropoulos, E.; Papalaskaris, T.; Hrissanthou, V. Parameter Optimization of a Bed Load Transport Formula for Nestos River, Greece. Proceedings 2018, 2, 627. [Google Scholar] [CrossRef] [Green Version]
- Venditti, J.G.; Dietrich, W.E.; Nelson, P.A.; Wydzga, M.A.; Fadde, J.; Sklar, L. Mobilization of coarse surface layers in gravel-bed rivers by finer gravel bed load. Water Resour. Res. 2010, 46. [Google Scholar] [CrossRef] [Green Version]
- Powell, D.M.; Ockelford, A.; Rice, S.P.; Hillier, J.K.; Nguyen, T.; Reid, I.; Tate, N.J.; Ackerley, D. Structural properties of mobile armors formed at different flow strengths in gravel-bed rivers. J. Geophys. Res. Earth Surf. 2016, 121, 1494–1515. [Google Scholar] [CrossRef] [Green Version]
Figure 1.
Line sketch of the experimental setup.

Figure 2.
Grain size distributions of the initial bed surfaces materials.

Figure 3.
The PTS series 3D scanning system: (a) Overall picture of the scanning system; (b) overall picture of the scan head. 1. camera; 2. grating emitter; 3. raster transmitter adjustment button; 4. handle.
Figure 3.
The PTS series 3D scanning system: (a) Overall picture of the scanning system; (b) overall picture of the scan head. 1. camera; 2. grating emitter; 3. raster transmitter adjustment button; 4. handle.

Figure 4.
Bed load transport measured at the end of the flume during Runs 1–4: (a) Run 1; (b) Run 2; (c) Run 3; and (d) Run 4.
Figure 4.
Bed load transport measured at the end of the flume during Runs 1–4: (a) Run 1; (b) Run 2; (c) Run 3; and (d) Run 4.

Figure 5.
Probability density curve of riverbed elevation over average bed surface (x = 17 and 21 m): (a) Run 1~2, x=17 m; (b) Run 3~4, x = 17m; (c) Run 1~2, x = 21 m; and (d) Run 3~4, x = 21 m.
Figure 5.
Probability density curve of riverbed elevation over average bed surface (x = 17 and 21 m): (a) Run 1~2, x=17 m; (b) Run 3~4, x = 17m; (c) Run 1~2, x = 21 m; and (d) Run 3~4, x = 21 m.

Figure 6.
The second-order structure function plot of initial bed materials.

Figure 7.
The second-order structure function plot of Run 1 and Run 2: (a) Run 1-0; (b) Run 1-1; (c) Run 2-0; and (d) Run 2-1.
Figure 7.
The second-order structure function plot of Run 1 and Run 2: (a) Run 1-0; (b) Run 1-1; (c) Run 2-0; and (d) Run 2-1.

Figure 8.
The second-order structure function plot of Run 3 and Run 4: (a) Run 3-0; (b) Run 3-1; (c) Run 4-0; and (d) Run 4-1.
Figure 8.
The second-order structure function plot of Run 3 and Run 4: (a) Run 3-0; (b) Run 3-1; (c) Run 4-0; and (d) Run 4-1.

Figure 9.
The second-order structure function of the bed elevation when the bed is in the initial state along the longitudinal direction.
Figure 9.
The second-order structure function of the bed elevation when the bed is in the initial state along the longitudinal direction.

Figure 10.
The second-order structure function change along the longitudinal direction in Run 1~2: (a) Run 1-0; (b) Run 1-1; (c) Run 2-0; and (d) Run 2-1.
Figure 10.
The second-order structure function change along the longitudinal direction in Run 1~2: (a) Run 1-0; (b) Run 1-1; (c) Run 2-0; and (d) Run 2-1.

Figure 11.
The second-order structure function of the bed elevation when the bed was in the initial state along the transverse direction.
Figure 11.
The second-order structure function of the bed elevation when the bed was in the initial state along the transverse direction.

Figure 12.
The second-order structure function change along the transverse direction in Runs 1–2: (a) Run 1-0; (b) Run 1-1; (c) Run 2-0; and (d) Run 2-1.
Figure 12.
The second-order structure function change along the transverse direction in Runs 1–2: (a) Run 1-0; (b) Run 1-1; (c) Run 2-0; and (d) Run 2-1.

Figure 13.
The grain size distribution of the armor layer: (a) Run 1; (b) Run 2; (c) Run 3; and (d) Run 4.
Figure 13.
The grain size distribution of the armor layer: (a) Run 1; (b) Run 2; (c) Run 3; and (d) Run 4.

Figure 14.
Partially surface morphology of the riverbed after roughening in 21#: (a) Projection of the surface of the riverbed (width is 0.2m); (b) Actual picture of the riverbed (width is 0.2m).
Figure 14.
Partially surface morphology of the riverbed after roughening in 21#: (a) Projection of the surface of the riverbed (width is 0.2m); (b) Actual picture of the riverbed (width is 0.2m).

Figure 15.
The second-order structure function plot of Runs 1–4: (a) Runs 1–2 (17#); (b) Runs 3–4 (17#); (c) Runs 1–2 (21#); and (d) Runs 3–4 (21#). 17# and 21# denote 17 m and 21 m away from the starting point of the flume.
Figure 15.
The second-order structure function plot of Runs 1–4: (a) Runs 1–2 (17#); (b) Runs 3–4 (17#); (c) Runs 1–2 (21#); and (d) Runs 3–4 (21#). 17# and 21# denote 17 m and 21 m away from the starting point of the flume.

Figure 16.
The difference of the second-order structure functions of all runs.


Table 1.
Hydraulic condition for each set of laboratory flume experiments.
| Run | Group | Discharge(L/s) | Shear Stress(Pa) | Depth-Average(cm) | Slope | τdest/τform1 |
|---|---|---|---|---|---|---|
| Run 1 | 1-0 | 50 | 3.73 | 7.61 | 0.005 | 1 |
| 1-1 | 67.8 | 4.47 | 9.12 | 0.0048 | 1.2 | |
| Run 2 | 2-0 | 67.8 | 4.51 | 9.2 | 0.005 | 1 |
| 2-1 | 88 | 5.64 | 11.51 | 0.0047 | 1.2 | |
| Run 3 | 3-0 | 40 | 3.29 | 6.72 | 0.005 | 1 |
| 3-1 | 54 | 3.97 | 8.10 | 0.0049 | 1.2 | |
| Run 4 | 4-0 | 54 | 3.97 | 8.10 | 0.005 | 1 |
| 4-1 | 72 | 4.76 | 9.72 | 0.0047 | 1.2 |
1τform is the shear stress when the static armor layer is formed; τdest is the shear stress when the armor layer is destroyed.
© 2020 by the authors. Licensee MDPI, Basel, Switzerland. This article is an open access article distributed under the terms and conditions of the Creative Commons Attribution (CC BY) license (http://creativecommons.org/licenses/by/4.0/).
Share and Cite
MDPI and ACS Style
Wang, Q.; Pan, Y.; Yang, K.; Nie, R. Structural Properties of the Static Armor during Formation and Reestablishment in Gravel-Bed Rivers. Water 2020, 12, 1845. https://doi.org/10.3390/w12071845
AMA Style
Wang Q, Pan Y, Yang K, Nie R. Structural Properties of the Static Armor during Formation and Reestablishment in Gravel-Bed Rivers. Water. 2020; 12(7):1845. https://doi.org/10.3390/w12071845
Chicago/Turabian StyleWang, Qiang, Yunwen Pan, Kejun Yang, and Ruihua Nie. 2020. "Structural Properties of the Static Armor during Formation and Reestablishment in Gravel-Bed Rivers" Water 12, no. 7: 1845. https://doi.org/10.3390/w12071845
Note that from the first issue of 2016, this journal uses article numbers instead of page numbers. See further details here.