Article

A Comparison of the Mechanism of TOC and COD Degradation in Rhodamine B Wastewater by a Recycling-Flow Two- and Three-dimensional Electro-Reactor System

1
Department of Environmental Engineering, School of Energy and Environmental Engineering, University of Science and Technology Beijing, 30 Xueyuan Road, Haidian District, Beijing 10083, China
2
Beijing Key Laboratory on Resource-oriented Treatment of Industrial Pollutants, University of Science and Technology Beijing, 30 Xueyuan Road, Beijing 10083, China
*
Author to whom correspondence should be addressed.
Water 2020, 12(7), 1853; https://doi.org/10.3390/w12071853
Submission received: 5 June 2020 / Revised: 22 June 2020 / Accepted: 23 June 2020 / Published: 28 June 2020
(This article belongs to the Special Issue Advanced Oxidation Processes for Water and Wastewater Treatment)

Abstract

:
Dye wastewater, as a kind of refractory wastewater (with a ratio of biochemical oxygen demand (BOD) and chemical oxygen demand (COD) of less than 0.3), still needs advanced treatments in order to reach the discharge standard. In this work, the recycling-flow three-dimensional (3D) electro-reactor system was designed for degrading synthetic rhodamine B (RhB) wastewater as dye wastewater (100 mg/L). After 180 min of degradation, the removal of total organic carbon (TOC) and chemical oxygen demand (COD) of RhB wastewater were both approximately double the corresponding values in the recycling-flow two-dimensional (2D) electro-reactor system. Columnar granular activated carbon (CGAC), as micro-electrodes packed between anodic and cathodic electrodes in the recycling-flow 3D electro-reactor system, generated an obviously characteristic peak of anodic catalytic oxidation, increased the mass transfer rate and electrochemically active surface area (EASA) by 40%, and rapidly produced 1.52 times more hydroxyl radicals (·OH) on the surface of CGAC electrodes, in comparison to the recycling-flow 2D electro-reactor system. Additionally, the recycling-flow 3D electro-reactor system can maintain higher current efficiency (CE) and lower energy consumption (Es).

Graphical Abstract

1. Introduction

Nowadays, the unsafe disposal of dye wastewater, which still contains lots of complex pollutants and toxic matter, such as aromatic, chloric, and azo compounds, is seriously threating environmental and ecological systems and human health [1,2,3,4,5]. The reason is that dye wastewater, as a kind of refractory wastewater (with a ratio of biochemical oxygen demand (BOD) and chemical oxygen demand (COD) of less than 0.3), is severely difficult to degrade in order to fall under discharge standards in the activated sludge process using traditional and biological wastewater treatment methods [6]. Therefore, there is a definite urgent need for methods which efficiently degrade dye wastewater after biological treatment [7,8,9,10].
In comparison to the two-dimensional (2D) electro-reactor, consisting of an anode electrode, cathode electrode, and electrolyzer, the three-dimensional (3D) electro-reactor contains a certain number of small granular substances, such as activated carbon particles and diatomite particles, charged by an electric field to form micro-electrodes and then acquires an electrochemically oxidative ability with a third electrode, which is placed between the anode and the cathode electrodes [11,12,13,14]. Simultaneously, the degradation of dye pollutants from wastewater can occur on the surface of these small granular electrodes and anode and cathode electrodes in the 3D electro-reactor [15,16]. Hence, the 3D electro-reactor theoretically shows more brilliant promise in the advanced treatment of dye wastewater as effluent than the 2D electro-reactor.
Currently, the number of researchers [17,18,19] who pay attention to the study of 3D electrode technology is growing dramatically, but they are always focusing on the novel methods of granular electrode modification in order to improve the oxidative degradation ability of the 3D electro-reactor instead of the design and amendment of the 3D electro-reactor system. However, the processes of granular electrode modification normally require quite serious and extreme conditions, such as high temperature and pressure, and special materials, such as noble gases and metal [20,21].
As is well known, the fixed bed 3D electro-reactor system and the fluid bed 3D electro-reactor system are usually used to treat dye wastewater. The former system has the main disadvantage of low treatment efficiency due to extremely a high hydraulic retention time (HRT) and, meanwhile, the main disadvantage of the latter system is effluent’s high total organic carbon (TOC) and COD above the discharged standard due to a low HRT [22,23,24]. Therefore, a recycling-flow 3D electro-reactor system, taking advantages of the strong oxidative degradation ability, high treatment efficiency, no secondary pollution, and being operated under normal temperature and atmosphere pressure, is designed for degrading dye wastewater in our work.
Choosing RhB wastewater as one kind of dye wastewater, this paper is going to analyze the mechanism of the TOC and COD degradation of RhB wastewater in the aspect of mass transfer, the electrochemically active surface area (EASA) of electrodes, the instant concentration of hydroxyl radicals (·OH), current efficiency (CE), and energy consumption (Es) in the recycling-flow 3D electro-reactor system, compared with the recycling-flow 2D electro-reactor system. Additionally, it carries on, finding out the mechanism of TOC and COD degradation with different voltages, with different electrolytes, and at different HRTs in the recycling-flow 3D electro-reactor system.

2. Materials and Methods

2.1. Materials

RhB as a dye has a molecular formula of C28H31ClN2O3 and a molecular weight of 479.01. Columnar granular activated carbon (CGAC) from coconut shells (average size: 1.50 mm) was purchased from Henan Lianhua Carbon Manufacturing Co. Two Ti/RuO2/TiO2 board electrodes (size: 60 mm × 100 mm × 2 mm) were provided by the Second Research Institute of the China Aerospace Science and Industry Group. Anhydrous sodium sulfate (Na2SO4), sodium chloride (NaCl), mercury(II) sulfate (HgSO4), phosphoric acid (H3PO4), potassium dichromate (K2Cr2O7), sulfuric acid (H2SO4), and potassium ferrocyanide (K4Fe(CN)6) were of analytical grade and used without any further purification. Silver sulfate (Ag2SO4) was not less than 99.7%. Ammonium iron(II) sulfate ((NH4)2Fe(SO4)2 was not less than 99.5%. The ferroin indicator solution standard is Q/12NK4019-2011.

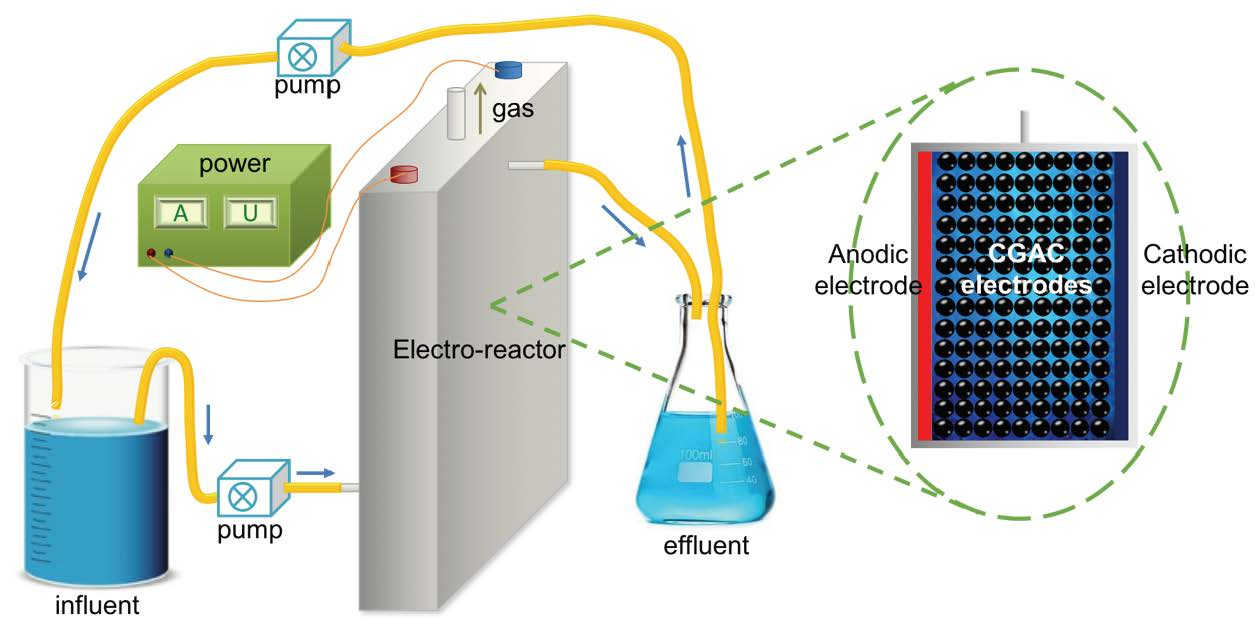
2.2. Experimental Setup and Procedure

A virtual diagram of the experimental setup is shown in Figure 1. The electro-reactor was a plexiglass rectangular tank (Organic Glass Factory, Beijing, China) with two Ti/RuO2/TiO2 board electrodes as the anode and cathode in the 2D electro-reactor. The anode and cathode were positioned vertically and parallel to each other with an inter-electrode gap of 30 mm. The CGAC electrodes were packed between the anode and cathode up to a height of 80 mm in the 3D electro-reactor; the liquid level equaled the height of the packed bed.
In this recycling system, one peristaltic pump (Youji Keyi ZQ000S, Baoding, Hebei, China) was used to pump the influent RhB wastewater from a beaker into the bottom of the electro-reactor. Then the RhB wastewater flowed out from the upper outlet of the electro-reactor and was collected in an Erlenmeyer flask. Simultaneously, the other peristaltic pump was used to pump the effluent RhB wastewater from the Erlenmeyer flask back to the beaker.
Prior to commencing the electrochemical oxidation treatment, CGAC electrodes adsorbed RhB solution until becoming saturated in order to minimize the effect of adsorption on TOC and COD removal. All experiments used a digital DC power supply (DC 30 V/5 A; DH1716-6D). After completing the experiment, all treated samples were collected and filtered through 0.45 mm filters. The filtrate was then analyzed, as described in the next sub-sections.

2.3. Analytical Methods

TOC was measured by a Vario TOC analysis device. According to the instructions of the Vario TOC analysis device, when carbonaceous compounds are burned in an oxygen-rich environment, the carbon is completely converted into CO2, and then the non-scattering infrared detector (NDIR) detects the amount of CO2 and converts it into total carbon (TC) in the sample. After the sample is acidified by phosphoric acid (H3PO4) (1% v/v) and pH decreasing, the carbonate and bicarbonate in the sample are converted into CO2, which is blown out and enters the NDIR, and then the detected amount of CO2 is converted into total inorganic carbon (TIC). The value of TOC is TC minus TIC.
COD was measured by a microwave digestion method. According to the instructions of the Kedibo microwave digestion device, mercury(II) sulfate (HgSO4) as a masking agent, 0.05 mol/L potassium dichromate (K2Cr2O7) as a digestion solution, a mix of 10 g silver sulfate (Ag2SO4) and 1 L sulfuric acid (H2SO4) as a catalyst, ferroin solution as an indicator, and potassium ferrocyanide (K4Fe(CN)6) as a standard solution were used.
Electrochemical measurements were performed using a conventional three-electrode cell and a CHI 660E electrochemical workstation (CHI, Beijing, China). Ag/AgCl and Ti/RuO2/TiO2 board electrodes served as the reference and counter electrodes, respectively.
CE (%) is the rate of the efficient current and total current in a period and Es (KW·h/kg TOC) is the electricity consumption of 1 kg TOC degradation. They were calculated according to the following equations [25,26,27]:
C E = T O C 0 T O C t 480 I F Q
E s = U I 60 ( T O C 0 T O C t ) Q
where TOC0 (g/L) and TOCt (g/L) correspond to the total organic carbon at t = 0 min and t = t min, respectively. I is the average current (A), F is the Faraday constant (96,485 C/mol), Q is the flow rate of water (L/min), and U is the applied electric voltage (V).

3. Result and Discussion

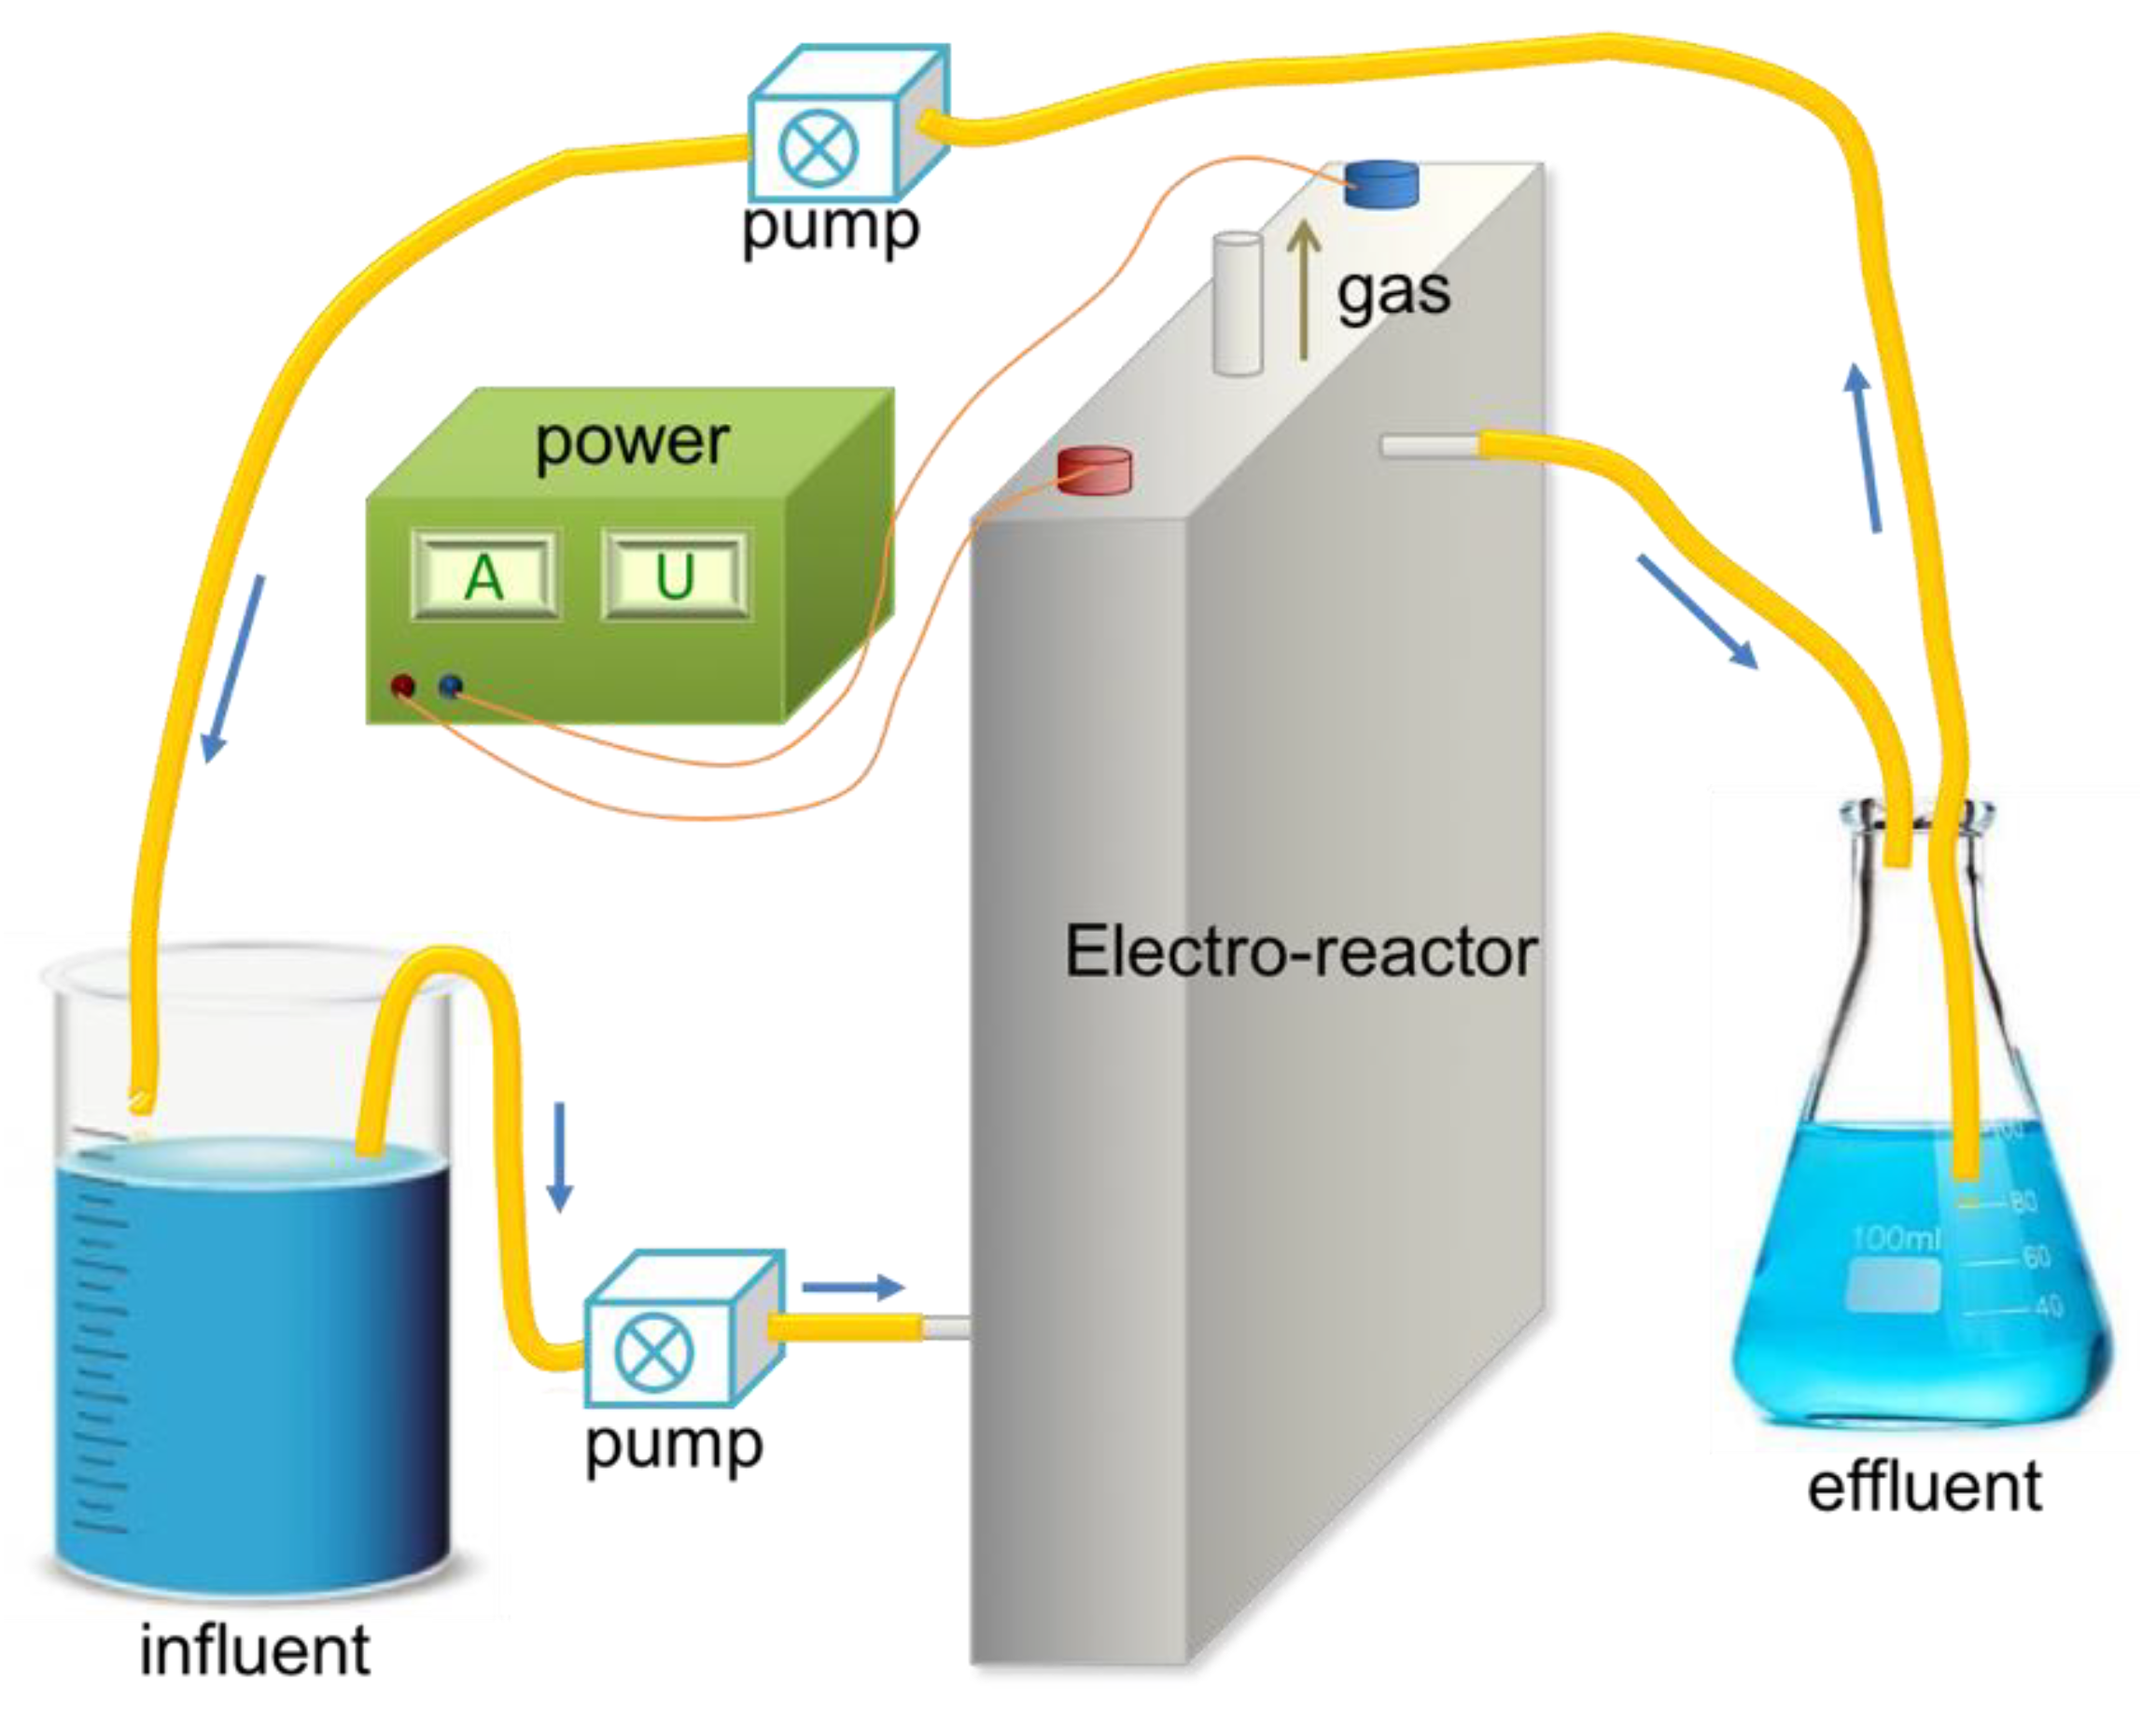
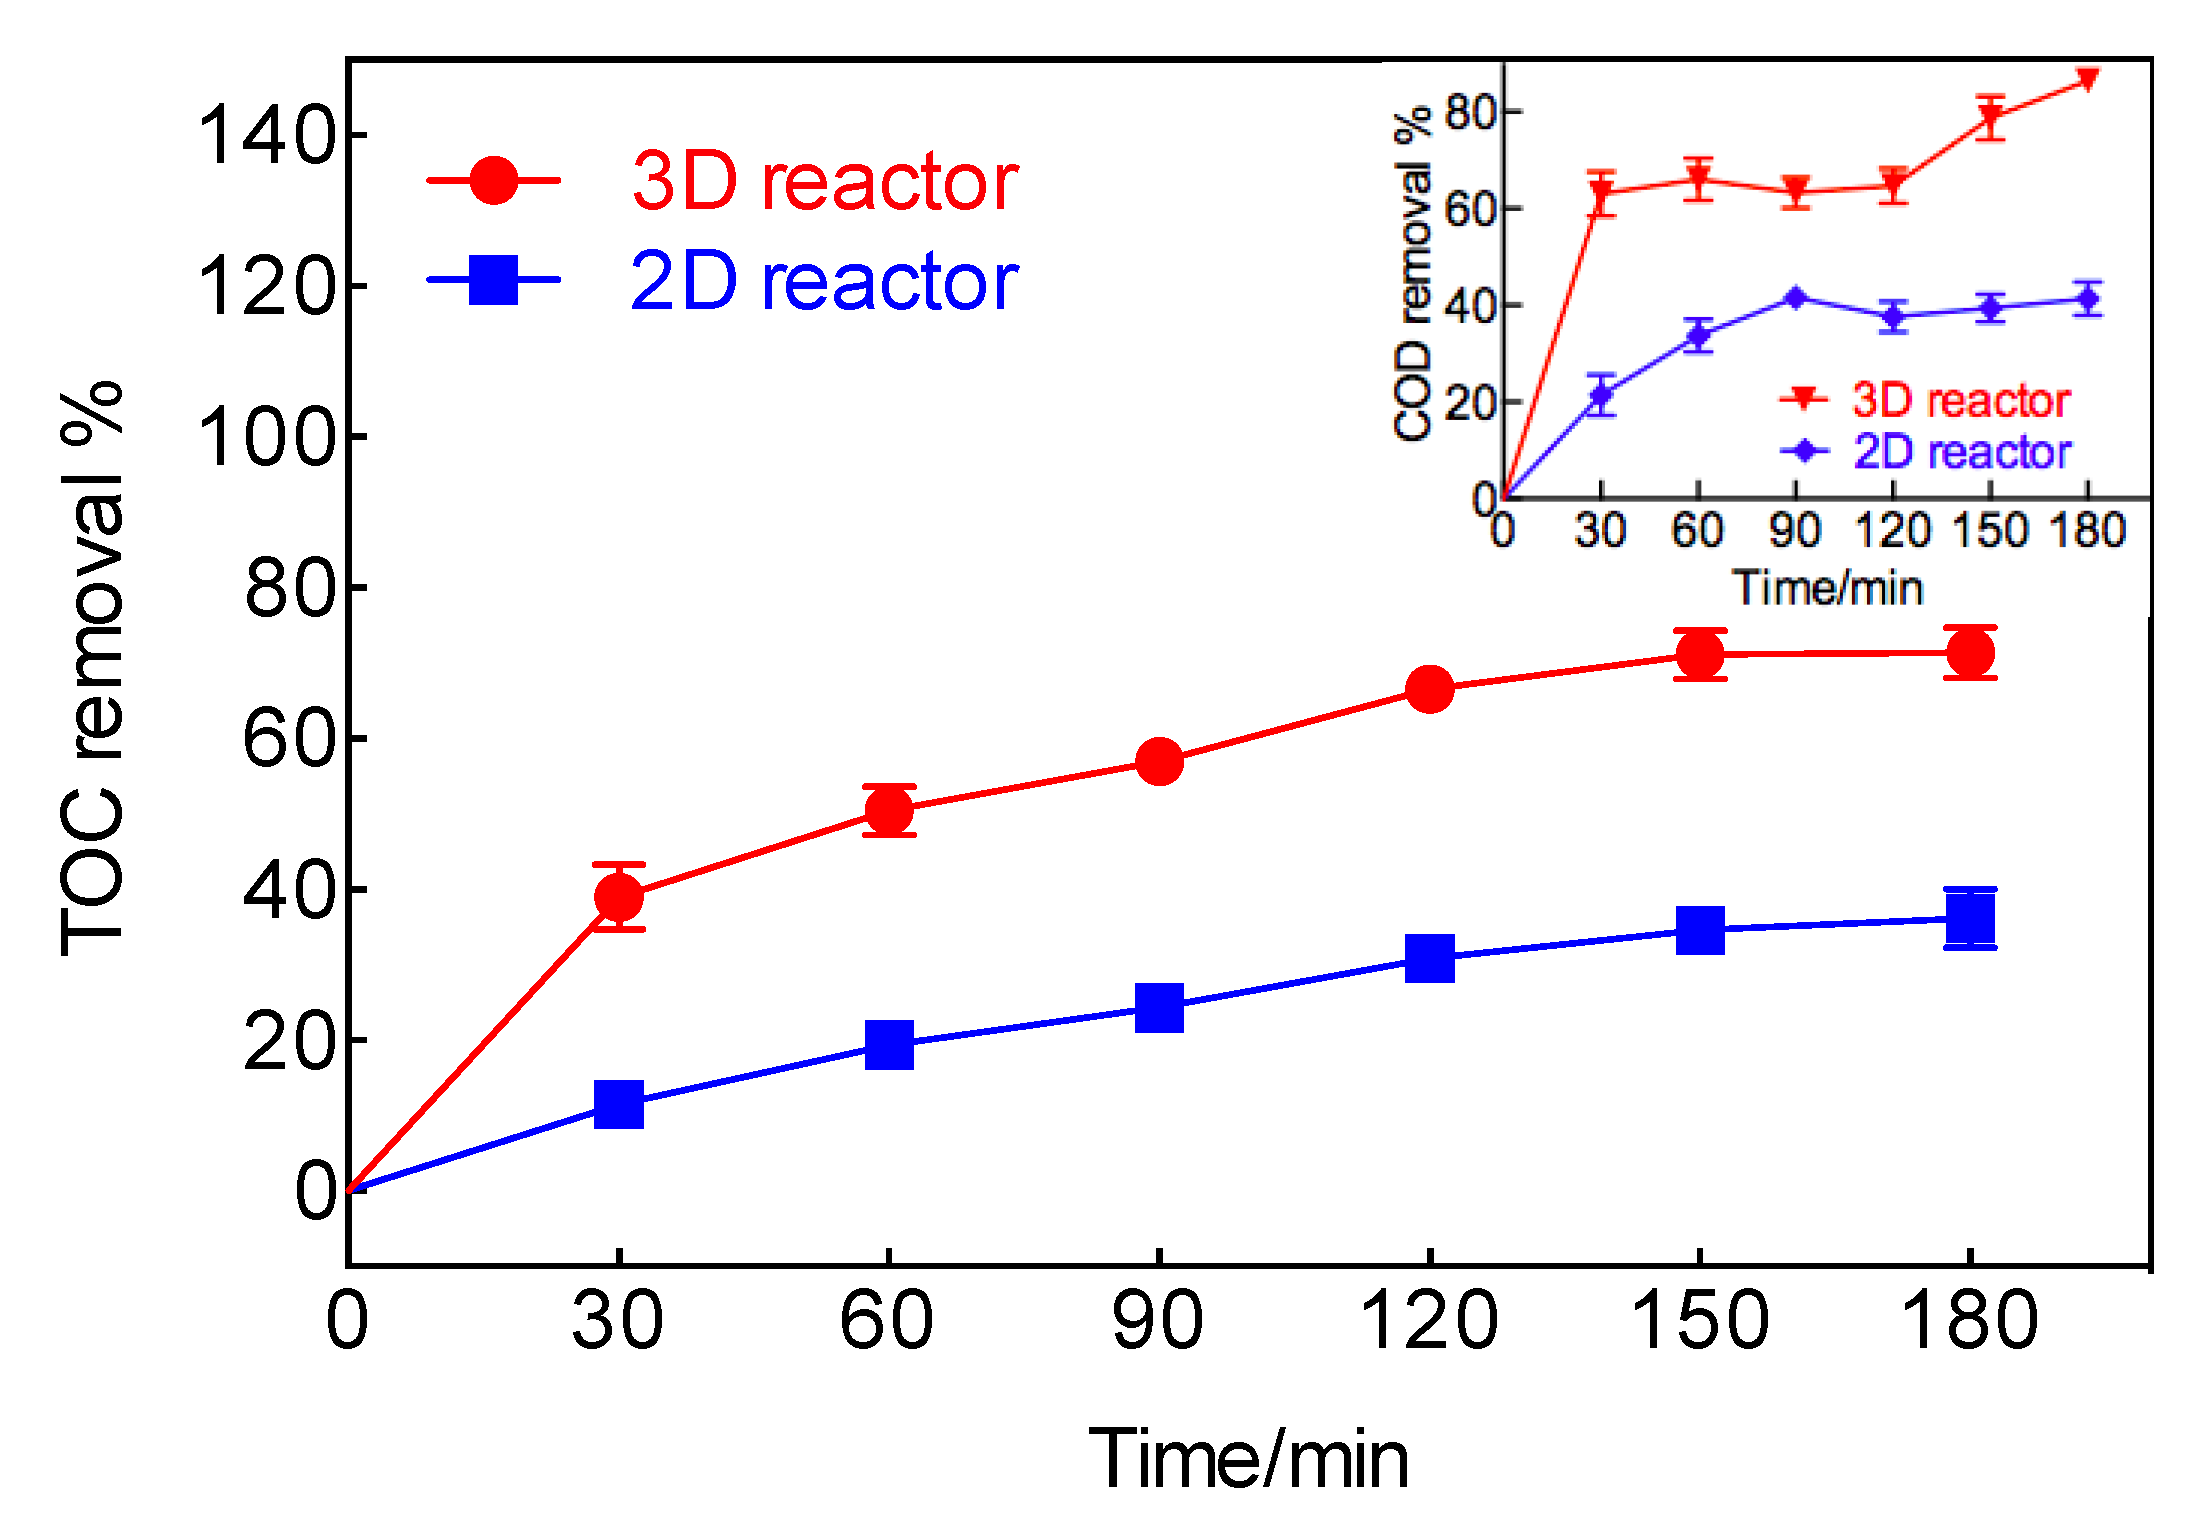
3.1. Electrochemical Properties of TOC and COD Degradation in the Recycling-Flow Elecro-Reactor System

As shown in Figure 2, the TOC removal of RhB wastewater in the recycling-flow 3D electro-reactor system was always higher than that in the recycling-flow 2D electro-reactor system, and the highest TOC removal was 72.0%, which was 1.98 times that in the recycling-flow 2D electro-reactor system (36.3%). From the perspective of COD, the COD removal of RhB wastewater in the recycling-flow 3D electro-reactor system was much higher than that in the recycling-flow 2D electro-reactor system and the highest COD removal was up to 86.9%. By the 30th minute, COD removal in the recycling-flow 3D electro-reactor system had already reached 63.4%, meanwhile, the recycling-flow 2D electro-reactor system just reached 41.9% by the 180th minute.
It is normally considered that the mass transfer and EASA of the electrodes play major roles. Therefore, the higher TOC and COD removal in the recycling-flow 3D electro-reactor system is due to the presence of CGAC as conductive particles packed in the 3D electro-reactor and constitute a number of microelectrodes, which dramatically increase the area of the reaction electrode and benefit organic matter degradation easily and quickly in oxidative processes [28,29].
In order to obtain the mass transfer rate and EASA of the electrodes in the 2D and 3D electro-reactors, respectively, cyclic voltammograms (CVs) of the 2D and 3D electro-reactors were measured in a 0.05 mol/L K4Fe(CN)6 + 0.45 mol/L Na2SO4 solution at different scan rates from 0.015 V/s to 0.1 V/s by a CHI 660E electrochemical workstation (CHI, China). The 3D electro-reactor had a characteristic peak of anodic catalytic oxidation, as illustrated in Figure 3. Taking a sweep rate of 0.1 V/s (red line) as an example, when the potential was 0.7 V, it should be 0.2 A if the potential and the corresponding current were in a linear relationship (demonstrated in Figure 3b). However, the Figure 3a curve shows that the corresponding current is as high as 0.35 A at the potential of 0.7 V. This was because the corresponding current incurred a mutation at 0.7 V, which is called a characteristic peak of anodic catalytic oxidation.
It was found that both the anodic peak current and the cathodic peak current increased as the scan rate increased, indicating a reversible electrochemical reaction of the [Fe(CN)6]4−/[Fe(CN)6]3− redox couple. At the same time, Figure 3 (insets) shows a brilliant linear relationship between the oxidation peak current (Ip) and the square root of the scan rate (v1/2), according to the following equation [21,30,31]:
I p = ( 2.69 × 10 5 ) n 2 / 3 A D R 1 / 2 C R v 1 / 2
where n is the number of transferred electrons, A is the EASA (cm2), DR is the diffusion coefficient of the reduced species (cm2/s), CR is the bulk reduced species concentration (mmol/L), and v is the scan rate (mV/s). The above equation can be simplified into the following equation:
I p = k v 1 / 2
where k is a coefficient only relevant to A and DR because n and CR are constant in this study.
As shown in the insets of Figure 3a,b, the slopes of the linear relationship between Ip and v1/2, named as the value of k, representing the mass transfer rate, were obtained according to the linear fitting of the plots. As expected, the k value of the 3D electro-reactor (0.3953) was larger than the corresponding value of the 2D electro-reactor (0.2816). This demonstrates that the 3D electro-reactor had greater mass transfer properties than the 2D electro-reactor [32,33].
In addition, the EASA can also be derived from the k value by assuming that the DR value of [Fe(CN)6]4− is constant in this study. The obtained EASA value of the 3D electro-reactor is also higher than that of the 2D electro-reactor. In particular, it was 1.40 times the corresponding value of the 2D electro-reactor. The higher EASA of the 3D electro-reactor means that the 3D electro-reactor will provide much more electrochemically active sites for RhB oxidation, and thus will be beneficial in improving the oxidation of organics on the electrode surface [34].
Based on the mass transfer rate and EASA result and discussion above, the 3D electro-reactor has been demonstrated to possess a much higher electro-catalytic activity for degrading organic matter (RhB) than the 2D electro-reactor.
It is well known that the hydroxyl radical (·OH), of which the oxidation potential (2.8 eV) is the second highest and regarded as a powerful oxidizing chemical in nature, plays an important role in the electrochemical oxidation of RhB wastewater [35]. Therefore, the production of ·OH was detected by using the electron paramagnetic resonance (EPR) technique by adding the ·OH scavenger 5,5-dimenthyl,1-pyrroline-N-oxide (DMPO) to further reveal the underlying mechanism of the TOC and COD degradation of RhB wastewater. As expected, typical EPR spectra of the DMPO–·OH adduct with a 1:2:2:1 quartet were acquired in the 3D and 2D electro-reactors when current and voltage were applied, as shown in Figure 4. It is worth noting that the 3D electro-reactor achieved the higher EPR intensity, which was nearly 2.52 times higher than the corresponding value of the 2D electro-reactor and demonstrated that the electro-generation of ·OH occurred on the CGAC electrodes and the usage of the CGAC electrodes could enhance ·OH generation effectively in electrochemical oxidation processes [36].
Overall, the degradation of organic matter (RhB) by the 3D electro-reactor depends on more ·OH being adsorbed on the surface of CGAC electrodes, forming more electrochemically active sites for RhB oxidation. However, the 2D electro-reactor can just undergo less ·OH adsorption and the degradation strength is also reduced due to the absence of CGAC as conductive particles.
The CE and Es of the recycling-flow 3D and 2D electro-reactor systems are shown in Figure 5. Overall, the CE of the recycling-flow 3D and 2D electro-reactor systems both went up from 8.3% and 2.5% to 14.4% and 7.6%, respectively, and the Es of the recycling-flow 3D and 2D electro-reactor systems both decreased from 202.6 KW·h/kg TOC and 658.1 KW·h/kg TOC to 116.3 KW·h/kg TOC and 219.9 KW·h/kg TOC, respectively, during the electrochemical processes. The CE of the recycling-flow 3D electro-reactor system was always nearly twice as much as the corresponding value of the recycling-flow 2D electro-reactor system in the treatment period. Additionally, the lowest CE value of the recycling-flow 3D electro-reactor system, by the 30th minute, had reached 8.3%, which approximately equaled the highest CE value of the recycling-flow 2D electro-reactor system (7.6%).
From the perspective of Es, by the 30th minute, the Es of the recycling-flow 3D electro-reactor system was 202.6 KW·h/kg TOC, which was less than one third the corresponding value of the recycling-flow 2D electro-reactor system (658.1 KW·h/kg TOC). Although the Es of the recycling-flow 2D electro-reactor system reduced slightly, the minimum Es was still as high as 219.9 KW·h/kg TOC, which was almost double the corresponding value of the recycling-flow 3D electro-reactor system (116.3 KW·h/kg TOC).
This verified that the existence of CGAC electrodes in the recycling-flow 3D electro-reactor system increased the mass transfer rate and EASA, rapidly generated much more ·OH on the surface of CGAC electrodes, and improved CE and reduced Es.

3.2. Mechanism of TOC and COD Degradation with Different Electrolytes in the Recycling-Flow Electro-Reactor System

An electrolyte is frequently added to wastewater to enhance the conductivity of the solution and reduce impedance in an electrochemical reaction. It is actually necessary to research the effect of the electrolyte on the degradation of RhB wastewater, as shown in Figure 6.
From the beginning to the 75th min as Part 1, the TOC removal of RhB wastewater (NaCl) was higher than that of RhB wastewater (Na2SO4). The reason was that Cl in the RhB wastewater (NaCl) dramatically generated lots of active chlorine (Cl), which reacted with ·OH in a synergistic process to increase TOC removal through electrochemical reaction processes. However, from the 75th min to the 180th min as Part 2, the TOC removal of RhB wastewater (Na2SO4) started to go beyond that of RhB wastewater (NaCl). The former and the latter peak rates reached 72.8% and 67.3%, respectively. As some active chlorine (Cl) was converted into chlorine (Cl2) in the RhB wastewater (NaCl), Cl2 partially escaped into the air. The electrons lost during the formation of Cl2 could no longer be used due to the balance of electron gain and loss. Therefore, RhB wastewater (NaCl) had a final TOC removal lower than that of RhB wastewater (Na2SO4) [37].
Additionally, the COD removal of RhB wastewater (NaCl) increased gradually and then reached 89.3%. Meanwhile, the COD removal of RhB wastewater (Na2SO4) first increased and then dropped to 43.9%. The highest value could just reach 77.6%. RhB decomposed into small molecules which could not be oxidized by potassium dichromate (K2Cr2O7) in the solution (Na2SO4) from the 60th min, whilst a side reaction occurred in the solution (NaCl) to generate ClO which had strong oxidizing properties, and enhanced the ability to degrade COD [38].
Obviously, the CE of the recycling-flow 3D electro-reactor system with NaCl was higher than the corresponding value of the recycling-flow 3D electro-reactor system with Na2SO4 before the 75th minute, but the CE of the recycling-flow 3D electro-reactor system with Na2SO4 was higher than the corresponding value of the recycling-flow 3D electro-reactor system with NaCl up to the 180th min, as illustrated in Figure 7. Overall, the CE of the recycling-flow 3D electro-reactor systems with NaCl and Na2SO4 both went up smoothly and then got to the highest value (12.2% and 11.3%, respectively).
Meanwhile, the Es of the recycling-flow 3D electro-reactor system with Na2SO4 was higher than the corresponding value of the recycling-flow 3D electro-reactor system with NaCl up to the 80th min. In particular, the Es of the recycling-flow 3D electro-reactor system with Na2SO4 was 483.5 KW·h/kg TOC, which was 68.3% higher than the corresponding value of the recycling-flow 3D electro-reactor system with NaCl (287.2 KW·h/kg TOC) by the 30th min. However, the Es of the recycling-flow 3D electro-reactor system with Na2SO4 started to be lower than the corresponding value of the recycling-flow 3D electro-reactor system with NaCl from the 80th min. In addition, the Es of the recycling-flow 3D electro-reactor systems with NaCl and Na2SO4 both declined to the lowest value (192.7 KW·h/kg TOC and 206.7 KW·h/kg TOC, respectively) in this period.
These again indicate that NaCl, as an electrolyte, had a high conductive efficiency in the former period due to active chlorine (Cl) generation and then changed to low conductive efficiency due to Cl2 escaping into the air in the latter period from CE and Es [22].

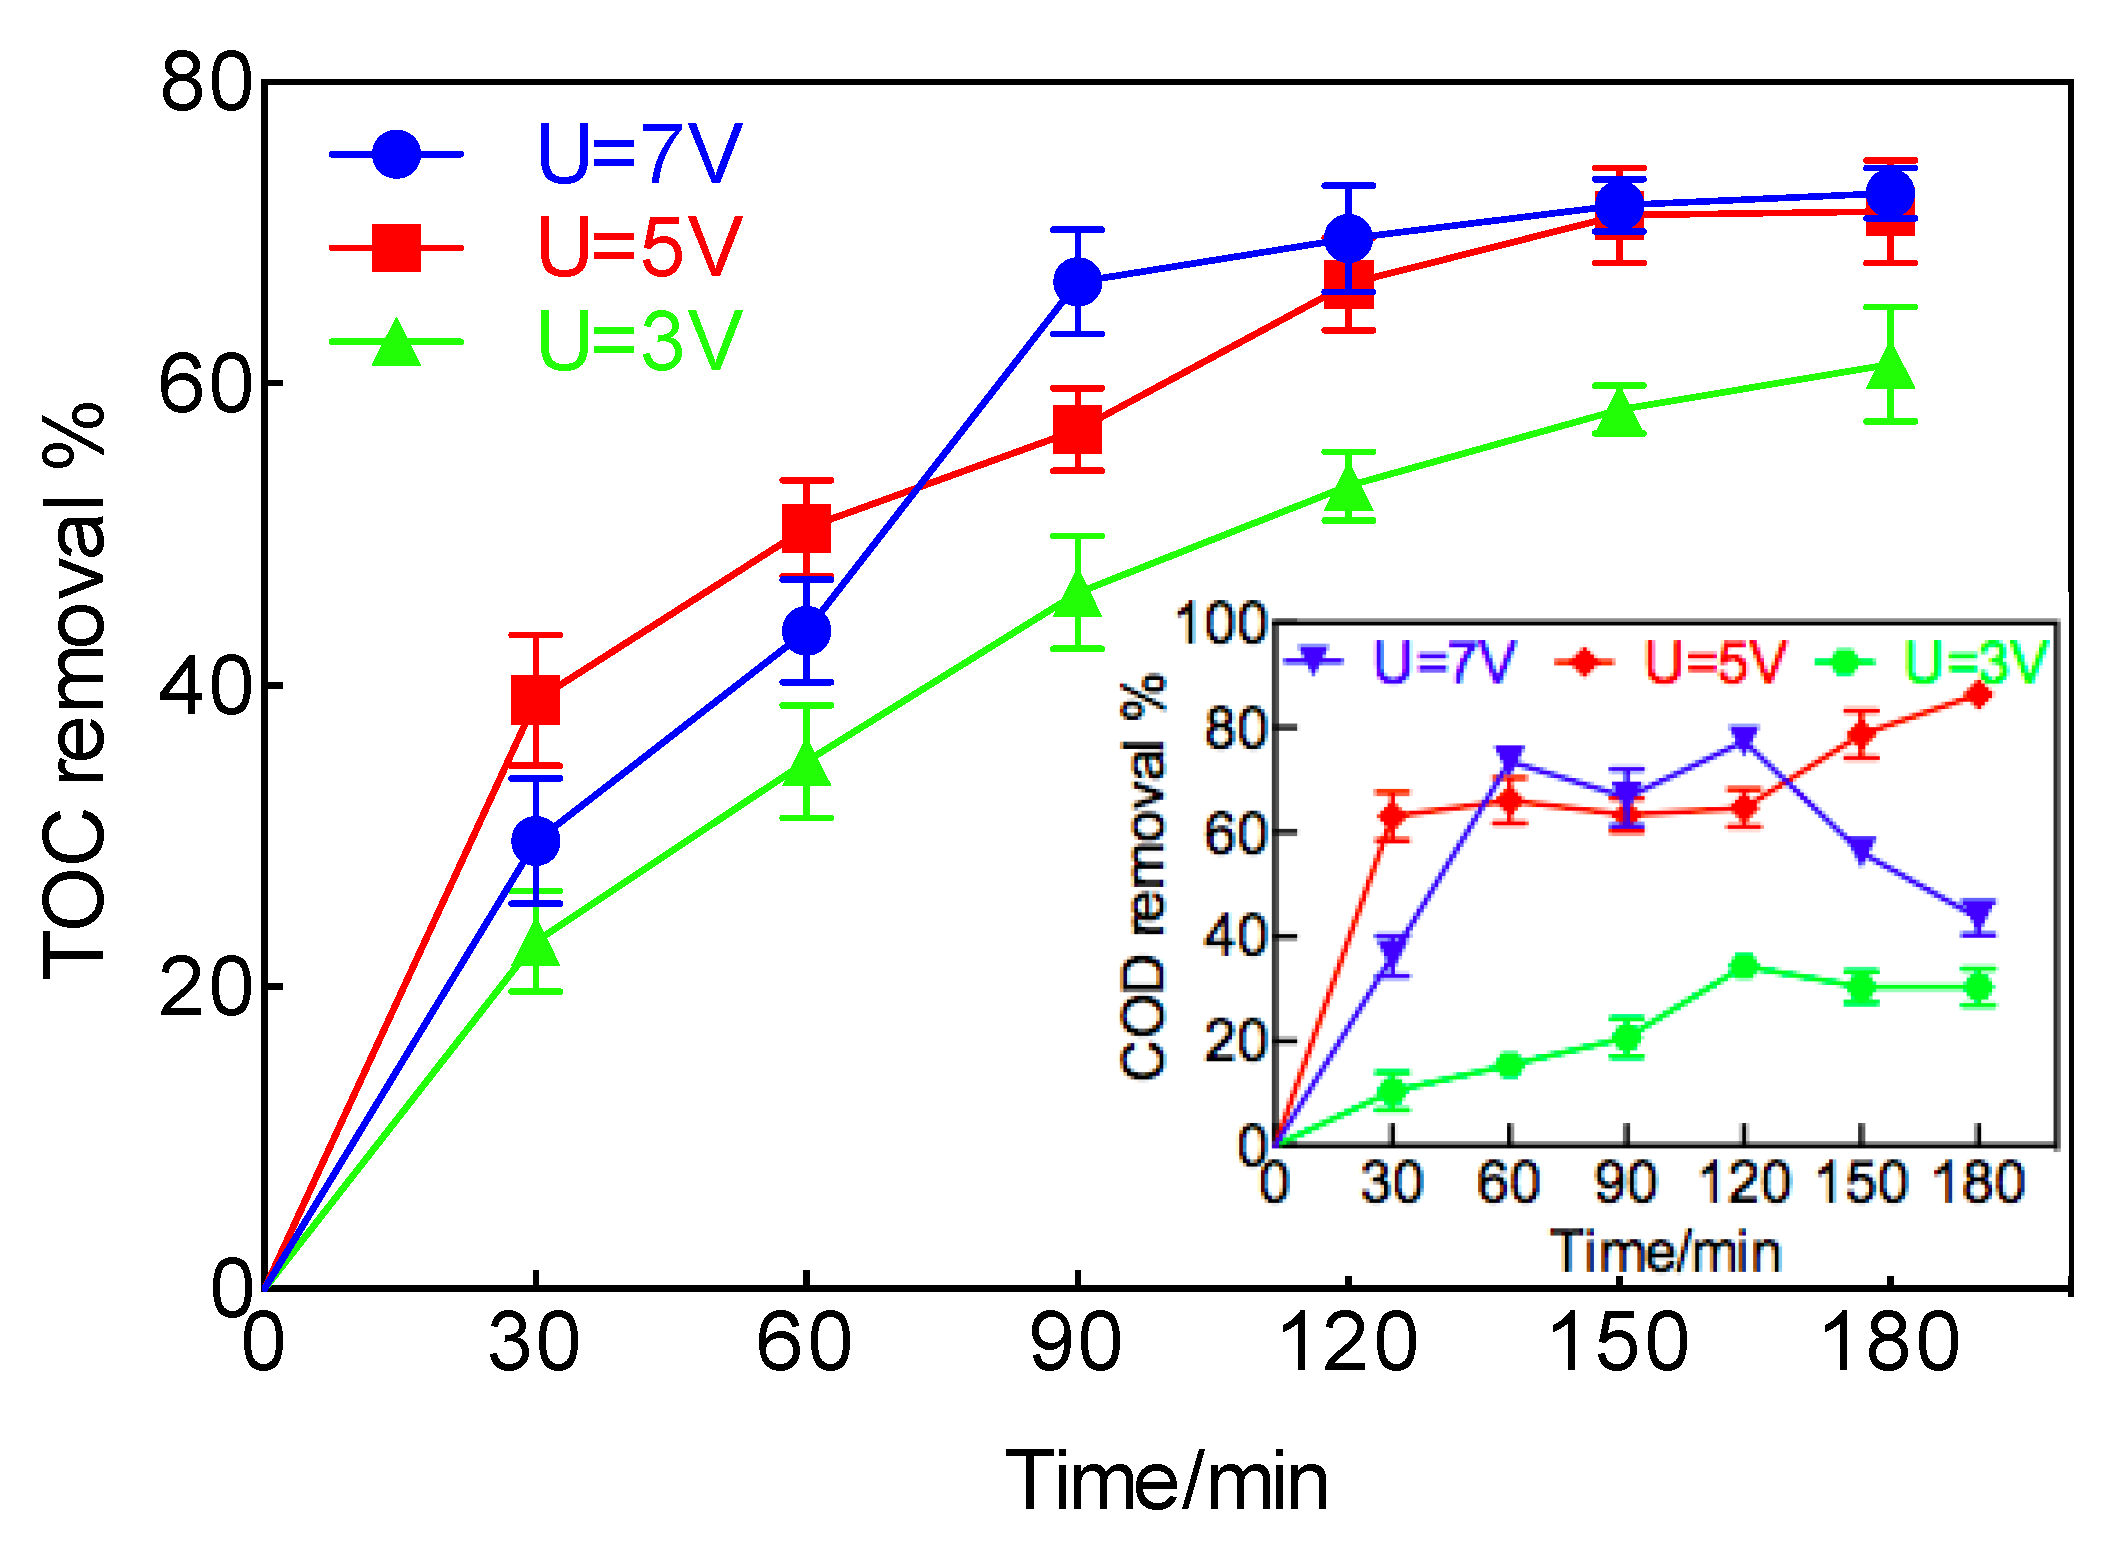
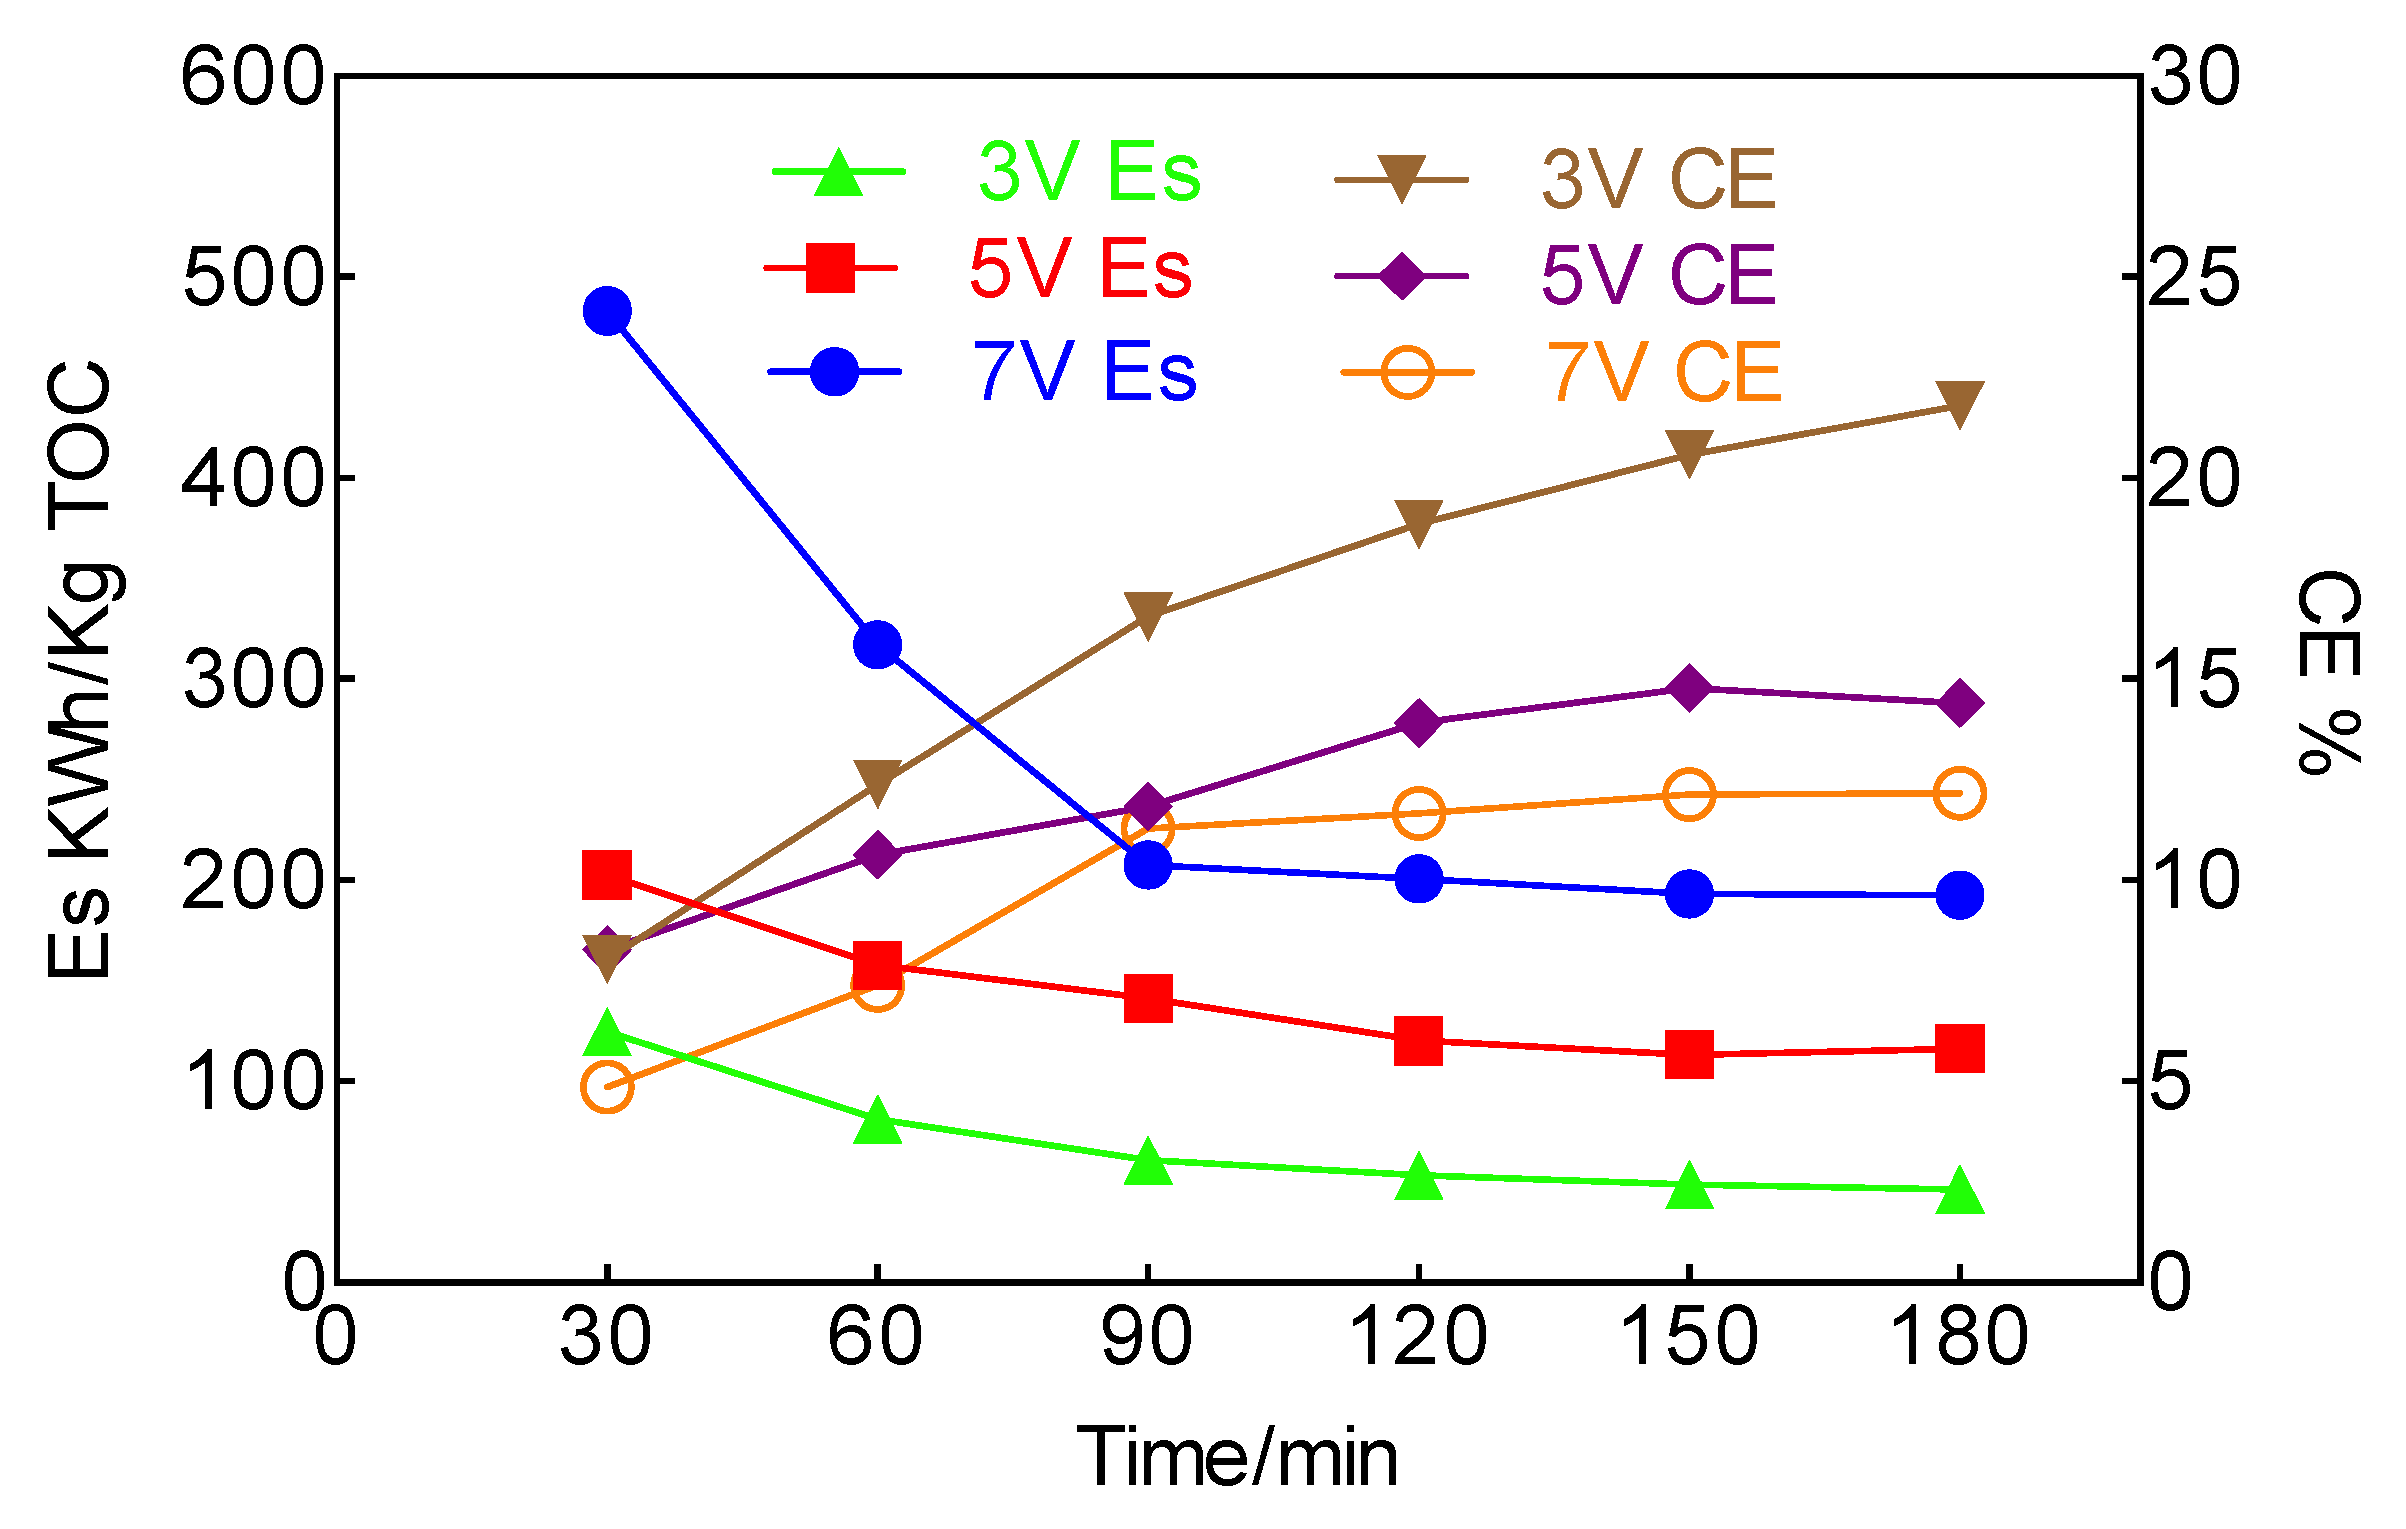
3.3. Mechanism of TOC and COD Degradation in Different Voltages in the Recycling-Flow Electro-Reactor System

As seen in Figure 8, the COD removal curve shows a smooth increase and then reaches 30.1% with the voltage of 3 V. In addition, the COD removal of RhB wastewater rose dramatically with the voltages of 5 V and 7 V up to the 60th min and then kept nearly flat between the 60th min and 120th min. Finally, COD removal with 5 V carried on increasing to 86.9%, whilst the corresponding value with 7 V started decreasing to 43.9%. This could be explained by the equation below:
C O D   r e m o v a l ( % ) = C O D 0 C O D t C O D 0 × 100 % = 1 C O D t C O D 0 × 100 %
where COD0 is the initial COD of RhB wastewater and CODt is the COD of RhB wastewater after treating t minutes.
The COD0 value was smaller than the actual value due to some macromolecular substances being unable to be oxidized by K2Cr2O7 in the initial RhB wastewater, and then more macromolecules could be oxidized into smaller molecules with the voltage of 7 V set in this experiment, compared with the voltage of 5 V, which were easily oxidized by K2Cr2O7, resulting in a CODt value and COD removal that are greater simultaneously [39].
From the perspective of TOC, as shown in Figure 8, the TOC removal of RhB wastewater grew the most slowly and the final TOC removal just arrived at 61.0% when the voltage was 3 V. TOC removal was always higher with the voltages of 7 V and 5 V, and the highest values were basically equivalent (72.2% and 72.0%, respectively), which were nearly 1.18 times the corresponding value with the voltage of 3V.
Interestingly, from the 0th min to the 70th min, TOC removal with the voltage of 5 V was higher than that with the voltage of 7 V. TOC degradation processes are illustrated in Figure 9. First of all, TOC was converted into TIC and then TIC was converted into CO2 and H2O. The concentration of ·OH in the RhB wastewater was higher, so that oxidation was stronger between the board electrodes with 7 V. TIC was quickly oxidized into CO2 and H2O and TOC was converted into TIC as main processes. With the voltage of 5 V, the oxidation was weaker [40,41,42]. Electron transfer processes were normally used to convert TOC into TIC whilst only some of TIC was converted into CO2 and H2O. Hence, TOC removal was higher with 5 V. After the 70th min, TOC removal with the voltage of 7 V was beyond the corresponding value with the voltage of 5 V. TIC from TOC was basically converted into CO2 and H2O with the voltage of 7 V, while TIC just started being rapidly converted into CO2 and H2O as main processes with the voltage of 5 V. Hence, TOC removal was higher with 7 V. The final TOC removal with 7 V was slightly higher than the corresponding value with 5 V since the potential of 7 V was higher than 5 V up to the 180th min [43,44].
CE with the voltage of 3 V rose the fastest from 8.0% by the 30th minute to 21.8% by the 180th minute, which increased by nearly two times, meanwhile, the CEs with 5 V and 7 V both showed gradually increasing trends to 14.1% and 12.2%, respectively, as indicated in Figure 10. Plus, the Es with different voltages (3 V, 5 V, and 7 V) gradually decreased by 63.1%, 42.6%, and 60.2%, respectively, from the 30th min up to the 180th min. In the whole electrolysis process, the higher the voltage was, the higher the Es was. At the 180th min, Es with the voltage of 3 V was 46.1 KW·h/kg TOC, which was 39.6% of the corresponding value with 5 V (116.3 KW·h/kg TOC) and 23.9% of the corresponding value with 7 V (192.7 KW·h/kg TOC).

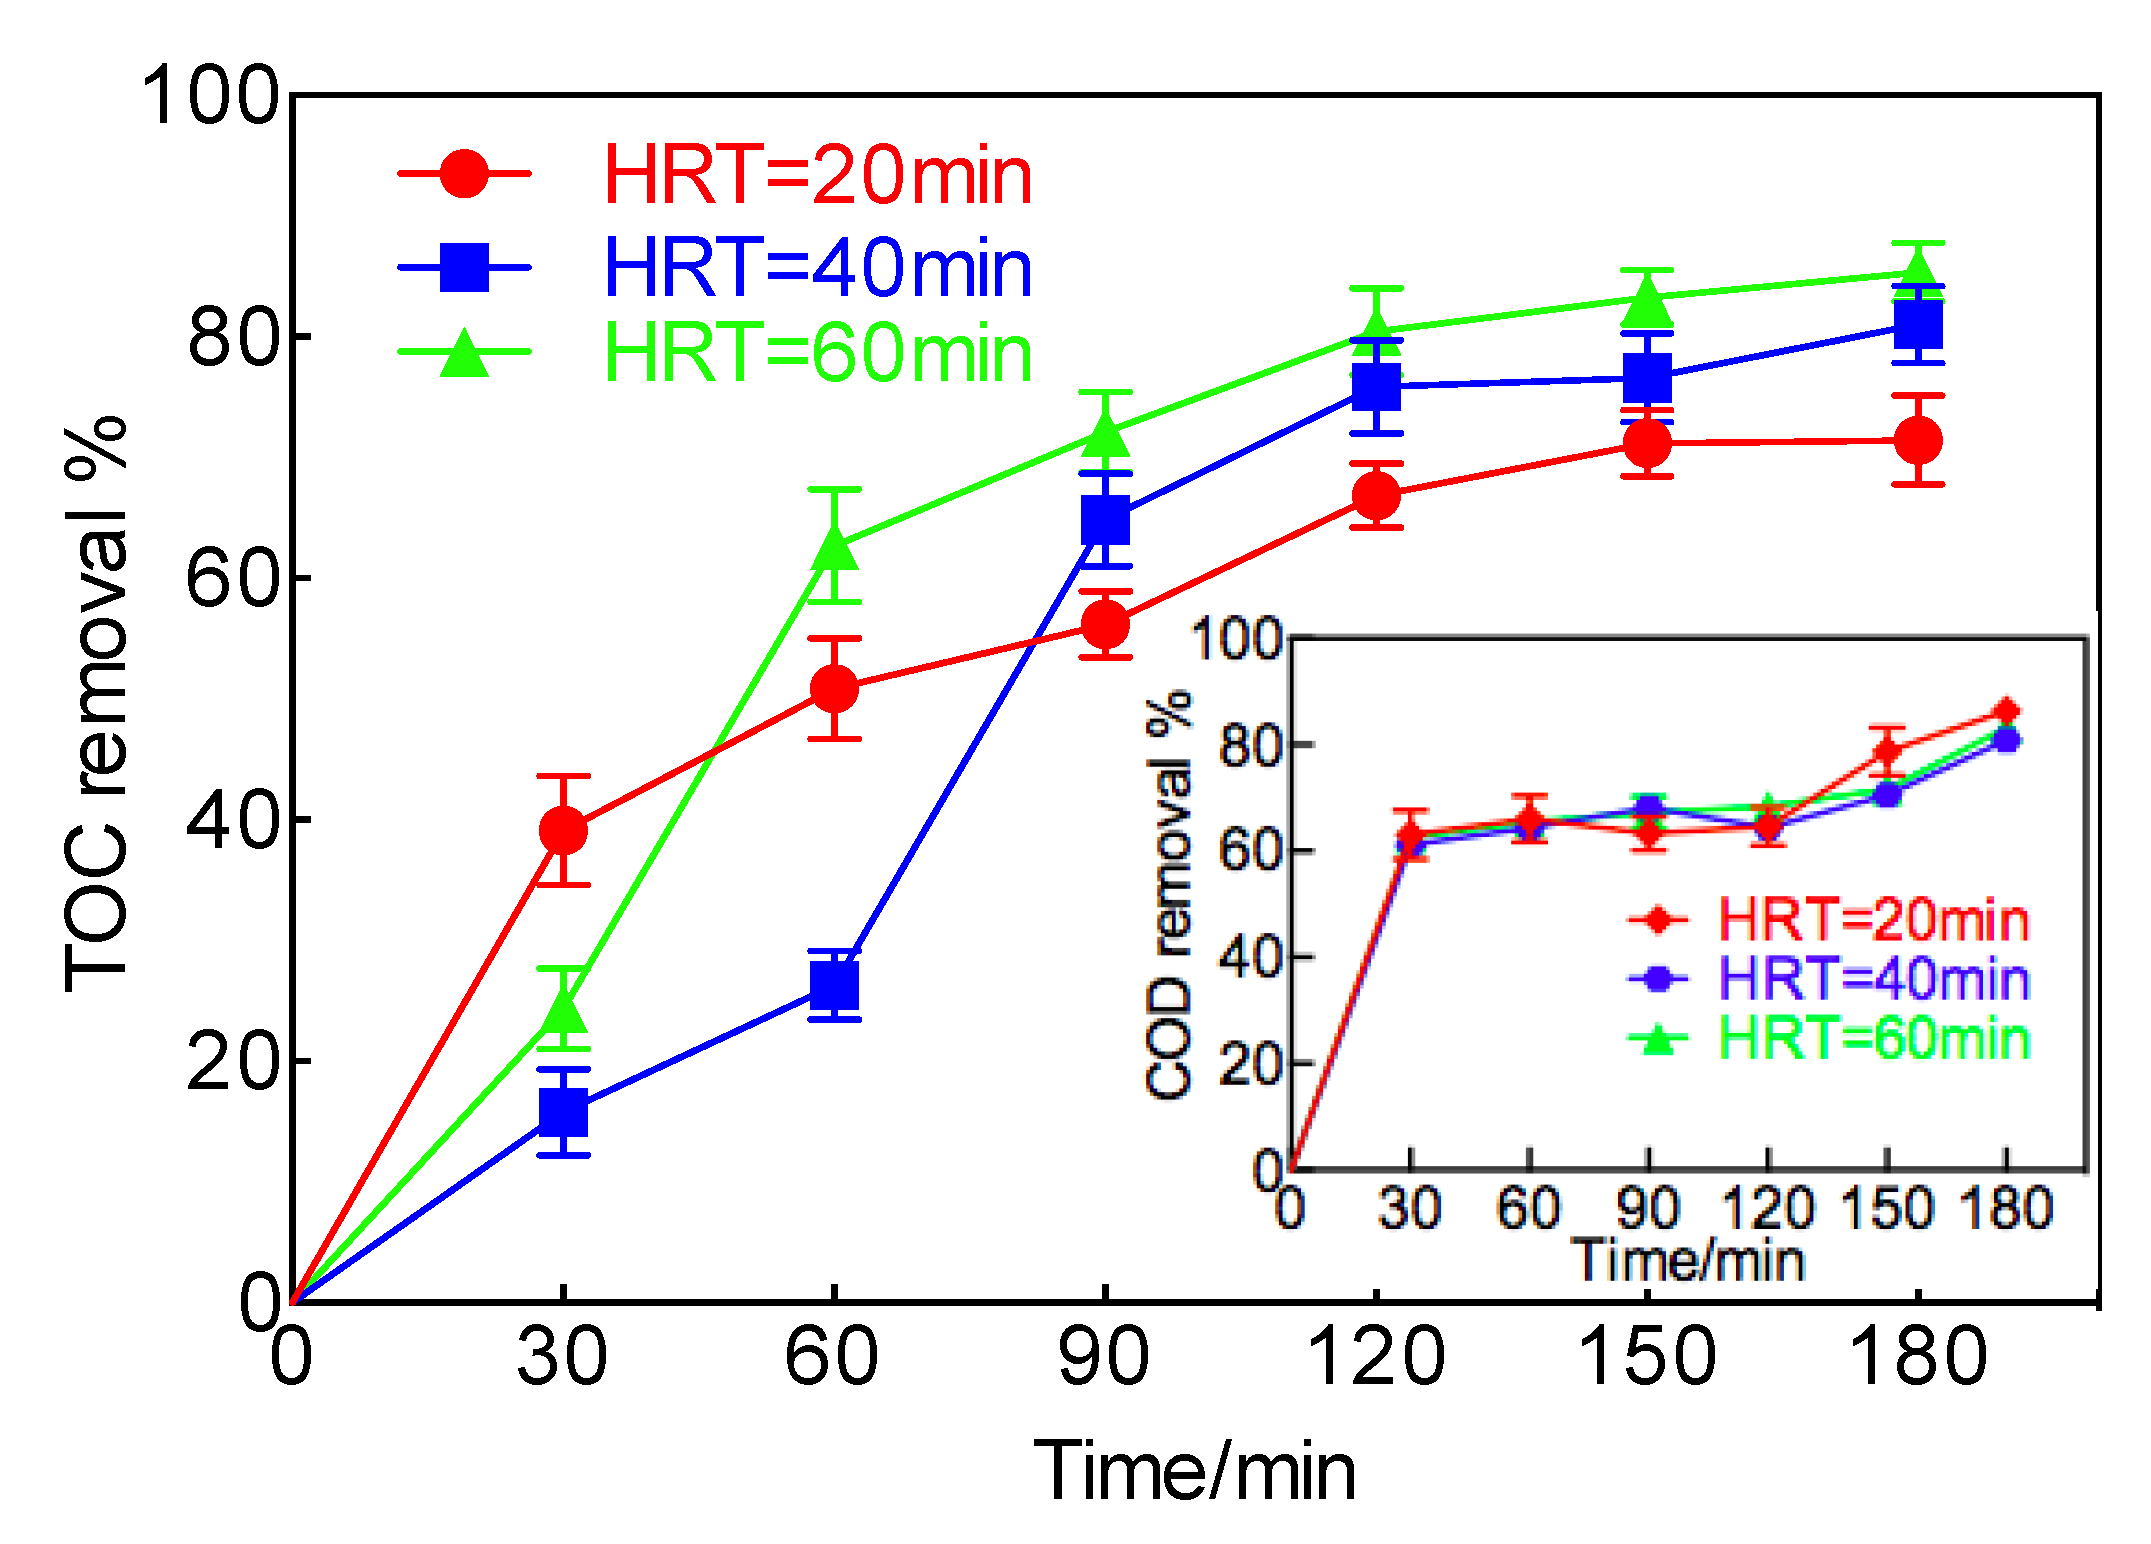
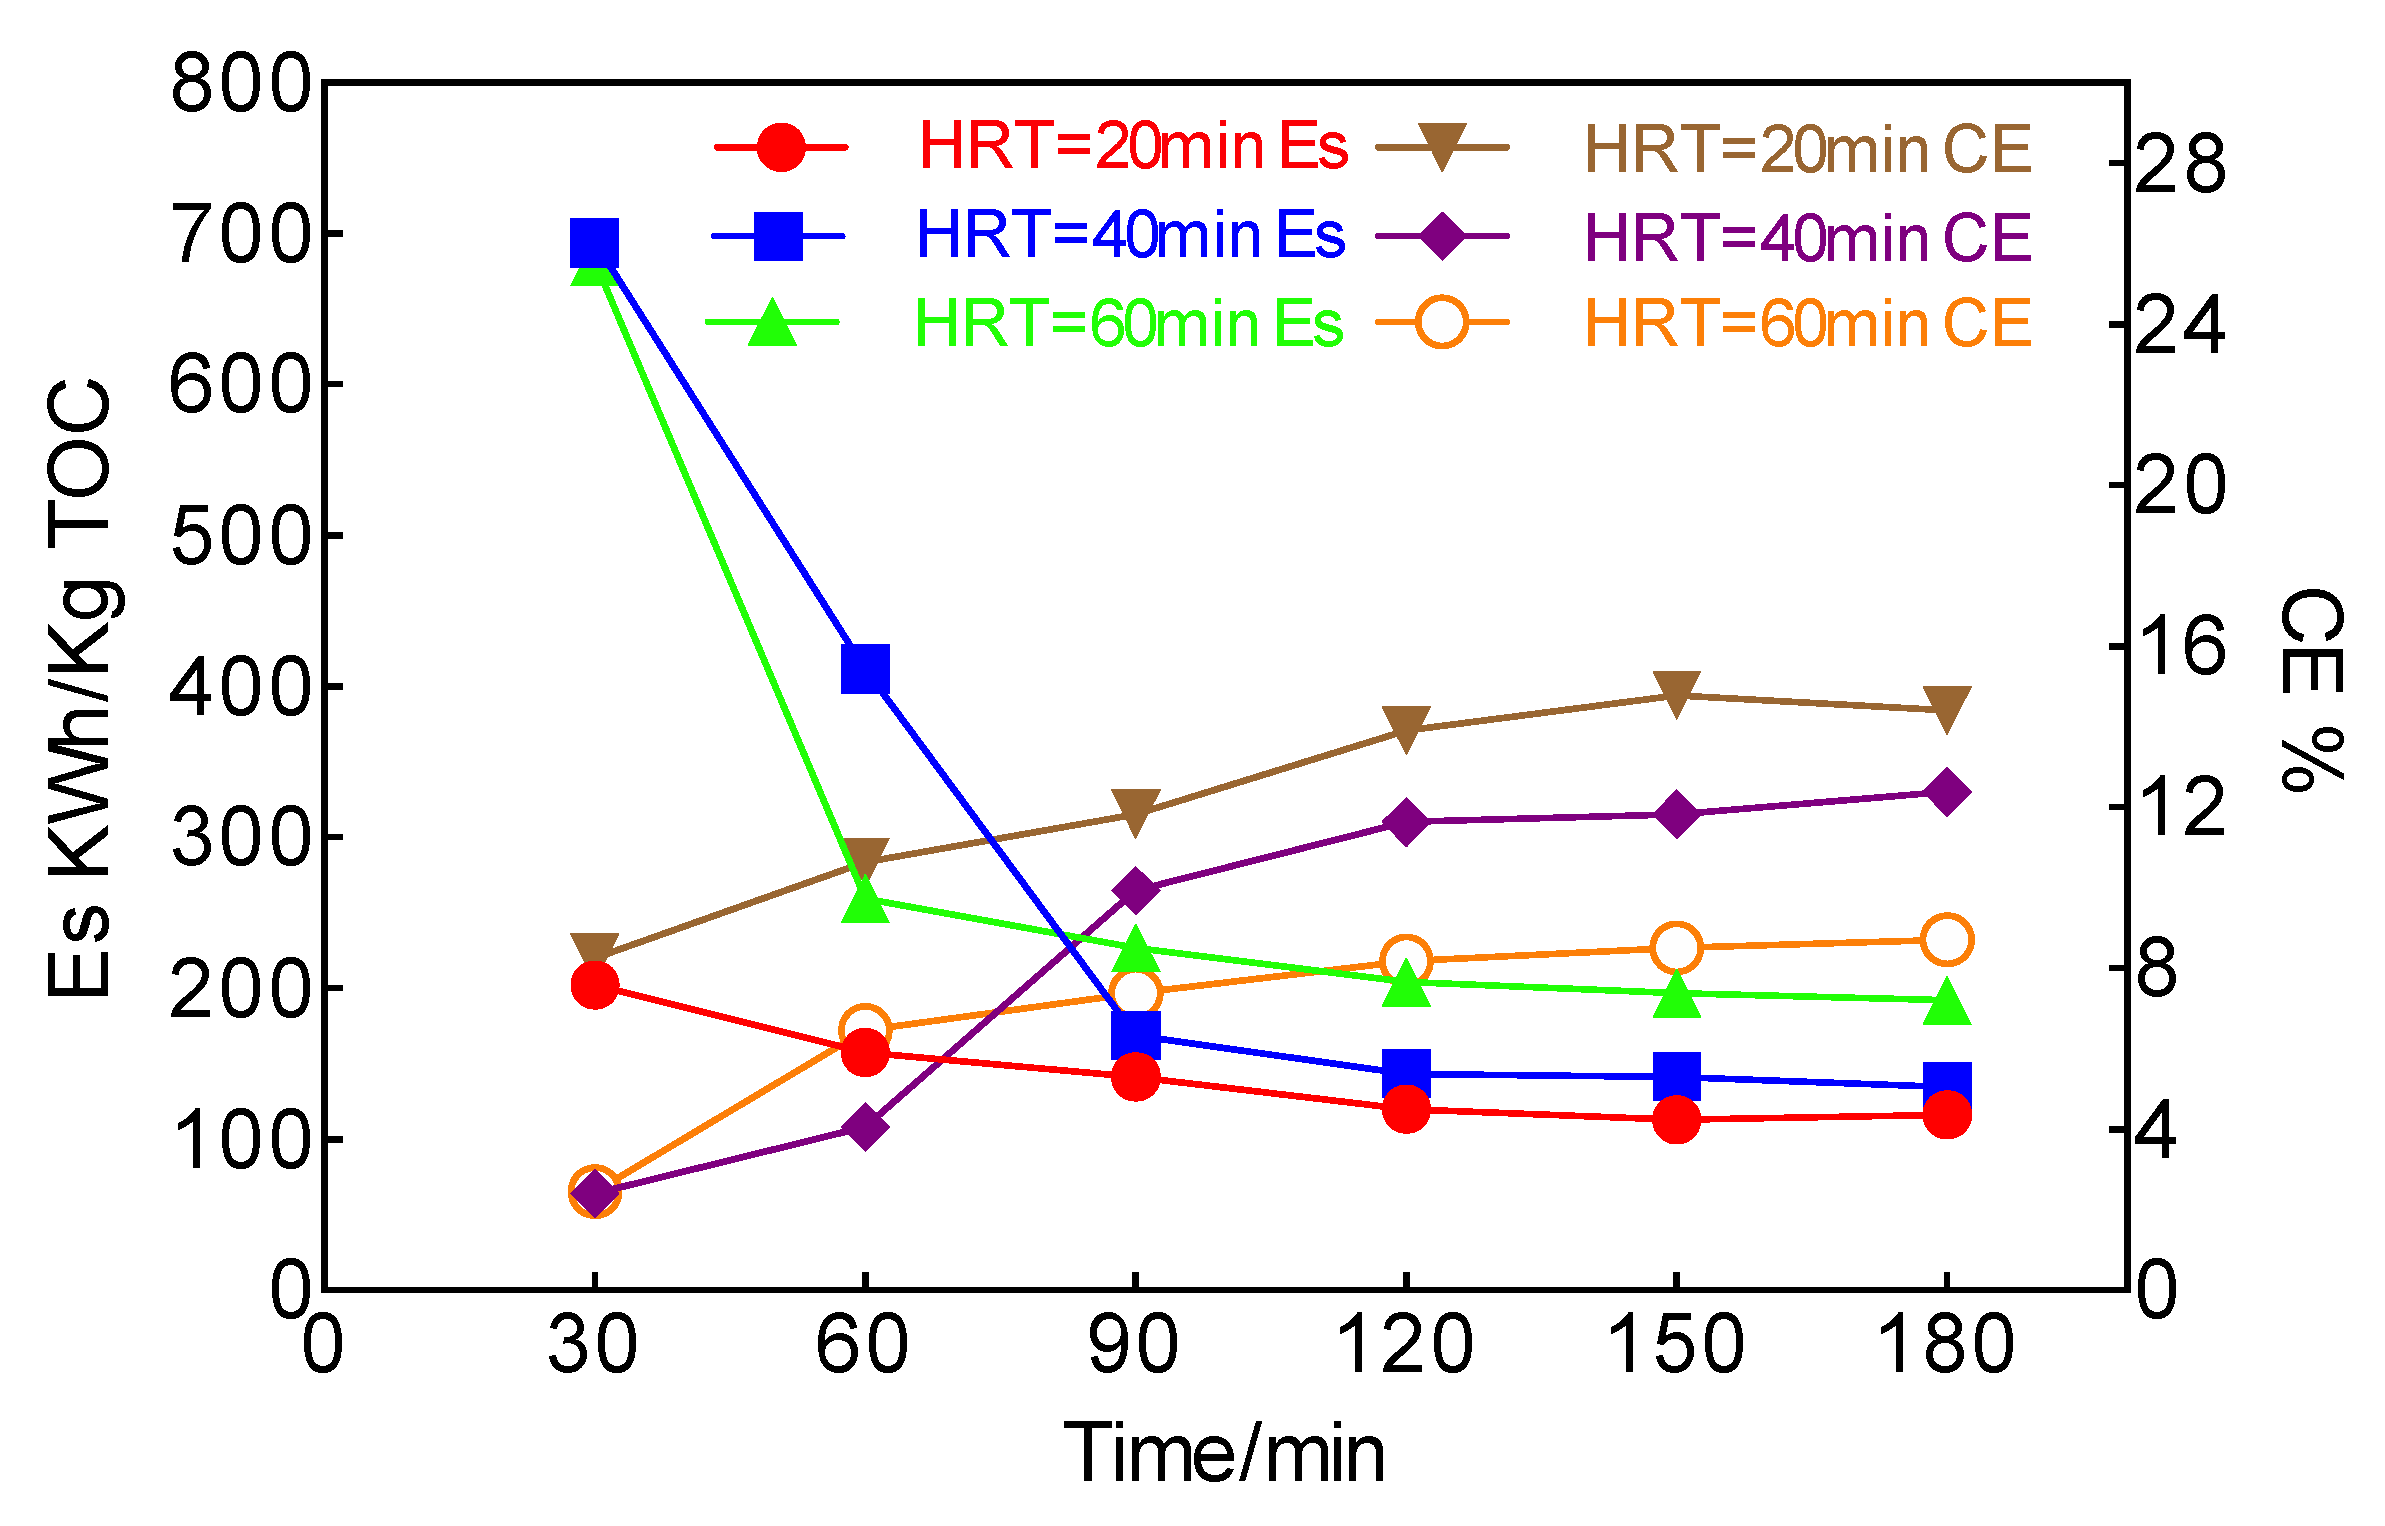
3.4. Mechanism of TOC and COD Degradation at Different HRTs in the Recycling-Flow Electro-Reactor System

HRT refers to the residence time of wastewater in the reactor, which can be calculated according to the following equation [45]:
  H R T = V Q
where V is the reactor volume or pool capacity and Q is the influent flow rate.
In this experiment, the flow rate was controlled by operating the pumps in order to study the effect of HRT on the degradation of RhB wastewater.
COD removal curves were almost growing coincidently at different HRTs (20 min, 40 min, and 60 min), as illustrated in Figure 11. Finally, COD removal (86.9%,) at HRT = 20 min was slightly higher than the corresponding values at HRT = 40 min (80.1%) and HRT = 60 min (83.4%). This indicated that HRT had little effect on the degradation of COD in the RhB wastewater.
TOC removal at different HRTs (20 min, 40 min, and 60 min) gradually increased and then reached the maximum value at the 180th min. The highest TOC removal (85.0%) at HRT = 60 min was 13.8% and 6.8% higher than the corresponding value (71.2% and 78.2%) at HRT = 20 min and HRT = 40 min, respectively. In the comparisons of TOC removal, it can be concluded that HRT = 60 min had a better removal effect.
However, HRT is equal to V/Q and the pool capacity of HRT = 60 min is three times that of HRT = 20 min, which means that the construction cost must be more, as the influent flow rate is constant. In addition, the initial concentration of RhB wastewater was 100 mg/L and the corresponding COD was 215 mg/L. The final COD removal (86.9%) at HRT = 20 min was that of the COD of the effluent, which was 28.2 mg/L after treatment, which reached the Grade A standard (< 50 mg/L) of the Pollutant Discharge Standard for Urban Sewage Treatment Plants [46]. In summary, HRT = 20 min, with less construction cost, is the optimal HRT.
The CE at HRT = 20 min (8.3–14.8%) was always higher than that at HRT = 40 min (CE: 2.4–12.4%) and HRT = 60 min (CE: 2.5–8.7%), as shown in Figure 12. The maximum CE (14.8%) at HRT = 20 min was 1.2 times and 1.7 times the corresponding values at HRT = 40 min (12.4%) and HRT = 60 min (8.7%), respectively. From the perspective of Es, Es at HRT = 20 min was always lower than that at HRT = 40 min and HRT = 60 min, and the minimum Es at HRT = 20 min, 40 min, and 60 min were 116.3 KW·h/kg TOC, 135.3 KW·h/kg TOC, and 192.4 KW·h/kg TOC, respectively.

4. Conclusions

In conclusion, CGAC, as micro-electrodes between anodic and cathodic electrodes in the recycling-flow 3D electro-reactor system, generated an obviously characteristic peak of anodic catalytic oxidation, increased the mass transfer rate and EASA by 40%, and rapidly produced 1.52 times more ·OH on the surface of CGAC electrodes so that the TOC and COD removal of RhB wastewater were both approximately double the corresponding values in the recycling-flow 2D electro-reactor system after 3 h of treatment in the same experimental conditions, with higher a CE and lower Es.
Treating RhB wastewater in the recycling-flow 3D electro-reactor system, Na2SO4 as an electrolyte was more beneficial for TOC degradation, and got higher CE and lower Es, in long electrolyzing times (more than 75 min and less than 180 min). On the contrary, NaCl as an electrolyte could improve COD removal more, and get higher a CE and lower Es in short electrolyzing times (less than 75 min). Plus, TOC and COD removal were the best in the proper voltage (5 V), not the highest one or lowest one. Normally, the higher the voltage, the lower the CE and the more the Es. The HRT condition had little effect on COD removal but high HRT was good for TOC degradation.

Author Contributions

Data curation, J.N., H.S. and Y.X.; Writing—original draft, J.N.; Writing—review and editing, Supervision, Resources, Q.W. All authors have read and agreed to the published version of the manuscript.

Funding

This research received no external funding.

Acknowledgments

The authors appreciate the constructive suggestions from reviewers and editors that helped improve this paper and the support from National Environmental and Energy Base for International Science and Technology Cooperation.

Conflicts of Interest

The authors declare no conflict of interest.

References

  1. Shannon, M.A.; Bohn, P.W.; Elimelech, M.; Georgiadis, J.G.; Marinas, B.J.; Mayes, A.M. Science and technology for water purification in the coming decades. Nature 2008, 452, 301–310. [Google Scholar] [CrossRef]
  2. Holkar, C.R.; Jadhav, A.J.; Pinjari, D.V.; Mahamuni, N.M.; Pandit, A.B. A critical review on textile wastewater treatments: Possible approaches. J. Environ. Manag. 2016, 182, 351–366. [Google Scholar] [CrossRef]
  3. Massoud, M.A.; Tarhini, A.; Nasr, J.A. Decentralized approaches to wastewater treatment and management: Applicability in developing countries. J. Environ. Manag. 2009, 90, 652–659. [Google Scholar] [CrossRef]
  4. Naumczyka, J.H.; Kucharskab, M.A.; Ładyńskab, J.A.; Wojewódkaa, D. Electrochemical oxidation process in application to raw and biologically pre-treated tannery wastewater. Desalin. Water Treat. 2019, 162, 166–175. [Google Scholar] [CrossRef]
  5. Cui, M.-H.; Gao, J.; Wang, A.-J.; Sangeetha, T. Azo dye wastewater treatment in a bioelectrochemical-aerobic integrated system: Effect of initial azo dye concentration and aerobic sludge concentration. Desalin. Water Treat. 2019, 165, 314–320. [Google Scholar] [CrossRef]
  6. Zhao, R.; Zhao, H.; Dimassimo, R.; Xu, G. Pilot scale study of sequencing batch reactor (sbr) retrofit with integrated fixed film activated sludge (ifas): Nitrogen removal and design consideration. Environ. Sci. Water Res. Technol. 2018, 4, 569–581. [Google Scholar] [CrossRef]
  7. Kim, S.; Kim, J.; Kim, S.; Lee, J.; Yoon, J. Electrochemical lithium recovery and organic pollutant removal from industrial wastewater of a battery recycling plant. Environ. Sci. Water Res. Technol. 2018, 4, 175–182. [Google Scholar] [CrossRef]
  8. Soares, P.A.; Batalha, M.; Souza, S.M.A.G.U.; Boaventura, R.A.R.; Vilar, V.J.P. Enhancement of a solar photo-fenton reaction with ferric-organic ligands for the treatment of acrylic-textile dyeing wastewater. J. Environ. Manag. 2015, 152, 120–131. [Google Scholar] [CrossRef] [PubMed]
  9. Jorfi, S.; Barzegar, G.; Ahmadi, M.; Soltani, R.D.C.; Takdastan, A.; Saeedi, R.; Abtahi, M. Enhanced coagulation-photocatalytic treatment of acid red 73 dye and real textile wastewater using uva/synthesized mgo nanoparticles. J. Environ. Manag. 2016, 177, 111–118. [Google Scholar] [CrossRef] [PubMed]
  10. Le Luua, T.; Tiena, T.T.; Duongb, N.B.; Phuongb, N.T.T. Study of the treatment of tannery wastewater after biological pretreatment by using electrochemical oxidation on bdd/ti anode. Desalin. Water Treat. 2019, 137, 194–201. [Google Scholar] [CrossRef]
  11. Li, X.; Zhu, W.; Wang, C.; Zhang, L.; Qian, Y.; Xue, F.; Wu, Y. The electrochemical oxidation of biologically treated citric acid wastewater in a continuous-flow three-dimensional electrode reactor (ctder). Chem. Eng. J. 2013, 232, 495–502. [Google Scholar] [CrossRef]
  12. Zhang, C.; Jiang, Y.; Li, Y.; Hu, Z.; Zhou, L.; Zhou, M. Three-dimensional electrochemical process for wastewater treatment: A general review. Chem. Eng. J. 2013, 228, 455–467. [Google Scholar] [CrossRef]
  13. Feng, Y.; Yang, L.; Liu, J.; Logan, B.E. Electrochemical technologies for wastewater treatment and resource reclamation. Environ. Sci. Water Res. Technol. 2016, 2, 800–831. [Google Scholar] [CrossRef]
  14. Yousefi, Z.; Zafarzadeh, A.; Mohammadpour, R.A.; Zarei, E.; Mengelizadeh, N.; Ghezel, A. Electrochemical removal of acid red 18 dye from synthetic wastewater using a three-dimensional electrochemical reactor. Desalin. Water Treat. 2019, 165, 352–361. [Google Scholar] [CrossRef]
  15. Liu, Y.; Yu, Z.; Hou, Y.; Peng, Z.; Wang, L.; Gong, Z.; Zhu, J.; Su, D. Highly efficient pd-fe/ni foam as heterogeneous fenton catalysts for the three-dimensional electrode system. Catal. Commun. 2016, 86, 63–66. [Google Scholar] [CrossRef] [Green Version]
  16. Qiying, L.; Hongyu, S.; Xibo, L.; Junwu, X.; Fei, X.; Limin, L.; Jun, L.; Shuai, W. Ultrahigh capacitive performance of three-dimensional electrode nanomaterials based on α -mno 2 nanocrystallines induced by doping au through Å-scale channels. Nano Energy 2016, 21, 39–50. [Google Scholar]
  17. Yu, X.; Hua, T.; Liu, X.; Yan, Z.; Xu, P.; Du, P. Nickel-based thin film on multiwalled carbon nanotubes as an efficient bifunctional electrocatalyst for water splitting. Acs Appl. Mater. Interfaces 2014, 6, 15395–15402. [Google Scholar] [CrossRef]
  18. Yu, X.; Sun, Z.; Yan, Z.; Xiang, B.; Liu, X.; Du, P. Direct growth of porous crystalline nico2o4 nanowire arrays on a conductive electrode for high-performance electrocatalytic water oxidation. J. Mater. Chem. A 2014, 2, 20823–20831. [Google Scholar] [CrossRef]
  19. Yu, X.; Xu, P.; Hua, T.; Han, A.; Liu, X.; Wu, H.; Du, P. Multi-walled carbon nanotubes supported porous nickel oxide as noble metal-free electrocatalysts for efficient water oxidation. Int. J. Hydrog. Energy 2014, 39, 10467–10475. [Google Scholar] [CrossRef]
  20. Wu, W.; Huang, Z.H.; Lim, T.T. Enhanced electrochemical oxidation of phenol using hydrophobic tio2-nts/sno2-sb-ptfe electrode prepared by pulse electrodeposition. RSC Adv. 2015, 5, 32245–32255. [Google Scholar] [CrossRef]
  21. Li, X.; Wu, Y.; Zhu, W.; Xue, F.; Qian, Y.; Wang, C. Enhanced electrochemical oxidation of synthetic dyeing wastewater using sno 2 -sb-doped tio 2 -coated granular activated carbon electrodes with high hydroxyl radical yields. Electrochim. Acta 2016, 220, 276–284. [Google Scholar] [CrossRef]
  22. Liu, W.; Ai, Z.; Zhang, L. Design of a neutral three-dimensional electro-fenton system with foam nickel as particle electrodes for wastewater treatment. J. Hazard. Mater. 2012, 243, 257–264. [Google Scholar] [CrossRef] [PubMed]
  23. Chen, J.-y.; Li, N.; Zhao, L. Three-dimensional electrode microbial fuel cell for hydrogen peroxide synthesis coupled to wastewater treatment. J. Power Sources 2014, 254, 316–322. [Google Scholar] [CrossRef]
  24. Hao, R.; Li, S.; Li, J.; Meng, C. Denitrification of simulated municipal wastewater treatment plant effluent using a three-dimensional biofilm-electrode reactor: Operating performance and bacterial community. Bioresour. Technol. 2013, 143, 178–186. [Google Scholar] [CrossRef]
  25. Neti, N.R.; Misra, R. Efficient degradation of reactive blue 4 in carbon bed electrochemical reactor. Chem. Eng. J. 2012, 184, 23–32. [Google Scholar] [CrossRef]
  26. Pang, T.; Wang, Y.; Yang, H.; Wang, T.; Cai, W. Dynamic model of organic pollutant degradation in three dimensional packed bed electrode reactor. Chemosphere 2018, 206, 107–114. [Google Scholar] [CrossRef]
  27. Liu, Z.; Wang, F.; Li, Y.; Xu, T.; Zhu, S. Continuous electrochemical oxidation of methyl orange waste water using a three-dimensional electrode reactor. J. Environ. Sci. 2011, 23, S70–S73. [Google Scholar] [CrossRef]
  28. Zheng, T.; Wang, Q.; Shi, Z.; Fang, Y.; Shi, S.; Wang, J.; Wu, C. Advanced treatment of wet-spun acrylic fiber manufacturing wastewater using three-dimensional electrochemical oxidation. J. Environ. Sci. 2016, 50, 21–31. [Google Scholar] [CrossRef]
  29. Zhao, H.Z.; Sun, Y.; Xu, L.N.; Ni, J.R. Removal of acid orange 7 in simulated wastewater using a three-dimensional electrode reactor: Removal mechanisms and dye degradation pathway. Chemosphere 2010, 78, 46–51. [Google Scholar] [CrossRef]
  30. Wei, L.; Guo, S.; Yan, G.; Chen, C.; Jiang, X. Electrochemical pretreatment of heavy oil refinery wastewater using a three-dimensional electrode reactor. Electrochim. Acta 2010, 55, 8615–8620. [Google Scholar] [CrossRef]
  31. Jung, K.-W.; Hwang, M.-J.; Park, D.-S.; Ahn, K.-H. Performance evaluation and optimization of a fluidized three-dimensional electrode reactor combining pre-exposed granular activated carbon as a moving particle electrode for greywater treatment. Sep. Purif. Technol. 2015, 156, 414–423. [Google Scholar] [CrossRef]
  32. Chi, Z.; Wang, Z.; Liu, Y.; Yang, G. Preparation of organosolv lignin-stabilized nano zero-valent iron and its application as granular electrode in the tertiary treatment of pulp and paper wastewater. Chem. Eng. J. 2018, 331, 317–325. [Google Scholar] [CrossRef]
  33. Can, W.; Yao-Kun, H.; Qing, Z.; Min, J. Treatment of secondary effluent using a three-dimensional electrode system: Cod removal, biotoxicity assessment, and disinfection effects. Chem. Eng. J. 2014, 243, 1–6. [Google Scholar] [CrossRef]
  34. Li, X.-Y.; Xu, J.; Cheng, J.-P.; Feng, L.; Shi, Y.-F.; Ji, J. Tio2-sio2/gac particles for enhanced electrocatalytic removal of acid orange 7 (ao7) dyeing wastewater in a three-dimensional electrochemical reactor. Sep. Purif. Technol. 2017, 187, 303–310. [Google Scholar] [CrossRef]
  35. Zhang, B.; Hou, Y.; Yu, Z.; Liu, Y.; Huang, J.; Qian, L.; Xiong, J. Three-dimensional electro-fenton degradation of rhodamine b with efficient fe-cu/kaolin particle electrodes: Electrodes optimization, kinetics, influencing factors and mechanism. Sep. Purif. Technol. 2019, 210, 60–68. [Google Scholar] [CrossRef]
  36. Chen, H.; Feng, Y.; Suo, N.; Long, Y.; Li, X.; Shi, Y.; Yu, Y. Preparation of particle electrodes from manganese slag and its degradation performance for salicylic acid in the three-dimensional electrode reactor (tde). Chemosphere 2019, 216, 281–288. [Google Scholar] [CrossRef]
  37. He, W.; Ma, Q.; Wang, J.; Yu, J.; Bao, W.; Ma, H.; Amrane, A. Preparation of novel kaolin-based particle electrodes for treating methyl orange wastewater. Appl. Clay Sci. 2014, 99, 178–186. [Google Scholar] [CrossRef]
  38. Zhan, J.; Li, Z.; Yu, G.; Pan, X.; Wang, J.; Zhu, W.; Han, X.; Wang, Y. Enhanced treatment of pharmaceutical wastewater by combining three-dimensional electrochemical process with ozonation to in situ regenerate granular activated carbon particle electrodes. Sep. Purif. Technol. 2019, 208, 12–18. [Google Scholar] [CrossRef]
  39. Nidheesh, P.V.; Gandhimathi, R. Trends in electro-fenton process for water and wastewater treatment: An overview. Desalination 2012, 299, 1–15. [Google Scholar] [CrossRef]
  40. Yu, X.; Zhou, M.; Ren, G.; Ma, L. A novel dual gas diffusion electrodes system for efficient hydrogen peroxide generation used in electro-fenton. Chem. Eng. J. 2015, 263, 92–100. [Google Scholar] [CrossRef]
  41. Wang, C.-T.; Chou, W.-L.; Chung, M.-H.; Kuo, Y.-M. Cod removal from real dyeing wastewater by electro-fenton technology using an activated carbon fiber cathode. Desalination 2010, 253, 129–134. [Google Scholar] [CrossRef]
  42. Wang, C.T.; Hu, J.L.; Chou, W.L.; Kuo, Y.M. Removal of color from real dyeing wastewater by electro-fenton technology using a three-dimensional graphite cathode. J. Hazard. Mater. 2008, 152, 601–606. [Google Scholar] [CrossRef]
  43. Lei, H.; Li, H.; Li, Z.; Li, Z.; Chen, K.; Zhang, X.; Wang, H. Electro-fenton degradation of cationic red x-grl using an activated carbon fiber cathode. Process Saf. Environ. Prot. 2010, 88, 431–438. [Google Scholar] [CrossRef]
  44. Pérez, J.F.; Sabatino, S.; Galia, A.; Rodrigo, M.A.; Llanos, J.; Sáez, C.; Scialdone, O. Effect of air pressure on the electro-fenton process at carbon felt electrodes. Electrochim. Acta 2018, 273, 447–453. [Google Scholar] [CrossRef]
  45. Huang, Z.; Ong, S.L.; Ng, H.Y. Submerged anaerobic membrane bioreactor for low-strength wastewater treatment: Effect of hrt and srt on treatment performance and membrane fouling. Water Res. 2011, 45, 705–713. [Google Scholar] [CrossRef] [PubMed]
  46. Zhang, Q.H.; Yang, W.N.; Ngo, H.H.; Guo, W.S.; Jin, P.K.; Dzakpasu, M.; Yang, S.J.; Wang, Q.; Wang, X.C.; Ao, D. Current status of urban wastewater treatment plants in china. Environ. Int. 2016, 92, 11–22. [Google Scholar] [CrossRef]
Figure 1. The virtual diagram of the recycling-flow 3D electro-reactor system.
Water 12 01853 g001
Figure 2. Total organic carbon (TOC) and chemical oxygen demand (COD) removal of rhodamine B (RhB) wastewater in the recycling-flow 3D and 2D electro-reactor systems (RhB wastewater initial concentration is 100 mg/L; volume is 500 mL; initial pH is 7; Na2SO4 as an electrolyte, initial concentration is 2 g/L; voltage is 5 V; hydraulic retention time (HRT) is 20 min).
Water 12 01853 g002
Figure 3. Cyclic voltammograms of the 3D and 2D electro-reactors in a 50 mmol/L K4Fe(CN)6 + 0.45 mol/L Na2SO4 solution at different scan rates. (a) 3D electro-reactor, (b) 2D electro-reactor. Insets show the plots of the peak current vs. the square root of the scan rate.
Water 12 01853 g003
Figure 4. Dimenthyl,1-pyrroline-N-oxide (DMPO) spin trapping the electron paramagnetic resonance (EPR) spectra of hydroxyl radicals (OH) in the 3D and 2D electro-reactors.
Water 12 01853 g004
Figure 5. Energy consumption (Es) and current efficiency (CE) of the recycling-flow 3D and 2D electro-reactor systems (RhB wastewater initial concentration is 100 mg/L; volume is 500 mL; initial pH is 7, Na2SO4 as an electrolyte, initial concentration is 2 g/L; voltage is 5 V; HRT is 20 min; current density is 60 mA/cm2).
Water 12 01853 g005
Figure 6. TOC and COD removal of RhB wastewater in the recycling-flow 3D electro-reactor system (NaCl and Na2SO4 as electrolytes, initial concentration is 2 g/L; RhB wastewater initial concentration is 100 mg/L; volume is 500 mL; initial pH is 7; voltage is 7 V; HRT is 20 min).
Water 12 01853 g006
Figure 7. Es and CE of the recycling-flow 3D electro-reactor system with NaCl and Na2SO4 as electrolytes (NaCl and Na2SO4 initial concentration is 2 g/L; RhB wastewater initial concentration is 100 mg/L; volume is 500 mL; initial pH is 7; voltage is 7 V; HRT is 20 min; current density is 60 mA/cm2).
Water 12 01853 g007
Figure 8. TOC and COD removal of RhB wastewater with different voltages in the recycling-flow 3D electro-reactor system (RhB wastewater initial concentration is 100 mg/L; volume is 500 mL; initial pH is 7; Na2SO4 as an electrolyte, initial concentration is 2 g/L; HRT is 20 min).
Water 12 01853 g008
Figure 9. The diagram of TOC degradation processes in RhB wastewater with voltages of 7 V and 5 V.
Water 12 01853 g009
Figure 10. Es and CE of the recycling-flow 3D electro-reactor system with different voltages (RhB wastewater initial concentration is 100 mg/L; volume is 500 mL; initial pH is 7; Na2SO4 as an electrolyte, initial concentration is 2 g/L; HRT is 20 min; current density is 60 mA/cm2).
Water 12 01853 g010
Figure 11. TOC and COD removal of RhB wastewater at different HRTs in the recycling-flow 3D electro-reactor system (RhB wastewater initial concentration is 100 mg/L; volume is 500 mL; initial pH is 7; Na2SO4 as an electrolyte, initial concentration is 2 g/L; voltage is 5 V).
Water 12 01853 g011
Figure 12. Es and CE of the recycling-flow 3D electro-reactor system at different HRTs (RhB wastewater initial concentration is 100 mg/L; volume is 500 mL; initial pH is 7; Na2SO4 as an electrolyte, initial concentration is 2 g/L; voltage is 5 V; current density is 60 mA/cm2).
Water 12 01853 g012

