Effects of Land Use Types on CH4 and CO2 Production Potentials in Subtropical Wetland Soils


1
Department of Geography and Resource Management, The Chinese University of Hong Kong, Shatin, New Territories, Hong Kong, China
2
School of Environmental Engineering, Nanjing Institute of Technology, Nanjing 211167, China
3
Global Centre for Environment and Energy, Ahmedabad University, Ahmedabad, Gujarat 380009, India
*
Author to whom correspondence should be addressed.
Water 2020, 12(7), 1856; https://doi.org/10.3390/w12071856
Submission received: 28 May 2020
/
Revised: 24 June 2020
/
Accepted: 25 June 2020
/
Published: 28 June 2020
(This article belongs to the Section Water Quality and Contamination)
Abstract
:Changes in land use types can alter the soil and environmental characteristics of wetlands, which in turn influence the magnitude of greenhouse gas production by soil microbes. However, the effects of land use change on the production potential of methane (CH4) and carbon dioxide (CO2) in subtropical wetland soils and the underlying controls are still largely unknown. In this study, we examined the soil CH4 and CO2 production potentials under five different land use types (natural mangrove, Gei Wai water channel, Gei Wai forest, reedbed, and freshwater pond) and their relationships with soil physico-chemical properties in a subtropical wetland in Hong Kong using aerobic and anaerobic laboratory incubation experiments. Our results showed an overall decreasing trend of CH4 and CO2 production potentials down the soil profile at all sites, which could be attributed to a reduction in the concentrations of soil organic matter (SOM), total Kjeldahl nitrogen (TKN) and ammonium nitrogen (NH4+-N). Moreover, the soil CH4 and CO2 production potentials varied significantly in the surface soils among land use types, but were more similar across the sites in the deeper soils. The conversion of natural mangrove to other land use types significantly reduced both the aerobic and anaerobic CO2 production potentials in the top 10 cm soils, except for Gei Wai forest, which demonstrated significantly higher CO2 production rates (61.15–97.91 μg g−1 day−1). Meanwhile, the mean CH4 production potential in the surface soils of natural mangrove (0.05 μg g−1 d−1) was significantly lower than that in the Gei Wai forest and Gei Wai channel (0.26–0.27 μg g−1 day−1) but slightly higher than that in the freshwater pond and reedbed (0.00–0.02 μg g−1 day−1). The high soil CH4 and CO2 production potentials observed in the Gei Wai forest could be explained by the high soil concentrations of SOM, TKN and NH4+-N. On the other hand, the lower anaerobic CH4 and aerobic CO2 productions observed in the reedbed could be attributed to the lower concentrations of NH4+-N and available phosphorus. Our findings highlighted the significant impacts of land use types on the CH4 and CO2 production potentials of subtropical wetland soils, which had practical implications for wetland management for climate change mitigation.
1. Introduction
Carbon dioxide (CO2) and methane (CH4) are potent greenhouse gases (GHGs) in the atmosphere that can contribute significantly to global climate change. Wetlands, as the single largest natural CH4 source, account for over 30% of the global CH4 emissions and hence should not be neglected [1]. The net CH4 emission rate from wetlands depends on the balance between CH4 production, oxidation, and transport (including diffusion, ebullition, and plant-mediated transport) [2]. CH4 production in wetlands is predominantly caused by the anaerobic decomposition of organic matter originated from root exudates, crop residues, and dead photosynthetic biomass [2]. CH4 can be produced by methanogens using various substrates, such as CO2/H2 and acetate [3]. The magnitude of soil CH4 production depends on various factors including pH, temperature, and the availability of substrate, oxygen, and other alternative electron acceptors [4,5,6,7]. Most of the methanogens are known to grow within a narrow pH range of 6–8 [8], while the optimum pH for CH4 production in the temperate and subarctic peat is found to range between 5.5 and 7.0 [9]. In a northern fen, a drop in pH from 7 to 5.5 caused a significant decrease in CH4 production rate [7]. Numerous studies have shown a positive relationship between temperature and the rates of respiration and methanogenesis under both aerobic and anaerobic conditions [7,9,10,11,12,13]. Coles and Yavitt [14] found an increase in CH4 production rates following the addition of carbon substrates (e.g., glucose, ethanol and acetate) to forested fen peat samples, which indicated substrate availability was a limiting factor of CH4 production. Meanwhile, an increase in sulfate concentration and salinity can suppress methanogenesis, as sulfate-reducing bacteria can outcompete methanogens for the energy sources [15]. Nitrate nitrogen has been shown to increase the soil redox potential and decrease CH4 production [16], while higher anaerobic CH4 production rate was observed in peatlands with higher soil organic carbon (SOC) and nitrogen (N) concentrations [17].
Soil CO2 production can occur during organic matter decomposition under both aerobic and anaerobic conditions as the wetland is exposed to air and flooded by water, respectively. CO2 production potential is affected by various soil and environmental parameters, such as temperature, water table, oxygen, soil organic matter, and pH [18,19,20]. Inglett, Inglett, Reddy and Osborne [13] reported Q10 values of anaerobic and aerobic soil CO2 production in a subtropical freshwater marsh ranging between 1.3 and 2.5, and 1.4 and 2.2, respectively, illustrating the positive role of temperature on CO2 production. Bergman, et al. [21] also found that both aerobic and anaerobic CO2 production of peat samples significantly increased in response to a rise in temperature from 7 to 25 °C. Kim, et al. [22] showed that soil CO2 production in boreal forests and peatlands was higher under non-flooded than flooded conditions owing to the greater oxygen availability. Soil organic matter quality is another important factor governing CO2 production by affecting the substrate supply to microbes. A previous study has shown that the addition of glucose, a highly labile carbon compound, could increase CO2 production in peatland soils by 2.9 and 1.5 times under anaerobic and aerobic conditions, respectively [18]. Moreover, a higher soil N concentration was shown to support a higher rate of anaerobic soil CO2 production in peatlands [17].
Land use change can affect the species composition of plant communities and soil physico-chemical properties. Differences in biomass and litterfall among plant species can influence the soil organic C content, and subsequently the rate of soil GHG fluxes [23,24,25]. For instance, the Australian mangroves dominated by Avicennia marina had lower SOC than those dominated by Rhizophora stylosa [23]. In addition, the quality and quantity of root exudates produced by plants can vary between species, leading to differences in substrate supply for methanogenesis. Aulakh, et al. [26] reported that 61–83% of the carbon (C) from root exudates in paddy soils was converted to CH4, indicating the significance of root exudates as a methanogenic substrate. Coastal mangroves in general have a much higher C stock per unit area than terrestrial forests in the tropical, temperate, and boreal regions, owing to their predominantly flooded environment, high primary productivity, and effective trapping of sediments [27]. They have a high ratio of belowground-to-aboveground C mass, with a large proportion of C being stored in dead roots and soils. However, global mangroves have been on a declining trend owing to aquaculture expansion, agricultural development, overharvesting, soil pollution, and climate change [28,29,30]. The net mangrove deforestation rates in the 1990s and in 2000–2005 were 0.72% and 0.66%, respectively [31]. Mangrove degradation and conversion could lead to substantial C losses, since a large quantity of C formerly stored in anaerobic soils are now exposed to aerobic conditions for an accelerated CO2 emission [27]. Mangrove deforestation has resulted in significant C emissions at the rates of 23.5–38.7 Tg year−1 since 2000 [32]. The conversion of mangrove forests to shrimp ponds in Indonesia has resulted in CO2 losses of 4.37 and 1.60 kg CO2 m−2 year−1 from the walls and the floors of the ponds, respectively, to the atmosphere [33]. However, in the long run, the enhancement of soil CO2 production in response to wetland conversion might decrease with time, as continual decomposition of soil organic matter leads to a reduction in SOC concentration. For example, the sediment organic content in the Caribbean mangroves decreased significantly by up to 50% around 8 years after clearing [34]. Lovelock, et al. [35] found that the soil CO2 flux from the mangroves in Belize declined with post-clearing time, from 10,600 to 3000 t km−2 year−1 after one year and 20 years of clearing, respectively.
Coastal wetlands represent about 10% of the total area of natural wetlands in China, covering an area of 5.8 million ha [36]. Mangrove wetlands, which dominate the coastlines in southeast China, contain a large amount of organic matter, and are often highly eutrophic owing to the influence of urbanization and industrialization in the surrounding region [37]. The combination of high soil C stock and nutrient availability could potentially stimulate microbial activities and thus GHG production in soils. While Chen, et al. [38] reported high soil N2O and CO2 fluxes in eutrophic mangroves ranging between 0.1–6.3 mg m−2 day−1 and 1.1–9.3 mg m−2 day−1, respectively, the magnitude of soil greenhouse gas production potential in subtropical eutrophic wetlands and its response to land use change are still largely unknown. Hence, the objectives of this study are to: (1) quantify the anaerobic CH4 and CO2 production and aerobic CO2 production potentials from the soils of a subtropical eutrophic wetland at different depths; (2) examine the impacts of mangrove conversion to other land use types on soil CH4 and CO2 production potentials; and (3) investigate the influence of soil physico-chemical properties on soil CH4 and CO2 production potentials. We hypothesize that: (i) the conversion of natural mangrove to other land use types (i.e., Gei Wai water channel, Gei Wai forest, freshwater pond, and reedbed) will reduce the SOC concentrations and soil CH4 and CO2 production potentials; (ii) the effects of land use change on soil CH4 and CO2 production potential will diminish with soil depth owing to decreasing SOC concentrations; and (iii) the variations in soil CH4 and CO2 production potentials are related to SOC, soil nitrogen concentration, salinity, and water table.
2. Materials and Methods
2.1. Study Site
The study was conducted in the 380-ha Mai Po Marshes Nature Reserve in Hong Kong, China (22°30’ N, 114°01’ E, Figure 1). This region is predominantly affected by a subtropical monsoonal climate, with mean annual temperature and precipitation of 23.3 °C and 2399 mm, respectively [39]. The highest monthly average temperature and rainfall occur during the summer period between June and August. Situated at the mouth of the Pearl River Estuary, this coastal wetland receives tidal water from Deep Bay and fresh water from the nearby Shenzhen and Shan Pui Rivers, and is generally influenced by semi-diurnal tides. Mangrove represents the dominant type of natural vegetation at this site. The soils in the natural mangrove have a depth of over 10 m, and the total C stock in the top 1 m soils is around 14 kg m−2 (unpublished data). During the period between the 1940s and 1990s, around 50% of the natural mangrove forest was converted to several different land use types, such as shrimp ponds (Gei Wais), fish ponds, and reedbed, as a result of anthropogenic activities.
Details about the dominant land use types in this coastal wetland site are as follows:
- (1)
- Mangrove: The natural mangrove is dominated by Kandelia obovata, which forms a continuous belt of approximately 500 m in width and 3 km in length [40]. It represents the original land use type at this site before human disturbances. The tallest K. obovata community in this mangrove has a mean canopy height of 6.5 m, a mean diameter at breast height of 7.6 cm, and a mean tree density of 0.7 m−2 [41];
- (2)
- Gei Wai: The tidal shrimp ponds (locally called Gei Wais) were converted from the natural mangrove in the 1940s. These brackish shrimp ponds, each with a size of around 10 ha, are surrounded by a water channel (~1.5 m deep, 10 m wide) around the four inner edges. Each pond has a central vegetated platform which is dominated by K. obovata (referred to as Gei Wai forest thereafter) and is occasionally flooded, similar to the high intertidal zone of the mangrove [42]. The pond is operated by a sluice gate that controls the water level, stocking of shrimp fries, and harvesting of shrimps;
- (3)
- Reedbed: The reedbeds are dominated by Phragmites australis, and are mostly found in the central platform of some Gei Wais. The reeds became dominant after the tidal Gei Wais were converted to permanently flooded ponds in the 1980s, leading to the drowning of existing mangrove vegetation [42]. The reedbeds in Mai Po now cover a total of 46 ha and is one of the largest in the Guangdong province in southern China [43];
- (4)
- Freshwater pond: It was converted from mangrove vegetation to shrimp pond in the 1940s, and then subsequently to a rain-fed freshwater pond dominated by Scirpus subulatus in 1997 to provide a freshwater habitat for enhancing biodiversity in this coastal wetland.
Table 1 shows the average water table, salinity, and pH values under the five land use types at Mai Po at the time of sample collection.
2.2. Soil Sampling and Incubation
Soil cores in the top 0.5 m were collected in triplicate with a soil corer (1 m long, 10 cm diameter) for each of the five land use types (i.e., Gei Wai forest, Gei Wai water channel, freshwater pond, reedbed and mangrove) at the Mai Po Marshes (Figure 1). These cores were sub-sectioned in the field into four depth intervals, namely 0–10, 10–20, 20–30, and 30–50 cm, kept under 4 °C at field moisture content, and transported to the laboratory immediately for subsequent experiment [19]. The soils from the Gei Wai water channel and freshwater pond were kept with in-situ water for maintaining an anaerobic condition. The triplicate soil samples from each site were homogenized, and the roots and rocks were discarded in the laboratory before the incubation experiments. We conducted aerobic and anaerobic incubations for determining soil CH4 and CO2 production potentials, following the method of Moore and Dalva [19]. For anaerobic incubation, approximately 20 g of wet soils and 50 ml of distilled H2O were placed in 300 ml glass bottles. The bottles were then sealed, evacuated with a vacuum pump, and flushed with O2-free N2 three times. These bottles were incubated anaerobically for 14 days under a temperature of 25 °C. At 0, 1, 3, 5, 7, 9, 11 and 14 days of incubation, 6 ml of headspace air sample was withdrawn from each bottle for the determination of CH4 and CO2 concentrations by gas chromatograph (7890A, Agilent, Santa Clara, CA, USA) [44]. After each sampling, 6 ml of O2-free N2 was added back into the bottle to maintain the same pressure. For aerobic incubation, approximate 20 g of wet soils and 10 ml of distilled H2O were placed in 300 ml glass bottles, and then shaken on a rotary shaker to ensure that no anaerobic micro-sites were developed. The bottles were then flushed with room air and sealed for a total incubation period of 7 days. We collected 6 ml of headspace air sample from each bottle on a daily basis, and then added 6 ml of room air back to each bottle after sampling for pressure equilibration.
2.3. Measurement of Soil Properties
We measured soil temperature, soil moisture, pH, redox potential (Eh), and water level in triplicate for each of the five land use types simultaneously when soil samples were taken for incubation experiments. Soil temperature and moisture were measured with a thermometer (Fluke Corporation, Everett, WA, USA) and a soil moisture probe (HH2, Delta-T devices, Cambridge, UK), respectively. Soil pH and redox potential (Eh) were measured with a digital pH/ORP meter (Eutech Ion6+, Thermo Scientific, Waltham, MA, USA). Soil salinity was measured using a salinity meter (Model 140, Orion Research Inc., Jacksonville, FL, USA). Water table was measured by measuring the height of water inside a perforated PVC tube that was pre-installed into the soil.
We also measured the concentrations of ammonium nitrogen (NH4+-N), nitrate nitrogen (NO3−-N), available phosphorus (P), total Kjeldahl nitrogen (TKN) and soil organic matter (SOM) in the soils at the depths of 0–10, 10–20, 20–30 and 30–50 cm. Soil available P, NH4+-N and NO3−_N were extracted from fresh soils, and their concentrations were determined with a flow injection analyzer (FIA Star 5000, Hillerød, Denmark) following the methods of Black, et al. [45]. TKN was determined with the Kjeldahl method [45]. SOM concentration was determined by loss on ignition by combusting soils at 550 °C for 4 h following the method of Nelson and Sommers [46]. Sulfate concentration in the top 10 cm soils was measured in situ by a plant root simulator (PRS, Western Ag Innovations Inc., Saskatoon, SK, Canada) equipped with a resin membrane that quantified the supply of cations and anions to the rhizosphere over a burial period of two weeks [47].
2.4. Determination of Soil C Fractions
The SOC concentration was determined by the Walkley–Black method as described in Nelson and Sommers [46]. In addition, we measured soil microbial biomass C (MBC), water-soluble carbohydrate C (WSC), readily mineralizable C (RMC), and acid hydrolyzable carbohydrate C (AHC) in the top 10 cm soils. MBC was determined by a modified chloroform fumigation method [48]. WSC was determined using the anthrone method after extracting the soils with 20 ml of deionized hot water at 80 °C for 24 h [49]. RMC was measured by wet digestion with dichromate after extraction with 0.5 M K2SO4 [50,51]. AHC was determined using the anthrone method after extraction with 1.5 M H2SO4 for 24 h [52].
2.5. Statistical Analysis
One-way ANOVA was used to test for significant differences in CH4 and CO2 productions and soil nutrients among land use types at each depth, as well as among depths for each land use type. The data were tested for normality and homogeneity of variance, and log-transformed if necessary. If significant differences were detected, post-hoc Duncan’s multiple range test was further carried out for making multiple comparisons of CH4 and CO2 productions and soil nutrients among land use types or depths. Pearson correlation analysis was also conducted to establish the relationships between soil or environmental parameters and soil CH4 and CO2 productions. All statistical analyses were conducted using SPSS 19.0 for Windows (SPSS Inc., Chicago, IL, USA).
3. Results
3.1. Effects of Land Use Types on CH4 and CO2 Production Potentials
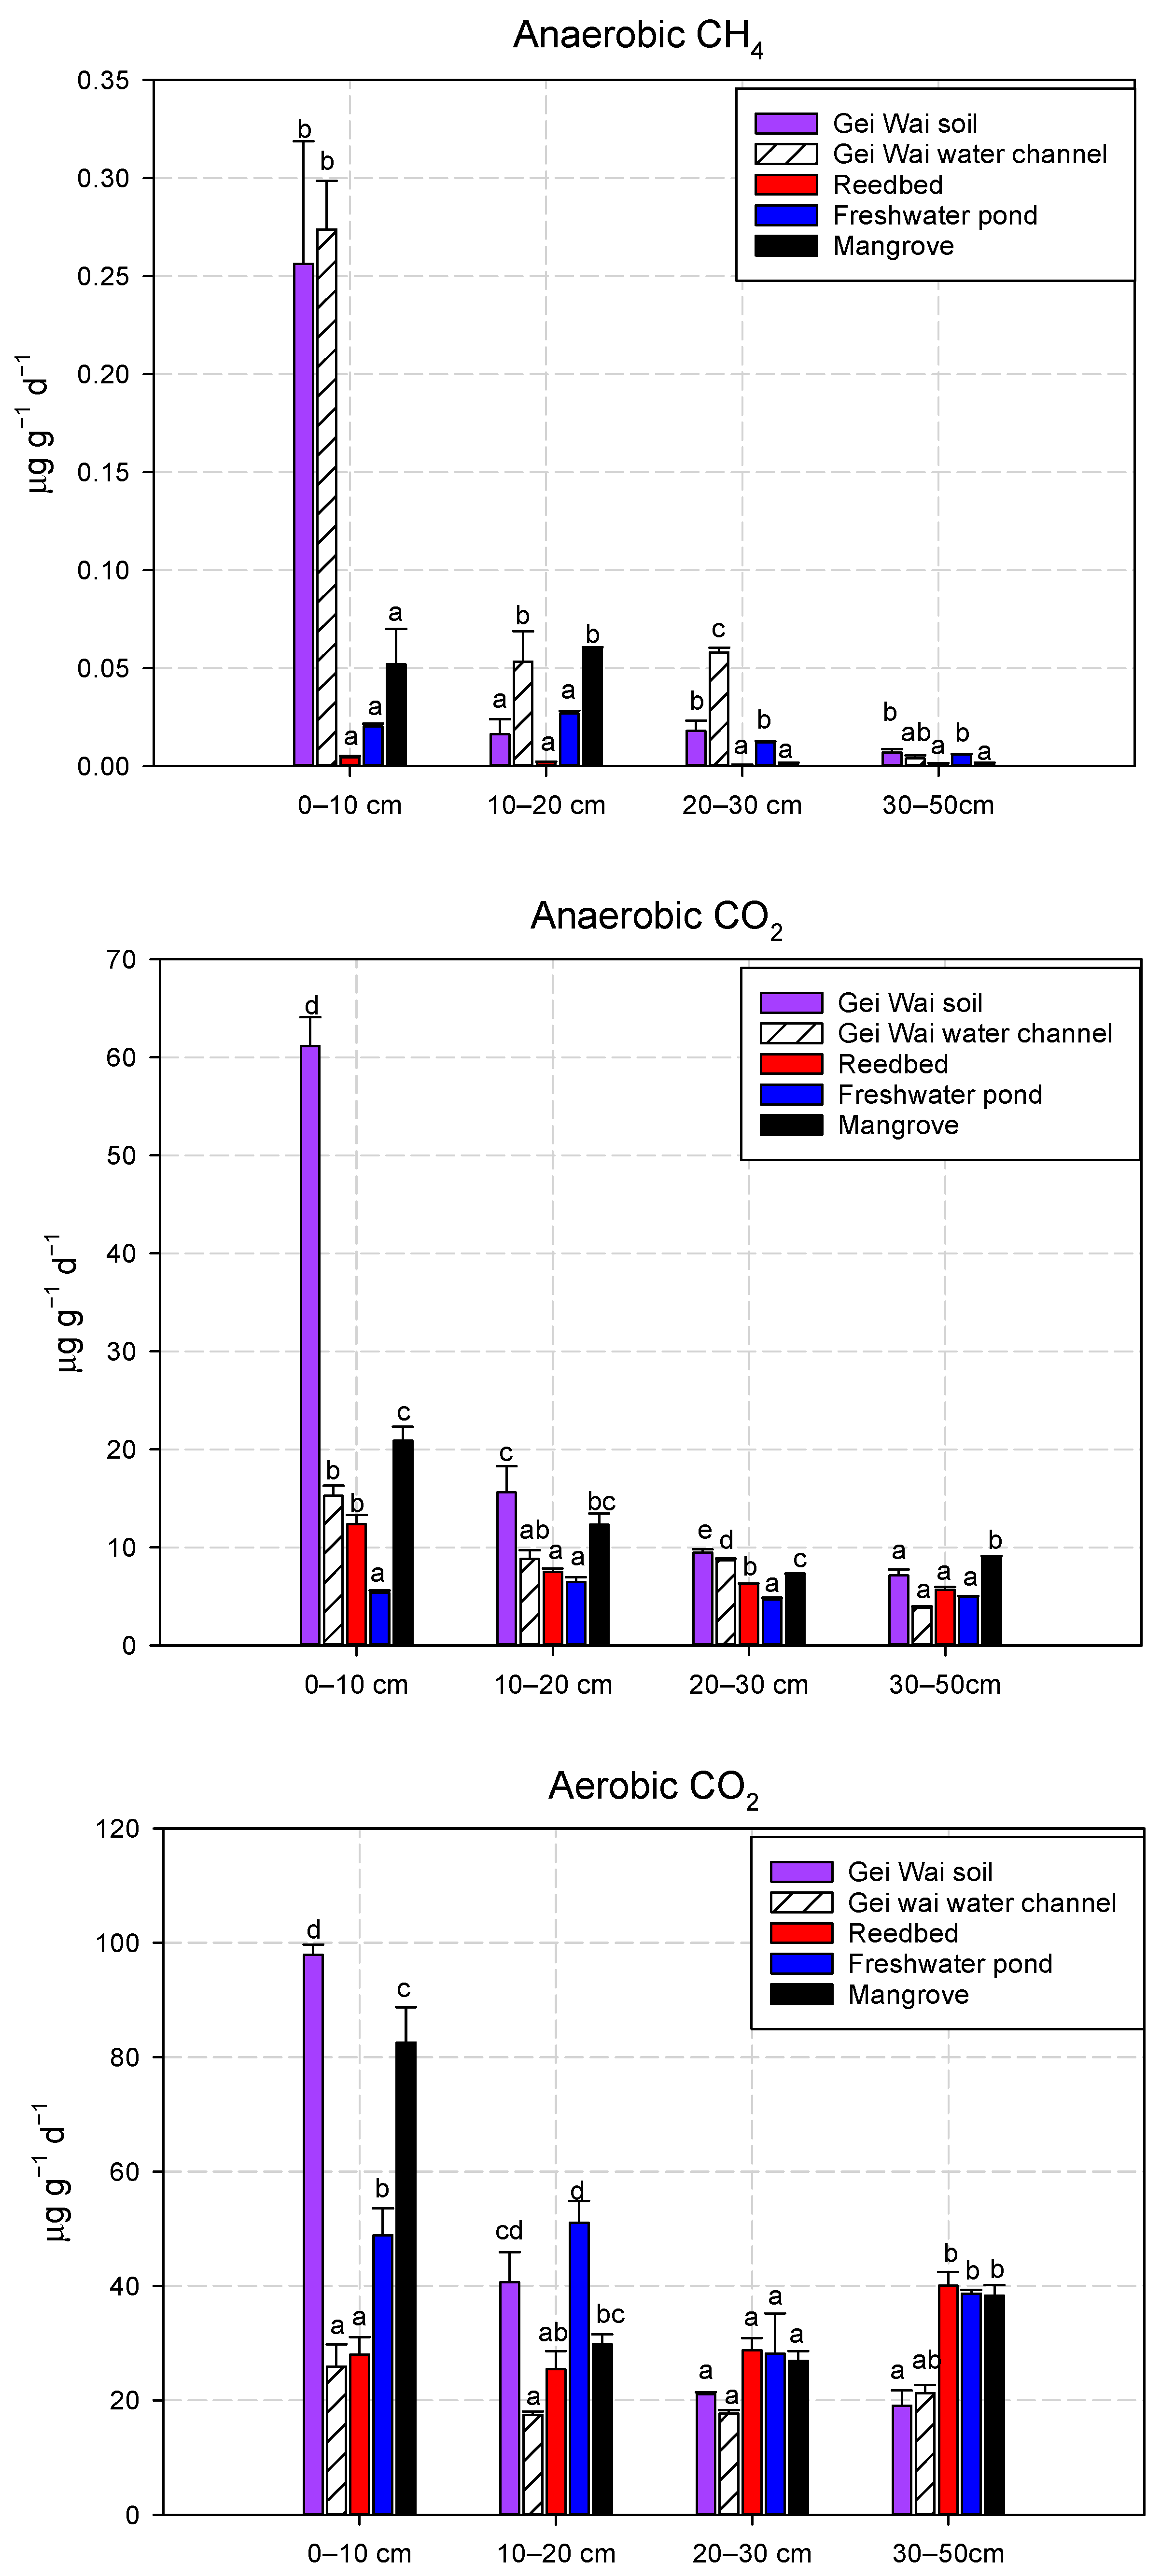
The anaerobic CH4 (an-CH4) production potentials in the top 10 cm soils differed significantly among land use types, with significantly higher values of 0.27 and 0.26 μg g−1 day−1 in the Gei Wai water channel and Gei Wai forest, respectively (Figure 2). The an-CH4 production potentials were much lower in the mangrove, freshwater pond, and reedbed, with mean rates of 0.05, 0.02, and 0.004 μg g−1 day−1, respectively (Figure 2). At a depth of 10–20 cm, the an-CH4 production was significantly higher in the Gei Wai water channel (0.05 μg g−1 day−1) and mangrove (0.06 μg g−1 day−1) than the other three land use types (0.00–0.03 μg g−1 day−1). At a depth of 20–30 cm, the mean an-CH4 production potential was significantly higher in the Gei Wai water channel (0.06 μg g−1 day−1), followed by the Gei Wai forest and freshwater pond (0.01–0.02 μg g−1 day−1). With increasing soil depth, the site differences in an-CH4 production were mitigated in the 30–50 cm soils. At a depth of 30–50 cm, the soil an-CH4 production potentials were generally less than 0.01 μg g−1 day−1, with significantly lower values in the mangrove and reedbed.
Similarly, the anaerobic CO2 (an-CO2) production potentials in the top 10 cm soils showed significant differences among land use types (Figure 2), with significantly higher value (61.14 μg g−1 day−1) in the Gei Wai forest, followed by mangrove (22.23 μg g−1 day−1). Significantly lower mean values of an-CO2 production were found in the reedbed and Gei Wai water channel (12.35–15.25 μg g−1 day−1), while the lowest value was seen in the freshwater pond (5.44 μg g−1 day−1). At a depth of 10–20 cm, the Gei Wai forest and mangrove also showed significantly higher soil an-CO2 production (12.29–15.59 μg g−1 day−1) than the other three land use types. At a depth of 20–30 cm, the mean an-CO2 production potential differed significantly among land use types in the order of: Gei Wai forest > Gei Wai water channel > mangrove > reedbed > freshwater pond. At a depth of 30–50 cm, the effects of land use types on soil CO2 production became weak, with only mangrove showing a significantly higher value (8.95 μg g−1 day−1).
The mean aerobic CO2 (aero-CO2) production potentials in the top 10 cm soils were significantly higher in the Gei Wai forest and mangrove (97.91 μg g−1 day−1 and 82.56 μg g−1 day−1, respectively), followed by the freshwater pond (48.88 μg g−1 day−1). Significantly lower aero-CO2 values were found in the Gei Wai water channel and reedbed (25.89 μg g−1 day−1 and 28.00 μg g−1 day−1, respectively, Figure 2). At a depth of 10–20 cm, the mean soil aero-CO2 production potentials were significantly higher in the Gei Wai forest and freshwater pond (40.64–51.07 μg g−1 day−1) than those in the Gei Wai water channel and reedbed (17.47–25.44 μg g−1 day−1). However, there were no significant differences in mean soil aero-CO2 production rates at a depth of 20–30 cm among land use types. At a depth of 30–50 cm, the mean aero-CO2 production potentials were significantly higher in the reedbed, freshwater pond and mangrove (38.27–40.02 μg g−1 day−1) than in the Gei Wai forest (19.06 μg g−1 day−1).
3.2. Variations of Soil CH4 and CO2 Production Potentials with Depth
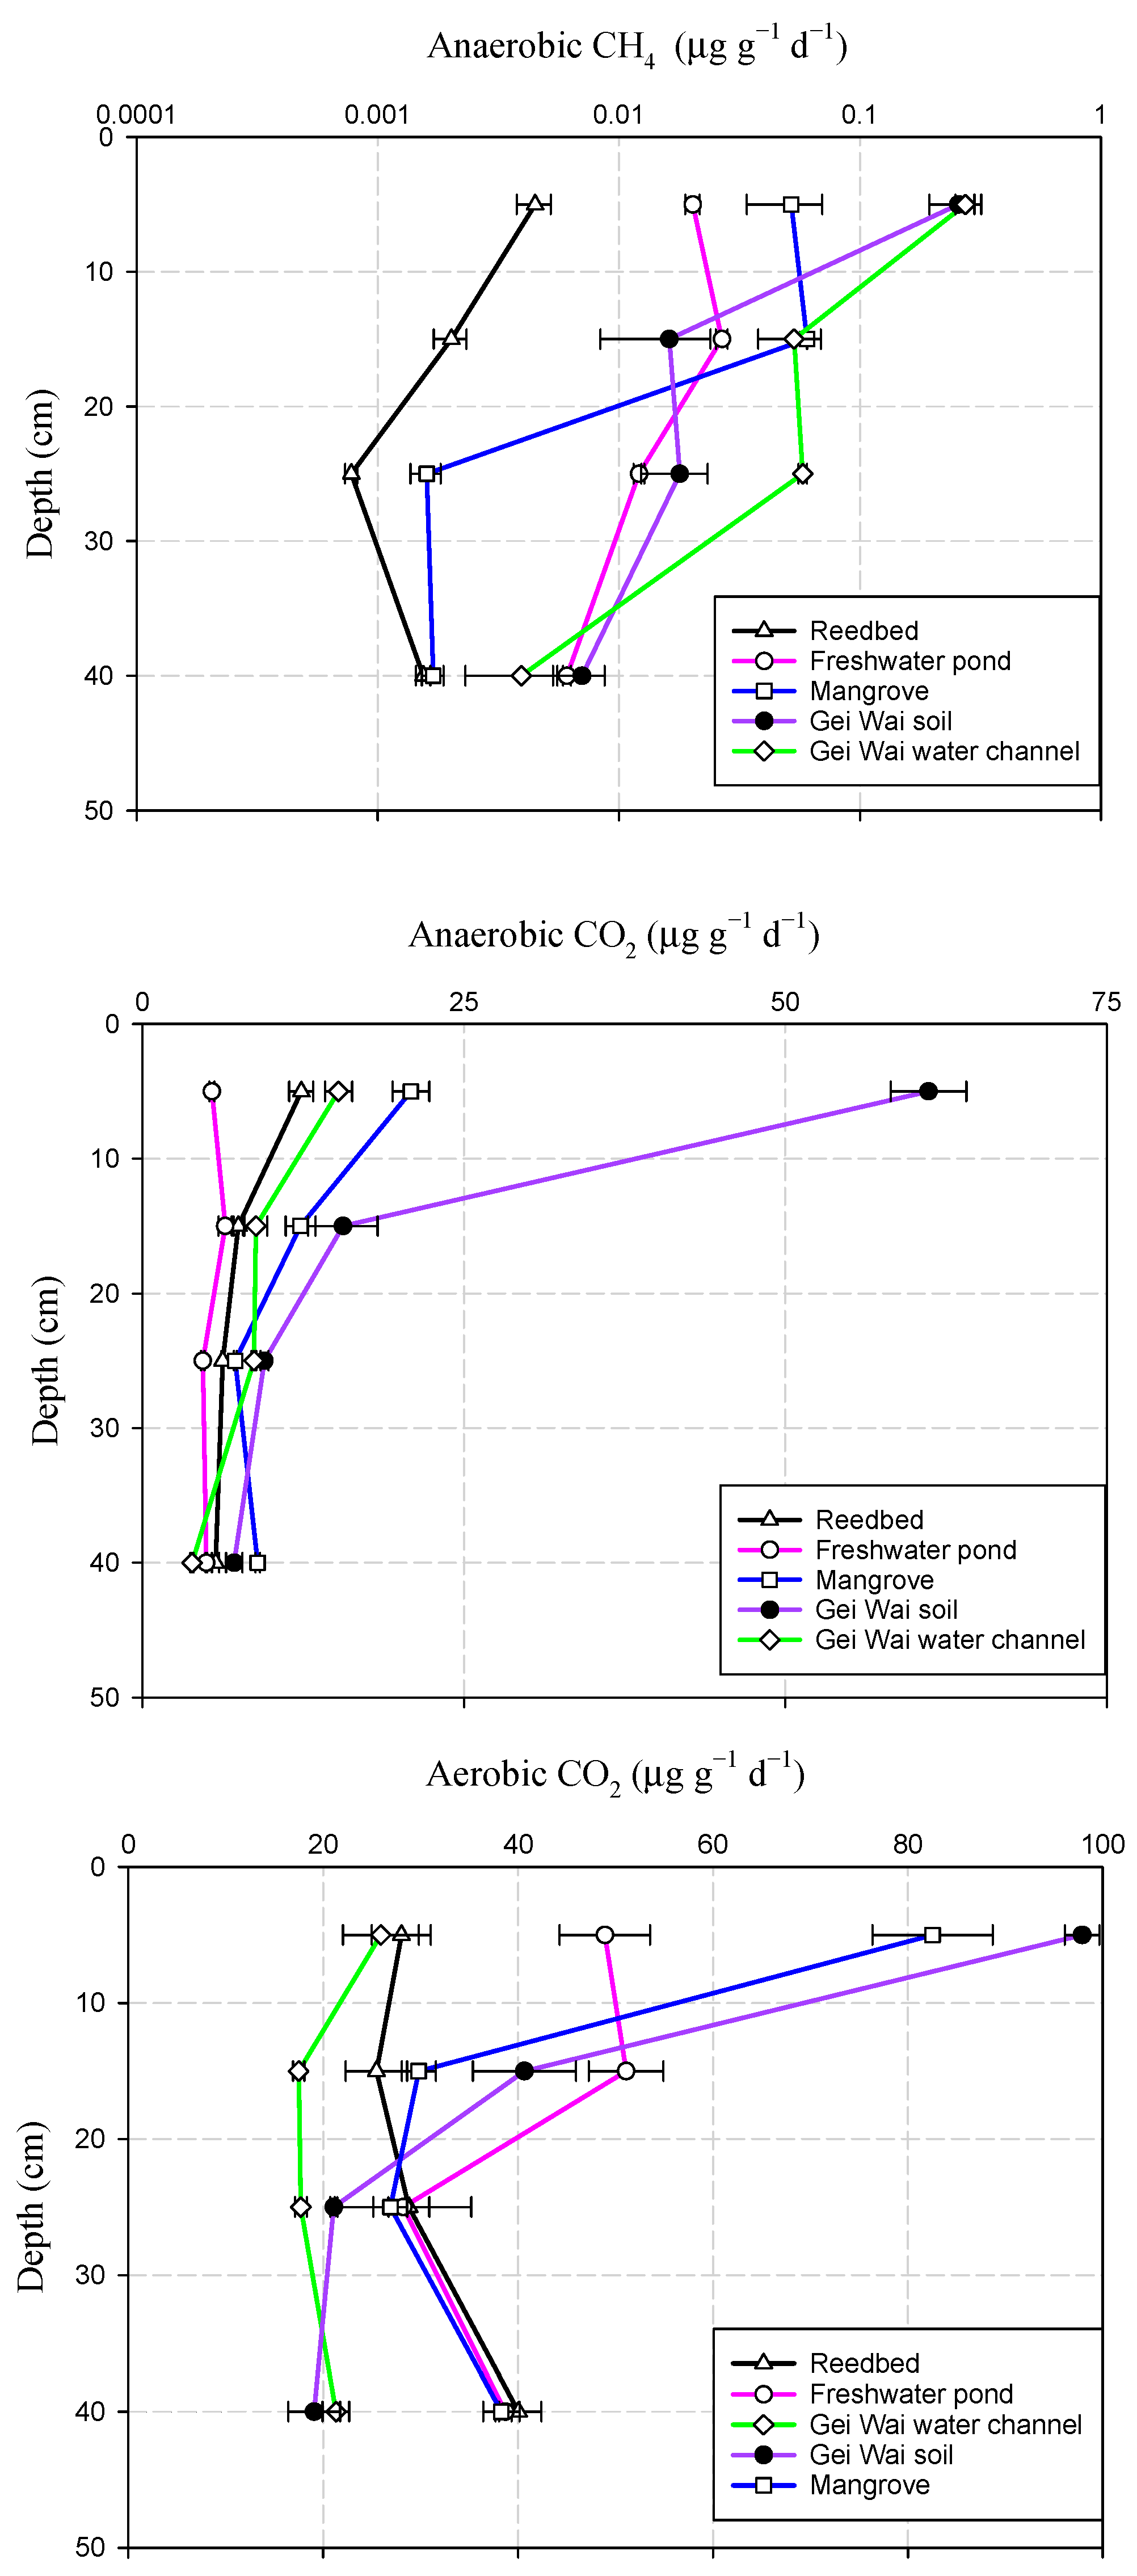
The mean soil an-CH4 production potential showed a decreasing pattern with depth (Figure 3). The highest soil an-CH4 production rates in the reedbed, Gei Wai forest, and Gei Wai water channel were observed in the top 10 cm, while those in the freshwater pond and mangrove sites were seen at a depth of 10–20 cm. On the other hand, the lowest an-CH4 production potentials were found in the deeper soil layers, at a depth of 20–30 cm soil in the reedbed and mangrove, and a depth of 30–50 cm in the freshwater pond, Gei Wai forest, and Gei Wai water channel.
Similarly, the soil an-CO2 production potential decreased generally with depth (Figure 3). The highest an-CO2 production potentials were generally observed in the surface soils at depths of 0–10 and 10–20 cm, while the lowest an-CO2 production rates were recorded in the deeper horizons at a depth of 30–50 cm in all land use types except mangrove. The aero-CO2 production potentials showed a decreasing trend from a depth of 0–10 cm to a depth of 20–30 cm, and then increased again in deeper soils at a depth of 30–50 cm across all land use types except Gei Wai forest (Figure 3).
3.3. Relationships between Soil CH4 and CO2 Production Potentials
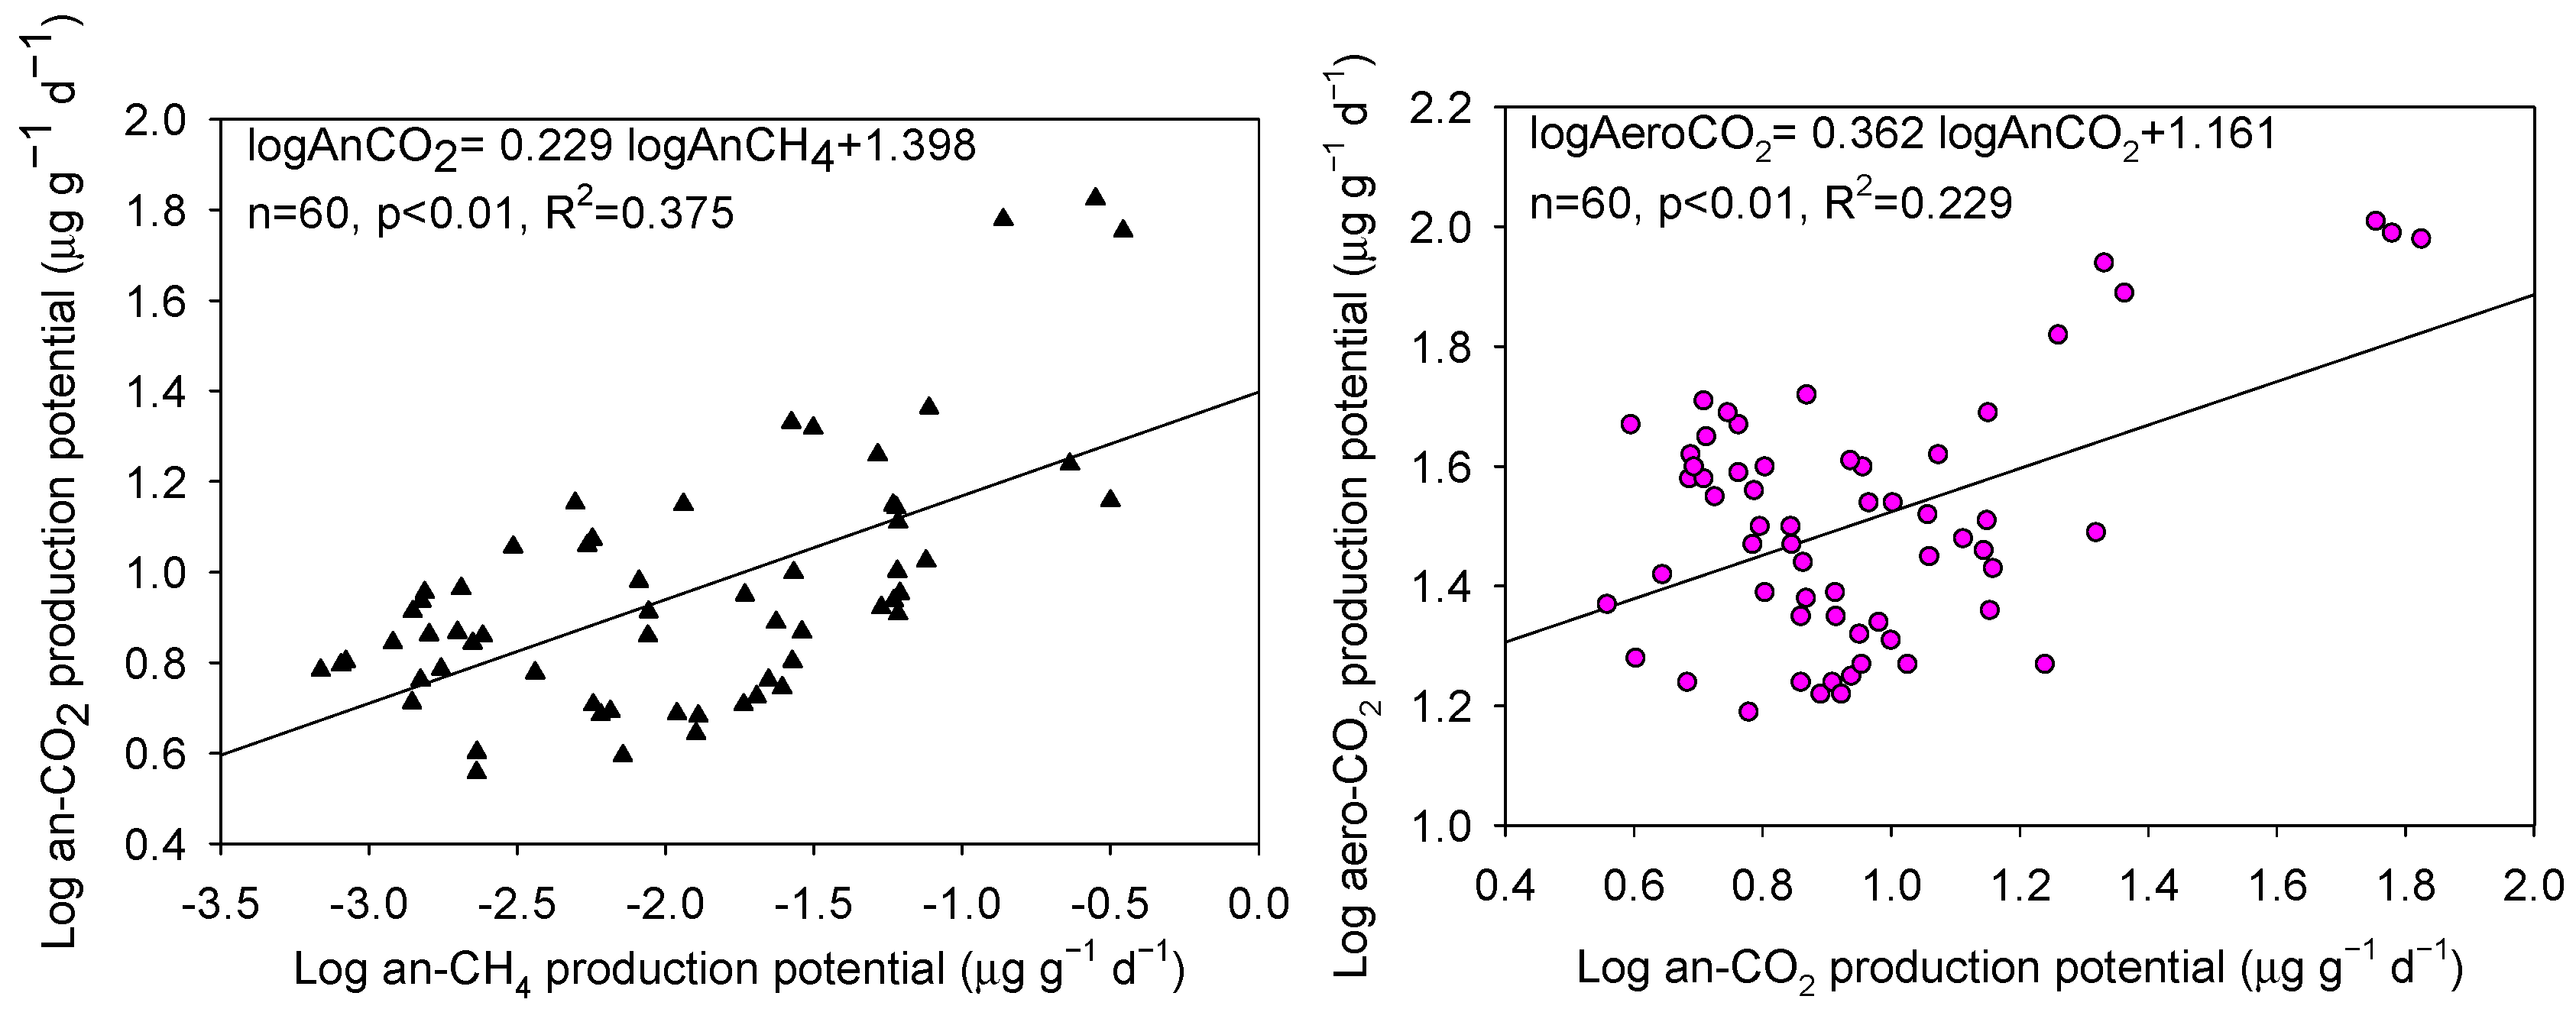
Across various land use types and soil depths, the mean an-CH4 production potentials ranged from <0.01 to 0.27 μg g−1 day−1, which were considerably lower than the mean an-CO2 production potentials that ranged from 3.85 to 61.14 μg g−1 day−1. The log-transformed anaerobic CO2 and CH4 production potentials were strongly and positively correlated (p < 0.01, Figure 4). Also, the log-transformed aerobic and anaerobic CO2 production potentials were positively correlated (p < 0.01, Figure 4). The ratios between aerobic and anaerobic CO2 production potentials ranged between 1.6:1 and 9.1:1, with an average value of 4.3:1.
3.4. Effects of Land Use Types on Soil Physico-Chemical Properties
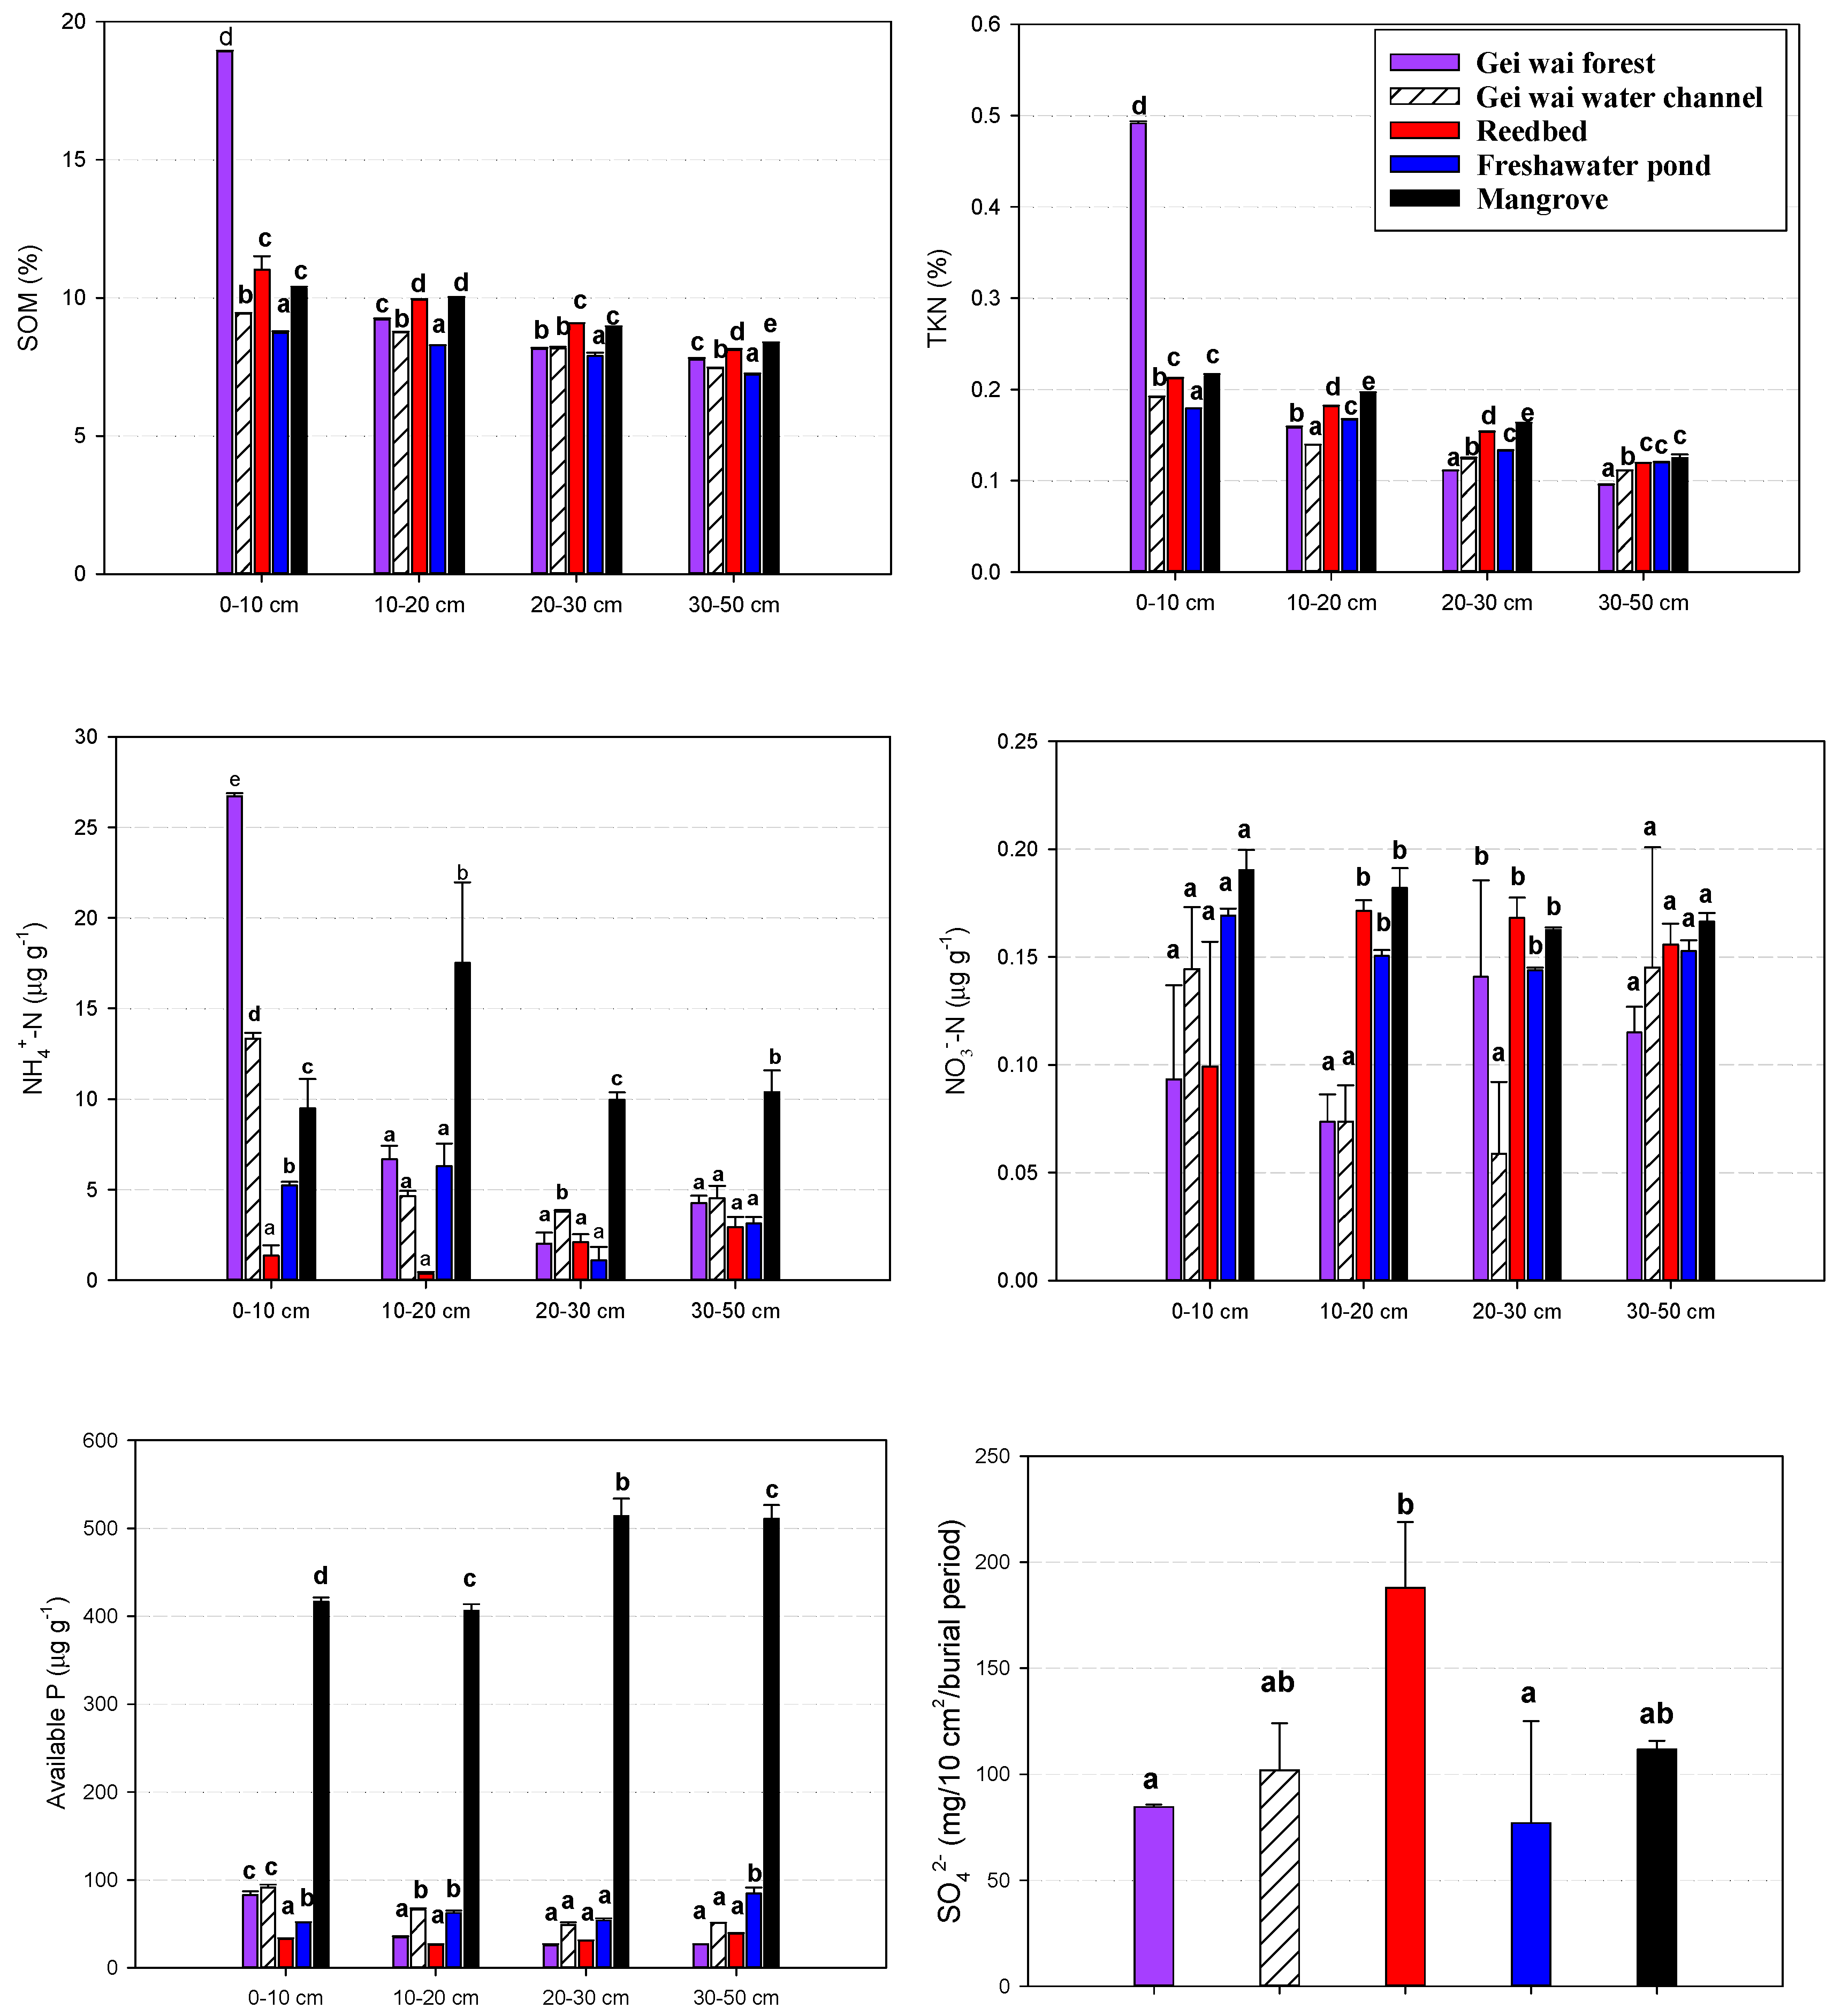
As shown in Figure 5, the mean soil nutrient concentrations showed a decreasing pattern with depth similar to that of soil GHG production potentials. Soil NO3−-N concentration was an exception with rather small variations along the soil profile, possibly because of the overall low concentrations in this coastal wetland (0.06–0.19 μg g−1). Meanwhile, the mean soil nutrient concentrations differed significantly among land use types at a given depth, with the variations in SOM closely following those in TKN. In the top 10 cm soils, significantly higher SOM and TKN concentrations were observed in the Gei Wai forest, followed by reedbed and mangrove. The Gei Wai water channel and freshwater pond had significantly lower SOM and TKN concentrations. At a depth of 20–50 cm, the mean SOM and TKN concentrations were significantly higher in the reedbed and mangrove than in the Gei Wai forest and Gei Wai water channel. The mean soil NH4+-N concentrations in the top 10 cm varied significantly among all five different land use types, but those at a depth of 20–50 cm were only significantly higher in the mangrove. The mean soil NO3−-N concentrations were rather low with a range of 0.06–0.19 μg g−1, and were generally similar across the land use types. Of the top 50 cm soils, the mean available P concentration was significantly greater in the mangrove (406–514 μg g−1) than the other land use types (25.3–91.4 μg g−1). The mean sulfate supply rate in the top 10 cm soil was significantly higher in the reedbed than in the Gei Wai forest and freshwater pond.
Table 2 shows the concentrations of various soil C fractions in the top 10 cm soils. Soil microbial biomass C concentrations were significantly higher in the Gei Wai forest (1724 mg kg−1) than those in the reedbed and mangrove (1134–1218 mg kg−1), which were, in turn, significantly higher than those in the Gei Wai water channel and freshwater pond (796–856 mg kg−1). Similarly, the mean concentrations of water-soluble carbohydrate C, acid hydrolysable carbohydrate C, readily mineralizable C, and SOC were significantly higher in the Gei Wai forest, and significantly lower in the Gei Wai water channel and freshwater pond. All the C fractions were significantly correlated with SOC (p < 0.05), which contributed to the total soil labile C pool.
3.5. Relationships between Soil Properties and GHG Production Potentials
Table 3 shows the results of correlation analysis between various soil chemical properties and the soil GHG production potentials for each land use type. At the Gei Wai forest, the soil concentrations of available P, NH4+-N, SOM and TKN were all significantly and positively correlated with an-CH4, an-CO2 and aero-CO2 production potentials. At the Gei Wai water channel, both an-CH4, an-CO2 production potentials were positively correlated with the concentrations of available phosphorous, NH4+-N, SOM and TKN, while the aero-CO2 production potential was only positively correlated with NO3−-N concentration. Soil NO3−-N concentration was negatively correlated with both an-CH4 and an-CO2 production potentials in the reedbed but positively correlated with both an-CH4 and an-CO2 production in the mangrove. Both SOM and the TKN concentrations were positively correlated with an-CH4 and an-CO2 production potentials in the reedbed as well as the mangrove. Soil available P concentration was positively correlated with aero-CO2 production in the reedbed, but negatively correlated with an-CH4 and an-CO2 production in the mangrove. At the freshwater pond, an-CH4 production potential was positively correlated with both SOM and TKN, while aero-CO2 production was positively correlated with soil NH4+-N concentration only. Moreover, we found that the higher concentrations of MBC, WSC, AHC and RMC in the Gei Wai forest and mangrove (Table 2) corresponded to the higher an-CO2 and aero-CO2 production potentials observed for these two land use types in the top 10 soils. However, the surface soils at reedbed had lower CH4 and CO2 production potentials in spite of the relatively high concentrations of labile C fractions.
4. Discussion
4.1. CH4 and CO2 Production Potentials
The an-CH4 production potentials in the top 50 cm soils at our coastal wetland ranged from <0.01 to 0.27 μg g−1 day−1, which were rather low when compared to the reported values in other wetlands (Table 4). Treat, Natali, Ernakovich, Iversen, Lupascu, McGuire, Norby, Roy Chowdhury, Richter and Šantrůčková [17] found that the maximum anaerobic CH4 production rates in the boreal and tundra soils in the 0–20 cm and 20–100 cm layers were 7.87 and 1.2 μg g−1 day−1, respectively. One possible reason for the much lower an-CH4 production potential observed in our study was that the SOC concentration in our surface soils was considerably lower than that in the northern peatlands (2.28–4.90% vs. 39.9%), which resulted in a more limited supply of labile organic C substrate for CH4 production [53]. Meanwhile, the an-CH4 production potential in the Gei Wai forest and the Gei Wai water channel was comparable to that in other coastal marshes [54,55]. The low an-CH4 production potential in coastal wetlands was likely a result of the suppression of methanogenesis by sulfate-reducing bacteria under the prevailing high salinity and sulfate concentration [56].
The an-CO2 production potentials ranged between 4.96 and 61.14 μg g−1 day−1 across all depths and land use types. We observed a strong correlation between an-CO2 and an-CH4 production potentials at our wetland site, which was similarly reported in some inland peatlands in Canada [13,57]. The ratios between an-CO2 and an-CH4 in the top 10 cm soils were 238:1, 56:1, 2751:1, 266:1, and 402:1 for the Gei Wai forest, Gei Wai water channel, reedbed, freshwater pond, and mangrove, respectively. A high an-CO2 to an-CH4 ratio indicates that methanogenesis using acetate or H2/CO2 may not be the only dominant microbial activity in soils. Anaerobic CH4 oxidation may also occur through the actions of sulfate-reducing bacteria and anaerobic methanotrophic bacteria [58,59]. In marine environments, sulfate-dependent CH4 oxidation can take place using sulfate, nitrite and iron as substrates by sulfate-reducing bacteria [60,61]. Our coastal mangrove was subjected to semi-diurnal tides from Deep Bay and thus the inputs of brackish water. This resulted in a relatively high soil sulfate supply in the mangrove than in the freshwater pond (111.71 vs. 77.00 mg/10 cm2/burial period). The reedbed had only biweekly tidal exchange and was submerged under brackish water for extended time periods, leading to a relatively high sulfate supply rate as well (187.94 mg/10 cm2/burial period). The higher availability of sulfate concentration in the reedbed and mangrove might have promoted anaerobic CH4 oxidation, leading to the high an-CO2 to an-CH4 ratios.
The aero-CO2 production potentials ranged between 19.06 and 97.91 μg g−1 day−1, which were considered low when compared to those reported in other studies (Table 4). We found a strong and positive correlation between the aero-CO2 and an-CO2 production potentials, which was in agreement with the findings of previous researches [19,57]. The ratios between aero-CO2 and an-CO2 production ranged from 1.6:1 to 9.1:1 across the five land use types, with an average value of 4.1:1. This average ratio fell within the range of 2:1 to 30:1 reported in other studies [12,19,21,57,62], and pointed to potentially greater production and emission of CO2 from soils into the atmosphere when the coastal wetland was exposed to more aerobic conditions. The low an-CO2 and aero-CO2 production potentials observed at our study site could be attributed at least partly to the low SOM concentration (7.2–18.9%) as compared to the carbon-rich peatlands [13]. The low an-CO2 production potential could also be partly attributed to the accumulation of metabolites in soils, which would inhibit CO2 production under anaerobic conditions.
Care should be taken when comparing the incubation results in this study with those in other wetlands, as the difference in vegetation, pH, soil depth, incubation period and other factors might also affect the measured rates of GHG production. As shown in Table 4, studies examining soil GHG production potential in coastal wetland soils, especially in the subtropical region, are still very limited, and deserve further attention for improving the spatial representation of experimental results.
4.2. Effects of Land Use Types on Soil CH4 and CO2 Production Potentials
As mangrove was the natural and original land use type at our site before human disturbances, we used mangrove as the baseline reference for analyzing the effect of land use change on soil GHG production. In this section, we focused on the soil GHG production potentials in the top 10 cm soils, as the surface soil horizon was most sensitive to the effects of land use change. In general, mangrove conversion to other land use types reduced both aero-CO2 and an-CO2 production potentials, except for Gei Wai forest. The continual loss of soil C through soil respiration in response to wetland conversion could lead to a considerable reduction in SOM concentration after some years. Although the soil CO2 production potential might exhibit a transient increase during the initial period of disturbance, it could decrease in the long run after mangrove conversion, owing to the exhaustion of C substrates [33,34,35]. In addition, the Gei Wai water channel and freshwater pond had significantly lower SOM and TKN concentrations in the top soils than the natural mangrove, which might also contribute to lower CO2 production rates through a reduced supply of C and N substrates.
We observed significantly higher values of an-CH4, an-CO2 and aero-CO2 production potentials in the top 10 cm soils in the Gei Wai forest than in the mangrove. The coastal mangrove received tidal floodwater twice a day, while the Gei Wai forest was only flooded occasionally. The higher salinity and sulfate concentration in the mangrove owing to the influence of brackish water contributed to the suppression of CH4 production. In addition, the significantly higher soil concentrations of NH4+-N, SOM and TKN in the Gei Wai forest could play a role in supporting higher CH4 and CO2 production, as supported by the strong and positive correlations between these soil properties and GHG production potentials (Table 3). A previous study has shown that NH4+-N can facilitate CH4 production and emission by decreasing the soil Eh [66]. Treat, Natali, Ernakovich, Iversen, Lupascu, McGuire, Norby, Roy Chowdhury, Richter and Šantrůčková [17] observed significantly higher an-CH4 and an-CO2 production in peatlands with higher SOC and N concentrations, which supported the importance of substrate supply for GHG production. Moreover, we found that in the Gei Wai forest and mangrove with higher an-CO2 and aero-CO2 production potentials, their soil MBC, WSC, AHC, and RMC concentrations were also higher than other land use types, indicating the importance of a labile C pool in promoting soil CO2 production.
As compared to the natural mangrove, the Gei Wai water channel had significantly higher an-CH4 production but significantly lower an-CO2 and aero-CO2 productions. The Gei Wai water channel was inundated for a long duration, leading to the development of strongly anaerobic conditions that facilitated CH4 production and inhibited CO2 production. The significantly higher soil NH4+-N concentrations in the Gei Wai water channel might also have facilitated CH4 production. Meanwhile, the significantly lower SOM and TKN concentrations observed in the top soils of the Gei Wai water channel could help explain the lower an-CO2 and aero-CO2 productions as compared to the mangrove.
In both the reedbed and the freshwater pond, an-CO2 and aero-CO2 production potentials in the top 10 cm soils were significantly lower than those in the mangrove, which could be related to the significantly lower concentrations of soil available P and NH4+-N in supporting microbial respiration. The mean an-CH4 production potential in the reedbed was close to zero, which might be related to the large availability of sulfate and oxygen in the soils that reduce the abundance of methanogens for CH4 production [67].
4.3. Variations of CH4 and CO2 Production Potential with Depth
The an-CH4 and an-CO2 production potentials showed a decreasing pattern with depth in this study (Figure 3), which has also been shown in previous studies [17,62,68]. For example, Glatzel, Basiliko and Moore [57] found the largest an-CH4 production in soil samples close to the peatland surface, with fresh peat accumulation and a high water table. In a grassland on peat soils in the Netherlands, the an-CH4 production in the top 5 cm soils contributed to 70% of the total an-CH4 production [62]. Treat, et al. [17] showed that an-CH4 and an-CO2 production in the permafrost zone decreased with depth, with the maximum CH4 production detected in the top 20 cm. In this study, the maximum an-CH4 and an-CO2 production potentials were generally recorded in the top 10 cm soils across different land use types, except for the freshwater pond. From a depth interval of 10–20 cm to 20–30 cm, mean an-CH4 production decreased substantially by 61.6%, 54.6%, and 97.4% in the reedbed, freshwater pond and mangrove, respectively. On the other hand, mean an-CO2 production decreased over a range from 1.7% to 41.3% for the five land use types from a depth of 10–20 cm to 20–30 cm. From a depth interval of 20–30 cm to 30–50 cm, mean an-CH4 production decreased by 60.7%, 93.2%, and 49.9% in the Gei Wai forest, Gei Wai water channel and freshwater pond, respectively. Meanwhile, average an-CO2 production decreased over a range from 8.8% to 55.6% for all the land use types studied, except the freshwater pond. Meanwhile, soil aero-CO2 production generally decreased from 0–10 cm to 20–30 cm depths, but increased again at a depth of 30–50 cm, except for the Gei Wai forest.
The decrease in soil CH4 and CO2 production potentials with depth was closely related to the variations in soil nutrients. Our results showed that SOM and TKN concentrations were significantly and positively correlated with both an-CH4 and an-CO2 production values in all land use types except the freshwater pond. With increasing soil depths, the supply of C substrates to soil microbes was diminished, which limited the anaerobic degradation of organic matter and, subsequently, the production of GHGs. Bergman, Lundberg and Nilsson [21] showed that the addition of starch and glucose as a C supply could increase CH4 and CO2 production in a peatland in Sweden. Given that soil available P and NH4+-N concentrations were positively correlated with an-CH4 and an-CO2 productions in both the Gei Wai forest and Gei Wai water channel, the decreasing levels of available P and NH4+-N with depth in these two sites might also help account for the reduction in anaerobic GHG production in the deeper soils.
5. Conclusions
The mean an-CH4 production potentials ranged from <0.01 to 0.27 μg g−1 day−1 across land use types and depths in our coastal wetland, which were relatively low when compared to the values reported in other wetlands. This could be attributed to the low SOC concentration and high salinity that suppress methanogenesis at our site. The mean an-CO2 production potentials ranged from 4.96 to 61.14 μg g−1 day−1 and were strongly and positively correlated with an-CH4 production potential. The large ratio of an-CO2 to an-CH4 suggested that anaerobic CH4 oxidation might occur, especially under the presence of sulfate. The mean aero-CO2 production potentials ranged from 19.06 to 97.91 μg g−1 day−1, which were again in the low range among other wetlands. We found a strong correlation between aero-CO2 and an-CO2 production potentials, which implied the presence of some common controlling factors such as SOM and TKN concentrations.
CH4 and CO2 production potentials in the top 10 cm soils varied significantly among land use types. The conversion of mangroves to other land uses after a long time period reduced both aerobic and anaerobic CO2 production potentials, except for the Gei Wai forest. This was contrary to the findings of other studies in which CO2 emissions were enhanced in some newly cleared mangrove forests. Hence, future studies should carry out long-term monitoring of the response of soil GHG production to mangrove conversion. Moreover, in the top 10 cm soils, the highest an-CH4 production rate was recorded in the Gei Wai water channel, while the highest an-CO2 and aero-CO2 production rates were obtained in the Gei Wai forest. The conversion of mangrove to Gei Wais (tidal shrimp ponds) should be carefully considered in future to minimize the soil production of GHGs and the associated adverse climatic impacts. The effects of land use change on GHG production potentials were less significant in the subsurface soils (30–50 cm depth). Moreover, other biogeochemical processes (e.g., oxidation and transport) should be thoroughly investigated in order to provide a more complete picture of the impact of mangrove conversion on net GHG exchange. The an-CH4, an-CO2 and aero-CO2 production potentials showed a decreasing pattern with depth, which was highly associated with the vertical variations of SOM and TKN concentrations in the soil profile. The reduction in soil’s available P and NH4+-N concentrations with depth also likely contributed to the lower an-CH4 and an-CO2 productions seen in both the Gei Wai forest and Gei Wai water channel.
Author Contributions
Conceptualization, J.X. and D.Y.F.L.; Methodology, J.X., D.Y.F.L. and S.N.; Formal Analysis, J.X.; Investigation, J.X. and D.Y.F.L.; Resources, D.Y.F.L.; Writing—Original Draft Preparation, J.X.; Writing—Review & Editing, D.Y.F.L.; Funding Acquisition, J.X. and D.Y.F.L. All authors have read and agreed to the published version of the manuscript.
Funding
The work described in this paper was partially supported by a grant from the Research Grants Council of the Hong Kong Special Administrative Region, China (Project No. CUHK 458913) and the Scientific Research Fund of Nanjing Institute of Technology (YKJ201846).
Acknowledgments
We thank WWF-HK for their logistical support and the Agriculture, Fisheries and Conservation Department for their permission of field sampling.
Conflicts of Interest
The authors declare no conflicts of interest.
References
- Forster, P.; Ramaswamy, V.; Artaxo, P.; Berntsen, T.; Betts, R.; Fahey, D.W.; Haywood, J.; Lean, J.; Lowe, D.C.; Myhre, G. Changes in atmospheric constituents and in radiative forcing. In Climate Change 2007: The Physical Science Basis; Cambridge University Press: Cambridge, UK, 2007. [Google Scholar]
- Lai, D. Methane dynamics in northern peatlands: A review. Pedosphere 2009, 19, 409–421. [Google Scholar] [CrossRef]
- Le Mer, J.; Roger, P. Production, oxidation, emission and consumption of methane by soils: A review. Eur. J. Soil Biol. 2001, 37, 25–50. [Google Scholar] [CrossRef]
- Sundh, I.; Nilsson, M.; Granberg, G.; Svensson, B. Depth distribution of microbial production and oxidation of methane in northern boreal peatlands. Microb. Ecol. 1994, 27, 253–265. [Google Scholar] [CrossRef] [PubMed]
- Bergman, I.; Svensson, B.H.; Nilsson, M. Regulation of methane production in a Swedish acid mire by PH, temperature and substrate. Soil Biol. Biochem. 1998, 30, 729–741. [Google Scholar] [CrossRef]
- Yavitt, J.B.; Lang, G.E. Methane production in contrasting wetland sites: Response to organic-chemical components of peat and to sulfate reduction. Geomicrobiol. J. 1990, 8, 27–46. [Google Scholar] [CrossRef]
- Valentine, D.W.; Holland, E.A.; Schimel, D.S. Ecosystem and physiological controls over methane production in northern wetlands. J. Geophys. Res. Atmos. 1994, 99, 1563–1571. [Google Scholar] [CrossRef]
- Garcia, J.-L.; Patel, B.K.; Ollivier, B. Taxonomic, phylogenetic, and ecological diversity of methanogenic archaea. Anaerobe 2000, 6, 205–226. [Google Scholar] [CrossRef]
- Dunfield, P.; Dumont, R.; Moore, T.R. Methane production and consumption in temperate and subarctic peat soils: Response to temperature and PH. Soil Biol. Biochem. 1993, 25, 321–326. [Google Scholar] [CrossRef]
- Westermann, P.; Ahring, B.K. Dynamics of methane production, sulfate reduction, and denitrification in a permanently waterlogged alder swamp. Appl. Environ. Microbiol. 1987, 53, 2554–2559. [Google Scholar] [CrossRef] [Green Version]
- Bridgham, S.D.; Johnston, C.A.; Pastor, J.; Updegraff, K. Potential feedbacks of northern wetlands on climate change. BioScience 1995, 45, 262–274. [Google Scholar] [CrossRef]
- Yavitt, J.B.; Williams, C.J.; Wieder, R.K. Production of methane and carbon dioxide in peatland ecosystems across North America: Effects of temperature, aeration, and organic chemistry of peat. Geomicrobiol. J. 1997, 14, 299–316. [Google Scholar] [CrossRef]
- Inglett, K.; Inglett, P.; Reddy, K.; Osborne, T. Temperature sensitivity of greenhouse gas production in wetland soils of different vegetation. Biogeochemistry 2012, 108, 77–90. [Google Scholar] [CrossRef]
- Coles, J.R.; Yavitt, J.B. Control of methane metabolism in a forested northern wetland, New York state, by aeration, substrates, and peat size fractions. Geomicrobiol. J. 2002, 19, 293–315. [Google Scholar] [CrossRef]
- Poffenbarger, H.J.; Needelman, B.A.; Megonigal, J.P. Salinity influence on methane emissions from tidal marshes. Wetlands 2011, 31, 831–842. [Google Scholar] [CrossRef]
- Conrad, R.; Rothfuss, F. Methane oxidation in the soil surface layer of a flooded rice field and the effect of ammonium. Biol. Fertil. Soils 1991, 12, 28–32. [Google Scholar] [CrossRef]
- Treat, C.C.; Natali, S.M.; Ernakovich, J.; Iversen, C.M.; Lupascu, M.; McGuire, A.D.; Norby, R.J.; Roy Chowdhury, T.; Richter, A.; Šantrůčková, H. A pan-arctic synthesis of CH4 and CO2 production from anoxic soil incubations. Glob. Change Biol. 2015, 21, 2787–2803. [Google Scholar] [CrossRef]
- Bridgham, S.D.; Richardson, C.J. Mechanisms controlling soil respiration (CO2 and CH4) in southern peatlands. Soil Biol. Biochem. 1992, 24, 1089–1099. [Google Scholar] [CrossRef]
- Moore, T.R.; Dalva, M. Methane and carbon dioxide exchange potentials of peat soils in aerobic and anaerobic laboratory incubations. Soil Biol. Biochem. 1997, 29, 1157–1164. [Google Scholar] [CrossRef]
- Schlesinger, W.H.; Andrews, J.A. Soil respiration and the global carbon cycle. Biogeochemistry 2000, 48, 7–20. [Google Scholar] [CrossRef]
- Bergman, I.; Lundberg, P.; Nilsson, M. Microbial carbon mineralisation in an acid surface peat: Effects of environmental factors in laboratory incubations. Soil Biol. Biochem. 1999, 31, 1867–1877. [Google Scholar] [CrossRef]
- Kim, Y.; Ullah, S.; Roulet, N.T.; Moore, T.R. Effect of inundation, oxygen and temperature on carbon mineralization in boreal ecosystems. Sci. Total Environ. 2015, 511, 381–392. [Google Scholar] [CrossRef] [PubMed]
- Alongi, D.M.; Tirendi, F.; Clough, B.F. Below-ground decomposition of organic matter in forests of the mangroves Rhizophora stylosa and Avicennia marina along the arid coast of Western Australia. Aquat. Bot. 2000, 68, 97–122. [Google Scholar] [CrossRef]
- Sainju, U.M.; Jabro, J.D.; Stevens, W.B. Soil carbon dioxide emission and carbon content as affected by irrigation, tillage, cropping system, and nitrogen fertilization. J. Environ. Qual. 2008, 37, 98–106. [Google Scholar] [CrossRef] [Green Version]
- Poeplau, C.; Don, A. Sensitivity of soil organic carbon stocks and fractions to different land-use changes across Europe. Geoderma 2013, 192, 189–201. [Google Scholar] [CrossRef]
- Aulakh, M.S.; Wassmann, R.; Bueno, C.; Rennenberg, H. Impact of root exudates of different cultivars and plant development stages of rice (Oryza sativa L.) on methane production in a paddy soil. Plant Soil 2001, 230, 77–86. [Google Scholar] [CrossRef]
- Alongi, D.M. Carbon sequestration in mangrove forests. Carbon Manag. 2012, 3, 313–322. [Google Scholar] [CrossRef]
- Donato, D.C.; Kauffman, J.B.; Murdiyarso, D.; Kurnianto, S.; Stidham, M.; Kanninen, M. Mangroves among the most carbon-rich forests in the tropics. Nat. Geosci. 2011, 4, 293–297. [Google Scholar] [CrossRef]
- Mcleod, E.; Chmura, G.L.; Bouillon, S.; Salm, R.; Björk, M.; Duarte, C.M.; Lovelock, C.E.; Schlesinger, W.H.; Silliman, B.R. A blueprint for blue carbon: Toward an improved understanding of the role of vegetated coastal habitats in sequestering CO2. Front. Ecol. Environ. 2011, 9, 552–560. [Google Scholar] [CrossRef] [Green Version]
- Pendleton, L.; Donato, D.C.; Murray, B.C.; Crooks, S.; Jenkins, W.A.; Sifleet, S.; Craft, C.; Fourqurean, J.W.; Kauffman, J.B.; Marbà, N. Estimating global “blue carbon” emissions from conversion and degradation of vegetated coastal ecosystems. PLoS ONE 2012, 7, e43542. [Google Scholar] [CrossRef] [Green Version]
- Duke, N.C.; Meynecke, J.O.; Dittmann, S.; Ellison, A.M.; Anger, K.; Berger, U.; Cannicci, S.; Diele, K.; Ewel, K.C.; Field, C.D. A world without mangroves? Science 2007, 317, 41–42. [Google Scholar] [CrossRef] [Green Version]
- Ouyang, X.; Lee, S.Y. Improved estimates on global carbon stock and carbon pools in tidal wetlands. Nat. Commun. 2020, 11, 1–7. [Google Scholar] [CrossRef] [Green Version]
- Sidik, F.; Lovelock, C.E. CO2 efflux from shrimp ponds in Indonesia. PLoS ONE 2013, 8, e66329. [Google Scholar] [CrossRef] [PubMed] [Green Version]
- Granek, E.; Ruttenberg, B.I. Changes in biotic and abiotic processes following mangrove clearing. Estuar. Coast. Shelf Sci. 2008, 80, 555–562. [Google Scholar] [CrossRef] [Green Version]
- Lovelock, C.E.; Ruess, R.W.; Feller, I.C. CO2 efflux from cleared mangrove peat. PLoS ONE 2011, 6, e21279. [Google Scholar] [CrossRef] [PubMed] [Green Version]
- Sun, Z.; Sun, W.; Tong, C.; Zeng, C.; Yu, X.; Mou, X. China’s coastal wetlands: Conservation history, implementation efforts, existing issues and strategies for future improvement. Environ. Int. 2015, 79, 25–41. [Google Scholar] [CrossRef] [PubMed]
- Lai, D.Y.F.; Lam, K.C. Phosphorus retention and release by sediments in the eutrophic Mai Po Marshes, Hong Kong. Mar. Pollut. Bull. 2008, 57, 349–356. [Google Scholar] [CrossRef]
- Chen, G.C.; Tam, N.F.Y.; Ye, Y. Spatial and seasonal variations of atmospheric N2O and CO2 fluxes from a subtropical mangrove swamp and their relationships with soil characteristics. Soil Biol. Biochem. 2012, 48, 175–181. [Google Scholar] [CrossRef]
- Hong Kong Observatory. Monthly Meteorological Normals for Hong Kong. Available online: http://www.weather.gov.hk/en/cis/normal/1981_2010/normals.htm# (accessed on 24 June 2020).
- Duke, N.C.; Khan, M.A. Structure and composition of the seaward mangrove forest at Mai Po Marshes Nature Reserve, Hong Kong. In The Mangrove Ecosystem of Deep Bay and the Mai Po Marshes; Lee, S.Y., Ed.; Hong Kong University Press: Hong Kong, China, 1999. [Google Scholar]
- Liu, J.; Lai, D.Y.F. Subtropical mangrove wetland is a stronger carbon dioxide sink in the dry than wet seasons. Agric. Forest Meteorol. 2019, 278, 107644. [Google Scholar] [CrossRef]
- Fitzgerald, W.J., Jr. Silvofisheries: Integrated mangrove forest aquaculture systems. In Ecological Aquaculture; Costa-Pierce, B.A., Ed.; Blackwell Publishing: Oxford, UK, 2002; pp. 161–262. [Google Scholar]
- Cha, M.W.; Young, L.; Wong, K.M. The fate of traditional extensive (Gei Wai) shrimp farming at the Mai Po Marshes Nature Reserve, Hong Kong. Hydrobiologia 1997, 352, 295–303. [Google Scholar] [CrossRef]
- Saarnio, S.; Alm, J.; Silvola, J.; Lohila, A.; Nykänen, H.; Martikainen, P.J. Seasonal variation in CH4 emissions and production and oxidation potentials at microsites on an oligotrophic pine fen. Oecologia 1997, 110, 414–422. [Google Scholar] [CrossRef]
- Black, C.A.; Evans, D.D.; White, J.L.; Ensminger, L.E.; Clark, F.E.; Rinauer, R.C. Methods of Soil Analysis, Part 2—Chemical and Microbiological Properties; American Society of Agronomy: Madison, WI, USA, 1965. [Google Scholar]
- Nelson, D.W.; Sommers, L.E. Total carbon, organic carbon, and organic matter. In Methods of Soil Analysis, Part 3—Chemical Methods; Sparks, D.L., Ed.; Soil Science Society of America, Inc.: Madison, WI, USA, 1996; pp. 961–1010. [Google Scholar]
- Qian, P.; Schoenau, J. Availability of nitrogen in solid manure amendments with different C:N ratios. Can. J. Soil Sci. 2002, 82, 219–225. [Google Scholar] [CrossRef]
- Witt, C.; Biker, U.; Galicia, C.C.; Ottow, J.C. Dynamics of soil microbial biomass and nitrogen availability in a flooded rice soil amended with different C and N sources. Biol. Fertil. Soils 2000, 30, 520–527. [Google Scholar] [CrossRef]
- Haynes, R.; Swift, R. Stability of soil aggregates in relation to organic constituents and soil water content. J. Soil Sci. 1990, 41, 73–83. [Google Scholar] [CrossRef]
- Inubushi, K.; Brookes, P.; Jenkinson, D. Soil microbial biomass C, N and ninhydrin-N in aerobic and anaerobic soils measured by the fumigation-extraction method. Soil Biol. Biochem. 1991, 23, 737–741. [Google Scholar] [CrossRef]
- Vance, E.; Brookes, P.; Jenkinson, D. An extraction method for measuring soil microbial biomass C. Soil Biol. Biochem. 1987, 19, 703–707. [Google Scholar] [CrossRef]
- Angers, D.; Mehuys, G. Effects of cropping on carbohydrate content and water-stable aggregation of a clay soil. Can. J. Soil Sci. 1989, 69, 373–380. [Google Scholar] [CrossRef] [Green Version]
- Neue, H.U.; Roger, P.A. Potential of methane emission in major rice ecologies. In Climate Biosphere Interaction: Biogenic Emissions and Environmental Effects of Climate Change; Zepp, R.G., Ed.; John Wiley and Sons, Inc.: Chichester, UK, 1994; pp. 65–94. [Google Scholar]
- Tong, C.; Huang, J.F.; Hu, Z.Q.; Jin, Y.F. Diurnal variations of carbon dioxide, methane, and nitrous oxide vertical fluxes in a subtropical estuarine marsh on neap and spring tide days. Estuar. Coasts 2013, 36, 633–642. [Google Scholar] [CrossRef]
- Prieme, A. Production and emission of methane in a brackish and a freshwater wetland. Soil Biol. Biochem. 1994, 26, 7–18. [Google Scholar] [CrossRef]
- Marton, J.M.; Herbert, E.R.; Craft, C.B. Effects of salinity on denitrification and greenhouse gas production from laboratory-incubated tidal forest soils. Wetlands 2012, 32, 347–357. [Google Scholar] [CrossRef]
- Glatzel, S.; Basiliko, N.; Moore, T. Carbon dioxide and methane production potentials of peats from natural, harvested and restored sites, Eastern Québec, Canada. Wetlands 2004, 24, 261–267. [Google Scholar] [CrossRef]
- Chowdhury, T.R.; Dick, R.P. Ecology of aerobic methanotrophs in controlling methane fluxes from wetlands. Appl. Soil Ecol. 2013, 65, 8–22. [Google Scholar] [CrossRef]
- Serrano-Silva, N.; Sarria-Guzmán, Y.; Dendooven, L.; Luna-Guido, M. Methanogenesis and methanotrophy in soil: A review. Pedosphere 2014, 24, 291–307. [Google Scholar] [CrossRef]
- Caldwell, S.L.; Laidler, J.R.; Brewer, E.A.; Eberly, J.O.; Sandborgh, S.C.; Colwell, F.S. Anaerobic oxidation of methane: Mechanisms, bioenergetics, and the ecology of associated microorganisms. Environ. Sci. Technol. 2008, 42, 6791–6799. [Google Scholar] [CrossRef] [PubMed]
- Thauer, R.K.; Shima, S. Methane as fuel for anaerobic microorganisms. Ann. N. Y. Acad. Sci. 2008, 1125, 158–170. [Google Scholar] [CrossRef] [PubMed]
- Van den Pol-van Dasselaar, A.; Oenema, O. Methane production and carbon mineralisation of size and density fractions of peat soils. Soil Biol. Biochem. 1999, 31, 877–886. [Google Scholar] [CrossRef]
- Yavitt, J.B.; Lang, G.E.; Wieder, R.K. Control of carbon mineralization to CH4 and CO2 in anaerobic, sphagnum-derived peat from Big Run Bog, West Virginia. Biogeochemistry 1987, 4, 141–157. [Google Scholar] [CrossRef]
- Yavitt, J.B.; Basiliko, N.; Turetsky, M.R.; Hay, A.G. Methanogenesis and methanogen diversity in three peatland types of the Discontinuous Permafrost Zone, Boreal Western Continental Canada. Geomicrobiol. J. 2006, 23, 641–651. [Google Scholar] [CrossRef]
- Liu, D.; Ding, W.; Jia, Z.; Cai, Z. Relation between methanogenic archaea and methane production potential in selected natural wetland ecosystems across China. Biogeosciences 2011, 8, 329–338. [Google Scholar] [CrossRef] [Green Version]
- Allen, D.E.; Dalal, R.C.; Rennenberg, H.; Meyer, R.L.; Reeves, S.; Schmidt, S. Spatial and temporal variation of nitrous oxide and methane flux between subtropical mangrove sediments and the atmosphere. Soil Biol. Biochem. 2007, 39, 622–631. [Google Scholar] [CrossRef]
- Martin, R.M.; Moseman-Valtierra, S. Greenhouse gas fluxes vary between phragmites australis and native vegetation zones in coastal wetlands along a salinity gradient. Wetlands 2015, 35, 1021–1031. [Google Scholar] [CrossRef]
- Treat, C.; Wollheim, W.M.; Varner, R.; Grandy, A.S.; Talbot, J.; Frolking, S. Temperature and peat type control CO2 and CH4 production in Alaskan permafrost peats. Glob. Change Biol. 2014, 20, 2674–2686. [Google Scholar] [CrossRef] [PubMed]
Figure 1.
Locations of the five soil sampling sites: (a) Reedbed; (b) Freshwater pond; (c) Gei Wai forest and Gei Wai water channel; and (d) Mangrove.
Figure 1.
Locations of the five soil sampling sites: (a) Reedbed; (b) Freshwater pond; (c) Gei Wai forest and Gei Wai water channel; and (d) Mangrove.

Figure 2.
Mean anaerobic CH4, anaerobic CO2, and aerobic CO2 production potentials at different soil depths for the five land use types. Data are means ± standard deviation. Different letters indicate significant differences in rates among the land use types at a given depth (p < 0.05).
Figure 2.
Mean anaerobic CH4, anaerobic CO2, and aerobic CO2 production potentials at different soil depths for the five land use types. Data are means ± standard deviation. Different letters indicate significant differences in rates among the land use types at a given depth (p < 0.05).

Figure 3.
Depth profiles of anaerobic CH4, anaerobic CO2, and aerobic CO2 production potentials for the five land use types. Data are means ± standard deviation.
Figure 3.
Depth profiles of anaerobic CH4, anaerobic CO2, and aerobic CO2 production potentials for the five land use types. Data are means ± standard deviation.

Figure 4.
The relationships between anaerobic CO2 production potentials and anaerobic CH4 production potentials (left), and aerobic CO2 production potentials (right).
Figure 4.
The relationships between anaerobic CO2 production potentials and anaerobic CH4 production potentials (left), and aerobic CO2 production potentials (right).

Figure 5.
Mean SOM, TKN, NH4+-N, NO3−_N, available P concentrations and sulfate supply rate at different soil depths for the five land use types. Data are means ± standard deviation. Different letters represent significant differences in nutrient concentration among the land use types at a given depth (p < 0.05).


Table 1.
Water table, soil pH, and soil salinity for the five land use types at the Mai Po Marshes (means ± standard deviation, n = 3).
Table 1.
Water table, soil pH, and soil salinity for the five land use types at the Mai Po Marshes (means ± standard deviation, n = 3).
| Land Use Type | Water Table | pH | Salinity |
|---|---|---|---|
| cm | ‰ | ||
| Gei Wai forest | −18.00 ± 1.53 | 7.46 ± 0.14 | 5.33 ± 0.20 |
| Gei Wai water channel | 74.67 ± 2.40 | 8.10 ± 0.08 | 0.77 ± 0.00 |
| Reedbed | 0.70 ± 0.35 | 7.24 ± 0.12 | 7.10 ± 0.06 |
| Freshwater pond | 18.00 ± 2.52 | 6.91 ± 0.05 | 0.16 ± 0.00 |
| Mangrove | −2.33 ± 0.67 | 7.23 ± 0.01 | 11.73 ± 0.27 |
Table 2.
Concentrations of various soil C fractions in the top 10 cm soils for the five land use types (means ± standard deviation, n = 3).
Table 2.
Concentrations of various soil C fractions in the top 10 cm soils for the five land use types (means ± standard deviation, n = 3).
| Land Use Type | MBC | WSC | AHC | RMC | SOC |
|---|---|---|---|---|---|
| mg kg−1 | mg kg−1 | mg kg−1 | mg kg−1 | % | |
| Gei Wai forest | 1724 ± 86.0a | 394 ± 26.0a | 1519 ± 64.9a | 699 ±22.6a | 4.90 ± 0.06a |
| Gei Wai water channel | 856 ± 258.3b | 151 ± 46.8b | 587 ± 116.1b | 308 ± 94.1b | 2.50 ± 0.42b |
| Reedbed | 1218 ± 103.0c | 276 ± 51.2c | 1016 ± 218.4c | 510 ± 47.4c | 3.73 ± 0.16c |
| Freshwater pond | 796 ± 55.7b | 150 ± 17.0b | 664 ± 106.1b | 316 ± 20.6b | 2.28 ± 0.13b |
| Mangrove | 1134 ± 60.9c | 163 ± 19.2b | 975 ± 164.9c | 507 ± 49.4c | 2.58 ± 0.18b |
MBC: microbial biomass carbon; WSC: water-soluble carbohydrate carbon; AHC: acid hydrolyzable carbohydrate carbon; RMC: readily mineralizable carbon. Different letters indicate significant differences in mean concentrations among the land use types (p < 0.05).
Table 3.
Correlation coefficients between gas production potentials and soil properties across all land use types and depths in the top 50 cm soils (n = 12).
Table 3.
Correlation coefficients between gas production potentials and soil properties across all land use types and depths in the top 50 cm soils (n = 12).
| Land Use Type | Production Potential | Available P | NH4+-N | NO3−-N | SOM | TKN |
|---|---|---|---|---|---|---|
| Gei Wai forest | An-CH4 | 0.950 ** | 0.908 ** | n.s. | 0.918 ** | 0.917 ** |
| An-CO2 | 0.985 ** | 0.981 ** | n.s. | 0.991 ** | 0.992 ** | |
| Aero-CO2 | 0.972 ** | 0.982 ** | n.s. | 0.979 ** | 0.982 ** | |
| Gei Wai water channel | An-CH4 | 0.804 ** | 0.725 ** | n.s. | 0.722 ** | 0.788 ** |
| An-CO2 | 0.841 ** | 0.808 ** | n.s. | 0.924 ** | 0.930 ** | |
| Aero-CO2 | n.s. | n.s. | 0.639 * | n.s. | n.s. | |
| Reedbed | An-CH4 | n.s. | n.s. | −0.663 * | 0.744 ** | 0.736 ** |
| An-CO2 | n.s. | n.s. | −0.691 * | 0.780 ** | 0.861 ** | |
| Aero-CO2 | 0.697 * | n.s. | n.s. | n.s. | −0.663 * | |
| Freshwater pond | An-CH4 | n.s. | n.s. | n.s. | 0.792 ** | 0.875 ** |
| An-CO2 | n.s. | n.s. | n.s. | n.s. | n.s. | |
| Aero-CO2 | n.s. | 0.645 * | n.s. | n.s. | n.s. | |
| Mangrove | An-CH4 | −0.887 ** | n.s. | 0.632 * | 0.874 ** | 0.816 ** |
| An-CO2 | −0.707 * | n.s. | 0.600 * | 0.815 ** | 0.771 ** | |
| Aero-CO2 | n.s. | n.s. | n.s. | n.s. | n.s. |
‘*’ and ‘**’ indicate significant correlations at p < 0.05 and p < 0.01, respectively.
Table 4.
A summary of reported values of soil CH4 and CO2 production potentials in wetlands.
| Land Cover | Country | Depth | Incubation Period | Incubation Temperature (°C) | an-CH4 | an-CO2 | aero-CO2 | Source |
|---|---|---|---|---|---|---|---|---|
| Sphagnum- and sedge-dominated boreal peatland | Sweden | 0–60 cm | 8 d | 16 | 0–6 μg g−1 soil day−1 | - | - | [4] |
| Peatlands of natural, harvested and restored sites | Canada | 0–10 cm and depth near water table | 4 d and 30 d for aerobic and anaerobic incubation, respectively | 20 | 0.00–816, average of 21 μg g−1 soil day−1 | 10–290 μg g−1 soil day−1 | 40–150 μg g−1 soil day−1 | [57] |
| Freshwater marsh with different vegetation | USA | 0–10 | 28 d | 20 | 5.3–19.6 μg g−1 soil day−1 | 50–95 μg g-1 soil day-1 | 400–660 μg g−1 soil day−1 | [13] |
| Boreal forest, peatland, lakes, rivers and exposed bedrocks | Canada | 0–5 and 5–15 cm | 16 weeks | 22 | 0.11–20.69 μg C g−1 C day−1 | 290–1500 μg C g-1 C day-1 | 160–2560 μg C g−1 C day−1 | [22] |
| Peatlands of bogs, fens and swamps | Canada | 0–110 cm | 5 d | 15 and 20 | 0.01–100, average of 11.37 μg g−1 soil day−1 | 70–5000, average of 1800 μg g−1 soil day−1 | 580–5000, average of 3700 μg g−1 soil day−1 | [19] |
| Sphagnum-derived peat from Big Run Bog | USA | 5–10, 20–25 and 40–45 cm depth | 10 d | 19 | 1.68 to 249.6 μg g−1 soil day−1 for surface soil | 120–720 μg g−1 soil day−1 for surface soil | - | [63] |
| Peatlands of bogs, internal lawns, and permafrost mounds | Canada | 0–100 cm | 60 d | 25 | 0.16 and 0.32–9.6 μg g−1 soil day−1 for permafrost and no permafrost bogs, 12.8 for lawns | 120–260 μg g−1 soil day−1 | - | [64] |
| Peatlands of bog and fen | Canada | 0–10, 10–20 cm | 3 d | 0–25 | 0.10–0.27 μg g−1 soil day−1 for 20 and 25 °C | - | - | [9] |
| Freshwater marsh of wetland | China | 0–60 cm | 20 | 0.011–0.66 μg g−1 soil day−1 | - | - | [65] | |
| Estuarine brackish marshes | China | 0–30 cm | 3 d | 20 | 0.058–0.142 μg g−1 soil day−1 at 30 cm | - | - | [54] |
| Coastal meadow, freshwater fen | Denmark | 0–80 cm | 6 d | 24 | 0–0.8 μg g−1 C day−1 for meadow 0–3.84 μg g−1 C day−1 for fen | - | - | [55] |
| Hong Kong, China | China | 0–10, 10–20, 20–30, 30–50 cm | 14 d and 7 d for anaerobic and aerobic incubation, respectively | 25 | 0.00–0.27 μg g−1 soil day−1 | 4.96–61.14 μg g−1 soil day−1 | 19.06–97.91 μg g−1 soil day−1 | Our study |
© 2020 by the authors. Licensee MDPI, Basel, Switzerland. This article is an open access article distributed under the terms and conditions of the Creative Commons Attribution (CC BY) license (http://creativecommons.org/licenses/by/4.0/).
Share and Cite
MDPI and ACS Style
Xu, J.; Lai, D.Y.F.; Neogi, S. Effects of Land Use Types on CH4 and CO2 Production Potentials in Subtropical Wetland Soils. Water 2020, 12, 1856. https://doi.org/10.3390/w12071856
AMA Style
Xu J, Lai DYF, Neogi S. Effects of Land Use Types on CH4 and CO2 Production Potentials in Subtropical Wetland Soils. Water. 2020; 12(7):1856. https://doi.org/10.3390/w12071856
Chicago/Turabian StyleXu, Jiaxing, Derrick Y. F. Lai, and Suvadip Neogi. 2020. "Effects of Land Use Types on CH4 and CO2 Production Potentials in Subtropical Wetland Soils" Water 12, no. 7: 1856. https://doi.org/10.3390/w12071856
Note that from the first issue of 2016, this journal uses article numbers instead of page numbers. See further details here.