Article

Scots Pine Stem Parameters in Sites with Different Stand Densities in Lithuania

by
Lina Beniušienė
1,
Benas Šilinskas
1,
Ričardas Beniušis
2,
Marius Aleinikovas
1,
Edmundas Petrauskas
3 and
Iveta Varnagirytė-Kabašinskienė
1,*
1
Institute of Forestry, Lithuanian Research Centre for Agriculture and Forestry, Liepų str. 1, Girionys, LT-53101 Kaunas District, Lithuania
2
Lithuanian State Forest Service, Pramonės str., 11A, LT-51327 Kaunas, Lithuania
3
Vytautas Magnus University Agriculture Academy, Studentų str. 11, LT-53361 Akademija, 53101 Kaunas District, Lithuania
*
Author to whom correspondence should be addressed.
Forests 2020, 11(7), 716; https://doi.org/10.3390/f11070716
Submission received: 5 June 2020 / Revised: 23 June 2020 / Accepted: 24 June 2020 / Published: 28 June 2020
(This article belongs to the Section Forest Ecology and Management)

Abstract

:
Background and Objectives: The aim of this study was to determine the effects of different stand densities and thinning regimes on stem quality parameters, mainly branch characteristics, of Scots pine (Pinus sylvestris L.) trees. The study provides some input to the discussion about Scots pine stem quality responses to different forest management practices in relatively young stands. Materials and Methods: Total tree height, height to the lowest live and dead branch, diameter at breast height (DBH), and diameter of all branches from the whorls located up to 6 m from the ground were measured. The linear regression models to predict branch diameter, as the main parameter for the stem quality assessment, were developed based on stand density and stem parameters. Results and Conclusions: DBH, branch diameter and number of branches up to 6-m stem height were significantly higher in the stands with the lowest density. These stem parameters showed a relatively clear downward trend from the lowest to the highest stand densities. The main identified variables which significantly affected stem quality, were branch diameter and diameter of the thickest branch in the bottom part of the stem, at least up to 3-m stem height. For practical use, the best fitted model was estimated when stand density, DBH, and branch diameter up to 3-m height were included in a single equation. The developed model for branch diameter could be used as a forest management tool for managing stem-wood quality.

1. Introduction

Despite different silvicultural alternatives used in order to guarantee stand sustainability and various aspects of ecosystem services [1,2,3,4], the growth of potentially valuable trees with high-quality stemwood remains one of the main objectives of traditional forest management. Forest managers use silvicultural techniques to maximize tree growth. Locally and globally, in the context of climatic changes, it is important to determine the rational way in which forest stands will produce the highest possible production in the shortest period of time [5].
In many countries, traditional forestry practices provide different forest harvesting systems in managed or commercial forests, including different intensities of intermediate and precommercial cuttings [6,7]. A combination of the appropriate environmental conditions and optimal harvesting regime is an important option for achieving increased forest stand productivity and improving stem quality. Thinning accelerates diameter growth and improves stand composition. The quality of tree stems also varies because of site conditions or past management practices. In the sites of medium fertility typical for Scots pine, relatively large variations in stem quality are often observed [8]. As overviewed by [8], the codominant trees with narrow crowns and thin branches form the best-quality stems. It was also indicated that the main factors determining the log quality, such as the number of branches and diameter, highly correlate with stem diameter.
Several decades ago, the development of models for Scots pine stands was begun for multiple objectives. The response of tree growth to thinning was extensively studied in forest science [9], but the thinning regime remains very important in forest management practice. Many thinning experiments with different designs and methods were established, mainly for Scots pine growth and yield assessment [5,10,11,12,13,14,15]. Studies on site- and climate-specific responses are required due to the large distribution of this tree species [16]. As noted by Ikonen et al. [14], initial stand density, density post-thinning, tree growth, mortality, and the self-clearing of branches along the stem influence the quality of the sawn timber. Furthermore, the suitability of roundwood for the wood industry is determined by stem volume and wood quality, including the properties of the branches. Previous studies indicate that the main stem quality parameters that can be directly measured are tree diameter at breast height, tree height, and number and size of branches [17]. According to other studies, the best independent variables showing branch increment were stem radial increment, height/diameter ratio, and branch age [18]. Scots pine is particularly characterized by a strong relationship between stem diameter growth and branch thickness [18,19,20,21].
As mentioned above, spacing affects branching and stem growth. Generally, high initial stand density and thinning are associated with lower branching; on the other hand, a large increase in tree diameter was found to result in a higher probability of branching [22]. More precise branching predictions can be made by including information about tree diameter, tree height, and stand density at an early stage of stand development.
Scots pine (Pinus sylvestris L.), as a coniferous species of great economic importance, is widespread around the world, especially in the northern regions. In Lithuania, which represents the southern part of the hemiboreal forest zone, Scots pine is a highly valued tree species. However, very few studies have reported about the stem quality parameters of this coniferous species in the Baltic region. In this context, the objective of this study was to examine how different stand densities and thinning regimes influenced stem quality parameters, mainly the characteristics of branches along butt logs (0–6-m log) of Scots pine (Pinus sylvestris L.) trees. This study was conducted within a long-term experiment, where various aspects were explored over different time periods. The effects of stand density and thinning on the growth, mortality, productivity, and main wood properties have previously been published by Kuliešis and Saladis [23] and Šilinskas et al. [24].

2. Materials and Methods

2.1. Study Site and Material

The study was conducted in Lithuania, which is in the temperate climate zone. The climate is characterized as transitional between the mild Western European and continental Eastern European climates [25]. During the period of 1981–2010, the mean air temperature was 6.9 °C, and the mean annual precipitation was 695 mm. Lithuania represents the southern part of the hemiboreal forest zone. Forests cover 2.2 million ha, which corresponds to 33.6% of the land area [26]. Coniferous stands cover 55.6% of the forested area; among them, Scots pine (Pinus sylvestris L.) covers 34.6%.
For this study, two pure Scots pine study sites were selected in a long-term experimental area, which was initially established by the Lithuanian Forest Institute in 1990–1992 [23]. The experimental area was established with the aim of investigating Scots pine growth under different thinning regimes.
The first study site, including five study plots numbered from A1 to A5, was selected in the southern part of Lithuania, in Valkininkai (Latitude 54°25′29”; Longitude 24°58′12”). The second study site, including five study plots numbered from F1 to F5, was selected in the Central Lithuania, in Jurbarkas (Latitude 55°05′20”; Longitude 22°13′47”) (Table 1). The first study site was established in the former agricultural soil, and the second study site was established in the forest soil. Both Scots pine sites were ploughed in rows every 2.0 m before planting. In the first site, one-year-old pine seedlings were planted with the initial density of 10,000 seedlings ha−1 in 1982. In the second site, 7140 seedlings ha−1 were planted in 1988, followed by additions with approximately 2000 seedlings ha−1 the year after planting.
The soil is classified as Dystric Arenosol in the first study site, and as Albic Arenosol in the second study site, according World Reference Base for Soil Resources 2014 [28]. The forest site types are normal moisture regime fertile with light soil texture sandy soil (Ncl) in the first study site, and normal moisture regime poor with light soil texture sandy soil (Nbl) according to the Lithuanian classification of forest site types [27].

2.2. Field Measurements

As given in Table 1, the selected study sites represented different stand densities and five thinning regimes, including the treatment without thinning. The number of trees in 1 ha left after the first thinning is taken as a reference stand density (SD) in this paper.
Before assessment, the trees in both sample sites were mapped. For the assessment, the trees were chosen using a probabilistic systematic sample system. The selected stem quality parameters of standing trees were measured during the study: total tree height, height of the lowest live and dead branches (m), tree diameter (cm), and the diameters of each branch (cm) per whorl along a butt log (hereafter, 0–6-m log).
The tree diameter was measured with a tree caliper (precision 1 mm) at 1.3 m above ground (diameter at breast height, DBH) for all selected trees. For each selected tree, tree height (H), height of the lowest live branch (Hlb), and height of the lowest dead branch (Hdb) were measured with a tape measure.
Branch diameter (Dbr) was measured 1 cm from the branch bark ridge and collar, parallel to the stem axis, for each branch per whorl. The measurements were made for all live and dead branches of diameter equal to or thicker than 10 mm. The mean values were further calculated and assigned to the groups 0–3-m log (Dbr0-3), 3–6-m log (Dbr3-6), and 0–6-m log (Dbr0-6) from root collar, where roots join the stem. The diameter of the thickest branch per whorl was fixed accordingly, obtaining the values for Dmaxbr0-3, Dmaxbr3-6, and Dmaxbr0-6. All branches per each whorl were counted, and the values were given as mean values per tree (Nbr0-6) or for individual logs as Nbr0-3 and Nbr3-6 within each study plot. The percentage branch area (Brarea) was calculated as a ratio between cumulative cross-sectional area at branch collar (cm2) and outer surface area of 0–6-m log (cm2) of every tree multiplied by 100.
The sections of 0–6-m log, including both 0–3-m and 3–6-m logs, were taken as a base for this study according to the National standard [29]. The standard sawlog lengths usually run from 3 to 6 m.
In total, 610 trees were measured in ten study plots within two study areas. The field measurements were made from autumn 2018 to early spring 2019.

2.3. Data Analysis

The obtained data were analyzed using the statistical package SAS 9.4 (SAS Institute Inc., Cary, NC, USA). To determine the significant differences between the sites with different stand densities, ANOVA followed by Duncan’s multiple range test was used. Different letters next to the mean values show statistically significant differences at p < 0.05 between the sites. Pearson correlation was applied to measure the linear correlation between two variables.
The Dbr was modelled using SAS general linear models. The model for Dbr was created including the following parameters: stand density (SD), H, DBH, Dbr0-3, Dbr3-6, Nbr0-3, Nbr3-6, Dmaxbr0-3, Dmaxbr3-6, Brarea. All parameters in the models were chosen as random effects.
For the prediction of Dbr based on the stand and tree characteristics, the following general equation was developed:
Dbr = a0 + a1SD + a2DBH + a3H + a4Dbr0-3 + a5Dbr3-6 + a6 Nbr0-3 + a7 Nbr3-6 + a8 Dmaxbr0-3 + a9 Dmaxbr3-6 + a10 Brarea + ε
Here, a0 is the intercept; a1,a2, … an are parameter estimates; SD is stand density; DBH is diameter at breast height; H is tree height; Dbr0-3 is the branch diameter in 0–3-m log from ground level; Dbr3-6 is branch diameter in 3–6-m log; Nbr0-3 is the number of branches in 0–3-m log; Nbr3-6 is the number of branches in 3–6-m log; Dmaxbr0-3 is the diameter of the thickest branch in 0–3-m log; Dmaxbr3-6 is the diameter of the thickest branch in 3–6-m log; Brarea is the percentage branch area from 0–6-m log surface area (Brarea); and ε is an error term.
For the best result, the linear models were improved by eliminating non-significant parameters at p < 0.05.

3. Results

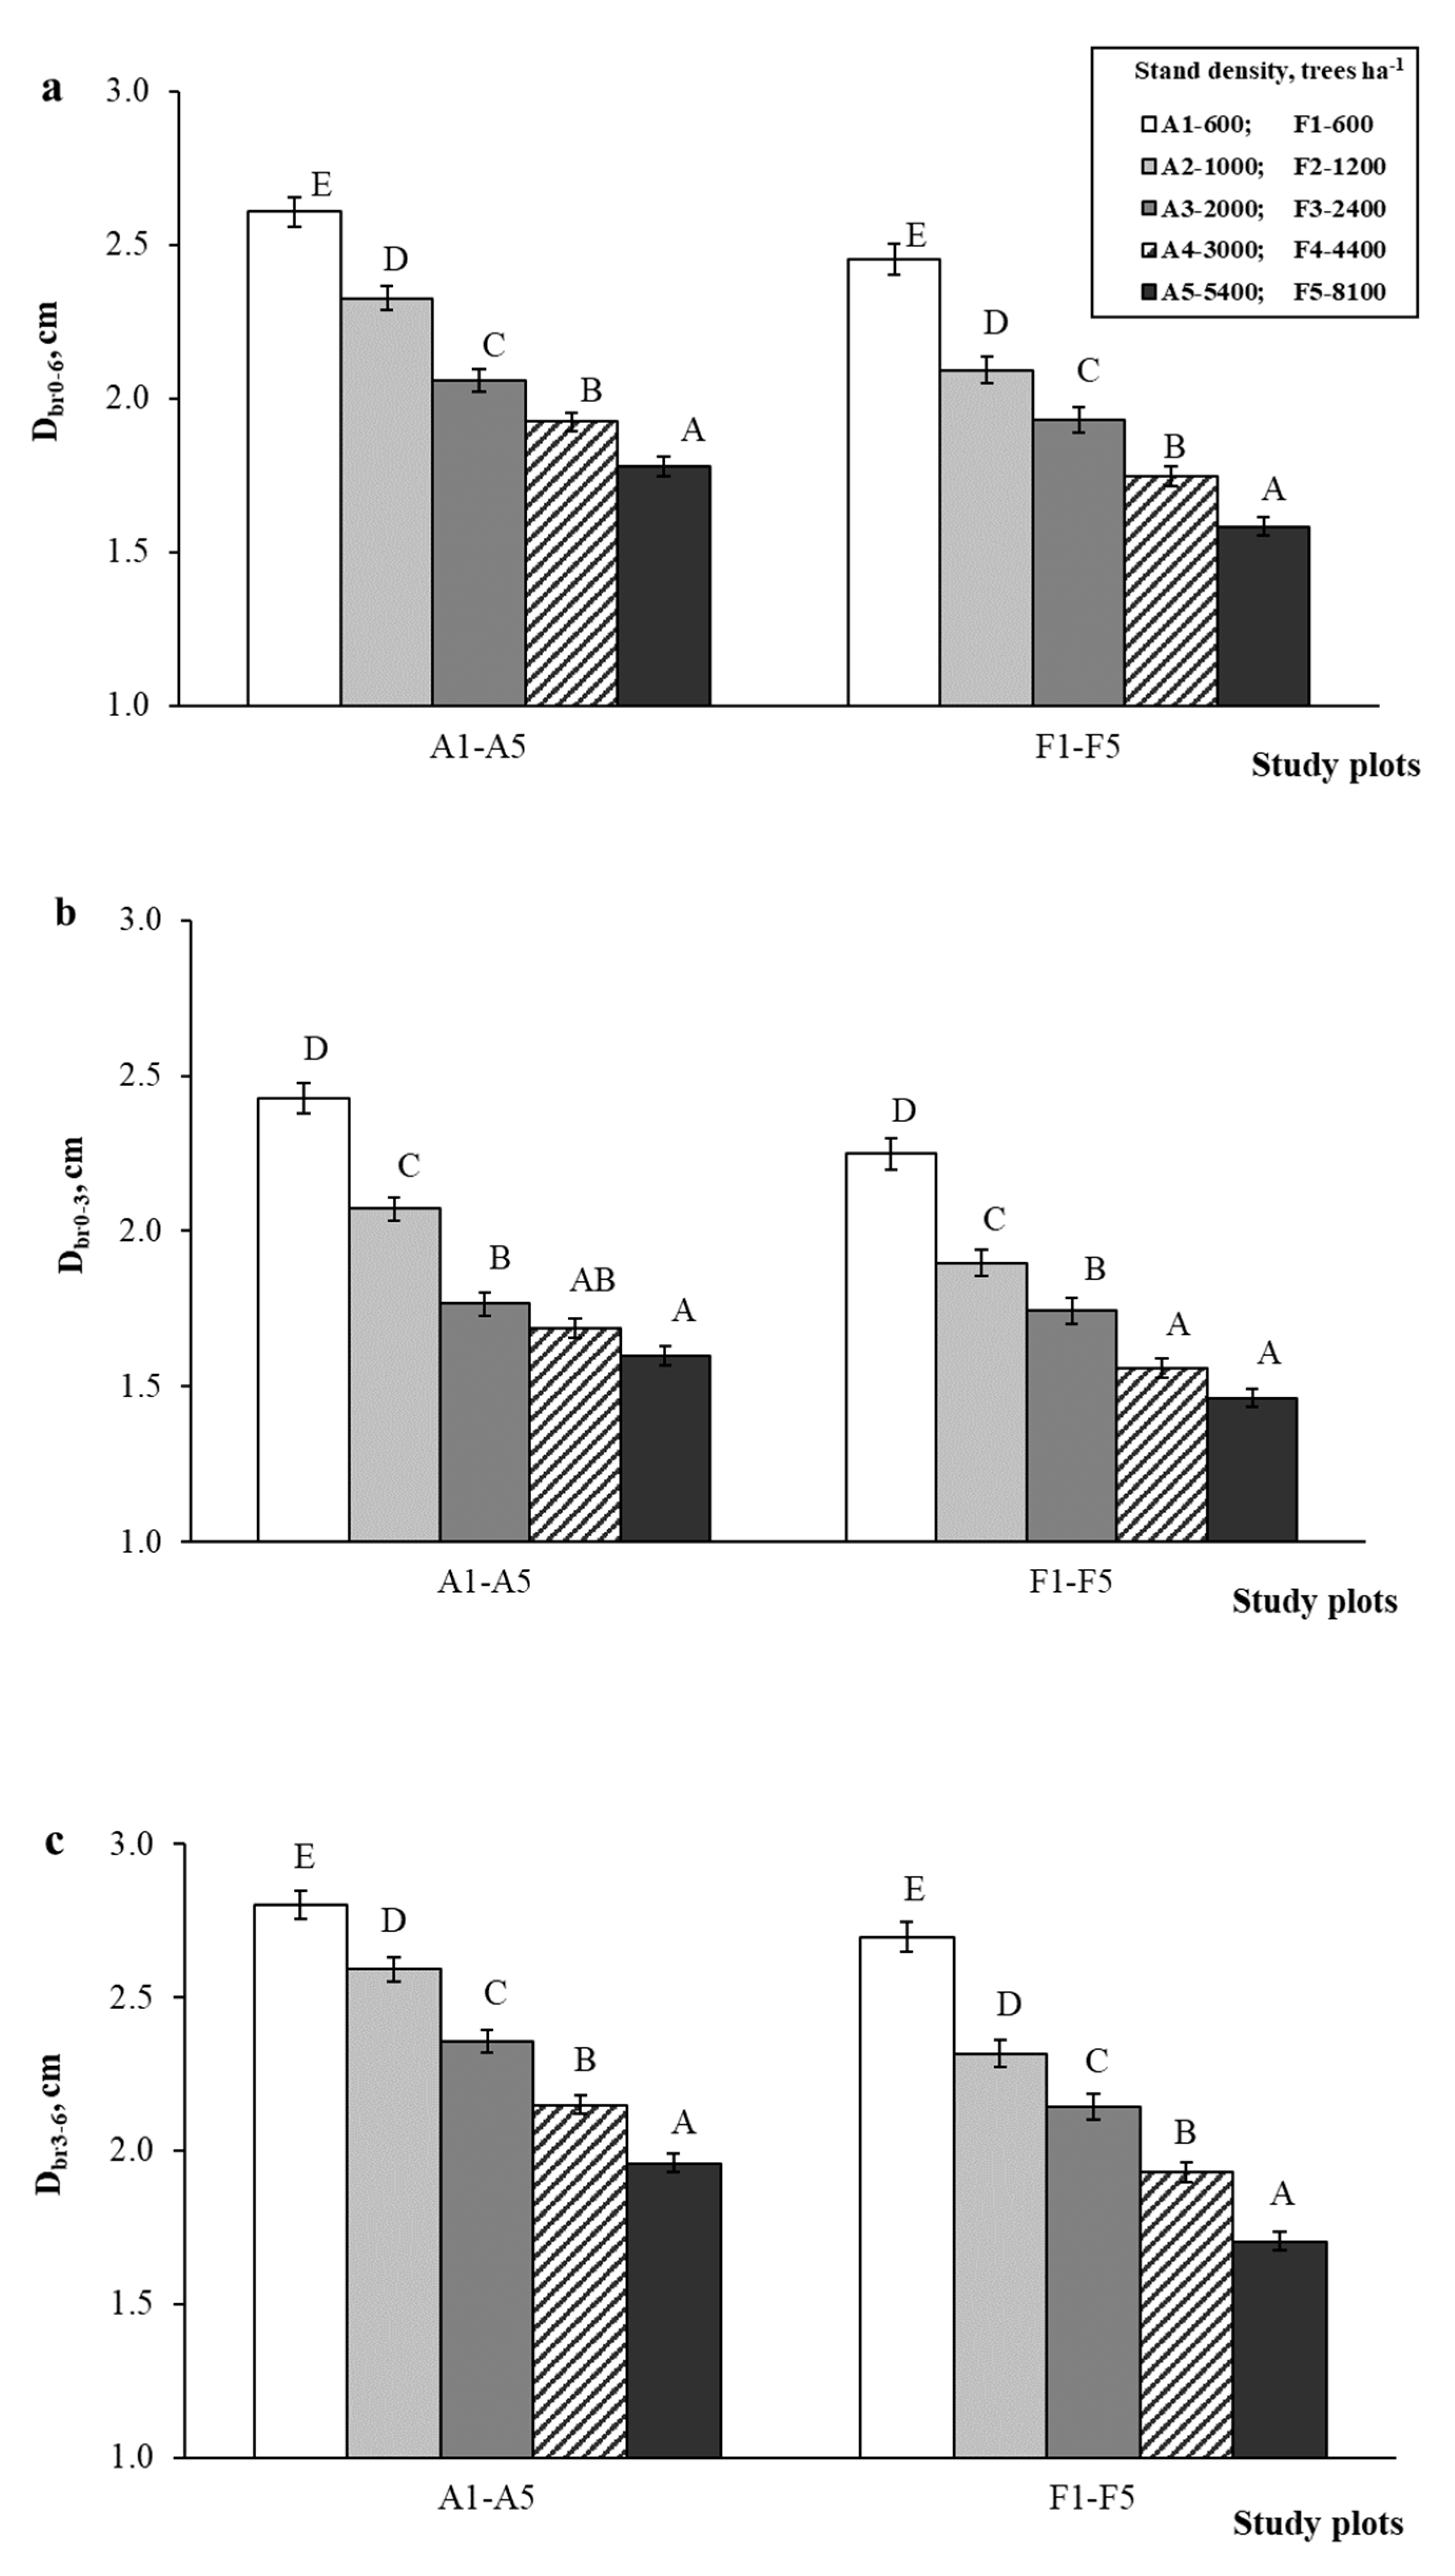
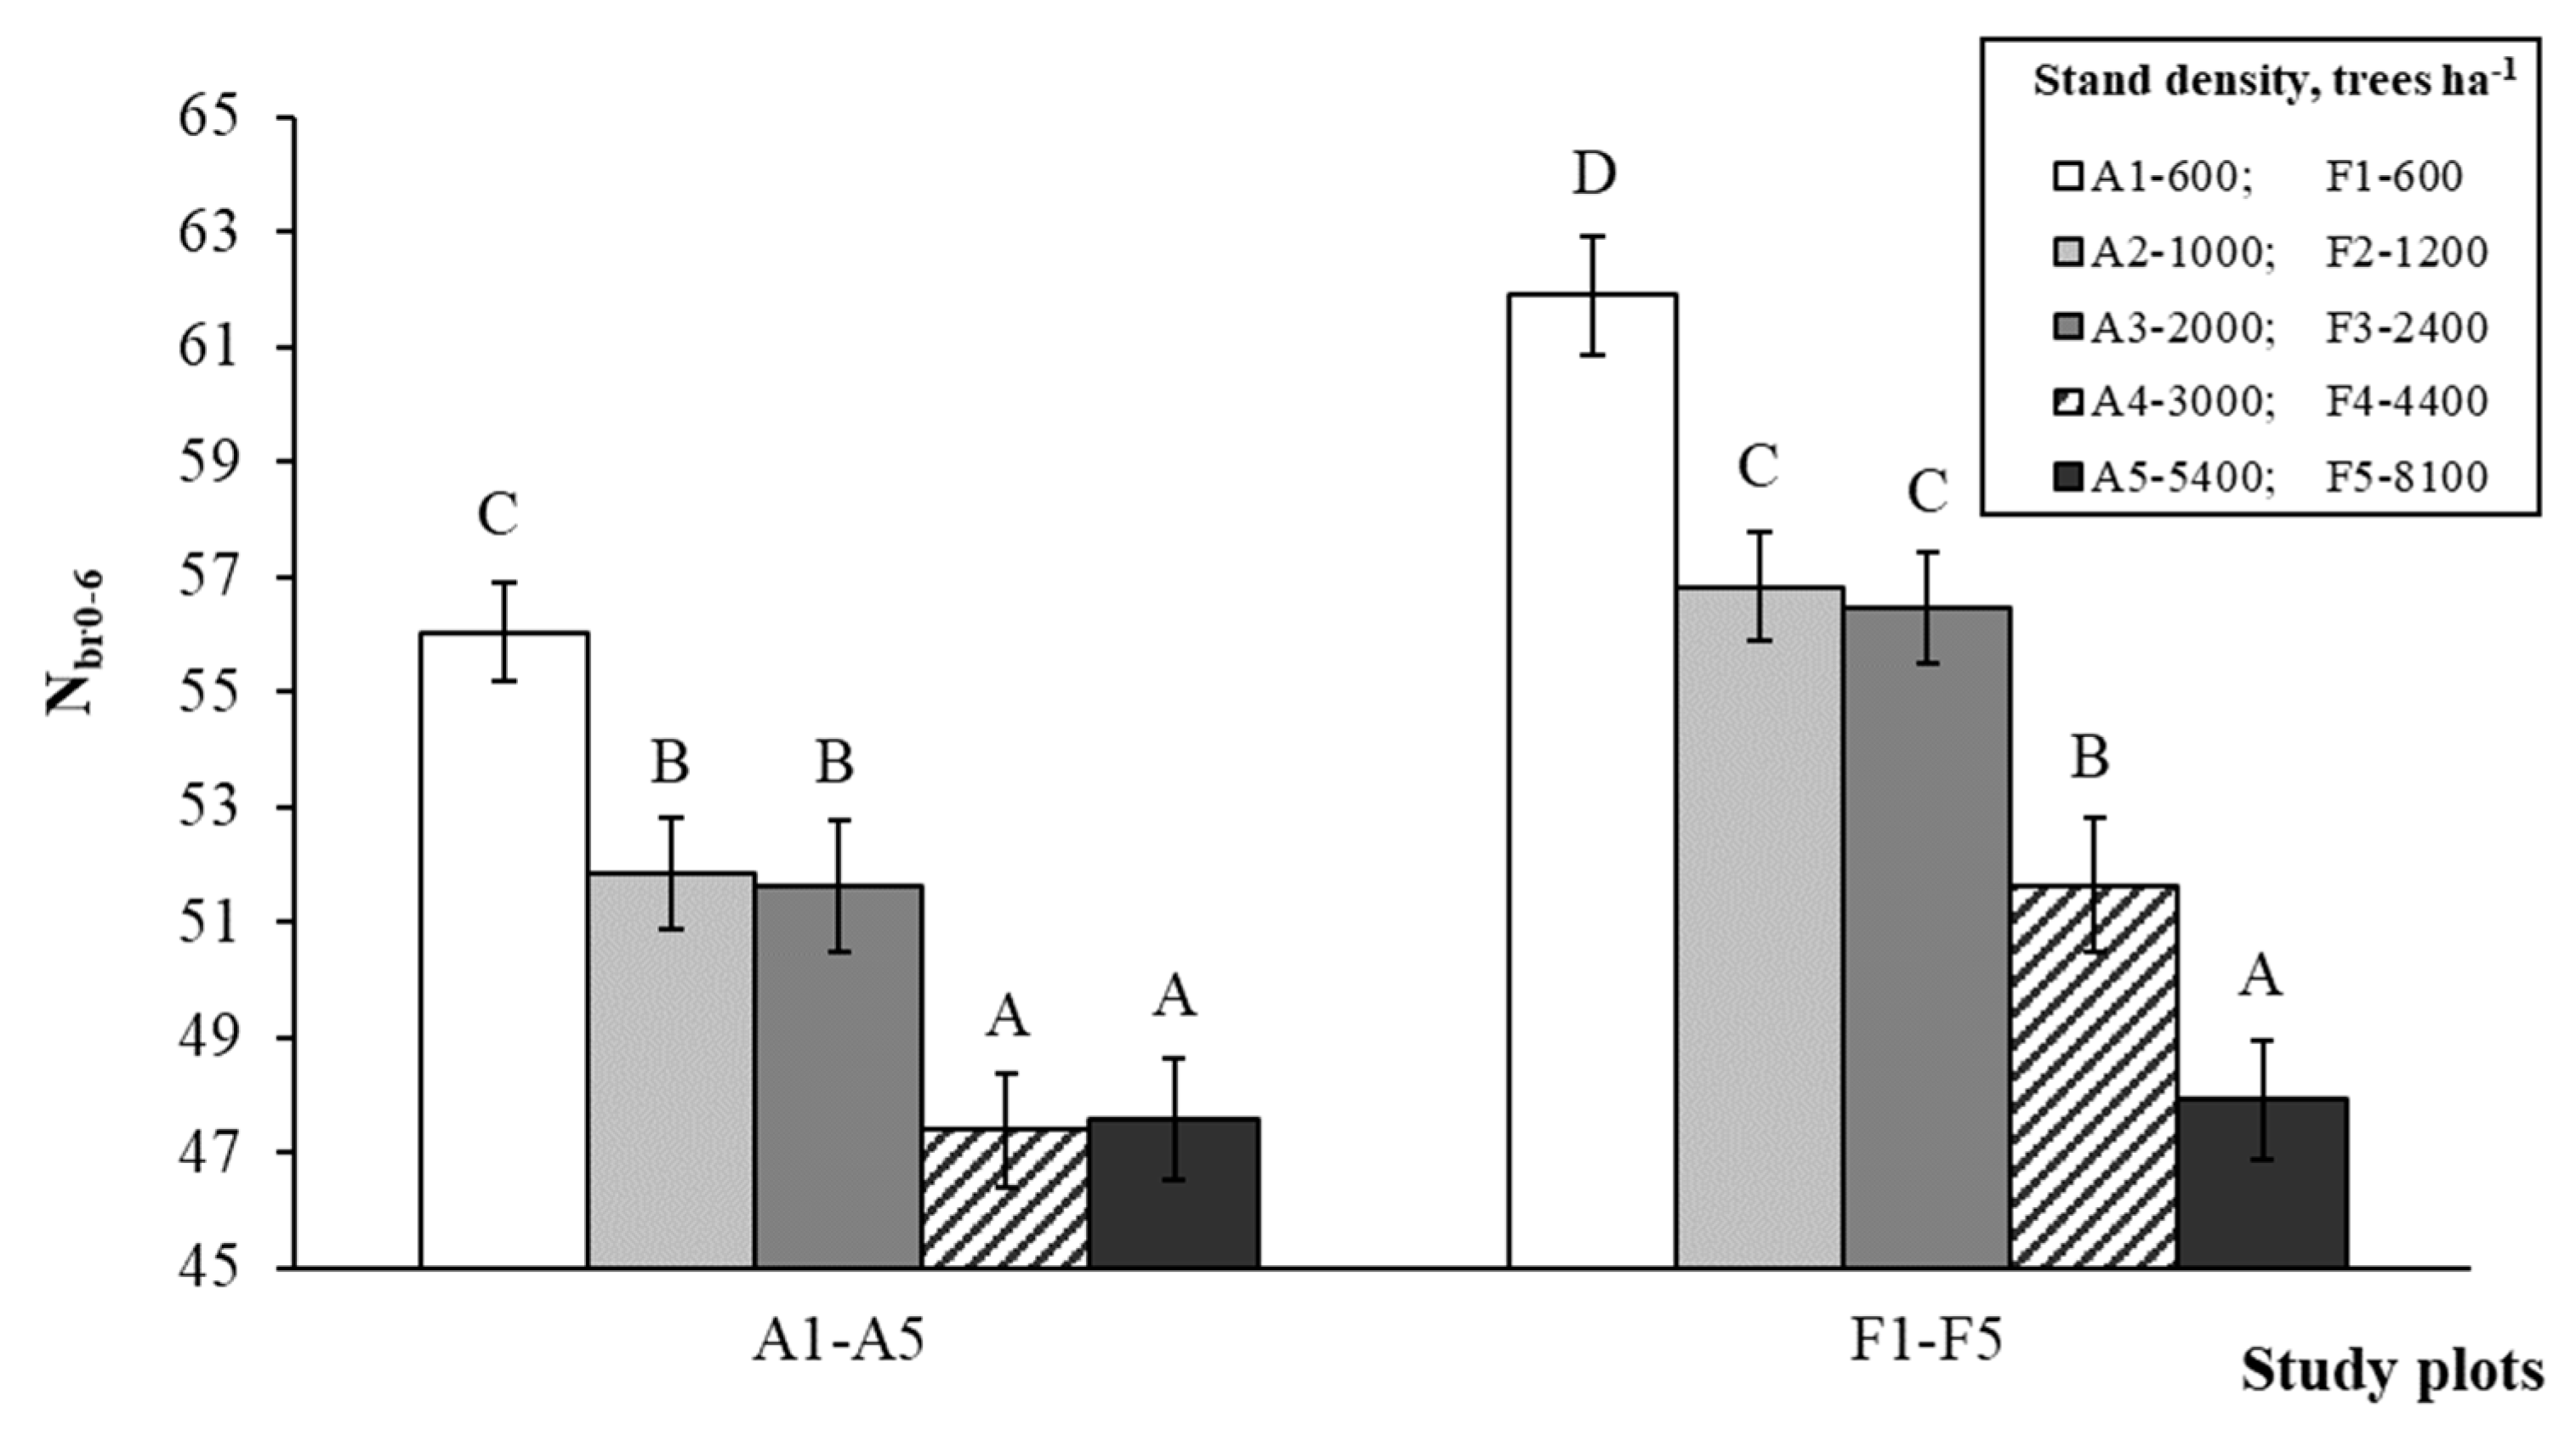
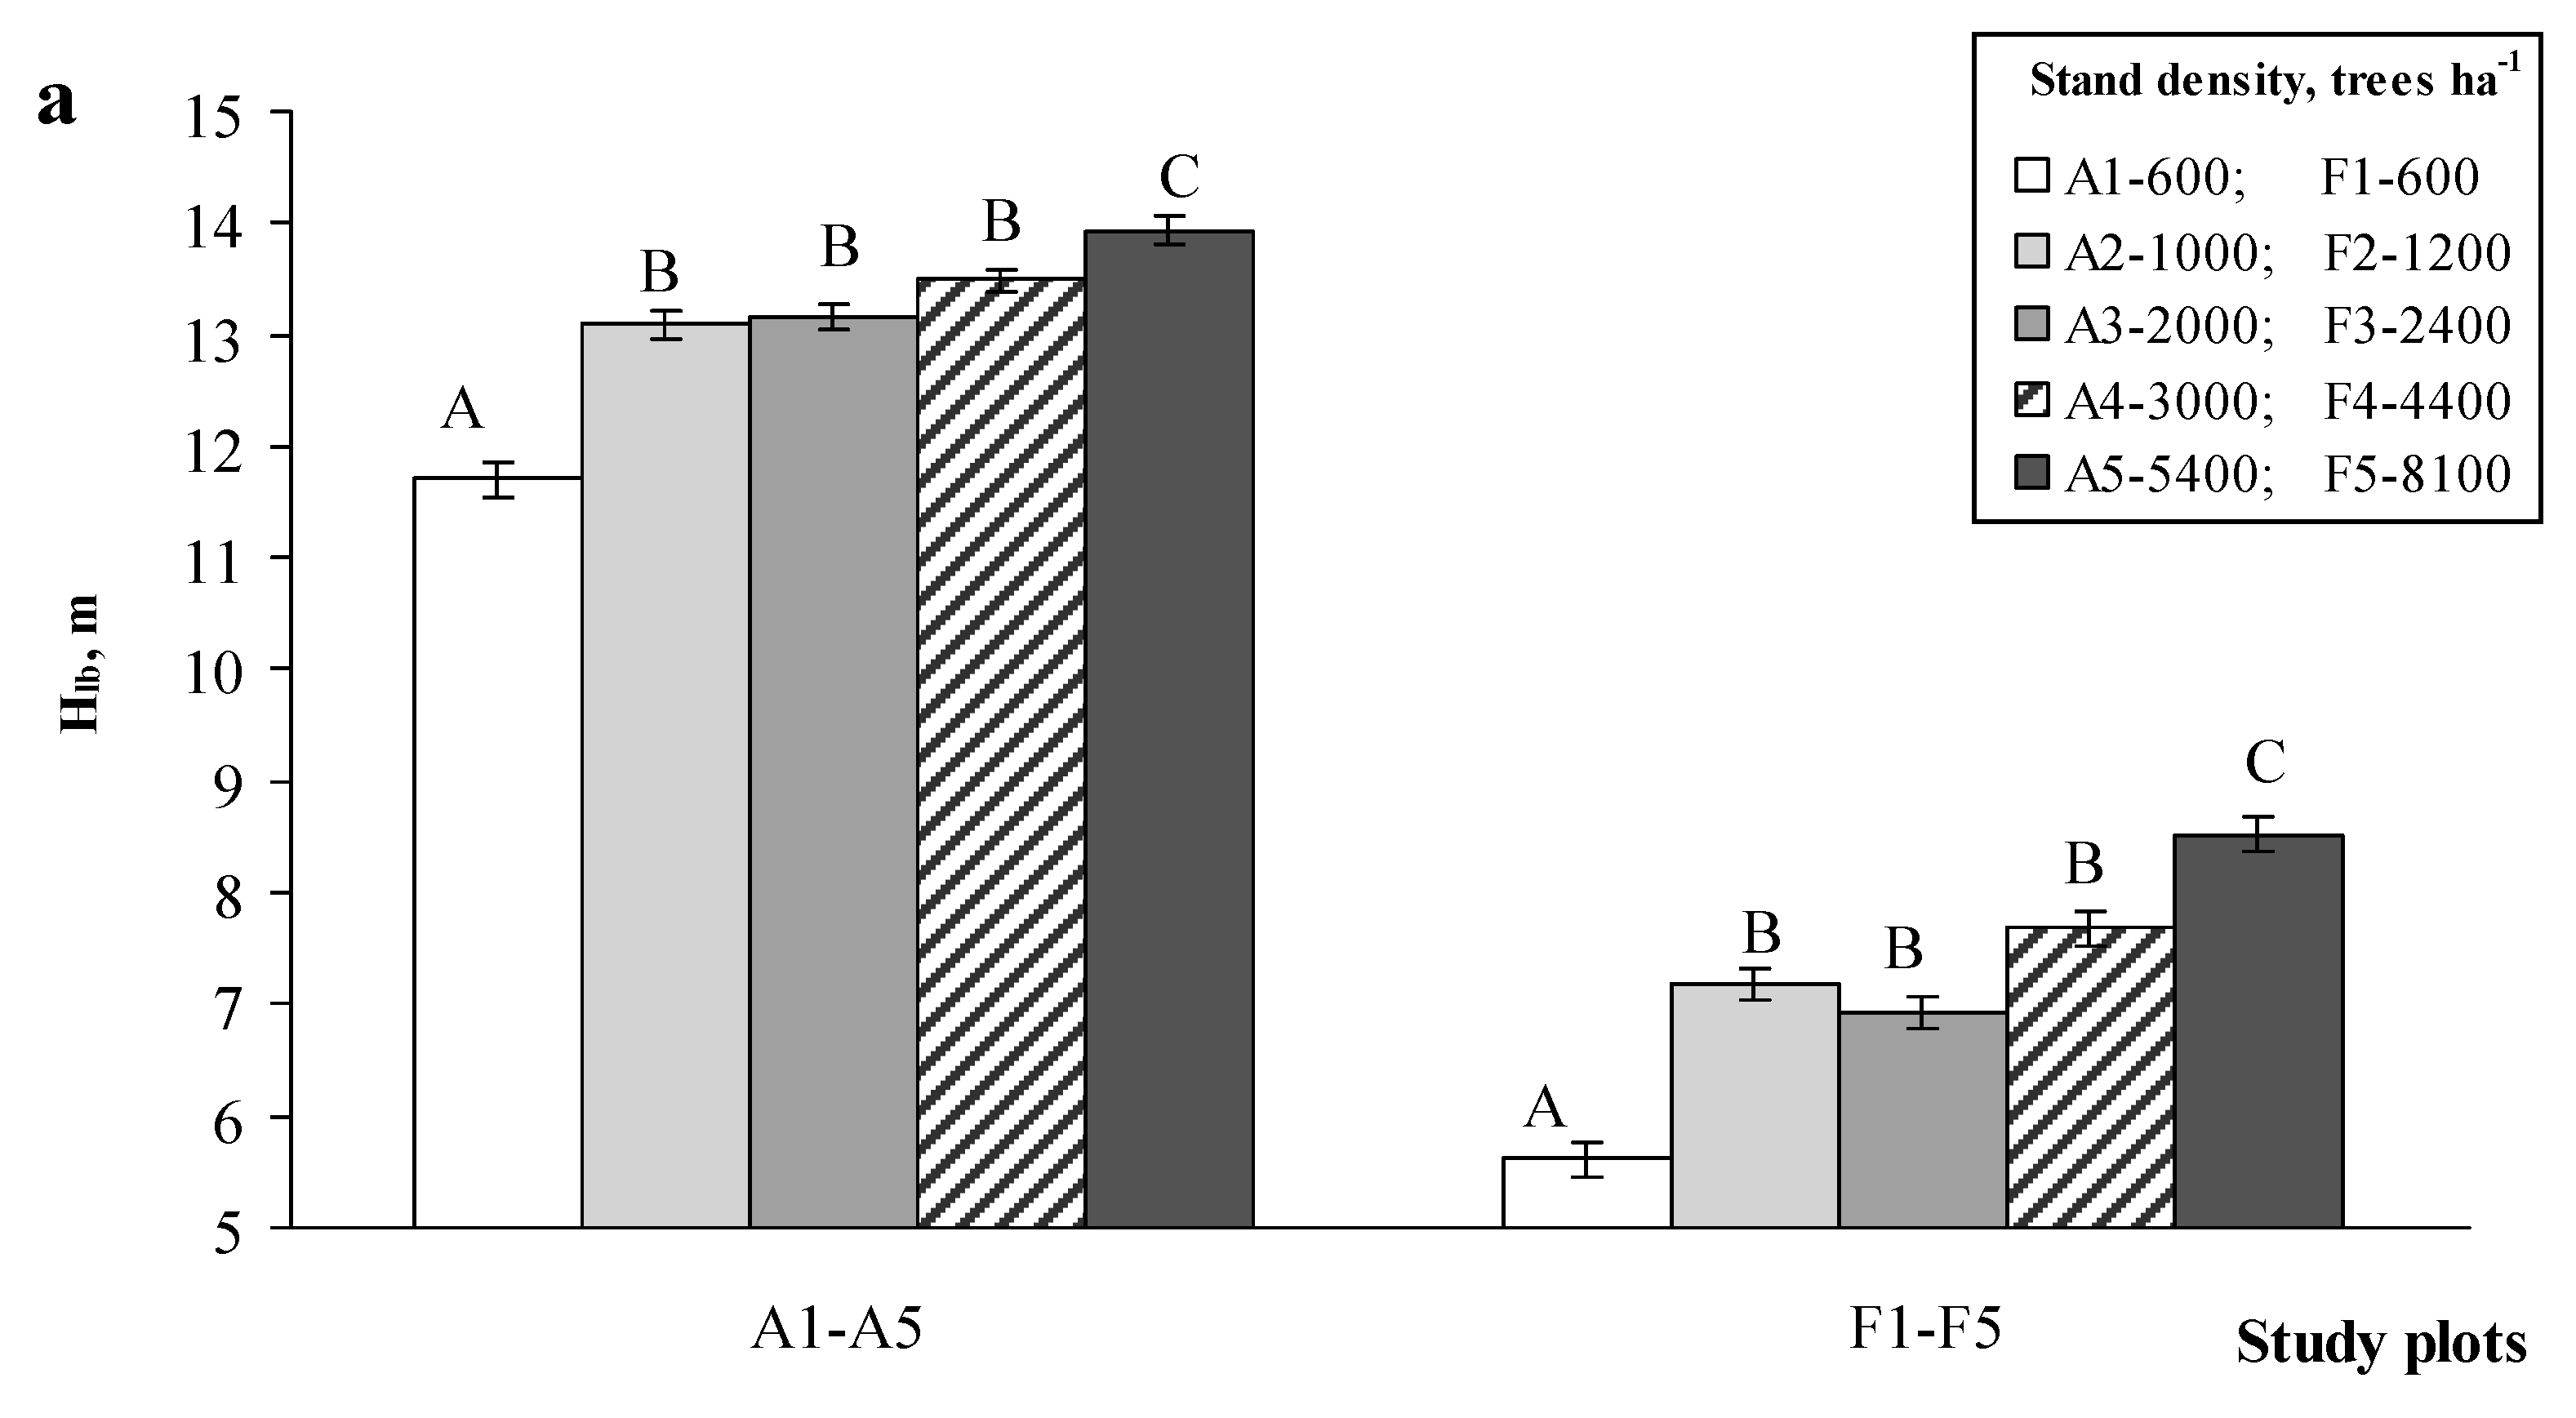
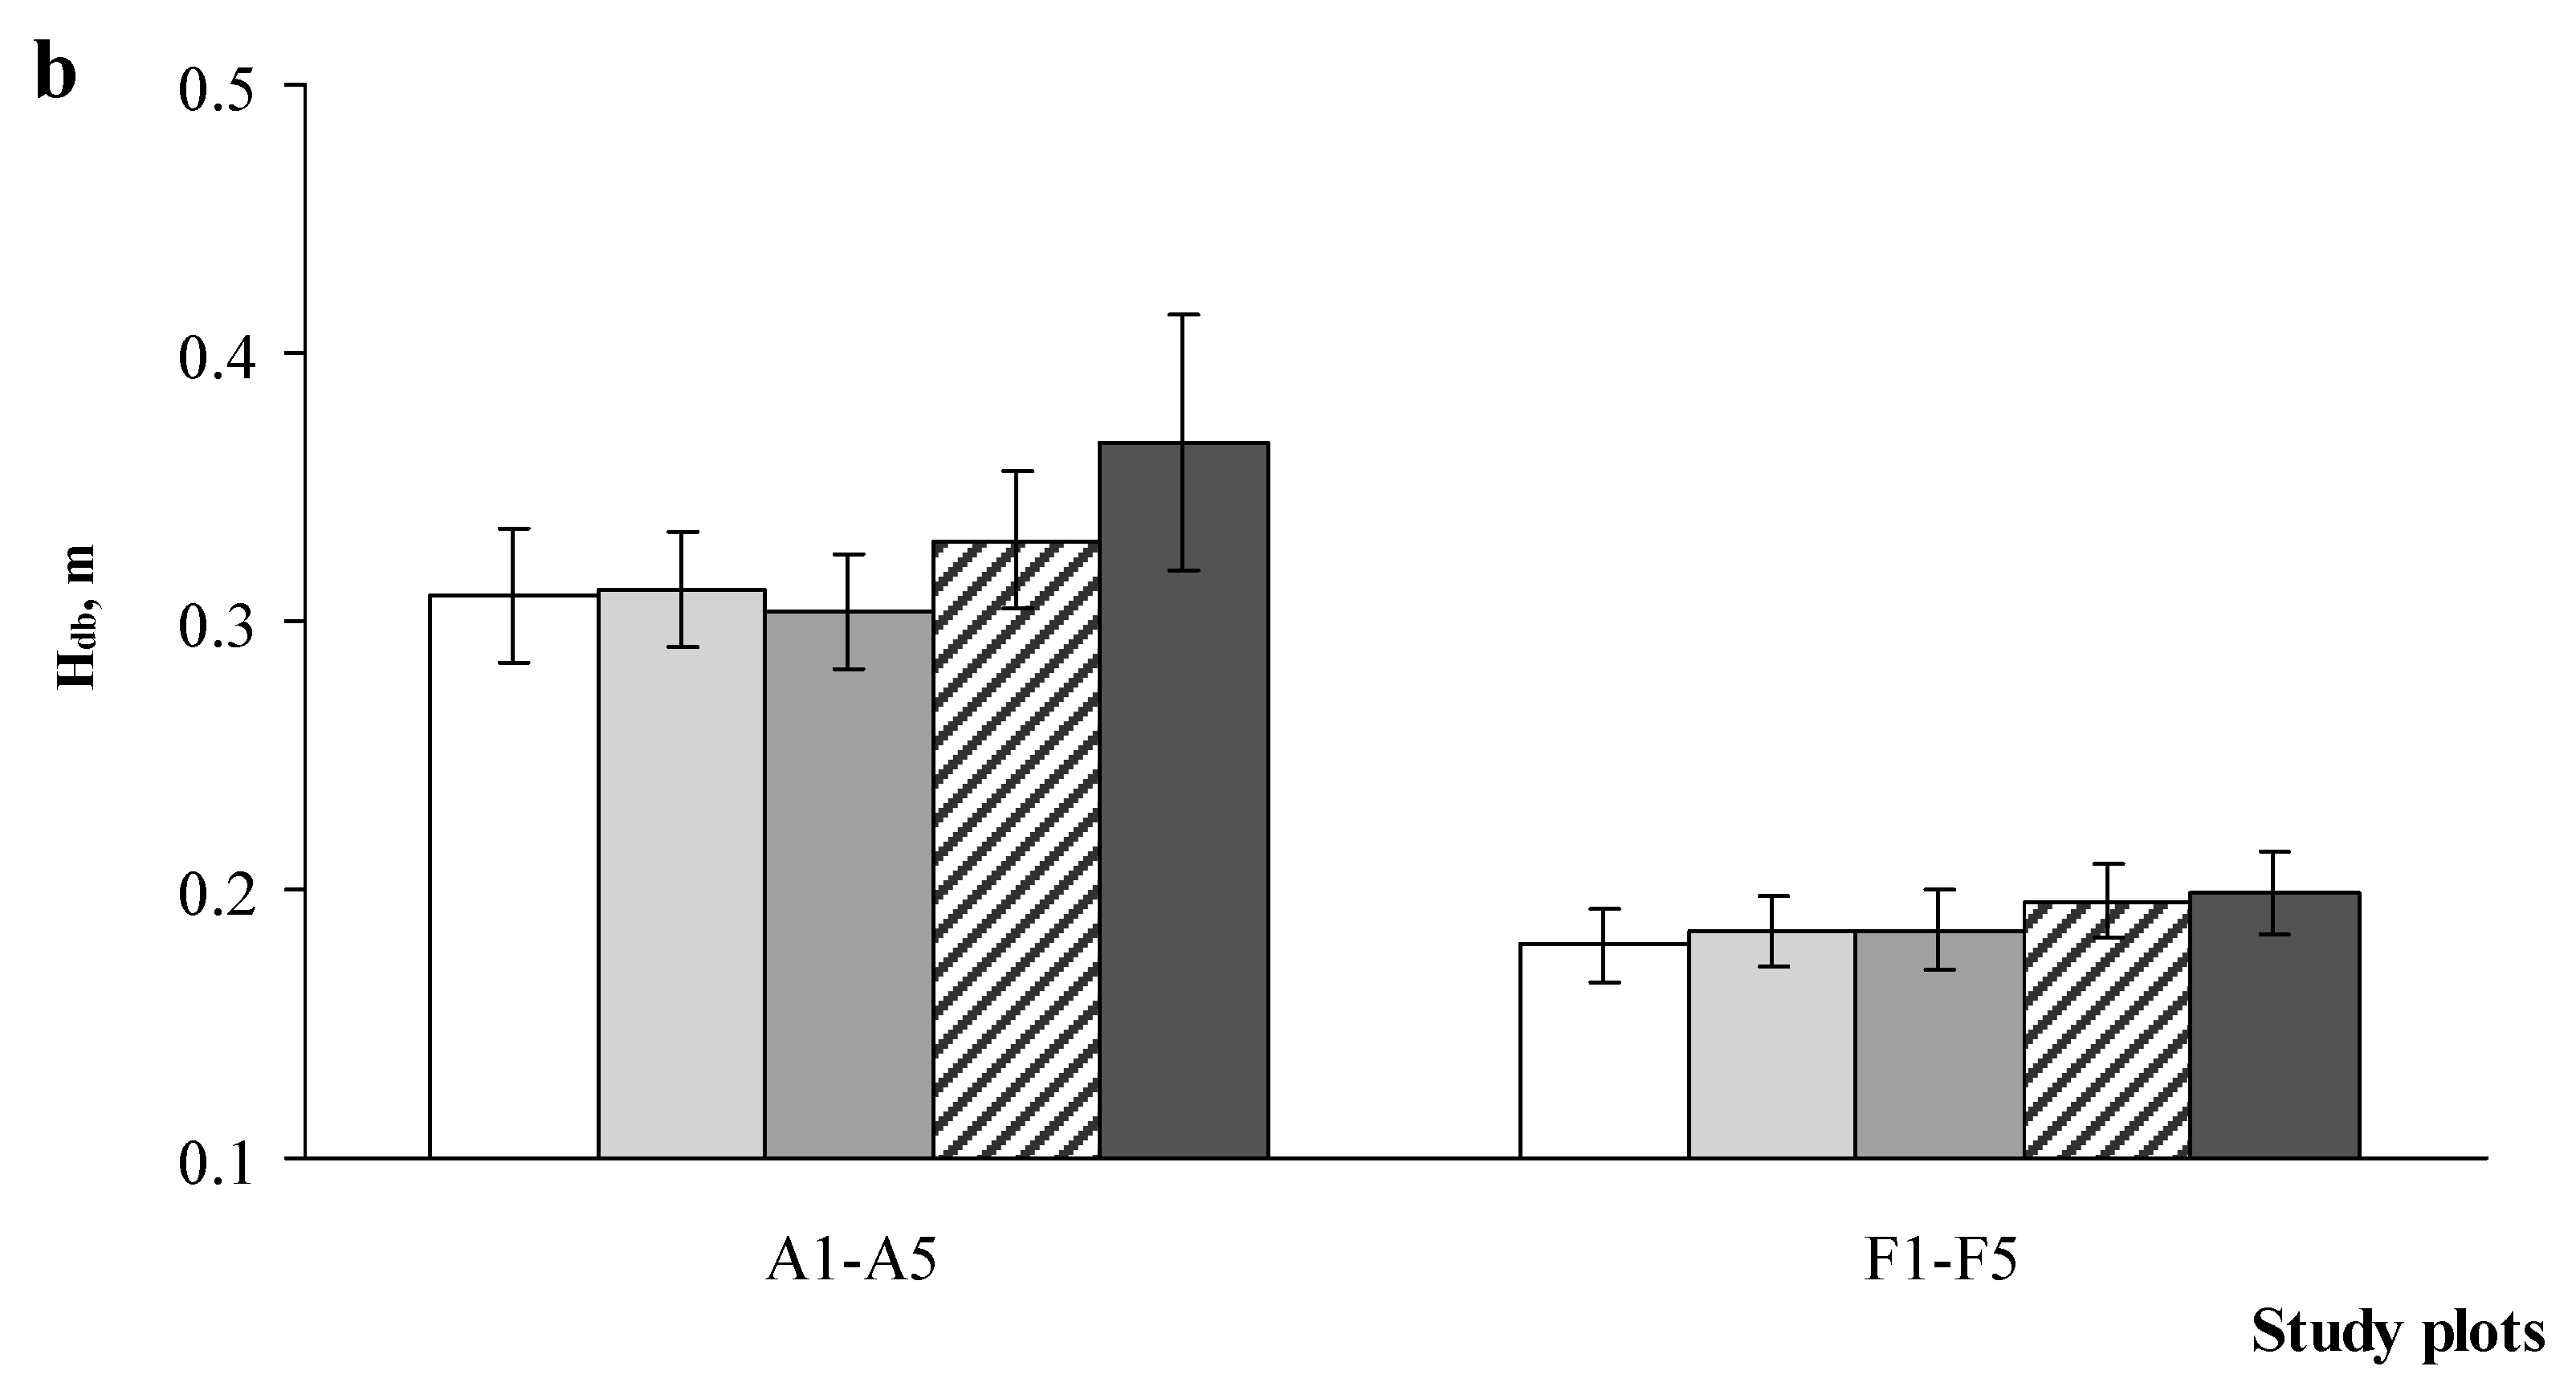
3.1. Tree Growth Properties at the Sites of Different Stand Densities

When the effects of different treatments, involving stand densities (SD) of 600, 1000–1200, 2000–2400, 3000–4400, and 5400–8100 trees ha−1 and thinning regimes, on the main stem quality parameters were compared, no statistically significant (p > 0.05) effect was found on mean tree height (H) (Table 2). The mean H ranged between 19.4 and 20.0 m in Scots pine plots on former agricultural land, and between 14.0 and 14.8 m in the plots on forest land (characteristics of the study plots A1–A5 and F1–F5 are given in Table 1). The differences in mean H between the lowest and highest stand densities were 0.6 and 0.8 m in the study plots A1–A5 and F1–F5, respectively.
There were statistically significant (p < 0.05) differences in mean tree diameter at breast height (DBH) between all treatments, except the mean DBH values between the stand densities of 2000–2400 and 3000–4400 trees ha−1 (Table 2). Most likely due to younger stand age, the mean DBH was slightly lower in the sites F1–F5 than in sites A1–A5. However, it was larger by 7.2 cm or 1.4–1.5 times in the stands with the lowest density (600 trees ha−1) compared to the stands with the highest density (5400–8100 trees ha−1).
The calculated percentage branch area from 0–6-m log surface area (Brarea) showed the highest values in the sites with the stand density of 600 trees ha−1 (Table 2). The Brarea was lower by 1.9–2.2 times in the plots with the stand densities higher than 2400–3000 trees ha−1 at both study sites. However, statistically significant (p < 0.05) values were obtained between A1 and A4–A5 and between F1 and F4–F5, respectively.
The mean branch diameter in 0–6-m log (Dbr0-6) decreased significantly with increasing SD (Figure 1a). The Dbr0-6 values between the lowest and the highest stand densities differed by 1.5–1.6 times or 0.83–0.87 cm in both study sites. Slightly lower Dbr0-6 values were found for F1–F5 than A1–A5 study sites. When comparing the bottom (0–3-m) and upper (3–6-m) stem logs, the mean branch diameters (Dbr0-3, 0–3-m log and Dbr3-6, 3–6-m log) in both logs decreased significantly with increasing stand density (Figure 1b,c).
The number of branches in 0–6-m log (Nbr0-6) tended to decrease with increasing SD (Figure 2). However, significant differences in Nbr0-6 were not obtained between all treatments (i.e., very similar numbers of branches were found for the adjacent sites of A1 and A2, A3 and A4; as well as for sites F3 and F4). Nbr0-6 differed by 1.2–1.3 times between the highest and the lowest SD in both Scots pine sites.
To identify the influence of SD on stem growth and branch development, the mean height of the lowest live branch (Hlb) and height of the lowest dead branch (Hdb) were measured in both Scots pine sites (Figure 3). The Hlb value tended to increase with increasing stand density. Statistically significant (p < 0.05) differences for the Hlb were obtained between the lowest SD in comparison with the average and highest SD (Figure 3a). The Hlb values differed by 1.2 and 1.5 times between sites A1 and A5 and sites F1 and F5, respectively. No significant differences were obtained for the Hdb values in the sites with different SD (Figure 3b). The mean values for Hlb and Hdb differed between sites A1–A5 and F1–F5. Although the trees were more than 30 years old no significant differences between the soil nutrient concentrations were found at this stage, the early effect of former land-use could have influenced this response.

3.2. Relationships of Stand and Tree Characteristics with Stem Quality Parameters

The correlation coefficients between stand and tree characteristics with stem quality parameters for both Scots pine study sites are presented in Table 3. The SD and main tree characteristics (H, DBH) showed various degrees of correlation with the branch parameters. No specific differences between the sites were obtained, except the non-significant correlations between Hlb with other stem parameters in the study plots F1–F5.
There were moderately strong negative correlations between SD and DBH, Dbr0-6, Dbr0-3, Dbr3-6, Dmaxbr0-3, Dmaxbr3-6, and Brarea in both sites. Similar correlations were found between Hlb with Dbr0-6, Dbr0-3, and Brarea. A strong correlation was found between DBH with Dbr0-6, Dbr0-3, and Dbr3-6: the correlation coefficient was r = 0.65–0.78 for the study plots A1–A5 and r = 0.76–0.87 for the study plots F1–F5. Strong to very strong correlation (r = 0.75–0.95) was found between Dbr0-6 and all branch parameters, except Nbr0-6.

3.3. Modelling Branch Diameter in Relation to Stand and Tree Characteristics

The models determined by the stepwise procedure are given in Table 4. First, a general linear model (Model 1), including all available variables from this study was estimated (Table 4). The Dbr was predicted by the SD, DBH, and H as basic variables, and branch diameters Dbr0-3 and Dbr3-6, amount of branches Nbr0-3 and Nbr3-6, diameters of the thickest branch Dmaxbr0-3 and Dmaxbr3-6, and the percentage branch area from 0–6-m log surface area (Brarea). As the next step, the linear model was improved by removing non-significant (p < 0.05) and highly correlated variables from the model and testing several options. Giving priority to the variables that are easily measurable in the bottom part of stem, the Model 2 was estimated (R2 = 0.942). This model included SD, DBH, Dbr0-3, and Dmaxbr0-3. A very similar result was obtained when tree H was also included, and Model 3 with R2 = 0.945 was estimated.
Finally, two relatively simple but well-fitted models were estimated when the variables Dbr0-3 (Model 4; R2 = 0.9410) and Dmaxbr0-3 (Model 5; R2 = 0.8029) were included with SD and DBH (Table 4). The Dbr predicted by the SD, DBH, H, and Brarea showed good results (Model 6; R2 = 0.9123), but SD was identified as a non-significant (p > 0.05) variable.

4. Discussion

The obtained results demonstrate how the effect of stand density (SD) and thinning regimes on stem quality can be predicted with measurements of the main branch parameters mean branch diameters in 0–3-m and 3–6-m log from root collar (Dbr0-3 and Dbr3-6), number of branches in 0–3-m and 3–6-m log (Nbr0-3 and Nbr3-6), diameter of the thickest branch (Dmaxbr0-3 and Dmaxbr3-6), and the percentage branch area from 0–6-m log surface area (Brarea). As reported in the literature, in most cases, several parameters related to stem quality can be directly measured for standing trees, such as DBH, height, height of crown base, etc. [17]. The SD and thinning affect the growth dynamics and tree development, as well the final stand productivity. Obviously, if the branches grow smaller and a smaller amount of them are fixed on the stem, better stem quality is defined. However, it is equally important to ensure that the volume of the trees is optimal. In this paper, we hypothetically state that optimal stem quality should be found for a certain stand density, in this case for the 31–38-year-old Scots pine stand. Previous studies noted that thinning treatments reduce the total yield, but increasing of the growing space positively influenced the growth in diameter and increased tree volume [30,31]. On the other hand, thinning creates conditions for tree branches to grow thicker and longer [32], and excessive thinning can even reduce stem quality by promoting branching. The high density of young Scots pine stands affects the development of tree diameter and branches, that is, it reduces tree growth and branching and improves the stem quality.
We found no effect of different SDs and thinning regimes on the mean tree height (H), but all studied treatments had a significant effect on tree diameter at breast height (DBH). As noted by Liziniewicz et al. [33], wide spacing significantly influenced mean height (i.e., the mean height was lowest in the most open spacing). The same study showed that high SD reduced the tree DBH. Mäkinen and Isomäki [10] stated that more intensive thinning was followed by larger DBH and volume of Scots pine trees compared to moderate thinning. This was explained by intensified growth of bottom parts of stems in the stands with lower density. Otherwise, such trends might disappear in the long-term. In a major study, Pretzsch [34] identified that short-term benefit in growth after thinning can turn into long-term losses in the yield.
The results of the present study showed that a greater height from the root collar to the first living branch was found in the sites with higher density. The measured Scots pine trees were of the same age and, most likely, they competed equally for sunlight at a young age, up to the first thinning treatment at 4–8 years old. At higher stand densities, the low branches on the stem died, typically from shading and competition. Different stand densities did not affect the mean height to the first dead branch, and this parameter is most likely more dependent on tree genetics than on ecological conditions or the management regime applied.
For the most appropriate stand density and thinning program to grow the most productive trees, it is reasonable to evaluate the parameters directly related to stem quality. In order to grow high-quality wood, DBH, H, and branch characteristics, which greatly affect wood quality, are those that can be measured directly for standing trees [17]. Branching parameters are closely related to tree growth—that is, factors that promote DBH growth also increase branch diameter [14]. In Scots pine, the growth of stem and branches strongly correlate [18,20]. As noted by Gort et al. [21], the quality of bottom stem part can be improved by the choosing an optimal initial stand density, as well timing and intensity of thinning. To obtain stem wood without branches, it is necessary to maintain a certain stand density.
In this study, a modeling approach was applied to describe the overall pattern of stem quality (mostly based on branch characteristics) to different SD. All estimated models (see Table 4) included driving variables SD and DBH (H, in some cases) that are commonly available in practical forest management databases and other variables, such as branch diameters (Dbr0-3, Dbr3-6), number of branches (Nbr0-3, Nbr3-6), diameter of the thickest branch (Dmaxbr0-3, Dmaxbr3-6), and the percentage branch area (Brarea). In the forest, it is often economically inefficient to assess the assortments for the whole stem; therefore, the bottom part of stem at fixed length is used for the assessment [17]. For forest management practice, simplified models were estimated, which included the branch characteristics Dbr0-3 and Dmaxbr0-3, which can be measured directly and without much effort. The best-fitted model was estimated including the variable Dbr0-3 together with SD and DBH in a single equation (Model 4; R2 = 0.9410). Previous studies showed that the best independent variables showing branch increment were radial increment of stem, the ratio between height and diameter, and branch age [18]. The trees growing under low SD usually develop branches with higher diameter [33,35]. More precisely, the branching can be predicted by including information about the growth rate of tree diameter and height, as well as stand density at an early stage of stand development [22]. Huuskonen et al. [22] indicated that the probability of branchiness was relatively low in the stands that were pre-commercially thinned with low intensity, when only the defected trees were removed. Some studies show that stand density and site fertility do not affect branching if stem dimensions are taken into account [18,21].
Summarizing our findings, we found that stem quality in even-aged pure pine stands could be described by few stand and tree variables. Models for branch diameter could be used as a forest management tool for the improvement of stem wood quality. The identified variables affecting stem quality were the branch diameter in the bottom part of stem, at least up to 3 m stem height. We could not provide a complete answer that a certain stand density would have a positive effect on the best stem quality. As the stand density alone incorporates the number of trees, their size, and other characteristics [36], complex forest management including both stand density and thinning requires a more accurate site- and species-specific analysis. The results of this study do not explain the ability to forecast the stem quality overall; they are more specifically related to Scots pine of similar age, growing in the hemiboreal forest zone. The main variables also depend on site fertility, climate conditions, and tree age [5]. More detailed studies on this research area, based on other site conditions, stand age, and genetic tree properties are needed. More broadly, further research is also needed to determine the effects of stand densities on other stem quality attributes, such as visible defects and forms of stem decay, which can be assessed on a non-numerical scale.

5. Conclusions

The aim of the current study was to examine how different stand densities (600, 1000–1200, 2000–2400, 3000–4400, and 5400–8100 trees ha−1) and thinning regimes influenced stem quality parameters, mainly the branch characteristics along 0-6-m stem, of 31–38-year-old Scots pine (Pinus sylvestris L.) trees. This study provides some input to the discussion about Scots pine stem quality responses to different forest management practices in relatively young stands.
The results from this study indicate statistically significant influences of stand density on tree diameter at breast height (DBH), showing a clear downward trend of DBH in the sites with the lowest (600 trees ha−1) to the highest (5400–8100 trees ha−1) stand densities. Similarly, the mean branch diameters per stem log up to 6 m height decreased significantly with increasing stand density.
The linear regression models to predict branch diameter, as the main parameter for the stem quality assessment, were developed based on stand density and stem parameters. Even though the number of branches up to 6 m height significantly decreased with increasing SD, this variable was found to be weakly related to stem quality. The variables obtained from upper log (3–6-m height from the root collar) showed a high correlation with the variables from the bottom stem log or were non-significant in the model to predict branch diameter, when both stand density and DBH were included. The diameters of branches in each whorl and/or the diameter of the thickest branch up to 3-m stem height, which are relatively easily measurable in the bottom part of the stem, were preferred and included in the simplified models. The best-fitted model was obtained when stand density, DBH, and branch diameter in the bottom 0–3-m log were included in the model.

Author Contributions

Conceptualization, L.B., B.Š., and I.V.-K.; Formal analysis, L.B. and B.Š.; Investigation, L.B., B.Š., R.B., E.P., and I.V.-K.; Methodology, L.B., B.Š., M.A., and E.P.; Software, L.B. and B.Š.; Supervision, L.B., E.P., and I.V.-K.; Writing—original draft preparation, L.B. and I.V.-K.; writing—review and editing, B.Š., R.B., M.A., and E.P. All authors have read and agreed to the published version of the manuscript.

Funding

This research received no external funding.

Acknowledgments

The paper presents the findings obtained through the long-term research programme “Sustainable Forestry and Global Changes” implemented by the Lithuanian Research Centre for Agriculture and Forestry.

Conflicts of Interest

The authors declare no conflicts of interest.

References

  1. Gustafsson, L.; Kouki, J.; Sverdrup-Thygeson, A. Tree retention as a conservation measure in clear-cut forests of northern Europe: A review of ecological consequences. Scand. J. For. Res. 2010, 25, 295–308. [Google Scholar] [CrossRef]
  2. Gustafsson, L.; Baker, S.C.; Bauhus, J.; Beese, W.J.; Brodie, A.; Kouki, J.; Lindenmayer, D.B.; Lõhmus, A.; Pastur, G.M.; Messier, C.; et al. Retention forestry to maintain multifunctional forests: A world perspective. BioScience 2012, 62, 633–645. [Google Scholar] [CrossRef] [Green Version]
  3. Puettmann, K.J.; Wilson, S.M.; Baker, S.C.; Donoso, P.J.; Drössler, L.; Amente, G.; Harvey, B.D.; Knoke, T.; Lu, Y.; Nocentini, S.; et al. Silvicultural alternatives to conventional even-aged forest management—What limits global adoption? For. Ecosyst. 2015, 2, 8. [Google Scholar] [CrossRef] [Green Version]
  4. Ezquerro, M.; Pardos, M.; Diaz-Balteiro, L. Integrating variable retention systems into strategic forest management to deal with conservation biodiversity objectives. For. Ecol. Manag. 2019, 433, 585–593. [Google Scholar] [CrossRef]
  5. del Río, M.; Bravo-Oviedo, A.; Pretzsch, H.; Löf, M.; Ruíz-Peinado, R. A review of thinning effects on Scots pine stands: From growth and yield to new challenges under global change. Forest Syst. 2017, 26, 19. [Google Scholar] [CrossRef]
  6. Teder, M.; Mizaraitė, D.; Mizaras, S.; Nonić, D.; Nedeljković, J.; Sarvašová, Z.; Vilkriste, L.; Zalite, Z.; Weiss, G. Structural changes of state forest management organisations in Estonia, Latvia, Lithuania, Serbia and Slovakia since 1990. Balt. For. 2015, 21, 326–339. [Google Scholar]
  7. Lundmark, H.; Josefsson, T.; Östlund, L. The introduction of modern forest management and clear-cutting in Sweden: Ridö State Forest 1832–2014. Eur. J. Forest. Res. 2017, 136, 269–285. [Google Scholar] [CrossRef] [Green Version]
  8. Niemistö, P.; Kilpeläinen, H.; Poutiainen, E. Effect of first thinning type and age on growth, stem quality and financial performance of a Scots pine stand in Finland. Silva. Fenn. 2018, 52. [Google Scholar] [CrossRef] [Green Version]
  9. Zeide, B. Thinning and growth: A full turnaround. J. For. 2001, 99, 20–25. [Google Scholar] [CrossRef]
  10. Mäkinen, H. and Isomäki, A. Thinning intensity and long-term changes in increment and stem form of Scots pine trees. For. Ecol. Manag. 2004, 201, 21–34. [Google Scholar] [CrossRef]
  11. Eriksson, E. Thinning operations and their impact on biomass production in stands of Norway spruce and Scots pine. Biomass Bioenergy 2006, 30, 848–854. [Google Scholar] [CrossRef]
  12. Nickel, M.; Klemmt, H.J.; Uhl, E.; Pretzsch, H. Der Kiefern Standraum und urchforstungsversuch Weiden 611. AFZ Der Wald 2007, 24, 1316–1319. [Google Scholar]
  13. del Río, M.; Calama, R.; Cañellas, I.; Roig, S.; Montero, G. Thinning intensity and growth response in SW-EuropeanScots pine stands. Ann. For. Sci. 2008, 65, 308. [Google Scholar] [CrossRef] [Green Version]
  14. Ikonen, V.P.; Kellomäki, S.; Peltola, H. Sawn timber properties of Scots pine as affected by initial stand density, thinning and pruning: A simulation based approach. Silva. Fenn. 2009, 43, 411–431. [Google Scholar] [CrossRef] [Green Version]
  15. Nilsson, U.; Agestam, E.; Ekö, P.-M.; Elfving, B.; Fahlvik, N.; Johansson, U.; Karlsson, K.; Lundmark, T.; Wallentin, C. Thinning of Scots pine and Norway spruce monocultures in Sweden—Effects of different thinning programmes on stand level gross- and net stem volume production. Studia For. Suec. 2010, 219, 46. [Google Scholar]
  16. Rehfeldt, G.E.; Tchebakova, N.M.; Parfenova, Y.I.; Wykoff, W.R.; Kuzmina, N.A.; Milyutin, L.I. Intraspecific responses to climate in Pinus Sylvestris. Glob. Chang. Biol. 2002, 8. [Google Scholar] [CrossRef] [Green Version]
  17. Bosela, M.; Redmond, J.; Kučera, M.; Marin, G.; Adolt, R.; Gschwantner, T.; Petráš, R.; Korhonen, K.; Kuliešis, A.; Kulbokas, G.; et al. Stem quality assessment in European National Forest Inventories: An opportunity for harmonised reporting? Ann. For. Sci. 2016, 73, 635–648. [Google Scholar] [CrossRef] [Green Version]
  18. Mäkinen, H.; Colin, F. Predicting branch angle and branch diameter of Scots pine from usual tree measurements and stand structural information. Can. J. For. Res. 1998, 28, 1686–1696. [Google Scholar] [CrossRef]
  19. Salminen, H.; Varmola, M. Influence of initial spacing and planting design on the development of young Scots pine (Pinus sylvestris L.) stands. Silva. Fenn. 1993, 27. [Google Scholar] [CrossRef]
  20. Makinen, H. Effect of stand density on radial growth of branches of Scots pine in southern and central Finland. Can. J. For. Res. 1999, 29, 1216–1224. [Google Scholar] [CrossRef]
  21. Gort, J.; Zubizarreta-Gerendiain, A.; Peltola, H.; Kilpeläinen, A.; Pulkkinen, P.; Jaatinen, R.; Kellomäki, S. Differences in branch characteristics of Scots pine (Pinus sylvestris L.) genetic entries grown at different spacing. Ann. For. Sci. 2010, 67, 705. [Google Scholar] [CrossRef] [Green Version]
  22. Huuskonen, S.; Hakala, S.; Mäkinen, H.; Hynynen, J.; Varmola, M. Factors influencing the branchiness of young Scots pine trees. Forestry 2014, 87, 257–265. [Google Scholar] [CrossRef] [Green Version]
  23. Kuliešis, A.; Saladis, J. The effect of early thinning on the growth of pine and spruce stands. Balt. For. 1998, 1, 8–16. [Google Scholar]
  24. Šilinskas, B.; Varnagiryte-Kabašinskienė, I.; Aleinikovas, M.; Beniušienė, L.; Aleinikovienė, J.; Škema, M. Scots pine and Norway spruce wood properties at sites with different stand densities. Forests 2020, 11, 587. [Google Scholar] [CrossRef]
  25. Lithuanian Hydrometeorological Service under the Ministry of Environment. Climate Atlas of Lithuania; Petro Ofsetas: Vilnius, Lithuania, 2013. [Google Scholar]
  26. Ministry of Environment, State Forest Service. Lithuanian Statistical Yearbook of Forestry; Butkus, A., Dumciene, V., Eigirdas, M., Kuliešis, A., Vižlenskas, D., Eds.; Lutute: Kaunas, Lithuania, 2018; p. 184. [Google Scholar]
  27. Vaičys, M.; Karazija, S.; Kuliešis, A.; Rutkauskas, A. Miškų Augavietės [Forest Sites]; Lutute: Kaunas, Lithuania, 2006; p. 95. (In Lithuanian) [Google Scholar]
  28. World Reference Base for Soil Resources. International Soil Classification System for Naming Soils and Creating Legends for Soil Maps; World Soil Resources Reports No. 106; FAO: Rome, Italy, 2014; ISBN 978-92-5-108370-3. [Google Scholar]
  29. LST EN 1927-2:2008/AC:2010. Apvaliosios Spygliuočių Medienos Klasifikavimas Pagal Kokybę. 2 Dalis. Pušys [Classification of Coniferous Roundwood According to its Quality. 2 Part. Scots Pine]; Lithuanian Standards Board: Vilnius, Lithuania, 2008. [Google Scholar]
  30. Assmann, E. The Principles of Forest Yield Study: Studies in the Organic Production, Structure, Increment and Yield of Forest Stands; Pergamon Press: Oxford, UK, 1970; p. 505. ISBN 9781483150932. [Google Scholar]
  31. Savill, P.S. and Sandels, A.J. The influence of early respacing on the wood density of Sitka spruce. Forestry 1983, 56, 109–120. [Google Scholar] [CrossRef]
  32. Fahlvik, N.; Ekö, P.M.; Pettersson, N. Influence of precommercial thinning grade on branch diameter and crown ratio in Pinus sylvestris in southern Sweden. Scan. J. For. Res. 2005, 20, 243–251. [Google Scholar] [CrossRef]
  33. Liziniewicz, M.; Ekö, P.E.; Agestam, E. Effect of spacing on 23-year-old lodgepole pine (Pinus contorta Dougl. var. latifolia) in southern Sweden. Scan. J. For. Res. 2012, 27, 361–371. [Google Scholar] [CrossRef]
  34. Pretzsch, H. Density and growth of forest stands revisited. Effect of the temporal scale of observation, site quality, and thinning. For. Ecol. Manag. 2020, 460, 15. [Google Scholar] [CrossRef]
  35. Baldwin, V.C.; Peterson, K.D.; Clark, A.; Ferguson, R.B.; Strub, M.R.; Bower, D.R. The effects of spacing and thinning on stand and tree characteristics of 38-year-old Loblolly Pine. For. Ecol. Manag. 2000, 137, 91–102. [Google Scholar] [CrossRef]
  36. Dean, T.J.; Baldwin, V.C., Jr. Crown Management and Stand. Density; Carter, Mason, C., Ed.; Growing Trees in a Greener World: Industrial Forestry in the 21st Century; 35th LSU Forestry Symposium; Louisiana State University Agricultural Center, Louisiana Agricultural Experiment Station: Baton Rouge, LA, USA, 1996; pp. 148–159. [Google Scholar]
Figure 1. Mean values of branch diameter in 0–6-m log, Dbr0-6 (a); in 0–3-m log, Dbr0-3 (b); and in 3–6-m log, Dbr3-6 (c) in two Scots pine study sites (study plots A1–A5 and F1–F5). Bars show standard error of the mean. Different capital letters A, B, C, D and E given at the top of the column show statistically significant differences between the sites at p < 0.05.
Forests 11 00716 g001
Figure 2. Mean number of branches in 0–6-m log, Nbr0-6 in two Scots pine study sites (study plots A1–A5 and F1–F5). Bars show standard error of the mean. Different capital letters A, B, C and D given at the top of the column show statistically significant differences between the sites at p < 0.05.
Forests 11 00716 g002
Figure 3. Mean height of the lowest live branch (Hlb) (a) and height of the lowest dead branch (Hdb) (b) in two Scots pine study sites (study plots A1–A5 and F1–F5). Bars show standard error of the mean. Different capital letters A, B and C given at the top of the column show statistically significant differences between the sites at p < 0.05; no letters indicate no significant differences.
Forests 11 00716 g003aForests 11 00716 g003b
Table 1. Characteristics of Scots pine study plots chosen within the long-term experimental area established in 1990–1992.
Study PlotStand Density a, trees ha−1Thinning IntensityStand Age at Thinning, YearsStand Density at Assessment b, trees ha−1Area of Study Plot, m2Number of Assessed Trees
(A1–A5)38 years old Scots pine; planted on former agricultural land; forest site type c - Ncl
A16001 time8 564359362
A210002 times8, 34 825361060
A320003 times8, 15, 34 878360061
A430004 times 8, 15, 21, 34 886367961
A55400no thinning2128359163
(F1–F5)31 years old Scots pine; planted on forest land; forest site type c - Nbl
F16001 time4610299561
F212002 times4, 27 867213162
F324003 times4, 8, 27 1014209560
F444004 times 4, 8, 14, 27 1290190659
F58100no thinning-2700216561
a Stand density in each study plot left after the first thinning: for the study plots A1–A5 the assessment was performed in 1990; for the study plots F1–F5 it was performed in 1992. b Stand density in each study plot at the assessment time (2018–2019). c Ncl: normal moisture regime fertile with light soil texture sandy soil; Nbl: normal moisture regime poor with light soil texture sandy soil according to the Lithuanian classification of forest site types [27].
Table 2. Tree height (H), tree diameter at breast height (DBH), and percentage branch area from 0–6-m log surface area (Brarea) of Scots pine trees at sites with different stand densities.
Study PlotStand Density, trees ha−1VariableMeanStd DevStd ErrorMinimumMaximum
(A1–A5)
H, m19.671.210.1516.7022.10
A1600DBH, cm25.003.840.4916.4532.15
Brarea, %0.740.200.030.040.32
H, m19.780.790.1017.3022.30
A21000DBH, cm22.802.940.3812.6229.45
Brarea, %0.560.140.020.020.27
H, m19.831.100.1417.1021.80
A32000DBH, cm21.443.010.3915.6528.10
Brarea, %0.460.150.020.020.19
H, m20.020.710.0918.6021.70
A43000DBH, cm21.252.290.2915.0027.45
Brarea, %0.360.100.010.010.14
H, m19.391.250.1615.7022.00
A55400DBH, cm17.783.400.4311.3029.40
Brarea, %0.390.140.020.020.13
(F1–F5)
H, m13.971.020.1310.1015.60
F1600DBH, cm20.883.300.4213.0029.20
Brarea, %0.840.240.030.060.26
H, m14.541.750.224.7016.60
F21200DBH, cm18.373.540.459.6528.20
Brarea, %0.610.150.020.020.18
H, m14.341.090.1412.5016.60
F32400DBH, cm16.823.120.4010.8526.30
Brarea, %0.560.170.020.030.25
H, m14.700.980.1311.4016.40
F44400DBH, cm16.242.410.3110.8022.90
Brarea, %0.420.130.020.020.17
H, m14.771.220.1611.1016.90
F58100DBH, cm13.683.170.418.0020.90
Brarea, %0.390.150.020.020.18
Table 3. Correlation coefficients between tree characteristics and some parameters of stem quality for the selected Scots pine trees in the study plots A1–A5 (n = 307) and F1–F5 (n = 303). The coefficients given in bold are statistically significant at p < 0.05.
Study Plots A1–A5
H *HlbHdbDBHNbr0-6Dbr0-6Dbr0-3Dbr3-6Dmaxbr0-3Dmaxbr3-6Brarea
SD−0.100.490.09−0.58−0.32−0.64−0.62−0.59−0.51−0.52−0.54
H 0.140.140.53−0.300.160.030.25−0.030.20−0.23
Hlb 0.13−0.42−0.27−0.54−0.56−0.46−0.47−0.46−0.52
Hdb −0.01−0.28−0.12−0.16−0.11−0.12−0.15−0.23
DBH 0.140.760.650.780.510.680.40
Nbr0-6 0.290.330.270.330.260.64
Dbr0-6 0.940.950.750.800.82
Dbr0-3 0.790.840.700.84
Dbr3-6 0.600.820.72
Dmaxbr0-3 0.580.75
Dmaxbr3-6 0.65
Study Plots F1–F5
HHlbHdbDBHNbr0-6Dbr0-6Dbr0-3Dbr3-6Dmaxbr0-3Dmaxbr3-6Brarea
SD0.180.560.06−0.57−0.49−0.62−0.59−0.61−0.51−0.51−0.57
H 0.350.130.32−0.260.080.000.14−0.010.08−0.17
Hlb 0.13−0.45−0.50−0.58−0.57−0.56−0.52−0.54−0.62
Hdb 0.00−0.17−0.08−0.10−0.07−0.10−0.08−0.14
DBH 0.450.850.760.870.650.770.64
Nbr0-6 0.500.490.490.410.480.68
Dbr0-6 0.960.970.810.860.89
Dbr0-3 0.870.860.800.91
Dbr3-6 0.730.860.83
Dmaxbr0-3 0.710.79
Dmaxbr3-6 0.79
* SD, stand density; H, tree height; Hlb, height of the lowest live branch; Hdb, height of the lowest dead branch; DBH, diameter at breast height; Nbr0-6, number of branches in 0–6-m log from root collar; Dbr0-6, branch diameter in 0–6-m log; Dbr0-3, branch diameter in 0–3-m log; Dbr3-6, branch diameter in 3–6-m log; Dmaxbr0-3, diameter of the thickest branch in 0–3-m log; Dmaxbr3-6, diameter of the thickest branch in 3–6-m log; Brarea, percentage branch area from 0–6-m log surface area.
Table 4. The results of the selected linear models determined by the stepwise procedure to describe branch diameter (Dbr) in relation to stand density (SD) and tree characteristics (H, tree height; DBH, diameter at breast height; Dbr0-3, branch diameter in 0–3-m log from root collar; Dbr3-6, branch diameter in 3–6-m log; Nbr0-3, number of branches in 0–3-m log; Nbr3-6, number of branches in 3–6-m log; Dmaxbr0-3, diameter of the thickest branch in 0–3-m log; Dmaxbr3-6, diameter of the thickest branch in 3–6-m log; Brarea, percentage branch area from 0–6-m log surface area) in Scots pine (n = 610).
VariableParameter EstimatePr > |t|Variance InflationParameter EstimatePr > |t|Variance InflationParameter EstimatePr > |t|Variance Inflation
Model 1Model 2Model 3
Intercept0.05252<0.000100.116430.000300.21413<0.00010
SD−0.0000010.01001.8399−0.0000070.00161.6857−0.0000060.01901.7365
H0.0001720.65362.4888---−0.00992<0.00011.9884
DBH0.00194<0.00018.28400.02369<0.00012.03200.02989<0.00013.9270
Dbr0-30.49140<0.000110.96620.85780<0.00014.85570.82854<0.00015.2151
Dbr3-60.45995<0.000110.0093------
Nbr0-3−0.00449<0.00012.1371------
Nbr3-60.00345<0.00011.9437------
Dmaxbr0-30.003150.00724.2132−0.02676<0.00013.6417−0.02675<0.00013.6417
Dmaxbr3-6−0.000100.93883.8422------
Brarea0.06293<0.000114.7017-----
R20.99840.94260.9447
Model 4Model 5Model 6
Intercept0.14709<0.000100.74082<0.000100.36612<0.00010
SD−0.0000070.00251.6847−0.00003<0.00011.6150−0.0000050.08631.7542
H------0.006600.01882.3982
DBH0.02400<0.00012.02550.04317<0.00011.73800.04926<0.00013.1774
Dbr0-30.78906<0.00012.1022------
Dmaxbr0-3---0.16258<0.00011.5766---
Brarea------1.17880<0.00011.9387
R20.94100.80290.9123

