Direct Mass Spectrometry with Online Headspace Sample Pretreatment for Continuous Water Quality Monitoring


1
Water Quality & Safety Center, K-Water, Daejeon 34350, Korea
2
AT Frontier Co. Ltd., Anyang, Gyeonggido 14042, Korea
3
Department of Environmental Health Sciences, School of Public Health, Seoul National University, Seoul 08826, Korea
4
Environment Test Division, Eurofins Korea Co. Ltd., Gunpo, Gyeonggido 15849, Korea
*
Author to whom correspondence should be addressed.
Water 2020, 12(7), 1843; https://doi.org/10.3390/w12071843
Submission received: 14 May 2020
/
Revised: 16 June 2020
/
Accepted: 20 June 2020
/
Published: 27 June 2020
(This article belongs to the Special Issue Water Quality Control: Monitoring, Analysis and Treatment of Emerging Micropollutants)
Abstract
:This study investigates the use of selected ion flow tube mass spectrometry with an automated headspace pretreatment system for the continuous surveillance of water quality at wastewater treatment plants (WWTPs) and rivers. The reaction rates of the target compounds introduced using the headspace method were similar to those of the mass scan library, with a margin of error of <10%. Novel quantitative formulae were derived for the water samples of the target compounds, and the linearity of the calibration curves for both the purified and effluent matrix (0.1–2.0 mg/L) showed a coefficient of determination of 0.98–0.99 for most compounds. The detection limit for 74% of the target substances was 0.02–0.10 mg/L, and the average recoveries were 111.6% and 104.7% for the low- and high-concentration spiked samples, respectively, which are comparable to those of the headspace gas chromatography-mass spectrometry system. However, the variability in individual concentrations was still large, due to the unstable control of sample injection flow and pressure. Herein, 79% of the 28 compounds met one-tenth of the proposed method detection limit criteria for emergency operations in WWTP. Field experiments showed that the system was easy to maintain and could be used to monitor chemical accidents.
1. Introduction
Industrial activities are responsible for numerous environmental problems, particularly as the use of chemicals increases. Sewage treatment plants in the industrial complex are at risk of chemical inflows, due to leaks, fires, explosions, and temporary unauthorized intentional discharge. The Ministry of Environment of the Republic of Korea has established standards for discharge of 32 chemicals from industrial chemical wastewater facilities, because they could have a serious impact on the ecosystem if they are discharged by accident or continuously into the water environment [1]. Since surveys are conducted quarterly, it is virtually impossible to identify the actual discharges and impacts of these chemicals.
In Korea, water contamination accidents gradually decreased from 2009 to 2014; however, there are still more than 50 water pollution accidents every year [2]. Approximately 8% of these accidents are caused by hazardous chemicals, and although the frequency is lower than that of oil spills, the damage to the aquatic ecosystem can be much more serious [3]. In case the water environment is at risk of contamination due to accidental or intentional leaks in industrial areas, rapid monitoring of target or unknown chemicals should be carried out at wastewater treatment plants (WWTPs) or in streams where inflow is expected. In some cases, measures should also be taken to sequester the inflow into emergency storage facilities. Large WWTPs in South Korea are required by law to install and operate wastewater telemonitoring systems (TMS). However, only chemical oxygen demand (COD), suspended solids (SS), total nitrogen (TN), and total phosphorus (TP) are recorded under discharge water standards and online measurement items [4]. Consequently, it is virtually impossible to estimate chemical leaks and inflows using TMS data.
Numerous chemicals are used in industrial areas with a wide variety of physical and chemical properties, including highly soluble substances, such as phenol and formaldehyde, and non-polar substances, such as naphthalene and volatile organic compounds (VOCs). To monitor these chemicals, liquid and gas chromatography–mass spectrometry (LC–MS and GC–MS, respectively) should be used for quantitative analysis [5,6,7,8]. However, these analysis techniques require skilled technical experience and 30 min to one hour per sample for the instrumental analysis. For example, effluent pretreatment (e.g., using derivatives and liquid–liquid extraction) is essential for the GC–MS headspace method considering substance volatility, and to prevent thermal decomposition. Consequently, these processes do not provide timely data when rapid decision-making is required following a chemical leak.
Direct mass spectrometry is used to detect air quality in the field, and benefits from rapid ionization and the direct detection of gaseous samples without coupling to chromatography [9,10,11,12,13]. Recently developed selected ion flow tube mass spectrometry (SIFT-MS) and proton transfer reaction mass spectrometry (PRT-MS) allow for the continuous measurement of volatile compounds in gas without sampling and pretreatment, and are currently being used for air quality monitoring [12,14,15,16]. SIFT-MS controls the selective ionization mechanism by applying quadrupole type control technology to the analyzer before introducing the sample, creating the response ions needed for analysis (H3O+, NO+, and O2+) from the microwave discharge plasma source mounted inside. Through the control of the quadrupole, the selected reaction ions produce their own mass to charge (m/z) through the samples and chemical reactions introduced into the gas phase, and are compared with library data to detect and quantify the target compounds [14,17].
Although SIFT-MS has expanded its scope of use to include vehicle interior air quality, flavor profiles of foods and plants, and medical applications [12,18,19,20], its use for the quantitative analysis of water samples is extremely rare. Notwithstanding, we propose that the technique is suitable for the rapid monitoring of chemicals in WWTP effluent, using an appropriate sample introduction device.
In this study, we evaluate the performance of SIFT-MS combined with a headspace module interface for fast determination of the composition of different chemical species in water samples for early detection of chemical spill. To the best of our knowledge, in this study, calibration linearities were calculated for the first time using the headspace method and method detection limits (MDLs) as quantitative equations for liquid samples. Headspace–SIFT-MS recovery was then compared to headspace–GC-MS recovery using matrix spiked samples. Finally, an online headspace–SIFT-MS method was developed for continuous on-site measurement, and applied to real effluent and surface water samples to assess the suitability of the rapid detection methodology for managing chemical accidents.
2. Materials and Methods
2.1. Reference Materials and Reagents
We reviewed more than 30 compounds listed in the “Key Info Guide for Accident Preparedness Substance” [21]; certain contaminants designated by the Ministry of Environment of Korea; and hazardous air pollutants designated by the United States Environmental Protection Agency [22], excluding toxic gases, substances that react with water, strong acids, salt, and heavy metals. Selected standards as stock solutions in triacetin were purchased from o2si Smart Solutions (Charleston, SC, United States). Triacetin (99% purity), with a boiling point of 259 °C and very high water solubility, purchased from Sigma-Aldrich (St. Louis, MO, United States), was used as a solvent for diluting the target materials. It was confirmed that the m/z of triacetin did not interfere with those of the target substances in the SIFT-MS.
Each reference material was diluted in triacetin to prepare a primary stock solution between 100 and 500 μg/mL, and then sequentially diluted in deionized water to 1 μg/mL. This solution was used for quality assurance (QA) and quality control (QC), especially for method detection limit (MDL), method quantification limit (MQL), recovery, and relative standard deviation (RSD).
2.2. Instruments
2.2.1. Headspace System
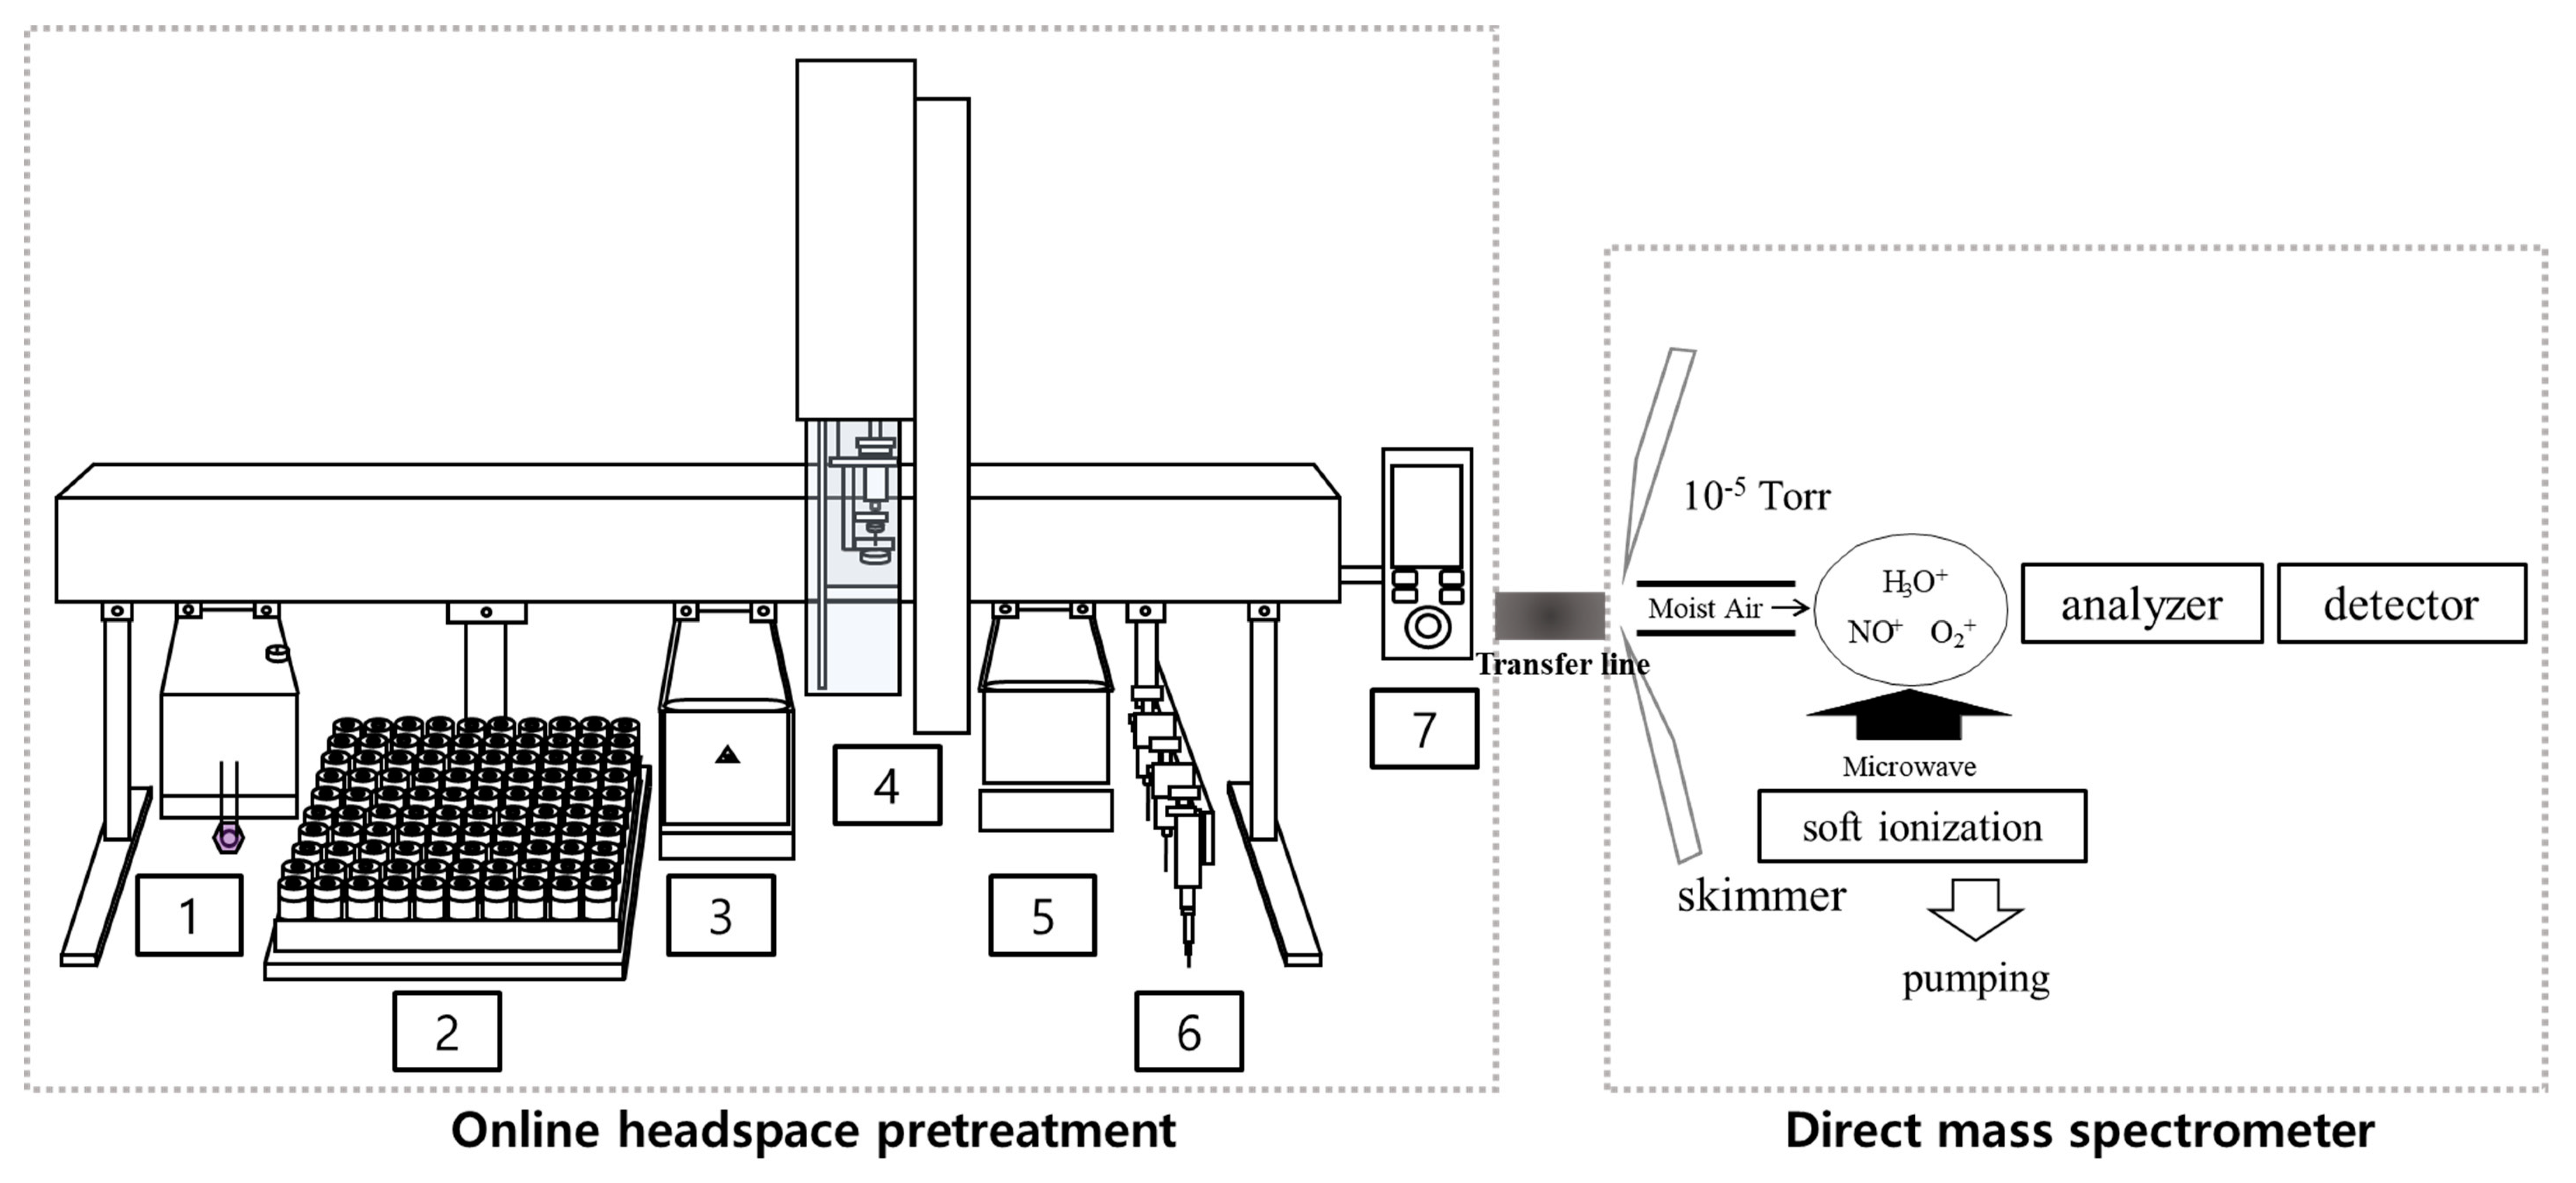
The headspace pretreatment system is considered to be the most effective means to extract target chemicals contained in a liquid [23,24,25,26] by converting it to a gas phase for transfer to the SIFT-MS [27]. The method requires the use of multi-function autosamplers, because sampling and pretreatment should be performed automatically, on-site, and in real time. The autosampler was applied to the robotic tool change (RTC) model (PAL system, Zwingen, Switzerland), and a mini-water tank for sampling was manufactured and installed that consisted of a pipette syringe and a gas tight syringe in the syringe tool changer. After sampling the effluent using the pipette module, the vial screw cap with a mounted capper/decapper module was opened, and the sample was sealed and extracted. Next, the gas-tight syringe was configured to punch through the septa and extract the gas phase sample (Figure 1). The pipette syringe used for sampling was then automatically replaced and the tip discarded. The vial rack was equipped with calibration solutions, method blanks, quality control samples, and multiple empty vials for sample analysis. Sampling intervals could be adjusted using sequence programs, and headspace extraction was performed at least every 30 min. To prevent loss due to condensation of the vaporized substances, the temperature of the transfer line connected to SIFT-MS and the injection needle was maintained at 90 °C.
2.2.2. Direct Mass Spectrometry
The VOICE-200 (Syft Technologies, Christchurch, New Zealand) SIFT-MS model was used. During the headspace extraction of the water sample, the SIFT-MS was in standby mode, and a trigger (Syft Technologies, Christchurch, New Zealand) was installed to send a start signal for data acquisition. The detailed operating conditions of the headspace precession and SIFT-MS are summarized in Table 1. The m/z of each substance was confirmed by comparing them with mass scan results from single compounds. The optimized method was then integrated to avoid interference with multi ions and to ensure correct quantification. Finally, reference materials and samples were measured in the selected ion monitoring (SIM) scan mode (Supplementary Materials).
2.3. Quantitation of the Water Sample Using Headspace Pretreatment
Unlike GC-MS, quantified using reference materials, it is necessary to quantify gas samples in SIFT-MS to use the absolute quantification method without reference materials. This is possible because the quantitative formula is established using the generated reagent ions and the amount of the target material response ion, the intrinsic response rate constant of the target material, and the instrumental calibration factor [27,28,29]. However, because the quantification of the compounds extracted from the water sample using headspace cannot be directly applied, the quantitative formula should be re-calculated using regression analysis between the response of each compound obtained by SIFT-MS and the spiked concentration in water. Using the target standard material, regression analysis was performed to calculate the calibration curves through seven repeated analyses (100–2000 μg/L), using the headspace method. The linearity of the calibration curve was evaluated as a correlation coefficient (R2). With the support of the data processing team, the quantification equation was stored in the data transmission system, so that the data analyzed in the field could be immediately re-calculated in parts per billion (μg/L).
2.4. Quality Control and Assurance
For verification of the headspace–direct mass spectrometry method used in this study, the reference material (see Section 2.1) with additional dilution in purified water was introduced into SIFT-MS, in order to compare the gas reference standard from the mass scan library with the generated major product ions. The SIM scan method was used to ensure qualitative and quantitative results, and the m/z values were selected from the mass scan results (Supplementary Materials). Considering the sensitivity of each chemical under headspace extraction conditions, the solution was diluted with purified water to produce a five-point calibration solution in the range of 0.1, 0.2, 0.5, 1.0, and 2.0 mg/L. The linearity of the calibration was verified by using these sequentially diluted samples, and the MDL and method quantification limit (MQL) were calculated by measuring seven samples prepared at 0.2 mg/L, and multiplying the standard deviation by 3.14 (t-value at a confidence level of 99%) and 10, respectively. Accuracy and relative standard deviation (RSD) were determined using seven repeated measurements at 0.2 mg/L. Accuracy was calculated by multiplying the ratio of the mean value and the original concentration by 100, and RSD was calculated by dividing the mean value by the standard deviation of the repeated concentration and multiplying by 100. The matrix effect assessment was performed five times each at low (0.2 mg/L) and high (1 mg/L) concentrations, using the effluent matrix with the headspace-SIFT-MS. In addition, five spiked samples in effluent were analyzed at 0.2 and 1 mg/L, to verify the validity of the newly developed analytical methods, and the results from the headspace–SIFT-MS were compared to those of the headspace–GC-MS. To compare the two different analytical methods, the response of 21 compounds that could be analyzed in headspace-GC-MS was verified by comparing them with t-tests, using Microsoft Excel 2016 for Windows.
2.5. Test Sites
A WWTP in the Kyungsan area of Korea was selected to test the online headspace pretreatment, combined with SIFT-MS in an operational facility. The WWTP processes a mixture of domestic discharge and industrial wastewater. In June 2019, a container-type temporary laboratory was built at the facility and connected to an effluent pipeline. A 20 L primary storage tank was installed for sampling. Basic facilities, such as an air conditioner and uninterruptible power supply, were installed to reproduce a typical laboratory environment. Effluent from the primary storage tank was transferred using a laboratory tubing pump to a secondary flow tank attached to the PAL autosampler. All samples were then pumped into the influent treatment process for further water treatment.
Field applications were evaluated in the Nakdong River at Sunwon Bridge in October 2019, with the help of a mobile laboratory operations team. River samples were monitored for 24 h using connecting lines from the bridge, and trailers were equipped with vibration-free devices, large capacity batteries and generators, and data transmission systems to enable the operation of analysis equipment. River water sample analysis was conducted in the same manner as the WWTP sample analysis.
3. Results and Discussion
3.1. Analytical Conditions of Target Compounds in Headspace–SIFT-MS
The 31 substances evaluated herein have extremely diverse vapor pressures and solubilities (Supplementary Materials). Hence, it is very difficult to transfer the target substance into the optimum gas phase under a single headspace condition, because the degree of vaporization of these substances in liquid varies. Consequently, the most typical extraction parameters to analyze VOCs in headspace–GC were applied and are shown in Table 1, along with the SIFT-MS operation parameters.
Substances vaporized after headspace pretreatment were transferred and injected into the SIFT-MS for immediate detection. The [MH]+ ion was the major product of most target substance reactions with H3O+; consequently, some compounds were reacted with NO+ or O2+ to differentiate between compounds. Results were compared with the mass scan library database to confirm the deviation. The reaction ratio is the ratio of the quadrupole-controlled reagent ion and the vaporized target, and most of the substances showed similar results to the mass scan library, with an error rate of less than 10%. Therefore, we conclude that the headspace pretreatment method can be applied to the target chemicals (Supplementary Materials).
3.2. Estimation of the Quantitative Formula for Water Samples Using Headspace–SIFT-MS
SIFT-MS was developed as a gas sample analyzer, and provides an automatic quantification algorithm for the gas phase; consequently, measured values are recorded in parts per billion by volume (ppbv) by the built-in program. Therefore, if a substance in which reference material is added to water is injected through the headspace, a separate quantitative calculation is required to convert ppbv to a liquid concentration (e.g., mg/L).
The regression equation was recalculated from the responses of spiked concentrations in liquid for each substance, and the linearity was evaluated by the coefficient of determination (R2). The new equation for water–headspace calculated in this experiment was not added to the built-in SIFT-MS quantitative program; however, it was inserted into the algorithm of the external data transmission facility. Therefore, the gas sample concentration was calculated in units of ppbv by the SIFT-MS, and converted to mg/L by the external data logger.
The parameters were optimized for sample introduction under headspace conditions for multi-component analysis for all target substances. After extracting the spiked single substance from the headspace and injecting the gas phase at an injection speed of 10 μL/s, the data point shows a flat shape after the initial signal is stabilized, and the average response of these data points can be used (Supplementary Materials). Next, the injection speed of the gas-tight syringe was adjusted to 35 μL/s to increase the sensitivity in the limited scan time for the simultaneous analysis of multi-ions. This ensured that the data points for each substance were sharpened and calculated using the highest response as per the regression equation.
3.3. Calibration Performance
The calibration range for multiple components was prepared at 0.1, 0.2, 0.5, 1.0, and 2.0 mg/L, and the regression equation was obtained by repeated analysis (seven repetitions) using the multi-ion headspace method (Supplementary Materials). The linearity of the calibration curve, evaluated using R2, is shown in Table 2. The value of R2 for 18 substances was 0.99 or higher, and most targets showed results of 0.98 or higher. However, tetrachloroethene, benzyl chloride, and bromoform had R2 values of 0.95 or less, lower than the general linearity of headspace–GC; hence, quadratic linearity should be applied to these substances.
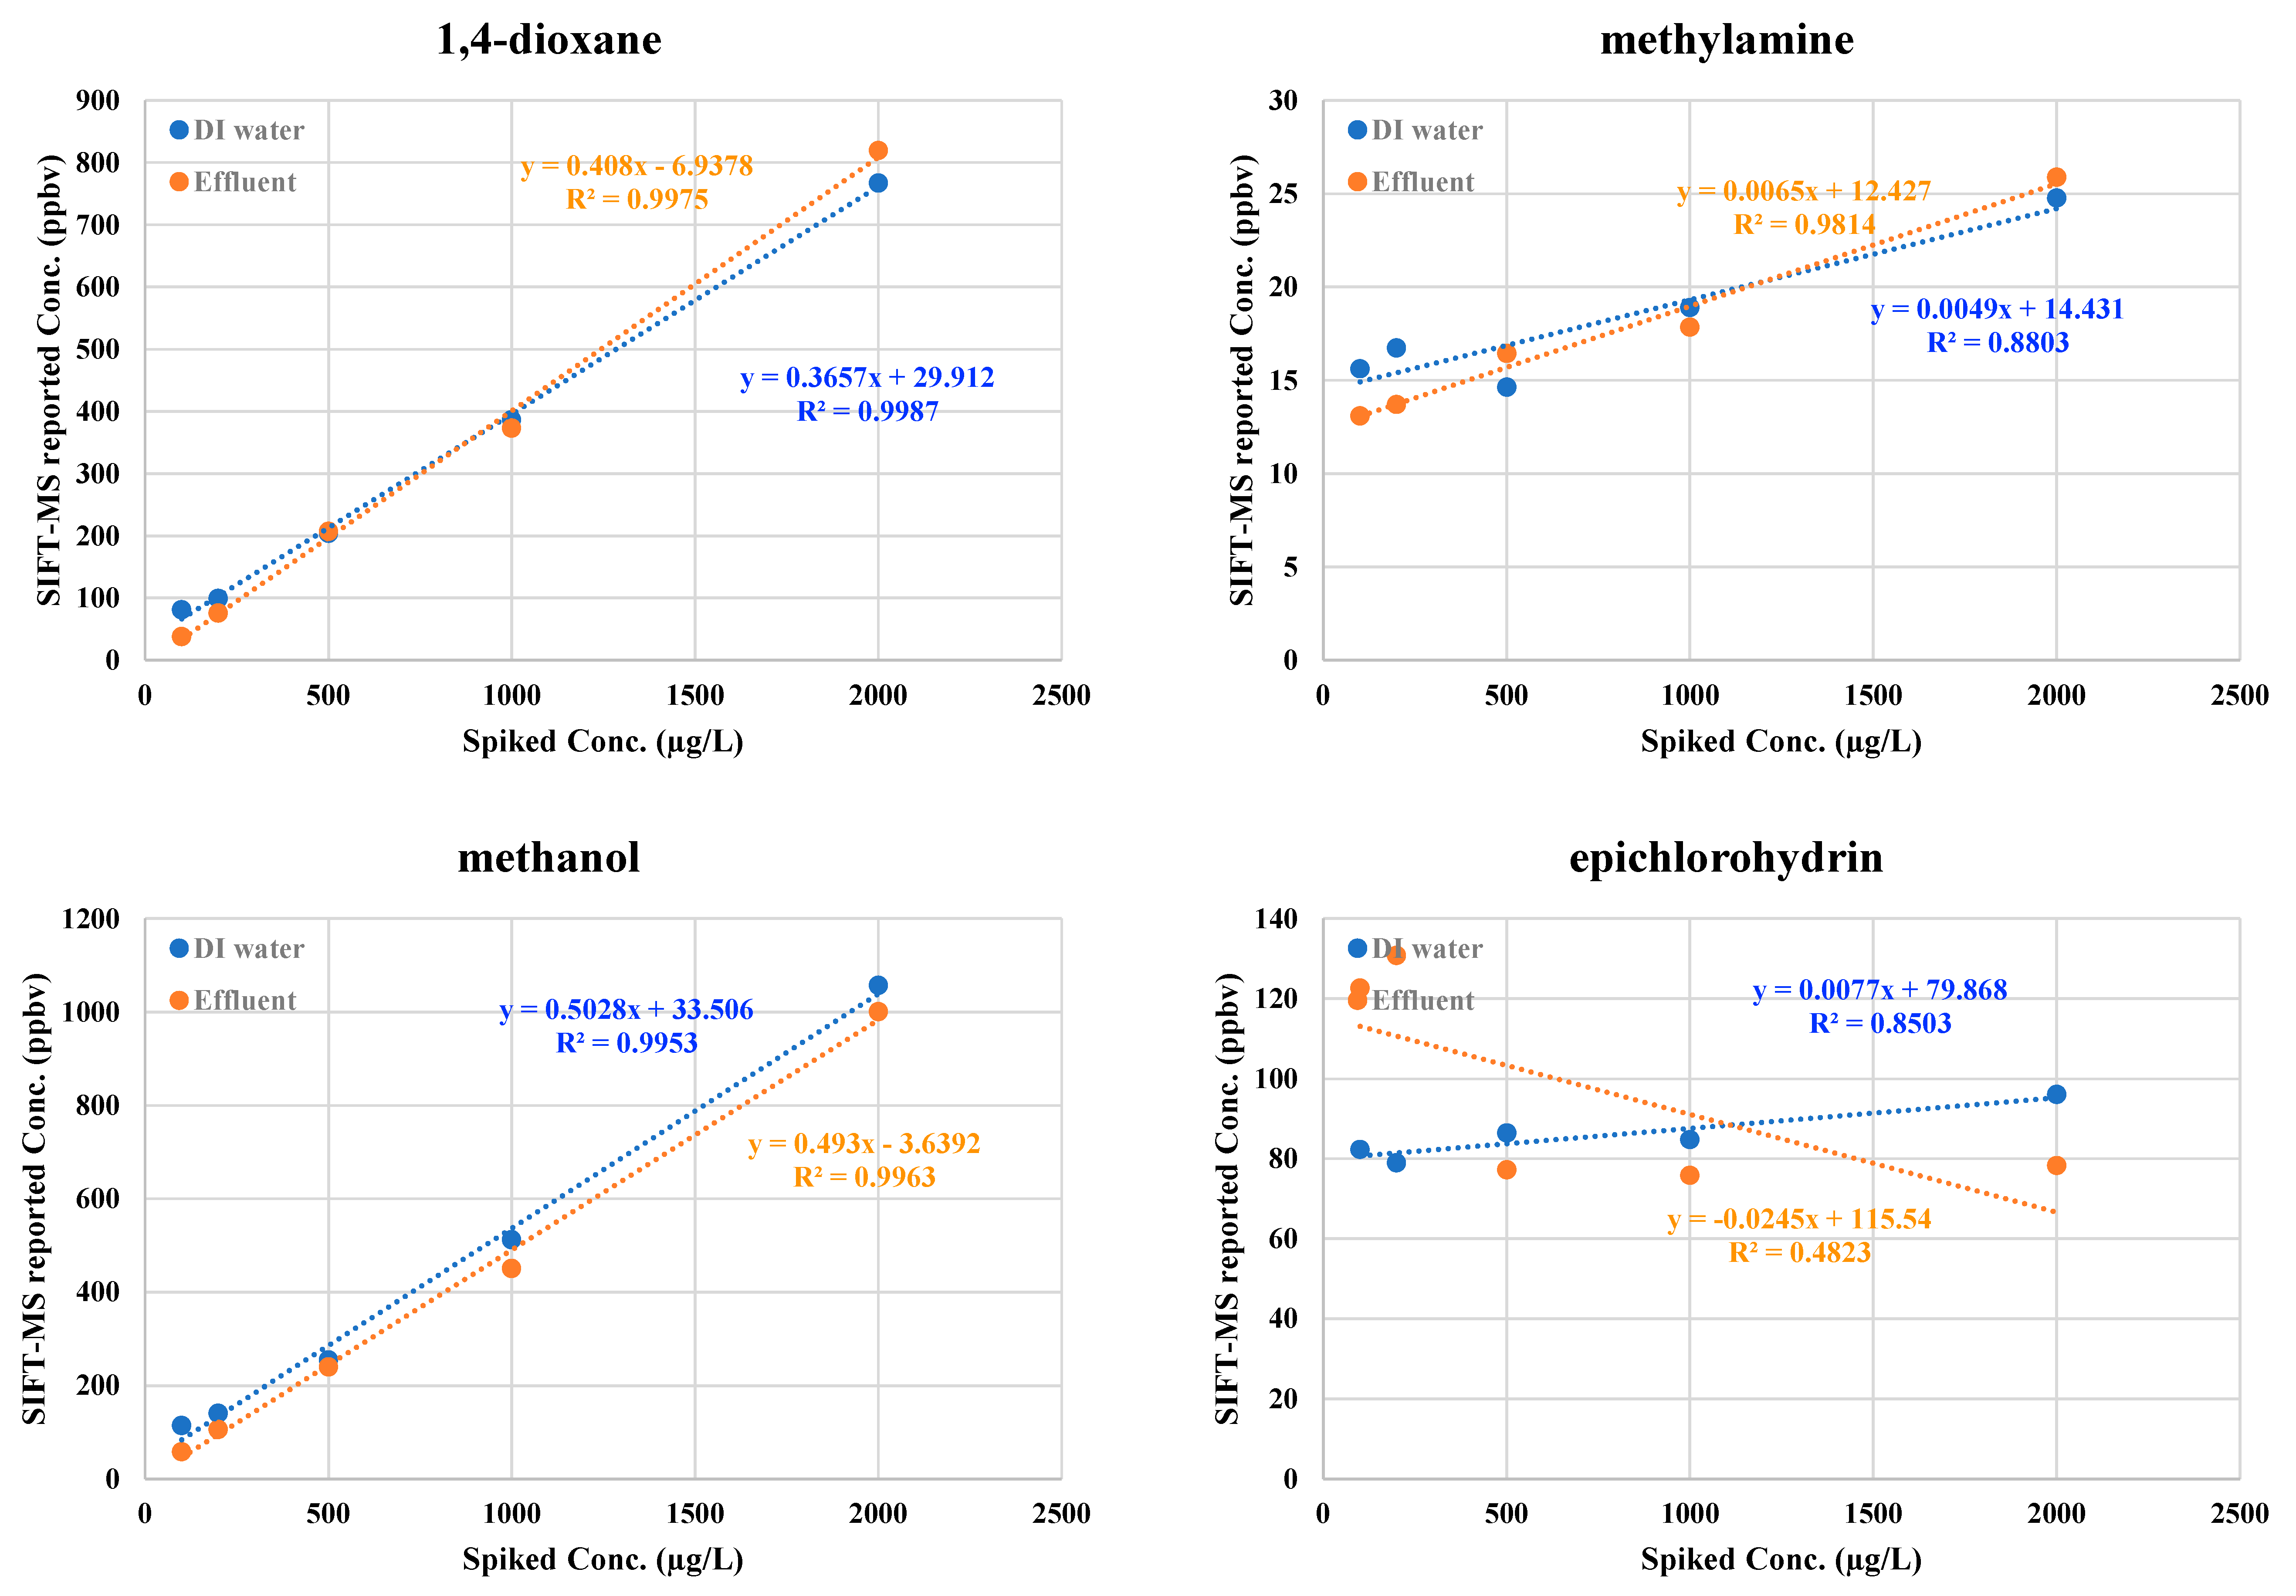
Epichlorohydrin showed no linearity (Figure 2). Because epichlorohydrin is included in the SIFT-MS library, we expected that a quantitative equation for the gas sample would be included. Many studies have shown the pretreatment of epichlorohydrin in water [30,31]. Static headspace (HS), stripping with attention on solid phase, liquid–liquid extension (LLE), solid phase extension (SPE), solid phase microextraction (SPME), and others are applied as pretreatment methods. From these results, the HS method showed a limit of detection (LOD) value of 200 μg/L, 200,000 times lower than SPME, the most sensitive pretreatment method. It is believed that epichlorohydrin has higher solubility (65,900 mg/L) and boiling point (116.5 °C) than other target compounds. The headspace–SPME method includes the function of collecting and concentrating epichlorohydrin in the surface of fiber, and it is judged that the lower detection limit was derived because the scan rate per unit time is higher than that of SIFT-MS by utilizing SIM mode in GC-MS.
In headspace analysis, a reasonable peak for reliable quantitation should be required when we analyze a given sample. The quantitation result obtained when analyzing an aliquot of the headspace is directly proportional to the concentration of the analyte in the headspace. The environment within the headspace vial can be assumed to be a closed system, and the first consideration when moving chemicals from a body of water to the atmosphere is the air–water partition coefficient (Kaw). Next, the headspace concentration CH, and thus the quantitation result RQ obtained when analyzing an aliquot of the headspace, can be expressed as follows [32]:
where C0 is the original concentration of the analyte in the sample, K is the partition (distribution) coefficient, and is the phase ratio relating the volume of the gas phase in the vial to the volume of the water phase. The partition coefficient (K), based on Raoult’s law and Henry’s law, is proportional to the reciprocal of the vapor pressure (Supplementary Materials) and the activity coefficient of the analytes [23].
Using these two approaches, it is necessary to consider the physicochemical properties of the analyte. When considering concentrations lower than 300 ppbv, derived from SIFT-MS when 2 mg/L of the reference material was injected into deionized water, the log Kaw was in the range of −7.158 to −2.215 [33]. Within these log Kaw ranges, the sensitivity of the analysis tended to be reduced when the vapor pressure associated with the partition coefficient was 0.933–20265 pascal.
3.4. Quality Assurance and Quality Control
Spiked samples for 0.2 mg/L (n = 7) were prepared and measured to estimate the standard deviation, MDL, and MQL. The MDL range, from acrylonitrile (0.020 mg/L) to methyl vinyl ketone (0.290 mg/L), is shown in Table 2. A total of 74% of the target substances had an MDL of 0.100 mg/L or less, and the RSD range was 1.4–24.8% (average: 7%).
After the matrix spike samples were prepared (n = 6), the headspace–SIFT-MS and the conventional headspace GC-MS were repeatedly measured, and the RSD, recovery, and relative percent difference (RPD) were determined. Twenty substances that could be analyzed using both methods were selected for comparison.
Effluent from the WWTP was sampled, and we confirmed using headspace–GC-MS that target substances were not detected in the effluent, with the exception of dichloromethane (below 0.001 mg/L). To test low and high concentrations, spiked samples were added at 0.2 mg/L and 1 mg/L, respectively (Table 3).
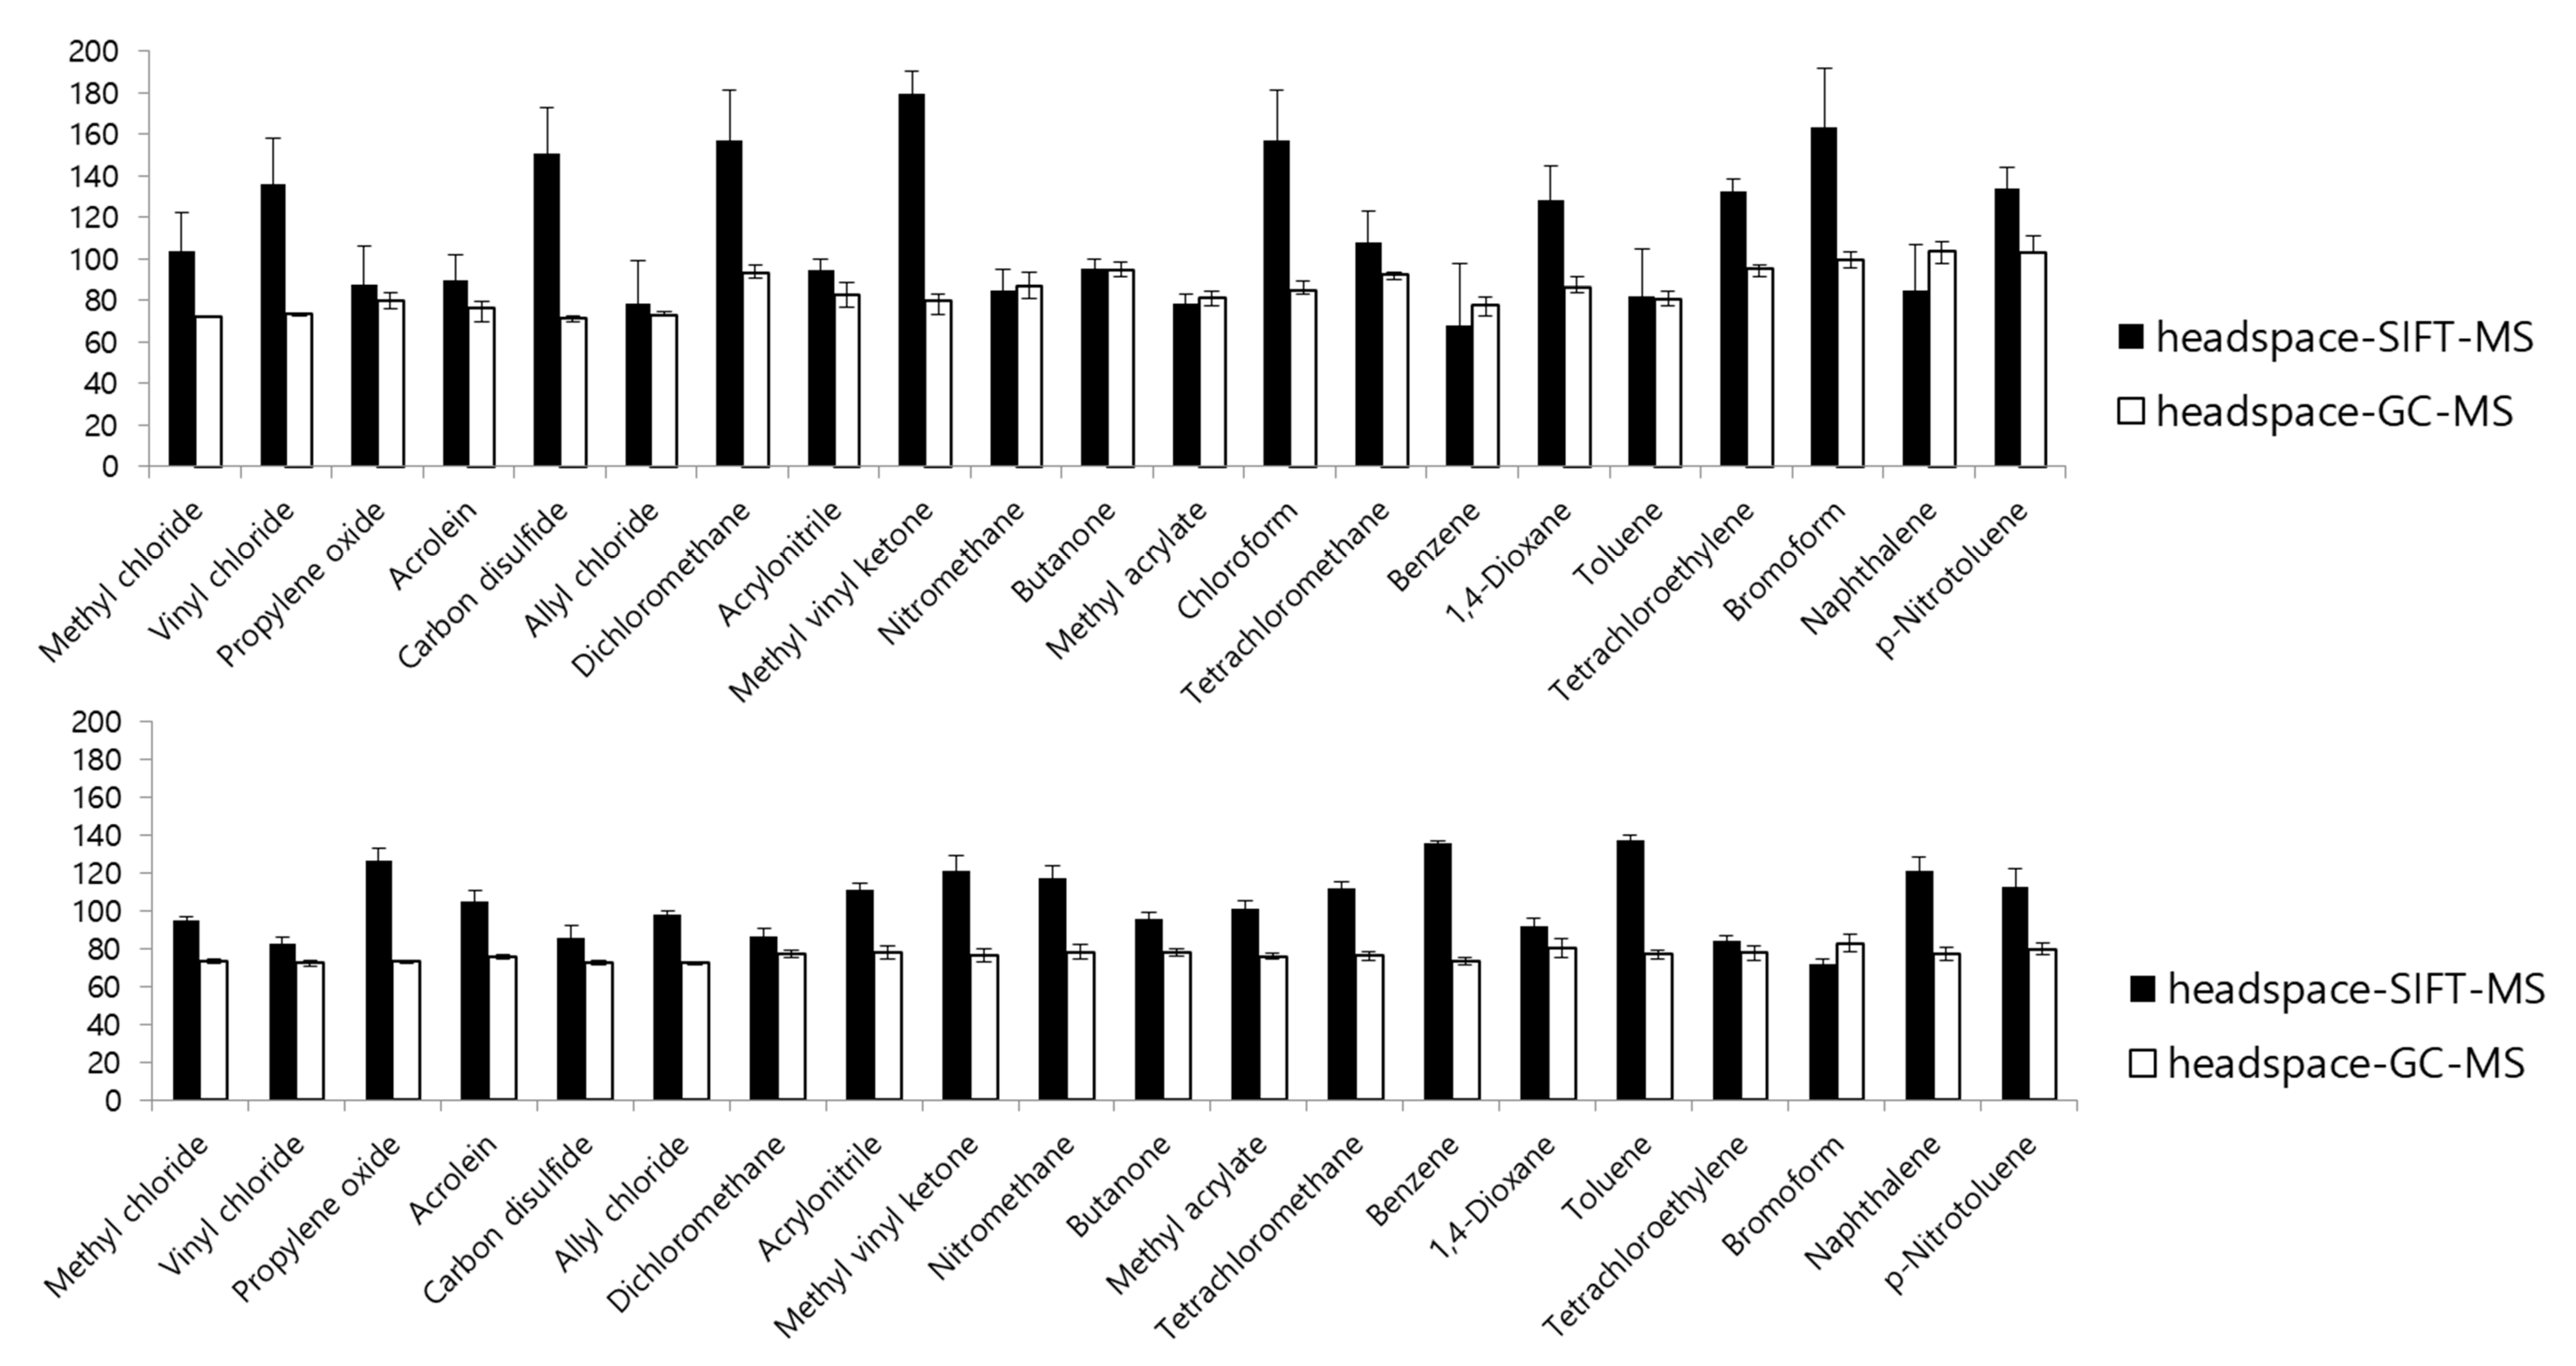
The average recoveries using headspace–SIFT-MS (headspace–GC-MS) were 111.6% and 104.7% (91% and 76.5%) for the low- and high-concentration spiked samples, respectively, and the average RSDs using headspace–SIFT-MS (headspace–GC-MS) were 27% and 8.8% (8.1% and 6.4%) for the low- and high-concentration spiked samples, respectively. It is apparent that the deviation is particularly large in the low-concentration spiked sample when using headspace–SIFT-MS (Figure 3).
Based on the t-test, p-values for eight compounds (acrylonitrile, nitromethane, butanone, methyl acrylate, naphthalene, 1,4-dioxane, tetrachloroethylene, and bromoform) were less than 0.05, and headspace–SIFT-MS and conventional headspace–GC-MS were not significantly different for these compounds.
Comparing the RPD of the average values using the headspace–SIFT-MS and headspace–GC-MS methods, methyl vinyl ketone showed a difference of 45% or more in both the high- and low-concentration samples, and a difference of 50% or more was observed for the low concentration samples of vinyl chloride, carbon disulfide, and dichloromethane. This variability decreased as the sample concentration increased; however, the variability in individual concentrations was still large using the headspace–SIFT-MS method.
We presume that the biggest cause of this variability was the fluidity of the observed response when the substances were transferred from the liquid sample to the gas phase and injected into the SIFT-MS (see supplementary materials). The direct mass spectrometer is manufactured for the purpose of analyzing a gas sample flowing from a steady state [34]. Hence, the prototype interface manufactured in this study may have unstable sample injection flow and pressure control compared to commercialized headspace–GC-MS.
3.5. Comparison of System Sensitivity and Preliminary Criteria
MDL and MQL were calculated for all 31 compounds, and the feasibility of these values was considered to control the effluent quality in the event of leakage from a chemical plant.
In Korea, TMS for TP, TN, SS, COD, and pH is operated for continuous monitoring of municipal wastewater. Meanwhile, because there is no online monitoring system to measure chemicals from industrial wastewater, the 32 chemicals are only quarterly surveyed, and there is no regular online surveillance. Therefore, in the event of a chemical accident, identifying causative pollutants takes a very long time, and emergency storage facilities cannot be properly utilized.
Recently, Lee et al. [3] suggested that if a large-scale WWTP were to establish a guideline to block the flow of chemical substances and to operate emergency storage facilities, it should be based on wastewater, river water quality standards, and human and ecotoxicity data. In other words, they should calculate the concentrations of contaminated water from chemical accidents that could affect the ecosystem through direct quotations of existing surface and wastewater quality standards, or levels derived from acute and chronic reference dose data. Finally, reference contamination levels following chemical accidents for the shut-off and operation of emergency storage facilities at WWTPs were proposed (temporary criteria for inflow blocking of contaminated water, or TCIB).
The TCIB’s preliminary criteria for chemical accidents, and the MDL and MQL determined using the headspace–SIFT-MS technique, are compared in Table 4. If the chemical detection system in the WWTP meets roughly one-tenth of the TCIB values, it is considered to be a suitable monitoring technique. Of the MDLs determined using the headspace–SIFT-MS system, 79% of the 28 compounds met one-tenth of the proposed criteria.
The most severe criteria tend to be very low. For example, the TCIB criteria for acrolein is 0.03 mg/L, and the MDL using the headspace–SIFT-MS system is 0.08 mg/L; hence, it is difficult to apply the system for detecting this substance. Furthermore, the MDLs of benzyl chloride, ethylene oxide, carbon tetrachloride, and propylene oxide are higher than one-tenth of the criteria; however, the system can be used to monitor these criteria. The MDLs and MQLs for the remainder of the compounds are expected to be fully compliant using headspace–SIFT-MS surveillance.
3.6. Field Applications
The headspace–SIFT-MS installed in the WWTP effluent line was operated as an online monitoring system, as described in Section 2.2.1. The analytical batch was set to include calibration, method blank, and spiked sample, and automatic sample measurement was performed at intervals of 30 min–1 h while adjusting the data acquisition time as needed.
Methanol was temporarily observed between 0.327 and 0.793 mg/L during the operation periods, and no other substances exceeded the MQL in the effluent. In October 2019, methanol was detected in the range of 0.374 mg/L to 0.790 mg/L, and no other substances were detected in the pilot operation with the detection system mounted on a trailer in the Nakdong River (Figure 4).
Field operations revealed that it may be advantageous to use dispenser pipette sampling with disposable tips and vials to control the matrix effect of effluent and surface water samples in continuous field measurements. Using the syringe tool changer and capper/decapper efficiently, it was possible to automate the entire online analysis process. SIFT-MS has wide substance detection ranges because it does not utilize chromatography, and overall maintenance with headspace pretreatment was very simple.
A detailed description of data transmission and analysis is beyond the scope of this study. In summary, detection data is transferred to a data transmission system, and is configured to provide a signal to the inflow blocking mechanism and storage facility operating system. In this manner, the automated online headspace–SIFT-MS system could be used effectively to manage and control hazardous chemical leaks.
The current headspace–SIFT-MS has a higher quantitation limit compared to headspace–GC-MS; hence, it may be necessary to improve the sensitivity of the system through large volume vaporization or a new gas phase introduction technique, in order to enhance sensitivity in the future.
4. Conclusions
To systematically manage water quality in densely populated regions where chemical substances are used in large quantities, continuous monitoring is necessary to detect leaks, control the discharged water quality, and enact emergency storage operations in the event of a large-scale leak or explosion. While some WWTP facilities currently operate TMS equipment to analyze TN, TP, COD, and SS, it is virtually impossible to monitor chemical substances.
In this research, we investigated the application of SIFT-MS and direct mass spectrometry for the continuous detection of chemical substances that are commonly used in industrial applications. This method has advantages over existing analytical techniques, which would require both GC-MS and LC-MS in addition to expert pretreatment steps.
The headspace method was selected for pretreatment considering the molecular weight range and volatility of the target substances, and it was linked to SIFT-MS using the general extraction conditions for VOCs in headspace–GC. Following calibration from 0.1 to 2.0 mg/L, good linearity was obtained for most of the 31 compounds investigated. The MDLs using the headspace-SIFT-MS ranged from 0.020 to 0.290 mg/L. Approximately 74% of the compounds had an MDL less than 0.1 mg/L, which is the proposed threshold for monitoring WWTP effluent for aquatic ecosystem conservation. Furthermore, the headspace–SIFT-MS system met 79% of the TCIB. The headspace pretreatment method was automated and deployed in field studies at a WWTP and in the Nakdong River, to evaluate the online operation of the system. Compared to the GC-MS method combined with online purge and trap, the pretreatment and maintenance of the online headspace–SIFT-MS system was simpler and more effective. Data acquiring time was adjusted according to the response scenario, and can normally be analyzed from once a day to four times a day; data can be obtained once per hour or every 30 min when the detection level begins to exceed one-tenth of the proposed criteria (TCIB).
In the future, the sensitivity of the headspace–SIFT-MS system should be improved so that the technique can be used for monitoring low-concentration chemicals under normal conditions. Hence, the optimization of the headspace pretreatment and the water sample interface should be considered. To achieve this, it will be necessary to estimate and install the calculated formula for automatic water quantification. Furthermore, because large-scale industrial complexes and metropolises are located in the middle of the Nakdong River, industrial wastewater and sewage flows into the Nakdong River, and people living downstream drink water treated through the water treatment process. Therefore, continuous monitoring techniques should be developed for chemicals that are difficult to incorporate in headspace pretreatment techniques, such as endocrine disruptors and personal care products.
In case of a chemical accident, studies on the processing efficiency and treatment capacity of chemicals by water treatment process [35] are needed to minimize damage, and studies related to toxicity and biological decomposition of these substances [36] are needed when river water is used as drinking water.
Supplementary Materials
The following are available online at https://www.mdpi.com/2073-4441/12/7/1843/s1, Figure S1: Data assignment under headspace extraction and injection conditions (left: single-compound injection, right: multi-compound injection), Table S1: Physico/chemical properties of target compounds for chemical accidents and leakages, Table S2: Reaction ion, mass, and theoretical and measured reaction ratios of target compounds.
Author Contributions
J.-W.C. and S.-H.L. provided the idea of the study and writing of the manuscript, E.-J.S. and Y.-S.K. conducted the data analysis, K.-D.Z. provided important advice on the concept of the methodology and results. All authors have read and agreed to the published version of the manuscript.
Funding
This work was supported by the Korea Environment Industry and Technology Institute (KEITI), through The Chemical Accident Prevention Technology Development Project, funded by the Korea Ministry of Environment (MOE) (RE201704021).
Acknowledgments
We gratefully acknowledge the engineering of Syft Korea and Euro Science Ltd., Republic of Korea. We also thank Im-Gun Shin for his help with storing quantitative formulas in the data transmission system, and Jin-Sung Ra and Moon-Hwan Song of KITECH for their help with field monitoring works in the trailer.
Conflicts of Interest
The authors declare no conflict of interest.
References
- Korea Ministry of Environment. Water Environment Conservation Law Enforcement Regulations Article 3 & 4; Korea Ministry of Environment: Sejong, Korea, 2017.
- Korea Environment Corporation. Information System on Prevention of Water Pollution; Korea Environment Corporation: Incheon, Korea, 2019. [Google Scholar]
- Lee, S.; Kim, S.; Lee, H.; Choi, S. Determination of effluent and influent limitations for hazardous chemicals to prevent chemical accidents in wastewater treatment plants. J. Environ. Anal. Health Toxicol. 2019, 4, 277–290. [Google Scholar] [CrossRef]
- Korea Ministry of Environment. Environmental Testing and Inspection Act; Korea Ministry of Environment: Sejong, Korea, 2017.
- Volatile Organic Compounds by Gas Chromatography/Mass Spectrometry (GC/MS); EPA Method 8260D, Revision 4; U.S. EPA: Washington, DC, USA, 2018.
- Volatile Organic Compounds in Various Sample Matrices Using Equilibrium Headspace Analysis; EPA Method 5021A, Revision 2; U.S. EPA: Washington, DC, USA, 2014.
- Acrylamide, Acrylonitrile and Acrolein by High Performance Liquid Chromatography (HPLC); EPA Method 8316; U.S. EPA: Washington, DC, USA, 1994.
- Purge and Trap Capillary-Column Gas Chromatographic/Mass Spectrometric Method, 23rd ed.; Standard Methods 6200 B; American Public Health Association, American Water Works Association, Water Environment Federation: Denver, CO, USA, 2017.
- Ghislain, M.; Costarramone, N.; Sotiropoulos, J.; Pigot, T.; Berg, R.V.D.; Lacombe, S.; Bechec, M.L. Direct analysis of aldehydes and carboxylic acids in the gas phase by negative ionization selected ion flow tube mass spectrometry: Quantification and modelling of ion–molecule reactions. Rapid Commun. Mass Spectrom. 2019, 33, 1623–1634. [Google Scholar] [CrossRef] [PubMed]
- Shestivska, V.; Antonowicz, S.S.; Dryahina, K.; Kubišta, J.; Smith, D.; Španěl, P. Direct detection and quantification of malondialdehyde vapour in humid air using selected ion flow tube mass spectrometry supported by gas chromatography/mass spectrometry. Rapid Commun. Mass Spectrom. 2015, 29, 1069–1079. [Google Scholar] [CrossRef] [PubMed] [Green Version]
- Smith, D.; Španěl, P. Direct, rapid quantitative analyses of BVOCs using SIFT-MS and PTR-MS obviating sample collection. Trac. Trends Anal. Chem. 2011, 30, 945–959. [Google Scholar] [CrossRef]
- Allpress, C.; Crittenden, D.; Ma, J.; McEwan, M.; Robinson, S.; Wilson, P.; Wu, M. Real-time differentiation of ethylbenzene and the xylenes using selected ion flow tube mass spectrometry. Rapid Commun. Mass Spectrom. 2019, 33, 1844–1849. [Google Scholar] [CrossRef]
- Ghislain, M.; Costarramone, N.; Pigot, T.; Reyrolle, M.; Lacombe, S.; Bechec, M.L. High frequency air monitoring by selected ion flow tube-mass spectrometry (SIFT-MS): Influence of the matrix for simultaneous analysis of VOC, CO2, ozone and water. Microchem. J. 2019, 104435. [Google Scholar] [CrossRef]
- Smith, D.; Španěl, P. Selected ion flow tube mass spectrometry (SIFT-MS) for on-line trace gas analysis. Mass Spectrom. Rev. 2005, 24, 661–700. [Google Scholar] [CrossRef]
- Heynderickx, P.M.; Clercq, S.D.; Saveyn, P.; Dewulf, J.; Langenhove, H.V. Determination of the sorption and desorption kinetics of perfume raw materials in the liquid phase with vesicular dispersion: Application of SIFT-MS. Chem. Eng. J. 2013, 217, 281–288. [Google Scholar] [CrossRef]
- Wang, T.; Španěl, P.; Smith, D. A selected ion flow tube study of the reactions of H3O+, NO+ and O2+ with some phenols, phenyl alcohols and cyclic carbonyl compounds in support of SIFT-MS and PTR-MS. Int. J. Mass Spectrom. 2004, 239, 139–146. [Google Scholar] [CrossRef]
- Španěl, P.; Smith, D. Selected ion flow tube—Mass spectrometry: Detection and real-time monitoring of flavours released by food products. Rapid Commun. Mass Spectrom. 1999, 13, 585–596. [Google Scholar] [CrossRef]
- Xu, Y.; Barringer, S. Comparison of volatile release in tomatillo and different varieties of tomato during chewing. J. Food Sci. 2010, 75, C352–C358. [Google Scholar] [CrossRef] [PubMed]
- Amadei, G.; Ross, B. The reactions of a series of terpenoids with H3O+, NO+ and O 2+ studied using selected ion flow tube mass spectrometry. Rapid Commun. Mass Spectrom. 2011, 25, 162–168. [Google Scholar] [CrossRef] [PubMed]
- Majchrzak, T.; Wojnowski, W.; Lubinska-Szczygeł, M.; Różańska, A.; Namieśnik, J.; Dymerski, T. PTR-MS and GC-MS as complementary techniques for analysis of volatiles: A tutorial review. Anal. Chim. Acta 2018, 1035, 1–13. [Google Scholar] [CrossRef] [PubMed]
- National Institute of Chemical Safety. Key Info Guide for Accident Preparedness Substances; Ministry of Environment: Daejeon, Korea, 2019. [Google Scholar]
- USEPA. Reducing Emissions of Hazardous Air Pollutants. Available online: https://www.epa.gov/haps/reducing-emissions-hazardous-air-pollutants#stat (accessed on 15 April 2020).
- Kolb, B.; Ettre, L.S. Headspace methods for quantitative analysis. Stat. Headspace Gas Chromatogr. 2006, 197–256. [Google Scholar] [CrossRef]
- Xie, W.-Q.; Gong, Y.-X.; Yu, K.-X. Enhancing the sensitivity of full evaporation technique using multiple headspace extraction analysis. Chromatographia 2017, 80, 1263–1268. [Google Scholar] [CrossRef]
- Bicchi, C.; Cordero, C.; Liberto, E.; Sgorbini, B.; Rubiolo, P. Headspace sampling of the volatile fraction of vegetable matrices. J. Chromatogr. A 2008, 1184, 220–233. [Google Scholar] [CrossRef]
- Chai, X.-S.; Hou, Q.X.; Schork, F.J. Determination of the solubility of a monomer in water by multiple headspace extraction gas chromatography. J. Appl. Polym. Sci. 2005, 99, 1296–1301. [Google Scholar] [CrossRef]
- Spanel, P.; Smith, D. Advances in on-line absolute trace gas analysis by SIFT-MS. Curr. Anal. Chem. 2013, 9, 525–539. [Google Scholar] [CrossRef]
- Smith, D.; Pysanenko, A.; Španěl, P. Ionic diffusion and mass discrimination effects in the new generation of short flow tube SIFT-MS instruments. Int. J. Mass Spectrom. 2009, 281, 15–23. [Google Scholar] [CrossRef]
- Španěl, P.; Smith, D. Progress in SIFT-MS: Breath analysis and other applications. Mass Spectrom. Rev. 2010, 30, 236–267. [Google Scholar] [CrossRef]
- Lucentini, L.; Ferretti, E.; Veschetti, E.; Sibio, V.; Citti, G.; Ottaviani, M. Static headspace and purge-and-trap gas chromatography for epichlorohydrin determination in drinking water. Microchem. J. 2005, 80, 89–98. [Google Scholar] [CrossRef]
- Gaca, J.; Wejnerowska, G. Determination of epichlorohydrin in water and sewage samples. Talanta 2006, 70, 1044–1050. [Google Scholar] [CrossRef] [PubMed]
- Kolb, B.; Ettre, L.S. Theoretical background of HS-GC and its applications. Stat. Headspace Gas Chromatogr. 2006, 19–50. [Google Scholar] [CrossRef]
- US EPA. Estimation Programs Interface SuiteTM for Microsoft® Window v 4.11; United States Environmental Protection Agency: Washington, DC, USA, 2019.
- Ross, B.M.; Babay, S.; Ladouceur, C. The use of selected ion flow tube mass spectrometry to detect and quantify polyamines in headspace gas and oral air. Rapid Commun. Mass Spectrom. 2009, 23, 3973–3982. [Google Scholar] [CrossRef] [PubMed]
- Stasinakis, A.S.; Gatidou, G.; Mamais, D.; Thomaidis, N.S.; Lekkas, T.D. Occurrence and fate of endocrine disrupters in Greek sewage treatment plants. Water Res. 2008, 42, 1796–1804. [Google Scholar] [CrossRef]
- Emmanouil, C.; Bekyrou, M.; Psomopoulos, C.; Kungolos, A. An Insight into ingredients of toxicological interest in personal care products and a small–scale sampling survey of the greek market: Delineating a potential contamination source for water resources. Water 2019, 11, 2501. [Google Scholar] [CrossRef] [Green Version]
Figure 1.
Online headspace pretreatment with direct mass spectrometry for continuous effluent monitoring ((1) real time water tank; (2) vial rack for calibration and the effluent sample; (3) headspace static; (4) robotic arm; (5) capper/decapper; (6) syringe tool changer; (7) control panel).
Figure 1.
Online headspace pretreatment with direct mass spectrometry for continuous effluent monitoring ((1) real time water tank; (2) vial rack for calibration and the effluent sample; (3) headspace static; (4) robotic arm; (5) capper/decapper; (6) syringe tool changer; (7) control panel).

Figure 2.
Calibration curves of good (left) and bad (right) linearity under headspace extraction conditions.
Figure 2.
Calibration curves of good (left) and bad (right) linearity under headspace extraction conditions.

Figure 3.
Recovery of spiked samples analyzed by headspace–SIFT-MS and headspace–GC-MS (upper: 0.2 mg/L; bottom: 1.0 mg/L).
Figure 3.
Recovery of spiked samples analyzed by headspace–SIFT-MS and headspace–GC-MS (upper: 0.2 mg/L; bottom: 1.0 mg/L).

Figure 4.
Detection range of methanol confirmed by online monitoring of headspace–SIFT-MS on actual samples at wastewater treatment plant and river.
Figure 4.
Detection range of methanol confirmed by online monitoring of headspace–SIFT-MS on actual samples at wastewater treatment plant and river.


Table 1.
Operating conditions of headspace and direct mass spectrometry.
| Headspace in PAL | SIFT-MS | ||
|---|---|---|---|
| Agitator temp. (°C) | 60 | Inlet pipe temp. | 110 °C |
| Agitation time (min) | 15 | Upstream pressure | 1.6 × 10⁻⁴ torr |
| Agitation speed (rpm) | 500 | Flow tube pressure | 140 m torr |
| Needle temp. (°C) | 90 | Flow tube temp. | 120 °C |
| Injection speed (µL/s) | 35 | Downstream pressure | 1.0 × 10⁻⁶ torr |
| Carrier gas | N2 | Source pressure | 420 m torr |
| Transfer line temp. (°C) | 90 | Scan mode | SIM SCAN |
Table 2.
Calibration linearity, method detection limit (MDL), method quantification limit (MQL), recovery, and relative standard deviation (RSD) of headspace–selected ion flow tube mass spectrometry (SIFT-MS).
Table 2.
Calibration linearity, method detection limit (MDL), method quantification limit (MQL), recovery, and relative standard deviation (RSD) of headspace–selected ion flow tube mass spectrometry (SIFT-MS).
| Compounds | Calibration Equation | R2 | MDL (mg/L) | MQL (mg/L) | Recovery Efficiency (%) | RSD (%) |
|---|---|---|---|---|---|---|
| Toluene | y = 11.558x + 59.874 | 0.9954 | 0.042 | 0.133 | 91.5 | 2.9 |
| Phenol | y = 0.0604x + 5.7481 | 0.9992 | 0.107 | 0.340 | 82.4 | 8.3 |
| Formic acid | y = 0.6142x + 1.8334 | 0.9920 | 0.069 | 0.220 | 81.5 | 5.4 |
| Nitromethane | y = 0.2265x + 7.7904 | 0.9975 | 0.071 | 0.226 | 94.6 | 4.8 |
| Acrolein | y = 0.9914x + 106.14 | 0.9971 | 0.084 | 0.267 | 75.4 | 7.1 |
| Benzyl chloride | y = 0.263x + 40.867 | 0.9444 | 0.122 | 0.389 | 68.2 | 11.4 |
| Acrylamide | y = 0.0189x + 3.3617 | 0.9854 | 0.231 | 0.735 | 59.4 | 24.8 |
| 1,4-dioxane | y = 0.3657x + 29.912 | 0.9987 | 0.070 | 0.222 | 97.8 | 4.5 |
| Trichloroethylene | y = 6.6026x + 54.107 | 0.9961 | 0.032 | 0.101 | 92.4 | 2.2 |
| p-nitrotoluene | y = 0.1127x + 4.7907 | 0.9947 | 0.172 | 0.548 | 103.9 | 10.6 |
| Naphthalene | y = 1.119x + 208.51 | 0.9946 | 0.059 | 0.188 | 100.3 | 3.7 |
| Methyl ethyl ketone | y = 1.366x + 144.1 | 0.9983 | 0.062 | 0.197 | 92.0 | 4.3 |
| Tetrachloroethene | y = 21.654x + 3444.1 | 0.9247 | 0.063 | 0.202 | 82.2 | 4.9 |
| Methyl acrylate | y = 2.1793x + 296.58 | 0.9864 | 0.034 | 0.109 | 90.1 | 2.4 |
| Bromoform | y = 4.4189x + 1006.5 | 0.9461 | 0.035 | 0.110 | 76.2 | 2.9 |
| 1,1-dichloroethylene | y = 42.335x + 4748.1 | 0.9741 | 0.074 | 0.236 | 67.8 | 7.0 |
| Benzene | y = 11.613x + 718.69 | 0.9990 | 0.037 | 0.119 | 92.8 | 2.6 |
| Methyl vinyl ketone | y = 1.366x + 144.1 | 0.9983 | 0.290 | 0.923 | 96.2 | 19.2 |
| Vinyl chloride | y = 37.283x − 1558.8 | 0.9870 | 0.175 | 0.558 | 116.3 | 9.6 |
| Dichloromethane | y = 31.497x − 3668.8 | 0.9718 | 0.026 | 0.082 | 80.8 | 2.0 |
| Ethylene oxide | y = 5.7159x − 336.2 | 0.9856 | 0.054 | 0.173 | 77.1 | 4.5 |
| Allyl chloride | y = 8.7083x + 506.78 | 0.9992 | 0.062 | 0.198 | 80.7 | 4.9 |
| Carbon tetrachloride | y = 14.379x − 1199.8 | 0.9863 | 0.057 | 0.181 | 80.1 | 4.5 |
| Ethyl acetate | y = 1.4779x + 219.91 | 0.9963 | 0.076 | 0.243 | 92.1 | 5.3 |
| Formaldehyde | y = 0.1249x + 18.381 | 0.9926 | 0.232 | 0.740 | 94.7 | 15.6 |
| Acrylonitrile | y = 1.7616x + 33.786 | 0.9956 | 0.020 | 0.064 | 92.0 | 1.4 |
| Methyl chloride | y = 0.5067x − 15.953 | 0.9895 | 0.089 | 0.283 | 103.9 | 13.6 |
| Carbon disulfide | y = 150.82x − 13939 | 0.9762 | 0.155 | 0.495 | 117.5 | 8.4 |
| m-cresol | y = 0.0496x + 0.3257 | 0.9705 | 0.073 | 0.234 | 63.0 | 7.4 |
| Methanol | y = 0.5028x + 33.506 | 0.9953 | 0.079 | 0.251 | 85.8 | 5.9 |
| Propylene oxide | y = 8.7096x + 73.525 | 0.9957 | 0.057 | 0.181 | 78.6 | 4.6 |
Table 3.
Recovery efficiencies of spiked effluent samples in low and high concentrations.
| Spiked conc. 0.2 mg/L | Headspace–SIFT-MS | Headspace–GC-MS | RPD (Relative Percent Difference) | ||
|---|---|---|---|---|---|
| Measured (mg/L) | RSD % | Measured (mg/L) | RSD % | ||
| Methyl chloride | 0.21 | 34.8 | 0.14 | 1.8 | 36.1 |
| Vinyl chloride | 0.27 | 25.0 | 0.15 | 2.4 | 59.8 |
| Propylene oxide | 0.18 | 41.4 | 0.16 | 9.1 | 9.0 |
| Acrolein | 0.18 | 22.0 | 0.15 | 8.1 | 16.1 |
| Carbon disulfide | 0.30 | 22.9 | 0.14 | 3.6 | 71.2 |
| Allyl chloride | 0.16 | 42.7 | 0.15 | 3.1 | 7.3 |
| Dichloromethane | 0.31 | 14.7 | 0.19 | 7.7 | 51.1 |
| Acrylonitrile | 0.19 | 14.2 | 0.16 | 15.4 | 13.5 |
| Methyl vinyl ketone | 0.36 | 55.4 | 0.16 | 8.5 | 76.9 |
| Nitromethane | 0.17 | 26.6 | 0.17 | 14.2 | 3.0 |
| Butanone | 0.19 | 8.5 | 0.19 | 7.5 | 0.5 |
| Methyl acrylate | 0.16 | 13.4 | 0.16 | 8.6 | 3.3 |
| Tetrachloromethane | 0.22 | 30.8 | 0.18 | 3.4 | 15.7 |
| Benzene | 0.14 | 71.3 | 0.16 | 9.8 | 13.8 |
| 1,4-Dioxane | 0.26 | 28.6 | 0.17 | 13.5 | 39.5 |
| Toluene | 0.16 | 53.6 | 0.16 | 10.2 | 2.1 |
| Tetrachloroethylene | 0.27 | 10.6 | 0.19 | 4.2 | 33.1 |
| Bromoform | 0.33 | 2.1 | 0.20 | 7.6 | 48.3 |
| Naphthalene | 0.17 | 10.4 | 0.21 | 8.9 | 19.7 |
| p-Nitrotoluene | 0.27 | 10.6 | 0.21 | 15.3 | 26.2 |
| Spiked conc. 1 mg/L | Headspace-SIFT-MS | Headspace-SIFT-MS | RPD | ||
| Measured (mg/L) | RSD % | Measured (mg/L) | RSD % | ||
| Methyl chloride | 0.95 | 2.8 | 0.73 | 2.7 | 26.1 |
| Vinyl chloride | 0.83 | 8.3 | 0.72 | 3.4 | 13.5 |
| Propylene oxide | 1.27 | 10.4 | 0.73 | 2.8 | 53.7 |
| Acrolein | 1.05 | 11.4 | 0.76 | 3.6 | 32.4 |
| Carbon disulfide | 0.86 | 14.5 | 0.73 | 2.7 | 16.6 |
| Allyl chloride | 0.98 | 5.1 | 0.72 | 2.9 | 30.0 |
| Dichloromethane | 0.87 | 10.4 | 0.77 | 5.3 | 11.1 |
| Acrylonitrile | 1.11 | 6.9 | 0.78 | 9.3 | 35.1 |
| Methyl vinyl ketone | 1.21 | 12.4 | 0.76 | 9.5 | 45.7 |
| Nitromethane | 1.18 | 11.2 | 0.78 | 9.6 | 40.2 |
| Butanone | 0.96 | 8.2 | 0.78 | 4.6 | 19.9 |
| Methyl acrylate | 1.01 | 8.4 | 0.76 | 5.0 | 28.5 |
| Tetrachloromethane | 1.12 | 6.1 | 0.76 | 6.7 | 37.9 |
| Benzene | 1.36 | 1.8 | 0.73 | 5.2 | 59.7 |
| 1,4-Dioxane | 0.92 | 9.4 | 0.80 | 11.7 | 13.3 |
| Toluene | 1.37 | 4.8 | 0.77 | 5.8 | 56.1 |
| Tetrachloroethylene | 0.85 | 5.3 | 0.78 | 9.7 | 8.1 |
| Bromoform | 0.72 | 7.4 | 0.83 | 11.0 | 14.2 |
| Naphthalene | 1.21 | 12.9 | 0.78 | 9.1 | 43.8 |
| p-Nitrotoluene | 1.13 | 17.7 | 0.80 | 7.4 | 34.1 |
Table 4.
MDL and MQL of headspace–SIFT-MS compared with proposed criteria: temporary criteria for inflow blocking of contaminated water (TCIB).
Table 4.
MDL and MQL of headspace–SIFT-MS compared with proposed criteria: temporary criteria for inflow blocking of contaminated water (TCIB).
| Compound | Proposed Effluent Criteria | 1/10 of Effluent Criteria | MDL | MQL |
|---|---|---|---|---|
| Toluene | 23 | 2.3 | 0.04 | 0.13 |
| Phenol | 4 | 0.4 | 0.11 | 0.34 |
| Formic acid | 2900 | 290 | 0.07 | 0.22 |
| Nitromethane | not proposed | 0.07 | 0.23 | |
| Acrolein | 0.03 | 0.003 | 0.08 | 0.27 |
| Benzyl chloride | 0.2 | 0.02 | 0.12 | 0.39 |
| Acrylamide | 59 | 5.9 | 0.23 | 0.74 |
| 1,4-dioxane | 5 | 0.5 | 0.07 | 0.22 |
| Trichloroethylene | 2 | 0.2 | 0.03 | 0.10 |
| p-nitrotoluene | 20 | 2 | 0.17 | 0.55 |
| Naphthalene | 2 | 0.2 | 0.06 | 0.19 |
| Methyl ethyl ketone | 220 | 22 | 0.06 | 0.20 |
| Tetrachloroethene | 4 | 0.4 | 0.06 | 0.20 |
| Methyl acrylate | not proposed | 0.03 | 0.11 | |
| Bromoform | 1 | 0.1 | 0.04 | 0.11 |
| 1,1-dichloroethylene | 0.7 | 0.07 | 0.07 | 0.24 |
| Benzene | 1 | 0.1 | 0.04 | 0.12 |
| Methyl vinyl ketone | not proposed | 0.29 | 0.92 | |
| Vinyl chloride | 4 | 0.4 | 0.18 | 0.56 |
| Dichloromethane | 2 | 0.2 | 0.03 | 0.08 |
| Ethylene oxide | 0.1 | 0.01 | 0.05 | 0.17 |
| Allyl chloride | 1 | 0.1 | 0.06 | 0.20 |
| Carbon tetrachloride | 0.4 | 0.04 | 0.06 | 0.18 |
| Ethyl acetate | 1400 | 140 | 0.08 | 0.24 |
| Formaldehyde | 50 | 5 | 0.23 | 0.74 |
| Acrylonitrile | 2 | 0.2 | 0.02 | 0.06 |
| Methyl chloride | 150 | 15 | 0.09 | 0.28 |
| Carbon disulfide | 300 | 30 | 0.16 | 0.50 |
| M-cresol | 90 | 9 | 0.07 | 0.23 |
| Methanol | 33 | 3.3 | 0.08 | 0.25 |
| Propylene oxide | 0.1 | 0.01 | 0.06 | 0.18 |
© 2020 by the authors. Licensee MDPI, Basel, Switzerland. This article is an open access article distributed under the terms and conditions of the Creative Commons Attribution (CC BY) license (http://creativecommons.org/licenses/by/4.0/).
Share and Cite
MDPI and ACS Style
Lee, S.-H.; Shin, E.-J.; Zoh, K.-D.; Kang, Y.-S.; Choi, J.-W. Direct Mass Spectrometry with Online Headspace Sample Pretreatment for Continuous Water Quality Monitoring. Water 2020, 12, 1843. https://doi.org/10.3390/w12071843
AMA Style
Lee S-H, Shin E-J, Zoh K-D, Kang Y-S, Choi J-W. Direct Mass Spectrometry with Online Headspace Sample Pretreatment for Continuous Water Quality Monitoring. Water. 2020; 12(7):1843. https://doi.org/10.3390/w12071843
Chicago/Turabian StyleLee, Sun-Hong, Eun-Ji Shin, Kyung-Duk Zoh, Youn-Seok Kang, and Jae-Won Choi. 2020. "Direct Mass Spectrometry with Online Headspace Sample Pretreatment for Continuous Water Quality Monitoring" Water 12, no. 7: 1843. https://doi.org/10.3390/w12071843
Note that from the first issue of 2016, this journal uses article numbers instead of page numbers. See further details here.