PANI-ZnO Cladding-Modified Optical Fiber Biosensor for Urea Sensing Based on Evanescent Wave Absorption
 S. N. Botewad1 V. G. Pahurkar2 G. G. Muley2
  D. K. Gaikwad1,3*
  Gajanan A. Bodkhe4
  Mahendra D. Shirsat4 P. P. Pawar1
- 1Department of Physics, Dr. Babasaheb Ambedkar Marathwada University, Aurangabad, India
- 2Department of Physics, SantGadge Baba Amravati University, Amravati, India
- 3Department of Physics, ACS College, Dharangaon, India
- 4RUSA Centre for Advanced Sensor Technology, Department of Physics, Dr. Babasaheb Ambedkar Marathwada University, Aurangabad, India
In the present investigation, we demonstrated a simple, rapid, and highly sensitive cladding-modified optical fiber urea sensor based on the evanescent wave absorption (EWA) technique. Cladding modification was performed over a 2-cm unclad portion of optical fiber using a polyaniline-zinc oxide (PANI-ZnO) matrix with enzyme-Urease (Urs) cross-linked to it using glutarldehyde as a cross-linking agent. The PANI-ZnO matrix was characterized by X-ray diffraction, scanning electron microscopy, ultraviolet-visible, and Fourier transform-infrared spectroscopy to explore its various properties. The developed sensor shows a linear response to urea concentration in the range 10 nM−1 M in the form of the absorption spectrum at a wavelength of ~250 nm with specific selectivity. Under the proper conditions (storage at temperature 4°C after each measurement), it shows 40-day stability without any decrement in the intensity of the absorption spectrum. Thus, the developed sensor is highly sensitive, stable, and specific, with a lower detection limit of a urea concentration of 10 nM.
Introduction
Biosensors are utilized in multidimensional fields, including medicine, home diagnosis (Mehrotra, 2016), agriculture (Velasco-Garcia and Mottram, 2003), the military (Rossi et al., 2000), environmental monitoring (Rodriguez-Mozaz et al., 2005), food preservation, fishery industries (Terry et al., 2005) etc. A biosensor is an analytical device that has extraordinary characteristics such being compact, cost-effective, ultra-sensitive, and specific and having shorter response and recovery times along with very low analyte concentration detection limits (Luong et al., 1997). Generally, a biosensor comprises three main components, viz. a bioreceptor (enzyme, nucleic acid, cells, etc.), a physicochemical transducer (electrochemical, optical, piezoelectric, thermometric, ion-sensitive, magnetic, or acoustic, etc.), and an immobilization matrix. Each component contributes to improving the reliability of the biosensor in practical applications (Turner et al., 1987; Monošík et al., 2012). The worldwide scientific and academic community has invented various types of schemes and materials for fabricating biosensors (Banica, 2012). In a sense, biosensors can be classified according to the bioreceptor and transducers used for their fabrication. As regards the selection of a physicochemical transducer, optical fiber has received incredible consideration for chemical and biosensing applications. This is because of its distinct features viz. its miniature size, low response time, immunity to electricity, robustness in use, high sensitivity, low weight, requirement of a small sample amount, remote controllability, and facility to use in various geometries etc. (Monk and Walt, 2004; Fan et al., 2008; Martins et al., 2013). In optical fiber biosensors, the evanescent wave absorption (EWA) scheme has become popular, promising, and much used due to the enhanced sensitivity, high resolution, and low detection limit it provides (Zawawi et al., 2013; Zhong et al., 2016). Principally, an evanescent wave (EW) field is generated in optical fiber due to light decaying exponentially into a small portion of the cladding, and this is utilized for the fabrication of cladding-modified intrinsic optical fiber sensors (Sai et al., 2010; Bharadwaj et al., 2011). When applying this scheme, several critical factors arise, such as the proper incidence angle, the adjustable geometry of optical fiber (bending, tapering, etc.), and the thickness of the immobilization matrix. However, enhanced sensor credibility and performance can be achieved by the proper optimization of these factors (Iadicicco et al., 2011).
Technically, in an optical fiber biosensor, the immobilization matrix plays a considerable role, as it decides the performance as well as the efficiency of the biosensor. In biosensors, the immobilization matrix is used to maintain the stable reactivity and safe residency of bioreceptor (Ramakrishna and Sai, 2016). In an optical fiber sensor, it is used as a modified cladding that responds to chemical and biochemical reactions occurring on its surface. Thus, diverse materials with attractive properties have been synthesized and used as an immobilization matrix. For biosensor applications, intrinsic conducting polymers (ICPs) are emerging as a new class and are used as an immobilization matrix. Due to their extraordinary morphological, structural, optical, mechanical, and electrical properties, they are considered the most promising candidate for the immobilization of bioreceptor species. In the field of biosensors, two types of ICPs are considered to be especially promising: polyaniline (PANI) and polypyrrole (PPy). Polyaniline has many desirable features and properties, such as intriguing physical properties, ease of synthesis, low cost, extraordinary electrical, and optical properties, a sufficiently large surface area (morphology), adjustable transport properties, and environmental stability (Kim et al., 2010). As well as being synthesizable via a variety of methods, its sufficient solubility in innumerable solvents and capability to fabricate versatile composites/nanocomposites due to its functionality-rich chemical skeleton can be efficiently exploited for biosensor applications. With the incorporation of metal oxide nanoparticles, the properties of pure PANI change drastically, which is useful for sensing applications and improving sensitivity, selectivity, and stability (Tahir et al., 2005; Prakash et al., 2013). Owing to their good structural and optical properties and biocompatibility, PANI-metal nanoparticle composites have proven to be promising candidates for bioreceptor immobilization (Dhawan et al., 2009).
Urea (NH2CONH2) is a chemical species found everywhere in nature. Urea is present in the human body due to protein metabolism (Singh et al., 2008). A concentration of urea above the optimal level generates various dangerous diseases, included kidney and liver malfunction, chronic or acute renal failure, urinary tract obstruction, dehydration, shock, burns, and gastrointestinal bleeding, whereas, below a certain level, it produces hepatic failure, nephritic syndrome, and cachexia (Mostafaei and Ashkan, 2012; Mostafaei and Nasirpouri, 2014). However, urea is also found in agriculture, dairy industries, and fishery industries and performs various roles. Thus, the selective and rapid determination of urea concentration is a vital need for the abovementioned fields. Worldwide, different groups are working on the development of biosensors for detection of urea. In earlier years, various research groups have devoted their efforts to fabricating a urea biosensor using different techniques and different matrices for enzyme immobilization. Ahmad et al. reported a ZnO nanorod-based urea sensor using an electrochemical technique. The fabricated sensor shows high sensitivity toward urea in the linear range 0.001–24.0 mM, with a 10-μM lower detection limit (Ahmad et al., 2014). By modifying the ZnO structure, i.e., creating nanosheets, the same research group developed a potentiometric urea sensor and detected urea concentration with the linear range 0.05–2.0 mM with a lower detection limit of 0.019 μM and with a very short response time of ~5 S (Ahmad et al., 2015). Babu et al. prepared a freestanding and binder-free electrospun PVdF-HFP/Ni-Co nanofiber-based urea biosensor. The developed sensor showed a rapid response time (5 S), a lower detection limit of 12 μM, and a wide linear range of 20 μM−2 mM for urea concentration detection (Babu et al., 2017). A Ali et al. reported on a potentiometric urea biosensor based on urease immobilization onto chitosan/cobalt oxide (CS/Co3O4) nanocomposite for the detection of urea within the range 1*10−4-8*10−2 M with a 12-s response time (Ali et al., 2015). In a previous study, we reported on a urea sensor using pure polyaniline for cladding modification but did not achieve the desired results in terms of linearity, stability, detection limit, etc. (Botewad et al., 2018). Thus, improvement in the abovementioned characteristics of the PANI-ZnO nanocomposite sensor is required, and cladding modification and enzyme immobilization have been selected as the means to do so.
Herein, we present the EWA optical fiber intrinsic biosensor for the selective sensing and quantification of urea. The biosensor is fabricated by cladding modification with PANI-ZnO nanocomposite as an immobilization matrix. The sophisticated straight geometry of the optical fiber transducer and the experimental setup have been adapted for the development of the sensor. Using the PANI-ZnO cladding-modified matrix provides superior sensing parameter values for the developed biosensor for selective detection of urea.
Experimental
Materials
In the present investigation, all provided chemicals were of analytical reagent (AR) grade and used as received without any further purification. Aniline (monomer), ferric chloride (oxidant), zinc chloride, and sodium hydroxide were purchased from Fisher Scientific, India, and used to synthesize PANI-ZnO nanocomposite. The bio-receptor enzyme-urease (Urs) was procured from Sisco Research Laboratories (SRL), India. The analyte urea, cross-linking agent glutarldehyde solution (25%), interference species glucose, thiourea, ascorbic acid, L- alanine, L-arginine were purchased from SD Fine Chemicals, India. For the formation of buffer solution (Phosphate buffer pH 7.4), potassium dihydrogen orthophosphate and sodium hydroxide were purchased from SD Fine Chemicals, India. Hydrofluoric acid and acetone for the cladding removal process and cleaning were procured from Fisher Scientific, India. All of the synthesis processes were carried out in double-distilled water. In a typical sensing procedure, the stock solutions of Urs in the proportion 1 mg/ml and urea were prepared in 0.1 M phosphate buffer of pH 7.4.
Synthesis of PANI-ZnO Nanocomposite Matrix
ZnO nanoparticles ~26 nm in size were synthesized by a co-precipitation method using zinc chloride (oxidant) and sodium hydroxide (1:2 ratio) as source material. PANI-ZnO nanocomposite was synthesized with an in-situ chemical oxidation polymerization method. Initially, 0.02 M aniline was dissolved in 100 ml double-distilled water and stirred until the solution became transparent. The as-synthesized ZnO nanoparticles (0.2 M) were poured into the aniline solution, followed by constant stirring for 30 min. Further, 1 M HCl was added into the mixture of aniline-ZnO for homogeneity. An already-prepared 100 ml of stock solution of FeCl3 (0.05 M) was added dropwise into the aniline-ZnO mixture with constant stirring for 1 hour. The precipitate was further centrifuged and washed several times with distilled water before characterization.
Development of Sensing Element
Half a meter of multimode plastic-clad silica (PCS) optical fiber with a specified core/cladding diameters of 450/300 μm (750 μm in total) and attenuation of 3 dB/km was selected for preparation of the sensing element. In the middle, a ~2-cm portion of the cladding was removed carefully with a surgical blade. The unclad core was cleaned with hydrofluoric (HF) acid, acetone, and distilled water, respectively. Both ends of the optical fiber were polished with silicon carbide and very fine polish papers optimize the numerical aperture and acceptance angle. SMA905 connectors were then connected to both ends of the optical fiber. In the process of cladding modification, in-situ deposition on the unclad portion of the optical fiber was achieved by submerging it in the PANI-ZnO reaction container for 15 min at room temperature. Coating by this technique allows control of the thickness of the modified cladding on the core via the treatment time. Further, the enzyme-Urs was immobilized over the hydrophobic modified PANI-ZnO matrix through a cross-linking technique via 1% glutarldehyde and provided physical and chemical stability of the bio-receptor material. After that, loosely bound Urs molecules were leached out under gentle washing with phosphate buffer, followed by half an hour of drying. An adequate concentration of Enzyme-Urs was chosen to provide higher enzyme loading with excellent optical response and high retention.
Characterization
The as-synthesized ZnO nanoparticles, PANI matrix, and PANI-ZnO nanocomposites were characterized by different techniques. The structures of all synthesized materials were characterized by X-ray diffraction (XRD) and recorded on a Bruker AXS (D8 Advance, Germany) diffractometer in the scanning range 20–800 (2θ) using Cu Kα radiation with a wavelength of 1.5405 Å. Absorption spectrum studies of the materials were performed using a UV-Vis portable spectrometer (BLACK-Comet-SR, SL5-DH, Stellar Net, USA) with unpolarized light from temperature-controlled and intensity-stabilized deuterium and halogen lamps (UV-vis light source). The FTIR spectrum was recorded using an IR double beam spectrophotometer (8400S, Shimadzu, Japan) for the confirmation of functional groups in the prepared materials. The morphology of the prepared materials was studied by scanning electron microscopy (SEM) with a JEOL JSM-6360 (USA). The sensor parameters of the developed biosensor were analyzed by acquiring the absorbance spectrum by UV-Vis spectrophotometer, using an indigenously prepared sensing element connected between deuterium halogen lamps (UV-Vis light source) and the spectrophotometer. The sensing experiment was carried out in a completely dark environment to avoid interference from external light. Throughout the experiment, buffer solution (pH 7.4) was used. The sensing experimental setup shown in Figure 1. For the sensing parameters study, a 10 nM−1 M range of urea concentration in buffer solution was selected, with a 2-min exposure time for each concentration.
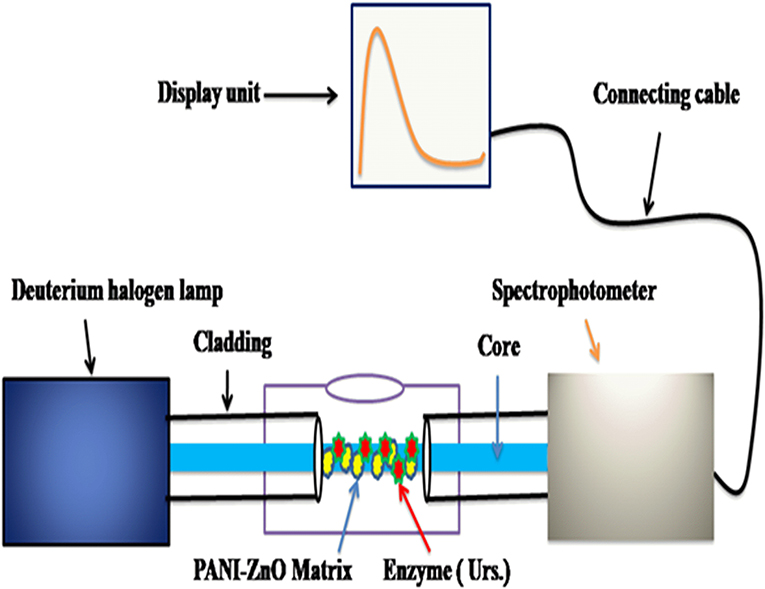
Figure 1. Experimental set-up.
Results and Discussion
Structural (XRD) and Morphological (SEM) Analysis
The structures of the incorporated ZnO nanoparticles, PANI, and PANI-ZnO nanocomposites were explored by XRD characterization, and the results are shown in Figure 2. The XRD pattern of the ZnO nanoparticles reveals that it is polycrystalline in nature. Their XRD pattern includes the (100), (002), (101), (102), (110), (103), (200), (112), and (201) diffraction peaks. All the observed diffraction peaks are in good agreement with ICDD pdf card No. 01-071-6424, which is for a hexagonal ZnO structure. The lattice constants of the prepared ZnO nanoparticles are found to be a = 3.249 Å, b = 3.249 Å, and c = 5.205 Å. The average crystallite size was determined by the standard Scherrer's formula and was found to be 26.06 nm. Figure 2 shows the XRD pattern of PANI, which confirms its amorphous nature because of the absence of the characteristic peaks of the used oxidant (Kavitha et al., 2012). The XRD pattern of the ZnO-incorporating PANI matrix, also shown in Figure 2, provides confirmation to the formation of conducting organic–inorganic nanocomposites. The amorphous nature of PANI is affected by the incorporation of ZnO, and some characteristic peaks are observed because of the formation of hydrogen bonds between the H–N of PANI and the oxygen of ZnO. Thus, some of the peak shifts from the blue line of the PANI-ZnO matrix to the red and black lines may arise due to the interaction of ZnO nanoparticles (Deshpande et al., 2009). The repetition of benzenoid and quinoid rings in PANI chains and the low crystallinity of the PANI-ZnO nanocomposite shows that it is in a semiconducting state (Ali et al., 2015). Scherer's equation gives the crystalline size, D, of the PANI-ZnO nanocomposite as 33 nm.
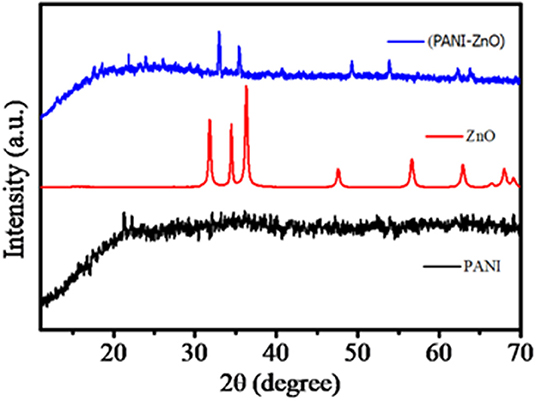
Figure 2. XRD pattern of PANI, ZnO, and PANI-ZnO film.
Figure 3 shows SEM photographs of the PANI (Figure 3A) and PANI-ZnO (Figure 3B) films and reveals their morphological features. The amorphous nature and high agglomeration of pure PANI is clear in Figure 3A. The PANI-ZnO nanocomposite shows a cauliflower-like structure, comprising small globular particles, which is suitable for the immobilization of biomolecules. Figure 3B also shows that the PANI-ZnO nanocomposite has a porous morphology and is very efficient for enzyme-Urs immobilization. Figure 3C shows an SEM image of the cladding-modified region, confirming its uniform thickness on the nude core.
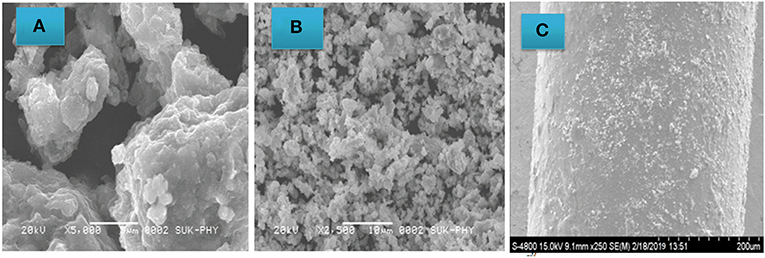
Figure 3. Surface morphology of (A) PANI and (B) PANI-ZnO (C) Cladding modified sensing element.
Spectroscopic Analysis
Optical Study (UV-Vis)
Optical spectroscopy provides information about the conducting states of PANI, i.e., the leucoemeraldine, pernigraniline, and emeraldine states. These states of PANI emerge from variation in the ratio of oxidant and monomer, the synthesis technique used, and the duration of the synthesis process. In biosensors, the emeraldine state of PANI is used due to this semiconducting state having better morphology (Kavitha et al., 2012).
In the present investigation, UV–visible absorption spectra of the as-synthesized PANI and PANI-ZnO nanocomposite were recorded and analyzed in the range 210–500 nm; these are shown in Figure 4. The absorption spectrum clearly reveals two characteristic absorption peaks at 233 and 287 nm for both PANI and PANI-ZnO nanocomposite. The observed peaks confirm that the emeraldine state of PANI is not modifies due to incorporation of ZnO within it. The observed peak at 233 may occur due to the presence of an aniline moiety (Babu et al., 2017), and the peak at 280 corresponds to the π-π* transition of the benzenoid ring in polyaniline (Patil et al., 2015).
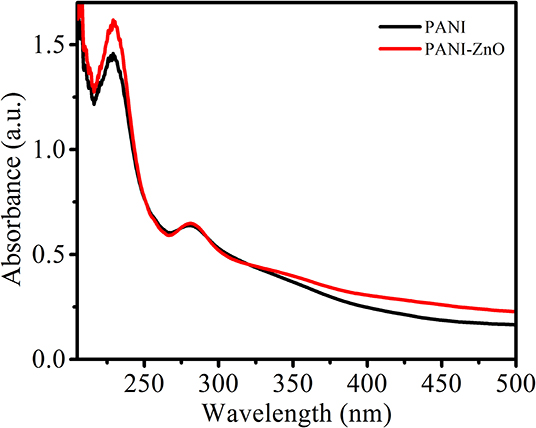
Figure 4. UV-Vis Spectrum of PANI and PANI-ZnO.
Fourier Transform-Infrared (FTIR)
Pure PANI and PANI-ZnO nanocomposite were studied by FTIR spectroscopy, and the spectra are shown in Figure 5. All of the characteristic peaks of concern for the PANI and PANI-ZnO nanocomposite are exhibited. The FTIR spectra of PANI and PANI-ZnO nanocomposite show peaks within the range 643–761.21 cm−1 that are due to C–C bonding and aromatic C-H out-of-plane bending vibration. The peaks appearing at 1254.88 and 1269.65 cm−1 may be attributed to the C-N stretching of the secondary aromatic amine. The peaks at 1,364 and 1,287 cm−1 are assigned to asymmetric and symmetric stretching vibrations of the C=C ring. The peaks at 1358.65 and 1365.28 cm−1 correspond to C–N stretching and C–H bending in PANI and PANI-ZnO, respectively. The peaks at 1,412 and 1,462 cm−1 are attributed to C–H mixed vibrations and C–C stretch in the benzenoid ring, respectively. Because of the C=C stretching of the quinoid and benzenoid rings, a band originates at 1519.91 in both PANI and PANI-ZnO. Strong peak at 1638.16 cm−1 is attributed due to the C=C stretching mode of the quinoid rings results of both PANI and its composite with ZnO in emeraldine salt form (Deshpande et al., 2009; Kavitha et al., 2012). Distinct absorption peaks in PANI seen at 3657.92, 3289.42, and 3098.17 cm−1 are assigned to O-H stretching, N-H bending, and cross-linking moieties (Ali et al., 2015). The peaks around 3,855 cm−1 correspond to N-H band stretching vibration, and a broad peak appears at 3,747 cm−1 that can be associated with the interaction between ZnO nanoparticles and PANI, with hydrogen bonding occurring between H–N and the oxygen of ZnO (Patil et al., 2015). All of the characteristics bands of PANI are also found in the PANI-ZnO nanocomposite; however, some peaks are merged and decreased in intensity due to the incorporation of ZnO nanoparticles. This study confirms that the ZnO nanoparticles are properly incorporated into the PANI matrix.
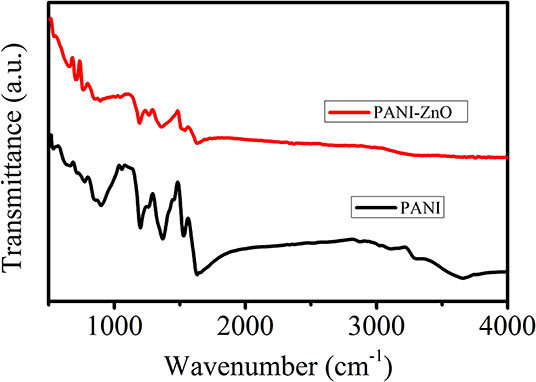
Figure 5. FTIR Spectrum of PANI and PANI-ZnO.
Sensor Performance
The sensing parameters of the developed sensor viz. sensitivity, selectivity, stability, response time, and reusability were analyzed by studying the absorption spectrum in the evanescent wave field. The absorption spectrum of the developed sensor was studied in the wavelength range 246–256 nm.
Sensitivity
A urea concentration range from 10 nM to 1 M was used for the sensitivity study, and a 15-min incubation time was apportioned for each sample. Using the portable UV-Vis spectrophotometer, the absorption spectrum was obtained by connecting the sensing element between the light source and the spectrophotometer. The sensing response of the prepared sensor is depicted in Figure 6 in the form of the absorption spectrum. The result obtained of sensitivity does not follow a linear function; instead, it follows an Exponential 3P2 function, as shown in Figure 7, with an Adj. R. Square value of 0.99369. To study the repeatability, the same conditions of the sensing element were maintained, such as the length of cladding removed, the deposition time of new cladding, the quantity of enzyme over the cladding-modified region, and the light source. Five sensors were developed, and each developed sensor showed approximately the same response toward urea.
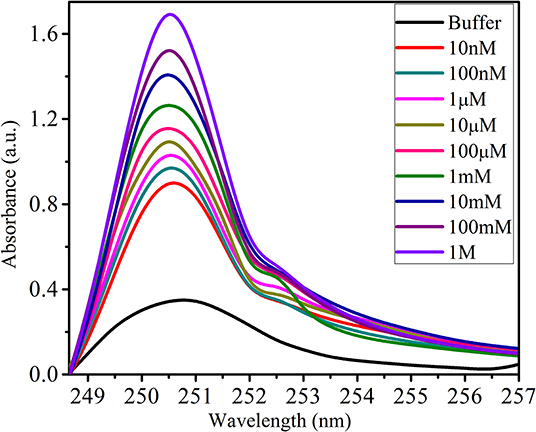
Figure 6. Sensing response of developed biosensor.
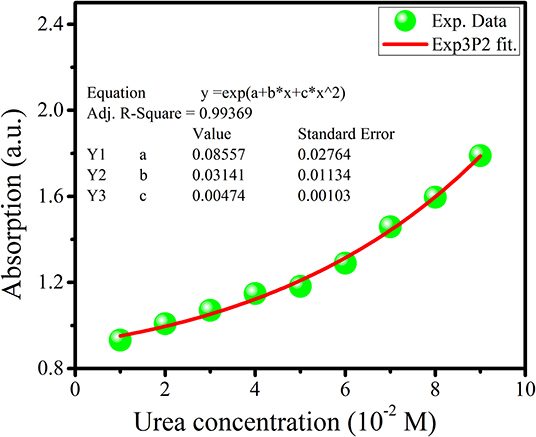
Figure 7. Experimental data fitting.
The sensing mechanism of the developed sensor is discussed here briefly. Generally, for sensing the urea species, enzyme-Urs was used as a bioreceptor, which hydrolyzed the urea effectively with an approximate rate 1,014 times that of the non-catalyzed reaction (Kavitha et al., 2012). When the sensing element is exposed to a concentration of urea, the enzymatic reaction between urea and Urs occurs in two stages. Firstly, Urs react with urea to produce ammonia and carbamate, while in the second stage, the carbamate hydrolyzes to ammonia and carbonic acid in the following reaction (Kavitha et al., 2012).
This reaction is very beneficial for changing the microenvironment around the core, and it alters the optical properties of the modified cladding. The reaction rate and ammonia evolution from the reaction changes with change in the concentration of urea. Because of this, the refractive index of the modified cladding changes and causes this change in the intensity of the absorption spectrum. Moreover, the structural properties of the modified cladding may also change due to the effect of the reaction on the benzoid and quinoid segments of PANI-ZnO (in this study). The absorption peak at ~250 nm seen in the sensitivity study may originate due to the immobilization of enzyme-Urs over the matrix and interaction with analyte urea. Thus, due to the alteration of the optical and structural properties of the modified cladding, the sensing response changes for each concentration of urea.
Selectivity Study
The specific selectivity toward urea for the developed sensor was studied by comparing its response to common interfering species generally found in living species. L-argenine, L- alanine, glucose, ascorbic acid, thiourea, and a combination of all of these species were used as interference species. A 100-mM solution of each interference species was prepared in buffer solution and used for the study of selectivity. Figure 8 shows the response to the selected interfering species compared with that to urea. The absorption spectra for these species did not show any considerable response compared to that to urea, though slight variation occurred due to the refractive index of the surrounding solution. Thus, the prepared sensor is highly selective toward urea compared with the selected interference species.
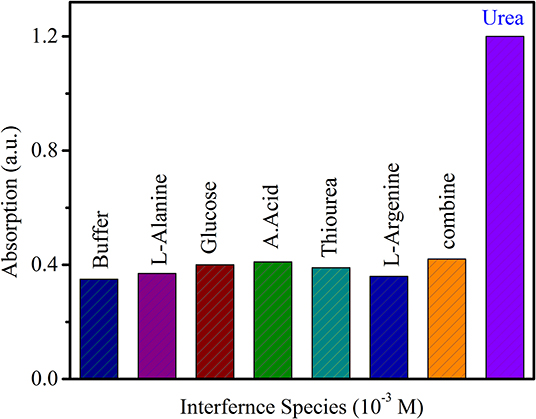
Figure 8. Selectivity of developed biosensor.
Stability
The practical applicability of a sensor depends on its high sensitivity along with specific selectivity, repeatability, and stability. The stability study of the developed sensor was carried out for 52 days until there was negligible response. A 100-mM urea concentration in buffer solution was made freshly for each measurement. The stability graph is shown in Figure 9.
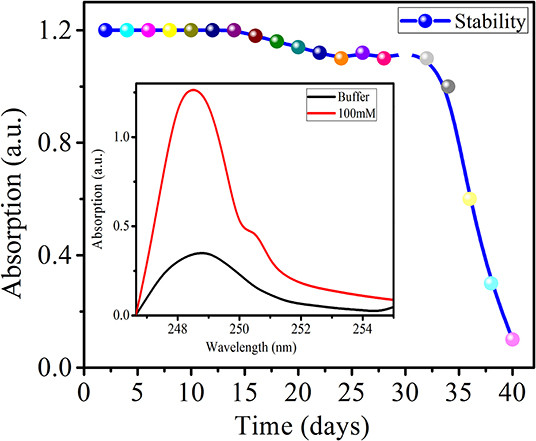
Figure 9. Stability of developed biosensor.
The precaution was taken of storing it at a temperature of 40°C after each day of measurement. The sensor demonstrated a stable response for 40 days and decreased slowly after that up to 52 days. The decreased response of the prepared sensor toward urea may be due to loss of the reactivity of the enzyme. The 40-day stability of the prepared sensor makes it very useful for practical applications.
Response Time and Detection Limit
Rapid response is an important feature of a sensor, and in the present study, response time was determined by considering the saturated intensity of the absorption spectrum. The developed sensor achieved a maximum saturated absorption intensity at ~45–50 s, and this was considered as the response time of the sensor. The developed sensor showed a considerable response to a 10 nM urea concentration compared to buffer solution. Thus, for the developed sensor, we consider the response time to be ~45–50 s and the lower limit of detection to be 10 nM.
Some earlier studies are compared with the present study in Table 1.
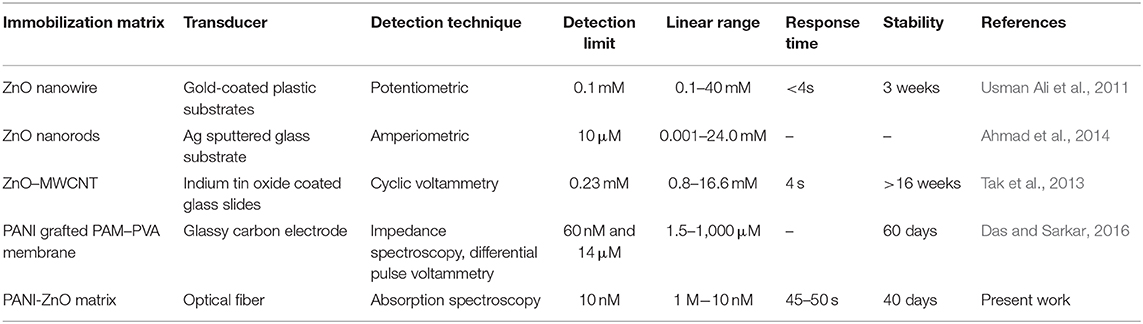
Table 1. Comparison of other earlier urea sensors with that of the current study.
Conclusion
In the present report, we have successfully developed a cladding-modified intrinsic optical fiber urea sensor using PANI-ZnO as a modified cladding matrix. The properties of the PANI-ZnO matrix were explored by various characterization techniques, viz. XRD, UV-Vis, FTIR, and SEM. The developed sensor does not show a linear response but rather an exponential response toward urea concentration in the range 10 nM−1 M, with specific selectivity. The developed sensor exhibits a 10-nM lowest detection limit and a ~45–50 s response time. The stable lifetime of the sensor was found to be 40 days when stored at 4°C after each measurement. According to the study of the sensor response, the PANI-ZnO matrix is a suitable and ideal candidate for cladding modification in an optical sensor as well as for enzyme immobilization. Lastly, we concluded that the developed sensor is efficient and useful for practical application in biomedical industries for the detection of urea due to its features of high sensitivity, specific selectivity, stability, and low detection limit.
Data Availability Statement
All datasets generated for this study are included in the article/supplementary material.
Author Contributions
SB and VP performed experimental work and drafted the manuscript. DG and GB helped in the experiment, manuscript writing, and elucidate characterization of XRD, UV-Vis. FTIR etc. GM, MS, and PP guided for experimental work and reviewed manuscript. All authors contributed to the article and approved the submitted version.
Conflict of Interest
The authors declare that the research was conducted in the absence of any commercial or financial relationships that could be construed as a potential conflict of interest.
References
Ahmad, R., Tripathy, N., and Hahn, Y.-B. (2014). Highly stable urea sensor based on ZnO nanorods directly grown on Ag/glass electrodes. Sensors Actuators B Chem. 194, 290–295. doi: 10.1016/j.snb.2013.12.098
Ahmad, R., Tripathy, N., Jang, N. K., Khang, G., and Hahn, Y. B. (2015). Fabrication of highly sensitive uric acid biosensor based on directly grown ZnO nanosheets on electrode surface. Sensors Actuators B Chem. 206, 146–151. doi: 10.1016/j.snb.2014.09.026
Ali, A., Israr-Qadir, M., Wazir, Z., Tufail, M., Ibupoto, Z. H., Jamil-Rana, S. A., et al. (2015). Cobalt oxide magnetic nanoparticles–chitosan nanocomposite based electrochemical urea biosensor. Indian J. Phys. 89, 331–336. doi: 10.1007/s12648-014-0594-3
Babu, K. J., Senthil kumar, N., and Kim, A. R. (2017). Freestanding and binder free PVdF-HFP/Ni-Co nanofiber membrane as a versatile platform for the electrocatalytic oxidation and non-enzymatic detection of urea. Sensors Actuators B Chem. 241, 541–551. doi: 10.1016/j.snb.2016.10.069
Banica, F. G. (2012). Chemical Sensors and Biosensors: Fundamentals and Applications. Chichester: John Wiley & Sons.
Bharadwaj, R., Sai, V. V. R., Thakare, K., Dhawangale, A., Kundu, T., Titus, S., et al. (2011). Evanescent wave absorbance based fiber optic biosensor for label-free detection of E. coli at 280 nm wavelength. Biosens. Bioelectron. 26, 3367–3370. doi: 10.1016/j.bios.2010.12.014
Botewad, S. N., Pahurkar, V. G., and Muley, G. G. (2018). Fabrication and evaluation of evanescent wave absorption based polyaniline-cladding modified fiber optic urea biosensor. Optical Fiber Technol. 40, 8–12. doi: 10.1016/j.yofte.2017.11.002
Das, J., and Sarkar, P. (2016). Enzymatic electrochemical biosensor for urea with a polyaniline grafted conducting hydrogel composite modified electrode. RSC Adv. 6:92520. doi: 10.1039/C6RA12159D
Deshpande, N. G., Gudage, Y. G., Sharma, R., Vyas, J. C., Kim, J. B., and Lee, Y. P. (2009). Studies on tin oxide-intercalated polyaniline nanocomposite for ammonia gas sensing applications. Sensors Actuators B Chem. 138, 76–84. doi: 10.1016/j.snb.2009.02.012
Dhawan, G., Sumana, G., and Malhotra, B. D. (2009). Recent developments in urea biosensors. Biochem. Eng. J. 44, 42–52. doi: 10.1016/j.bej.2008.07.004
Fan, X., White, I. M., Shopova, S. I., Zhu, H., Suter, J. D., and Sun, Y. (2008). Sensitive optical biosensors for unlabeled targets. A review. Anal. Chim. Acta 620, 8–26. doi: 10.1016/j.aca.2008.05.022
Iadicicco, A., Paladino, D., Campopiano, S., Bock, W. J., Cutolo, A., and Cusano, A. (2011). Evanescent wave sensor based on permanently bent single mode optical fiber. Sensors Actuators B Chem. 155, 903–908. doi: 10.1016/j.snb.2011.01.021
Kavitha, B., Prabakar, K., Siva, K., Srinivasu, D., Srinivas, C., Aswal, V. K., et al. (2012). Spectroscopic studies of nano size crystalline conducting polyaniline. IOSR J. Appl. Chem. 2,16–19. doi: 10.9790/5736-0211619
Kim, H. J., Park, S. H., and Park, H. J. (2010). Synthesis of a new electrically conducting nanosized Ag–polyaniline–silica complex using γ-radiolysis and its biosensing application. Radiat. Phys. Chem. 79, 894–899. doi: 10.1016/j.radphyschem.2010.02.005
Luong, J. H., Bouvrette, P., and Male, K. B. (1997). Developments and applications of biosensors in food analysis. Trends Biotechnol. 15, 369–377. doi: 10.1016/S0167-7799(97)01071-8
Martins, T. D., Ribeiro, A. C. C., de Camargo, H. S., da Costa Filho, P. A., Cavalcante, H. P. M., and Dias, D. L. (2013). “New insights on optical biosensors: techniques, construction and application,” in State of the Art in Biosensors—General Aspects, ed T. Rinken (Rijeka: InTech), 112–139.
Mehrotra, P. (2016). Biosensors and their applications–a review. J. Oral Biol. Craniofacial Res. 6, 153–159. doi: 10.1016/j.jobcr.2015.12.002
Monk, D. J., and Walt, D. R. (2004). Optical fiber-based biosensors. Anal. Bioanal. Chem. 379, 931–945. doi: 10.1007/s00216-004-2650-x
Monošík, R., Stredanský, M., and Šturdík, E. (2012). Biosensors-classification, characterization and new trends. ActaChimicaSlovaca 5, 109–120. doi: 10.2478/v10188-012-0017-z
Mostafaei, A., and Ashkan, Z. (2012). Synthesis and characterization of conducting polyaniline nanocomposites containing ZnO nanorods. Progress Nat. Sci. Mater. Int. 22, 273–280. doi: 10.1016/j.pnsc.2012.07.002
Mostafaei, A., and Nasirpouri, F. (2014). Epoxy/polyaniline–ZnOnanorods hybrid nanocomposite coatings: synthesis, characterization and corrosion protection performance of conducting paints. Progress Organ. Coat. 77, 146–159. doi: 10.1016/j.porgcoat.2013.08.015
Patil, P. T., Anwane, R. S., and Kondawar, S. B. (2015). Development of electrospun polyaniline/ZnO composite nanofibers for LPG sensing. Procedia Mater. Sci. 10, 195–204. doi: 10.1016/j.mspro.2015.06.041
Prakash, S., Chakrabarty, T., Singh, A. K., and Shahi, V. K. (2013). Polymer thin films embedded with metal nanoparticles for electrochemical biosensors applications. Biosens. Bioelectron. 41, 43–53. doi: 10.1016/j.bios.2012.09.031
Ramakrishna, B., and Sai, V. V. R. (2016). Evanescent wave absorbance based U-bent fiber probe for immunobiosensor with gold nanoparticle labels. Sensors Actuators B Chem. 226, 184–190. doi: 10.1016/j.snb.2015.11.107
Rodriguez-Mozaz, S., de Alda, M. J. L., Marco, M. P., and Barceló, D. (2005). Biosensors for environmental monitoring: a global perspective. Talanta 65, 291–297. doi: 10.1016/S0039-9140(04)00381-9
Rossi, J. III., Ritchie, G. D., Nordholm, A. F., Knechtges, P. L., Wilson, C. L., Lin, J., et al. (2000). Application of neurobehavioral toxicology methods to the military deployment toxicology assessment program. Drug Chem. Toxicol. 23, 113–138. doi: 10.1081/DCT-100100106
Sai, V. V. R., Kundu, T., Deshmukh, C., Titus, S., Kumar, P., and Mukherji, S. (2010). Label-free fiber optic biosensor based on evanescent wave absorbance at 280 nm. Sensors Actuators B Chem. 143, 724–730. doi: 10.1016/j.snb.2009.10.021
Singh, M., Verma, N., Garg, A. K., and Redhu, N. (2008). Urea biosensors. Sensors Actuators B Chem. 134, 345–351. doi: 10.1016/j.snb.2008.04.025
Tahir, Z. M., Alocilja, E. C., and Grooms, D. L. (2005). Polyaniline synthesis and its biosensor application. Biosens. Bioelectron. 20, 1690–1695. doi: 10.1016/j.bios.2004.08.008
Tak, M., Gupta, V., and Tomar, M. (2013). Zinc oxide–multiwalled carbon nanotubes hybrid nanocomposite based urea biosensor. J. Mater. Chem. B 1:6392. doi: 10.1039/c3tb20935k
Terry, L. A., White, S. F., and Tigwell, L. J. (2005). The application of biosensors to fresh produce and the wider food industry. J. Agric. Food Chem. 53, 1309–1316. doi: 10.1021/jf040319t
Turner, A., Karube, I., and Wilson, G. S. (1987). Biosensors: Fundamentals and Applications. Oxford: Oxford University Press.
Usman Ali, S. M., Ibupoto, Z. H., Salman, S., Nur, O., Willander, M., and Danielsson, B. (2011). Selective determination of urea using urease immobilized on ZnO nanowires. Sensors Actuators B 160, 637–643. doi: 10.1016/j.snb.2011.08.041
Velasco-Garcia, M. N., and Mottram, T. (2003). Biosensor technology addressing agricultural problems. Biosyst. Eng. 84, 1–12. doi: 10.1016/S1537-5110(02)00236-2
Zawawi, M. A., O'Keffe, S., and Lewis, E. (2013). Intensity-modulated fiber optic sensor for health monitoring applications: a comparative review. Sensor Rev. 33, 57–67. doi: 10.1108/02602281311294351
Keywords: optical fiber, urea, PANI-ZnO, evanescent wave absorption, cladding modification
Citation: Botewad SN, Pahurkar VG, Muley GG, Gaikwad DK, Bodkhe GA, Shirsat MD and Pawar PP (2020) PANI-ZnO Cladding-Modified Optical Fiber Biosensor for Urea Sensing Based on Evanescent Wave Absorption. Front. Mater. 7:184. doi: 10.3389/fmats.2020.00184
Received: 23 December 2019; Accepted: 19 May 2020;
Published: 26 June 2020.
Edited by:
Jaehwan Kim, Inha University, South KoreaReviewed by:
Zhen Shou Jiang, Shandong Normal University, ChinaJie Zhang, Chongqing University, China
Nianbing Zhong, Chongqing University of Technology, China
Copyright © 2020 Botewad, Pahurkar, Muley, Gaikwad, Bodkhe, Shirsat and Pawar. This is an open-access article distributed under the terms of the Creative Commons Attribution License (CC BY). The use, distribution or reproduction in other forums is permitted, provided the original author(s) and the copyright owner(s) are credited and that the original publication in this journal is cited, in accordance with accepted academic practice. No use, distribution or reproduction is permitted which does not comply with these terms.
*Correspondence: D. K. Gaikwad, dhammajyotg26@gmail.com