Analysis of the Surface Dispersion in the Mediterranean Sub-Basins
 Maher Bouzaiene
 Milena Menna
 Pierre-Marie Poulain
 Antonio Bussani
 Dalila Elhmaidi
- 1Thermal Radiation Laboratory, Faculty of Sciences of Tunis, University of Tunis El Manar, Tunis, Tunisia
- 2Division of Oceanography, National Institute of Oceanography and Experimental Geophysics, Sgonico, Italy
Surface dispersion properties give an immediate characterization of the spreading of passive and active tracers in the ocean, like pollutant and marine species. The Mediterranean sub-basins (Tyrrhenian, Adriatic, Ionian, Levantine and Aegean) are known as complex dynamic regions due to the presence of coherent structures on different motion scales. This paper focus on dispersion of the surface Mediterranean flow using the surface current data derived from two different drifter designs: the Coastal Ocean Dynamics Experiment (CODE) and the Surface Velocity Program (SVP) drifters. The absolute dispersion for small time scales (<2 days) shows similar anisotropic quasi-ballistic regimes in the five sub-basins. For intermediate time scales (2–15 days), the absolute dispersion shows the occurrence of an elliptic regime in all the Mediterranean sub-basins except in the Adriatic Sea, where the dominance of a hyperbolic regime is observed. The relative dispersion statistics show the presence of a non-local exponential regime in the Tyrrhenian sub-basin, with spatial scale smaller than the internal Rossby Radius of deformation DI. For spatial scales close to DI, two local relative dispersion regimes are found due to the influence of sub-basin scale structures: a Richardson regime in the Tyrrhenian and Aegean sub-basins and a shear/ballistic regime in other sub-basins. Furthermore, for large time scale (>15 days) and spatial scale larger than DI, our results emphasize a similarity in all the sub-basins with the presence of a quasi Random-walk regime and a quasi diffusive regime for the absolute and relative dispersion, respectively.
Introduction
The Mediterranean sub-basins (Tyrrhenian, Adriatic, Ionian, Levantine and Aegean, see Figure 1A for geographical references) are characterized by different dynamics and high variability of surface currents. The chaotic nature of each sub-basin lead to the generation of numerous submesoscale (∼1 km) and mesoscale (>10 km) structures (D’Ovidio et al., 2004, 2008). The Mediterranean coherent structures driven by wind and/or topography and located in a fixed geographical area are called gyres, whereas the structures driven by the instability of strong coastal currents that frequently changes their location and lifetime are named eddies (Poulain et al., 2012b).
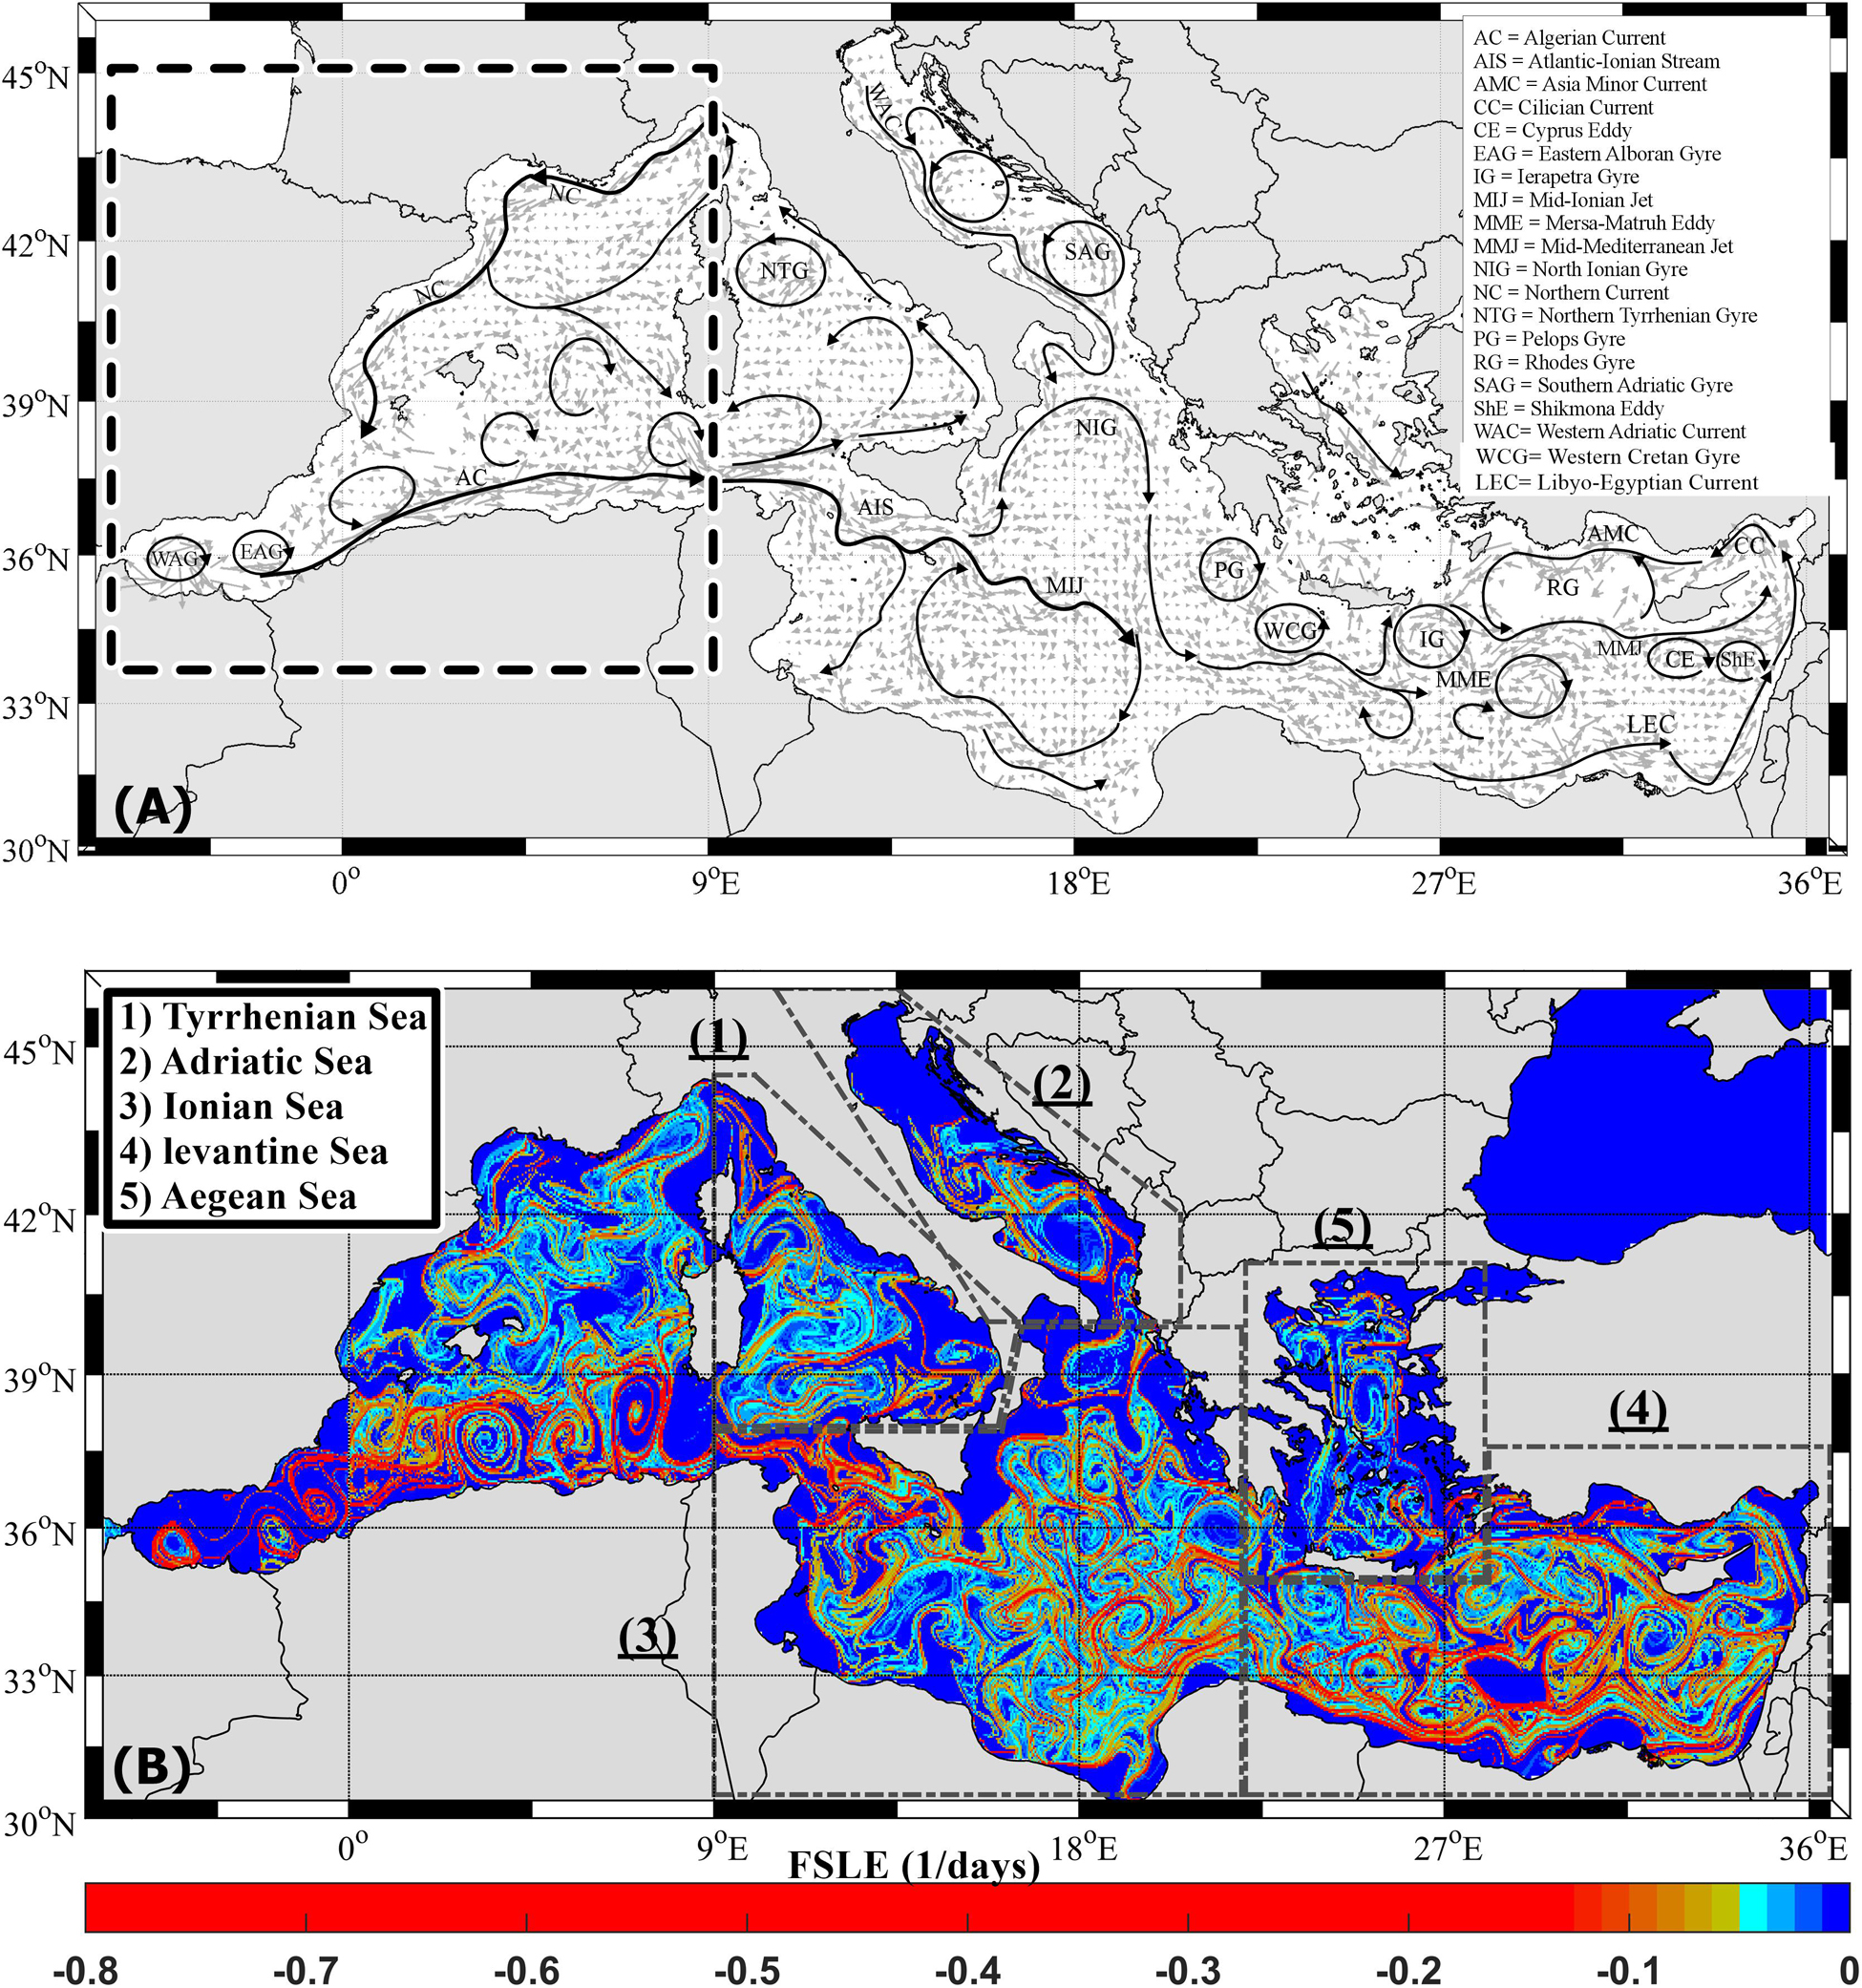
Figure 1. (A) The mean surface circulation and the major circulation features in the Mediterranean Sea in bin of 0.25 × 0.25° using the available historical drifter dataset adapted from Poulain et al. (2012b) and Menna et al. (2013). The black dashed rectangle shows the geographic limits of the WWM discussed in Bouzaiene et al. (2018). The major circulation features are listed in the inset. (B) Snapshots of the FSLE in the Mediterranean sub-basins: in July 2012 and 2018 for the WWM; in January 2019 for the Tyrrhenian, Ionian, and Levantine sub-basins; in January 2015 for the Adriatic and in January 2018 for the Aegean sub-basin. The polygons show the geographical locations of the Mediterranean sub-basins considered in this paper.
The westernmost part of the western Mediterranean (WWM, see the Figure 1A for geographical limits) is characterized by strong coastal currents and mesoscale and basin-scale eddies and gyres (Figure 1; Zambianchi et al., 2017; Bouzaiene et al., 2018; Aulicino et al., 2019). The surface mean basin-scale circulation of the WWM is cyclonic with the dominance of zonal and meridional motions in the Algerian and the Liguro–Provençal sub-basins, respectively (Poulain et al., 2012a; Renault et al., 2012). In the northern Tyrrhenian sub-basin the Mistral wind blowing into the Strait of Bonifacio creates the northern tyrrhenian gyre (NTG) with the presence of a strong coastal cyclonic current along the Italian coasts which is a branch of the algerian current (AC) that forming cyclonic mesoscale eddies (see for details, Poulain et al., 2013; Figure 1A). In the southern part of the Tyrrhenian Sea, a part of the AC enters in the Sicily Channel and formed the Atlantic Ionian Stream (AIS). The surface circulation of the Sicily Channel is characterized by numerous mesoscale permanent features (Menna et al., 2019a), well represented in Figure 1B. East of Malta Island, a first branch of the AC feeds into a basin wide anticyclonic circulation named Mid-Ionian Jet (MIJ), while a second branch approaches the Lybian coast in a anticyclonic circulation (Poulain et al., 2013) (see for details Figure 1A). This area is characterized by wind-driven currents, upwelling events off Sicily and inter annual variability of numerous mesoscale structures (Menna et al., 2019b). The mean circulation of the Ionian Sea is characterized by two anticyclonic sub-basin scale structures located in the northern and southern Ionian sub-basin. The Levantine basin-scale circulation is cyclonic with the presence of persistent surface currents; the Libyo-Egyptian Current (LEC), the Cilician Current (CC), the Asia Minor Current (AMC) and a central eastward current named Mid-Mediterranean Jet (MMJ). This region is dominated by eddies and gyres formed by the instability of along-slope and offshore currents or by the wind and can be controlled by bathymetry (Menna et al., 2012). Sub-basin and mesoscale eddies are mainly anticyclonic. The mean western Levantine eddies are referred as follow; the Pelops Gyre (PG), the Western Cretan Gyre (WCG) and the Ierapetra Gyre (IG). The mean eastern Levantine eddies are presented as follow; the Cyprus Eddy (CE), Shikmona Eddy (ShE) and the Mersa-Matruh Eddy (MME) (see Mauri et al., 2019). Between the Cyprus and east of Rhodes Islands a large cyclonic gyre named Rhodes Gyre (RG) dominates as a result of the interaction of the wind driven basin circulation with the MMJ and AMC (Menna et al., 2012; Figure 1A). The Adriatic and Aegean sub-basin circulations are characterized by basin wide cyclonic patterns (Poulain, 2001). In the Adriatic Sea, the instability of the currents generates three cyclonic recirculation cells with the presence of a cyclonic gyre named the Southern Adriatic Gyre (SAG) and a western coastal cyclonic current called the Western Adriatic Current (WAC) (Poulain et al., 2013; Figure 1A). In the Aegean sub-basin, low-salinity water enters through the Dardanelles straits from the Black Sea which is mixed with the Aegean waters and forms a semi-permanent large anticyclone in the eastern part of the sub-basin (Olson et al., 2007; Politikos et al., 2017). The southern Aegean sub-basin is characterized by anticyclonic mesoscale features which are variables in time and space (Theocharis et al., 1999). The Mediterranean submesoscale and mesoscale structures can be identified by the Finite Scale Lyapunov Exponent (FSLE). Using the spatial distribution of the FSLE, D’Ovidio et al. (2004) describe the mean currents and features of the surface Mediterranean. They showed that low dispersion rates are localized in the eddies core and a stretching of the fluid parcels are in their outer part. Nevertheless, the effect of the coherent structures and currents in turbulent dispersion regimes are still an open question in each Mediterranean sub-basin. In the last decades, it has become fundamental to understand how eddies or gyres can influence the dispersion. Furthermore, the deep coherent structures play an important role in the transport of ocean water mass and dispersion processes. In the Western Mediterranean Sea numerical simulations show a decrease of the intermediate dispersion range with depth, due to the weaker influence of the vortices (Elhmaidi et al., 2010; Nefzi et al., 2014), but there are no specific studies on the deep layers of the Mediterranean. The dispersion analysis allows us to define the complex physical phenomenon (e.g., chaotic advection, turbulence, and diffusion) for different scales of motion in specific regions (Dräger-Dietel et al., 2018). The absolute dispersion indicates the representative (squared) separation of particles with respect to their initial positions. Absolute dispersion is an appropriate measure of how far individual particles move away from their original positions, while absolute diffusion indicates how fast the tracers are dispersed (Sansón, 2015). In contrast to absolute dispersion, relative dispersion measures the separation of two particles or, equivalently, the spread of a cloud of passive tracers. We study here both absolute and relative dispersion to discuss the transport and the dispersion at small and large scales in the Mediterranean Sea. The Mediterranean coherent structures for each sub-basin can affect the local transport of passive and active tracers (pollutant, phytoplankton, fish eggs and larvae). Measuring pair separations provides an immediate characterization on the spreading of pollutant patches (e.g., oil) in the Mediterranean surface. In this study, we present a Lagrangian data analysis based on the computation of absolute and relative dispersion in the sub-basins of the Mediterranean Sea, using the available historical surface drifter data. This method offers an overview of the dispersion characteristics in the upper layer of the whole Mediterranean basin, allowing understanding how the main circulation features can affect the dispersion regimes. The method presented in this work could also be applied in the future to Lagrangian data collected in sub-surface and intermediate layers, e.g., using Argo float data. Dispersion and turbulent anomalous regimes that occur in different Mediterranean sub-basins are described and eventually connected with the local circulation characteristics.
Materials and Methods
Data
Drifters
Mediterranean surface drifters used in this work are in total 1977 instruments deployed during the period 1986–2019. Two types of drifter design are used in the Mediterranean dataset; the Coastal Ocean Dynamics Experiment (CODE) drifter developed to measure the currents in the first meter (Poulain, 1999; Poulain and Gerin, 2019), and the Surface Velocity Program (SVP) drifter (Sybrandy and Niiler, 1991; Lumpkin and Pazos, 2007) that measures the currents in the surface layer at 15 m depth. The drifters were equipped by the Global Positioning System (GPS) and transmit their data to the Argos Data Collection and Location System (DCLS) or via the Iridium satellite system. The drifter data were first edited from spike and outliers and interpolated using the kriging method at regular 2-h intervals (Hansen and Poulain, 1996). In order to remove higher frequency current components (tidal and inertial current) the drifter positions were filtered by a Hamming filter with a cut-off period at 36-h and finally were sub-sampled at 6-h intervals. Drifter velocities were estimated from finite differences and sub-sampled at 6-h intervals (Menna et al., 2012, 2017).
The two drifter designs have been merged to compute the absolute and relative dispersion statistics, adopting the method of Bouzaiene et al. (2018). The absolute dispersion is estimated from the pairs of individual drifter segments of 30 days length available in the Tyrrhenian, the Adriatic, the Ionian, the Levantine and the Aegean sub-basins (Figure 2). The range selected for the initial separation distance between the particles that forms a pair is of 0–50 km (Figure 2). This choice guarantees a consistent number of segments for the calculation and thus ensures a high statistical robustness. The geographical limits of each sub-basin are depicted in Figure 1B.
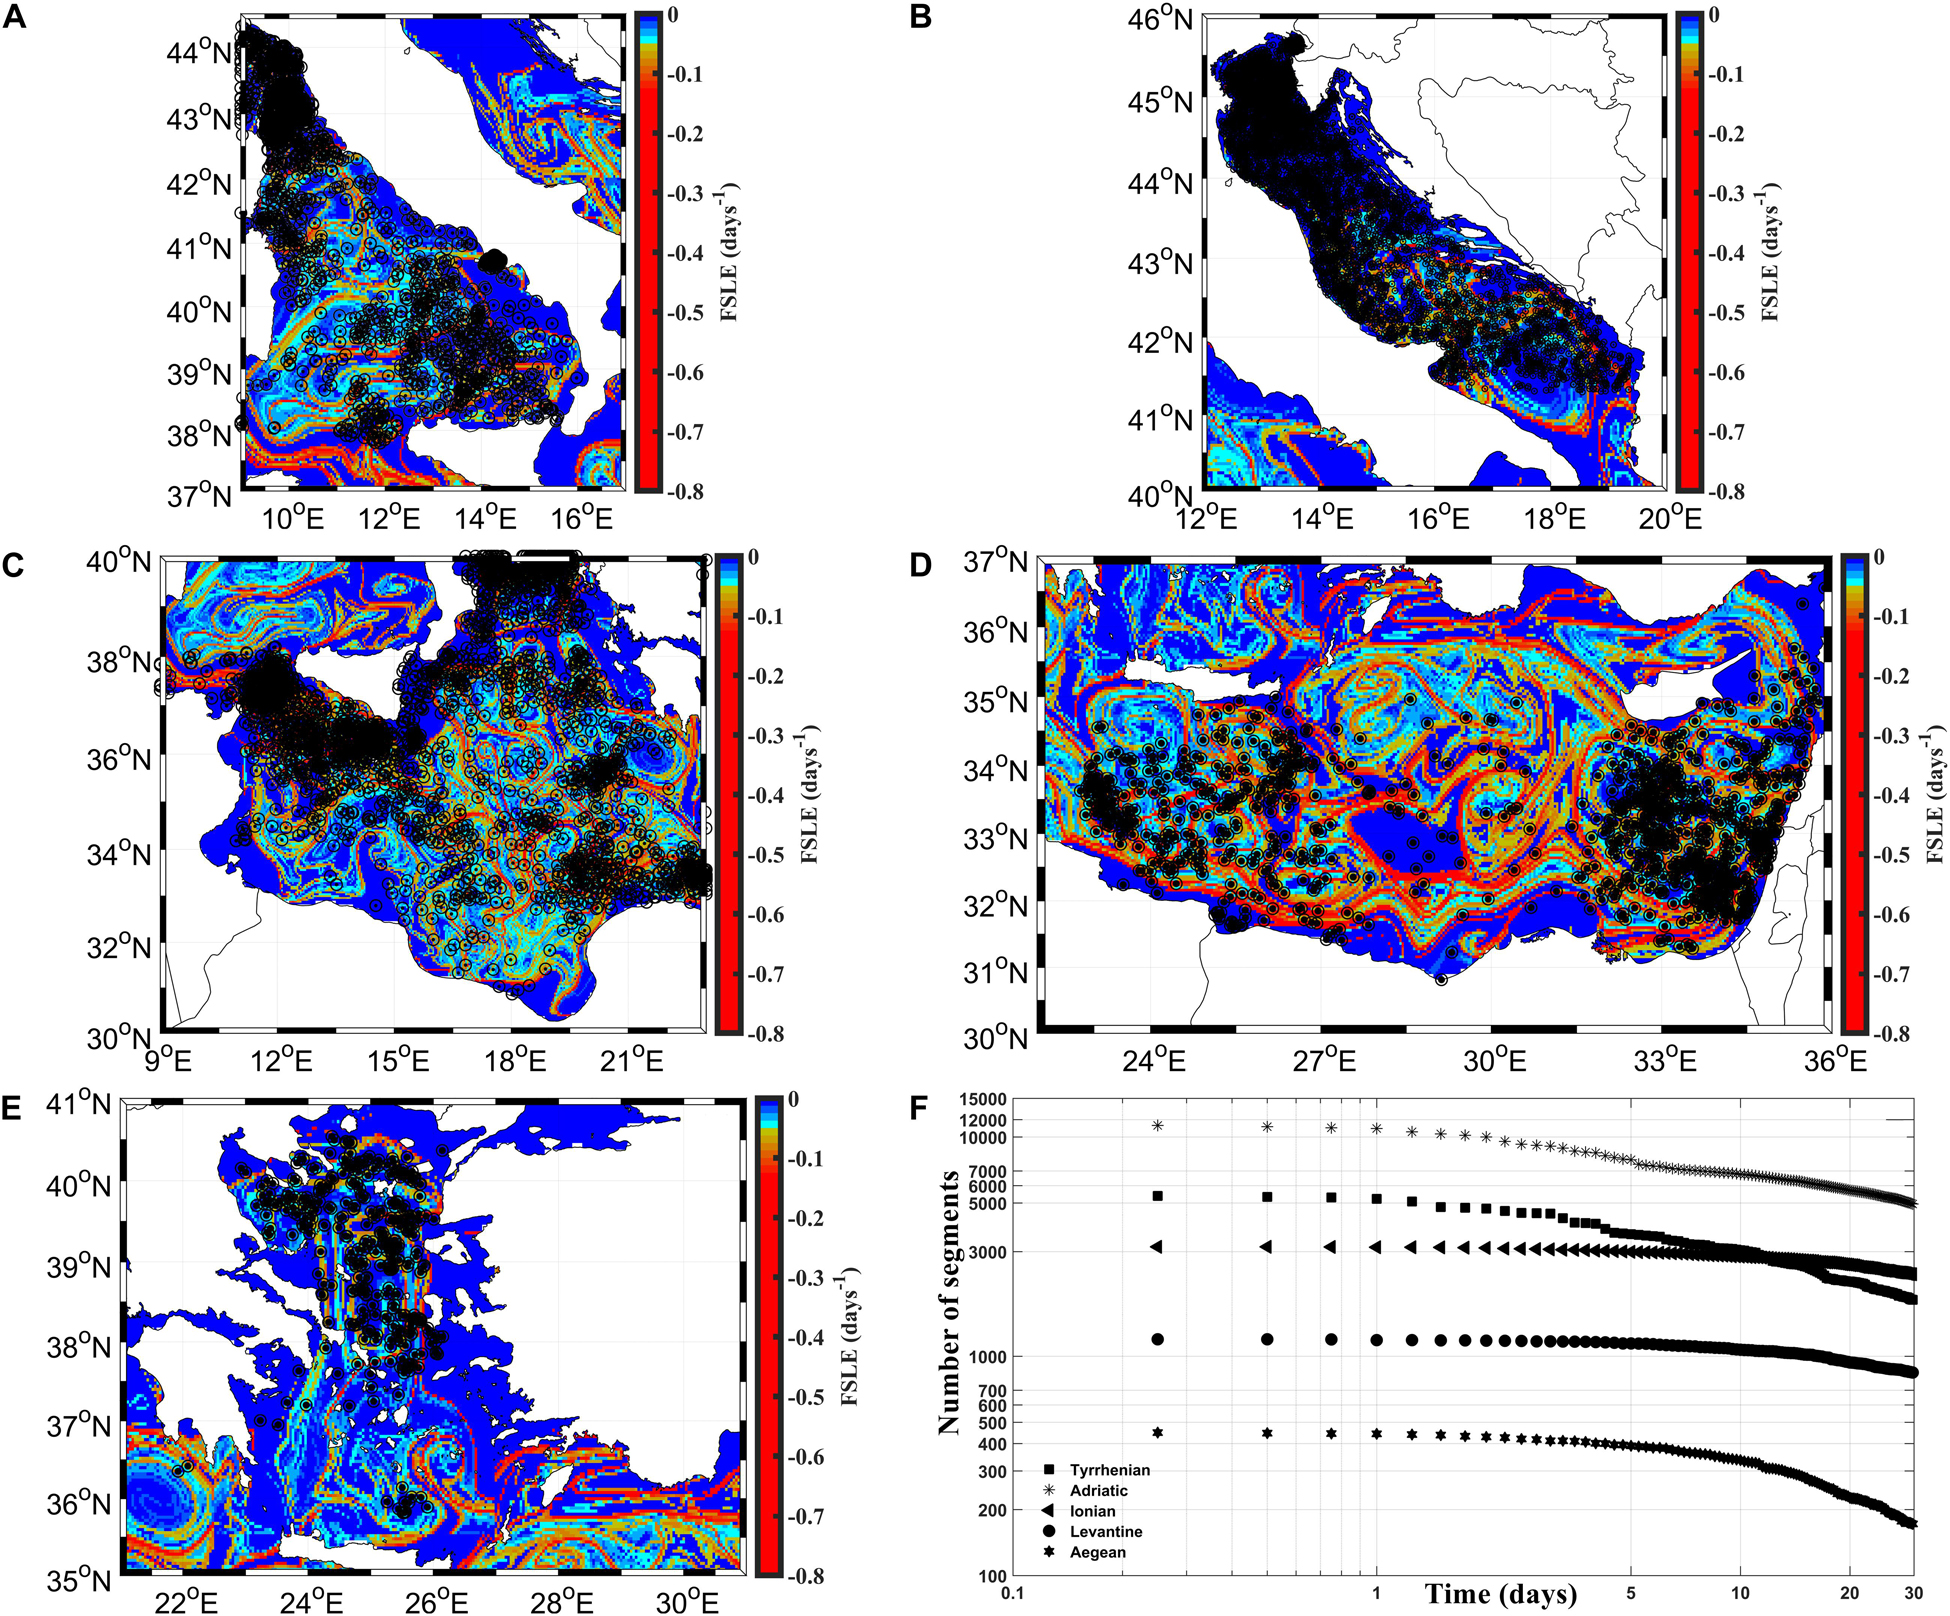
Figure 2. The spatial distribution of the FSLE superposed with the initial positions of drifter segments (individual drifters, black dots inside the black circles) (A) in the Tyrrhenian, (B) the Adriatic, (C) the Ionian, (D) the Levantine, and (E) the Aegean sub-basins. The number of segments as a function of time is shown in (F).
Two kinds of drifter pairs are used to estimate the dispersion: the original pairs, derived from drifters deployed together in the same area; the chance pairs, derived from drifters not deployed together but that are occasionally in the same area at the same time (LaCasce and Bower, 2000; Koszalka et al., 2009; Bouzaiene et al., 2018). Original and chance drifter pairs are selected in each sub-basin with the corresponding 30 days segments. The drifter pairs are taken every 5 days (time period larger than the Lagrangian time-scale) (Bouzaiene et al., 2018) and for initial separation distances smaller than 2 km to estimate the relative dispersion (Figure 3). The number of segments and drifter pairs in the Tyrrhenian and the Adriatic sub-basins is larger than in other regions and decreased dramatically with time (Figures 2F, 3F). It is possible to study the relative dispersion statistics in each region, when more than 10 pairs are detected in the first thirty days (see Figure3F) (Poje et al., 2014).
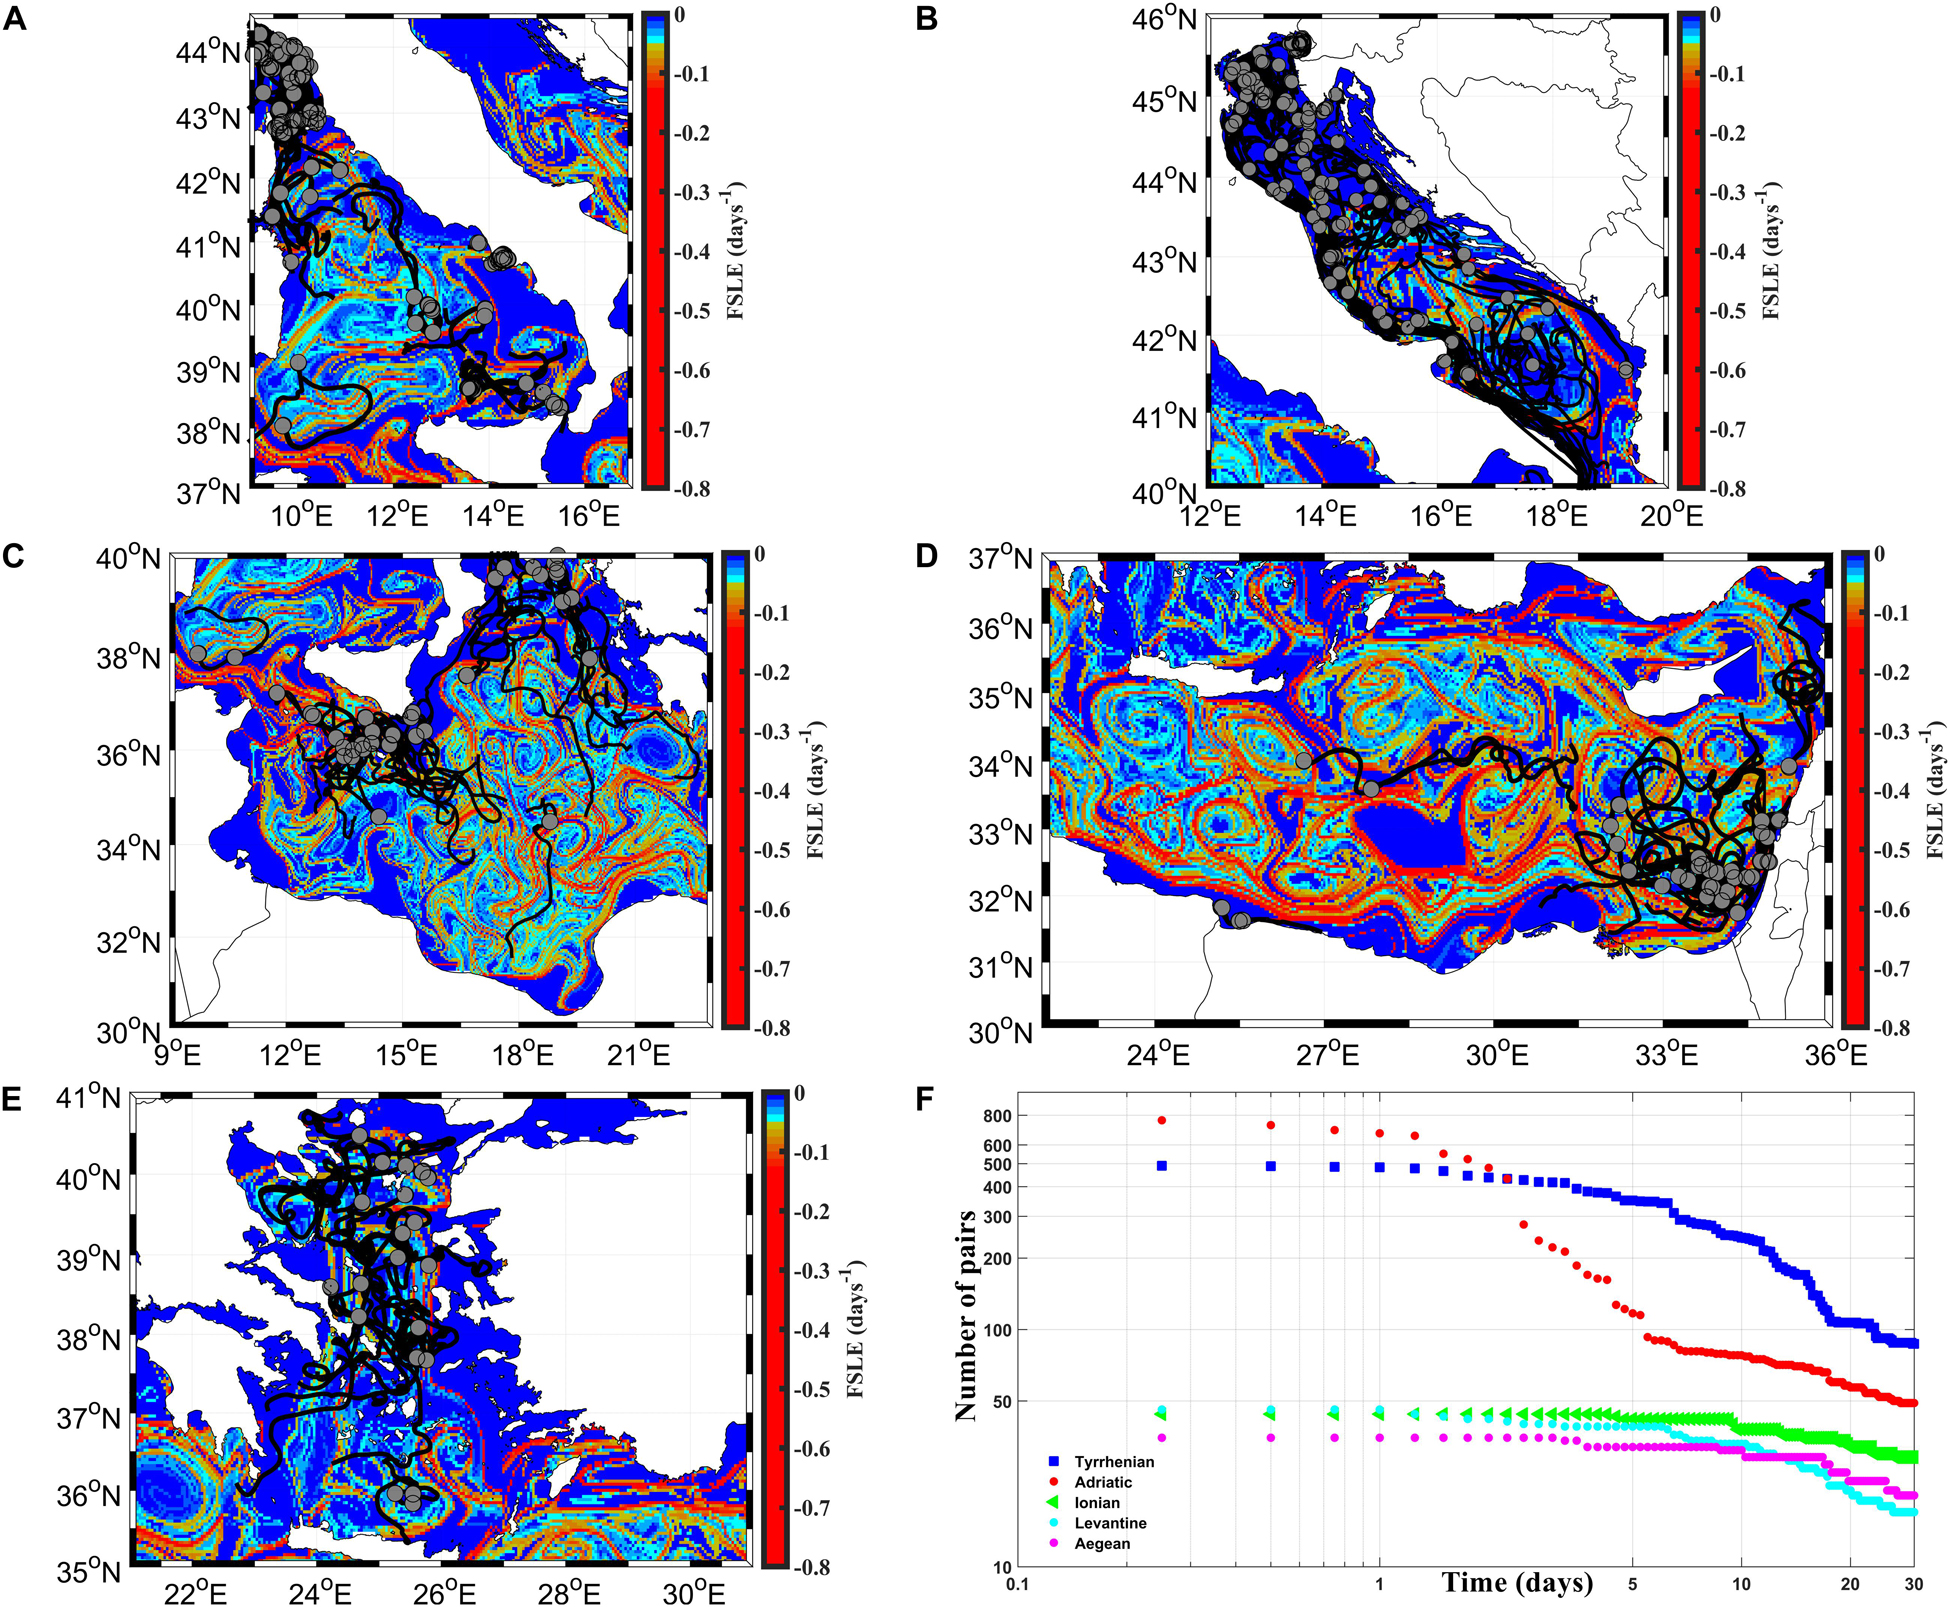
Figure 3. The spatial distribution of the FSLE superposed with the initial pair positions (gray dots) and their trajectories (black lines) during 30 days (A) in the Tyrrhenian, (B) the Adriatic, (C) the Ionian, (D) the Levantine, and (E) the Aegean sub-basins. The number of drifter pairs as a function of time is shown in (F).
Absolute and relative dispersion properties described in this study represent a mean estimation over the period 1986–2019, mainly ascribable to the Mediterranean coherent circulation structures described by the 30 days drifter pairs and segments selected. An overview of the mean circulation field is presented in Figure 1A.
Satellite Altimetry
The Finite Scale Lyapunov Exponent (FSLE) presented in this study is an altimetric product derived from the Archiving, Validation and Interpretation of Satellite Oceanographic data (AVISO). It is used to identify the coherent structures in Mediterranean sub-basins. The FSLE is backward-in-time advection and based on the largest eigenvalues of the Cauchy-Green strain tensor of the flow map; the spatial resolution is 0.04 × 0.04°1. The FSLE is defined as the exponential rate of separation, averaged over infinite time, of fluid parcels initially separated infinitesimally (D’Ovidio et al., 2004). It has been firstly introduced by Aurell et al. (1997) and Artale et al. (1997) to study the transport in closed areas. Hereafter, it was used to analyze dispersion processes, detect Lagrangian structures (e.g., eddies and gyres) and visualize eddies core regions (elliptic regions) or their surrounding (hyperbolic regions) (Lacorata et al., 2001; Koh and Legras, 2002; D’Ovidio et al., 2004, 2008).
In this paper we select more representative snapshots of the FSLE, which give an idea of the distribution of the mean sub-basin and mesoscale features in the different Mediterranean sub-basins (Figure 1B) and help to visualize the distributions of drifter pairs and drifter segments versus the coherent structures (Figures 2, 3). The FSLE is represented in the whole Mediterranean Sea by representing snapshots for predefined months which appear similar to the surface Mediterranean circulations in the literature.
Methods
The dispersion statistics, can be obtained both by measuring the mean squared displacement of single drifters and drifter pair separations (LaCasce, 2008; Bouzaiene et al., 2018). We consider the single drifter displacements defined by Poulain and Niiler (1989) as follow:
Where X(i,t)and X(i0,t0)are, respectively, vector positions of drifters at times to and t; index i is the i-direction of position vectors (in case of 2-D turbulence i = 1, 2), < u > is the mean velocity derived from pseudo-Eulerian statistics in bin of 0.25 × 0.25° performed over the whole Mediterranean drifter dataset (for more details see Menna et al., 2019a, b). The mean zonal and meridional velocities are of 3.3 and −1.4 cm.s–1, respectively. We defined the absolute diffusivity as the derivative of the absolute dispersion as a function of time derived by Babiano et al. (1985) as follow:
In case of homogenous and isotropic flow, for small and large times the two classical absolute dispersion regimes are, respectively, the ballistic regime (A2∼t2,k(1)∼t) and the Random-walk regime (A2∼t,k(1)∼constant) (Babiano et al., 1985; Poulain and Niiler, 1989).
At intermediate time scale, anomalous (elliptic and hyperbolic) absolute dispersion regimes are observed. The elliptic regime A2∼t5/3 is related to the region where the rotation is more relevant than the deformation, whereas the hyperbolic regime A2∼t5/4 is related to domains where the deformation is more relevant than the rotation (Elhmaidi et al., 1993). The classical asymptotic and anomalous absolute dispersion regimes are summarized in the Table 1 (Babiano et al., 1990; Elhmaidi et al., 1993).
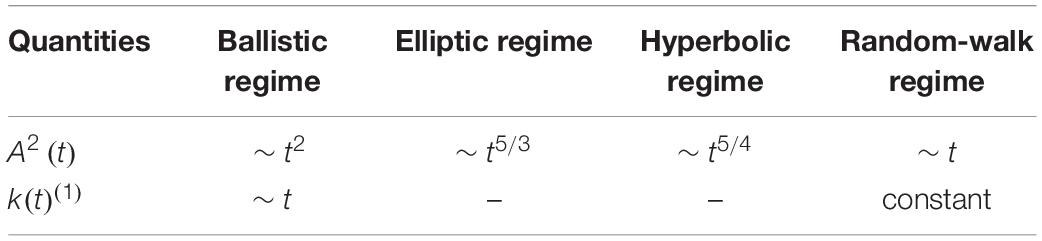
Table 1. Classical absolute dispersion regimes.
The relative separation of drifter pairs is defined by (Poje et al., 2014):
Where δis the distance between two trajectories, the average is overall the available trajectory pairs and r(1) and r(2) are the Lagrangian positions of the two drifters forming the pair.
In the ocean, the growth of distance between pairs δis compared to the internal Rossby Radius of deformation DI for characterizing the effect of submesoscale and mesoscale structures on relative dispersion regimes. Different parameters deduced from relative dispersion and depending onδ which are highlighted below:
The classical relative diffusivity is defined as the derivative of relative dispersion in time by Babiano et al. (1990) as:
The second-order structure function measures the evolution of pair velocities growing in a distanceδ. It is defined as follows (Berti and dos Santos, 2016):
Where V(1) and V(2) are the Lagrangian velocities of two particles separated with a predefined distance δ and the average is overall the available velocity pairs.
The relative diffusivity can be deduced from the second-order structure function and it is presented as follows (Berti and dos Santos, 2016):
And the Lagrangian Energy spectrum is:
Where k = 2π/δ is the wave number (Berti and dos Santos, 2016).
Classical relative dispersion regimes are summarized in the Table 2 (Babiano et al., 1990; LaCasce and Bower, 2000; LaCasce and Ohlmann, 2003; Koszalka et al., 2009; LaCasce, 2010; Poje et al., 2014; Berti and dos Santos, 2016; Corrado et al., 2017; Bouzaiene et al., 2018; Dräger-Dietel et al., 2018; Callies et al., 2019).
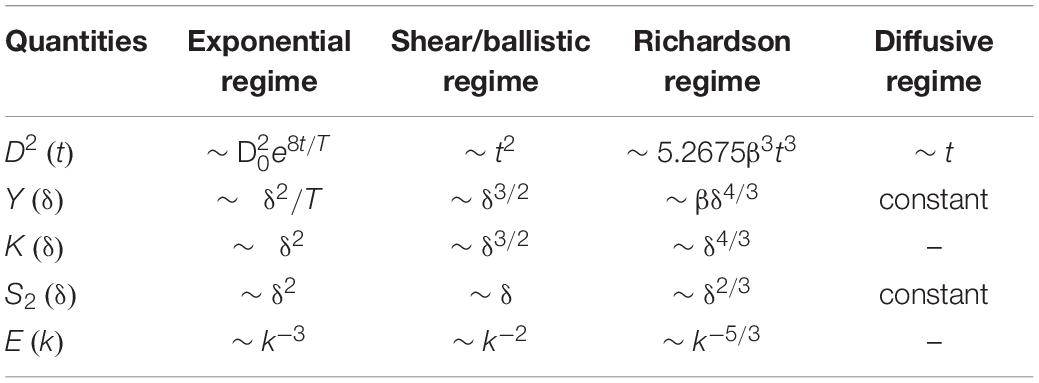
Table 2. Classical relative dispersion regimes. Where the parametersT and β are calculated from the data.
The mean objective of this paper is to study the spreading of surface drifters in the Mediterranean sub-basins (Tyrrhenian, Adriatic, Ionian, Levantine and Aegean) in order to compare the different dispersion regimes and define the parameters common to all ocean sub-basins by calculating one and two-particle statistics from large drifter data set deployed in the Mediterranean sea between 1986–2019.
Results
In this work we will not address the results of the WWM because this region of the Mediterranean Sea was already examined in Bouzaiene et al. (2018). The spatial distribution of the FSLE in the Tyrrhenian, Adriatic, Ionian, Levantine and Aegean sub-basins shows the presence of the well-known mesoscale structures in each sub-basin (Figure 1B). For each sub-basin we have selected monthly snapshots that better highlight the main coherent structures. The FSLE shows transport barriers, higher absolute values surrounding eddies (red, dark yellow and cyan colors) and lower absolute values in their cores (blue color). In the Ionian and the Levantine sub-basins, numerous mesoscale structures (eddies and gyres) are observed (Figure 1B) due to the strong currents variability in these regions (Menna et al., 2012, 2019a,b; Mauri et al., 2019). In the Aegean sub-basin the number of mesoscale structures is reduced in agreement with the results of Politikos et al. (2017). In the Adriatic sub-basin the FSLE outlines the edges of the Southern Adriatic Gyre (SAG) and of another cyclonic gyre located in the central part of the basin (Poulain et al., 2012b). In the northern part of the Tyrrhenian sub-basin, the Northern Tyrrhenian Gyre (NTG) is well detected as well as other eddies in the central part of the basin. The main basin, sub-basin and mesoscale structures detected in the five Mediterranean sub-basins are in accordance with the results presented by Menna et al. (2013) and Tintoré et al. (2019).
The 30-day drifter trajectories and their initial positions displayed in Figures 2, 3 show that many drifters are located in the coherent structures and move inside or around the gyres and eddies, as well as the NTG, the central Tyrrhenian eddies (Figures 2A, 3A), the SAG, and numerous particles are advected along the boundary Adriatic currents (Figures 2B, 3B). In the Ionian sub-basin (Figures 2C, 3C) the drifters are mainly located in the Sicily Channel and in the northern and southern Ionian sub-basin; whereas in the Levantine sub-basin they are advected along the LEC and the CC currents, some drifters are located in WCG, IG, MME, CE, and ShE (Figures 2D, 3D). In the Aegean sub-basin the drifters are homogeneously dispersed in the sub-basin and numerous drifters are dispersed in the Aegean coherent structures (Figures 2E, 3E).
Absolute dispersion curves displayed in Figure 4 show the occurrence of quasi-ballistic (t2) and quasi-random walk (t) regimes, respectively, for small (t < 2 days) and large (t > 15 days) time scales in all sub-basins. The absolute dispersion is larger for the zonal component in all the sub-basins (Figure 4) and is mainly anisotropic, except in the Aegean sub-basin where it is isotropic during the last twenty days (the evolution of zonal and meridional components overlaps; Figure 4E). The largest value of the zonal dispersion are related to the presence of zonal gyres or eddies trapping drifters during few days or weeks and to the influence of zonal currents on the observed zonal split (mean zonal velocity larger than the meridional one). At intermediate time scales (between 2 and 15 days approximately), the absolute dispersion curves emphasize the occurrence of the hyperbolic regime (t5/4) in the Adriatic (Figure 4B), suggesting that in this sub-basin prevails the effect of the coastal jets and the WAC (stretching) on the particles advection than the effect of gyre cores. In the other sub-basins (Tyrrhenian, Ionian, Levantine and Aegean), the elliptic regime (t5/3) prevails the effect of the inner part of coherent structures on the particles transport than their outer part (Figures 4A,C,D,E). These results are supported by normalizing the absolute dispersion by t5/4 for the hyperbolic and t5/3 the elliptic regimes as shown in the Figure 5. Quasi short plateau is detected approximately in range of 3–5 days in the Tyrrhenian (Figure 5A), 3–6 days in the Ionian (Figure 5C), 2.5–4 days in the Levantine (Figure 5D) and Aegean (Figure 5E) sub-basins related to the elliptic regions (eddy cores) where the rotation is more relevant than the stretching. Another quasi plateau is observed between 9 and 15 days, approximately in the Adriatic sub-basin (Figure 5B) connected to the hyperbolic regions (surrounding eddies). The absolute diffusivity k(t)(1) as a function of time is approximately constant at large time scale implies the presence of the quasi-random walk regime (t > 15 days), while the quasi-ballistic regime at small time (t < 2 days, k(t)(1) ∼t) is detected (Figure 6). During the occurrence of the quasi-random walk regime the k(t)(1) is of ∼100 km2.days–1 in the Tyrrhenian, the Adriatic and Aegean sub-basins (Figures 6A,B,E). It reaches larger values of ∼500 km2.days–1 in the Ionian (Figure 6C) and 250 km2.days–1 in the Levantine (Figure 6D), connected to the large sub-basin sizes where the drifter pairs are dispersed for large separation distances. The absolute diffusivity depends explicitly on the mean velocity being the zonal diffusivity component is greater than the meridional one according to the largest mean zonal velocity (Figure 6).
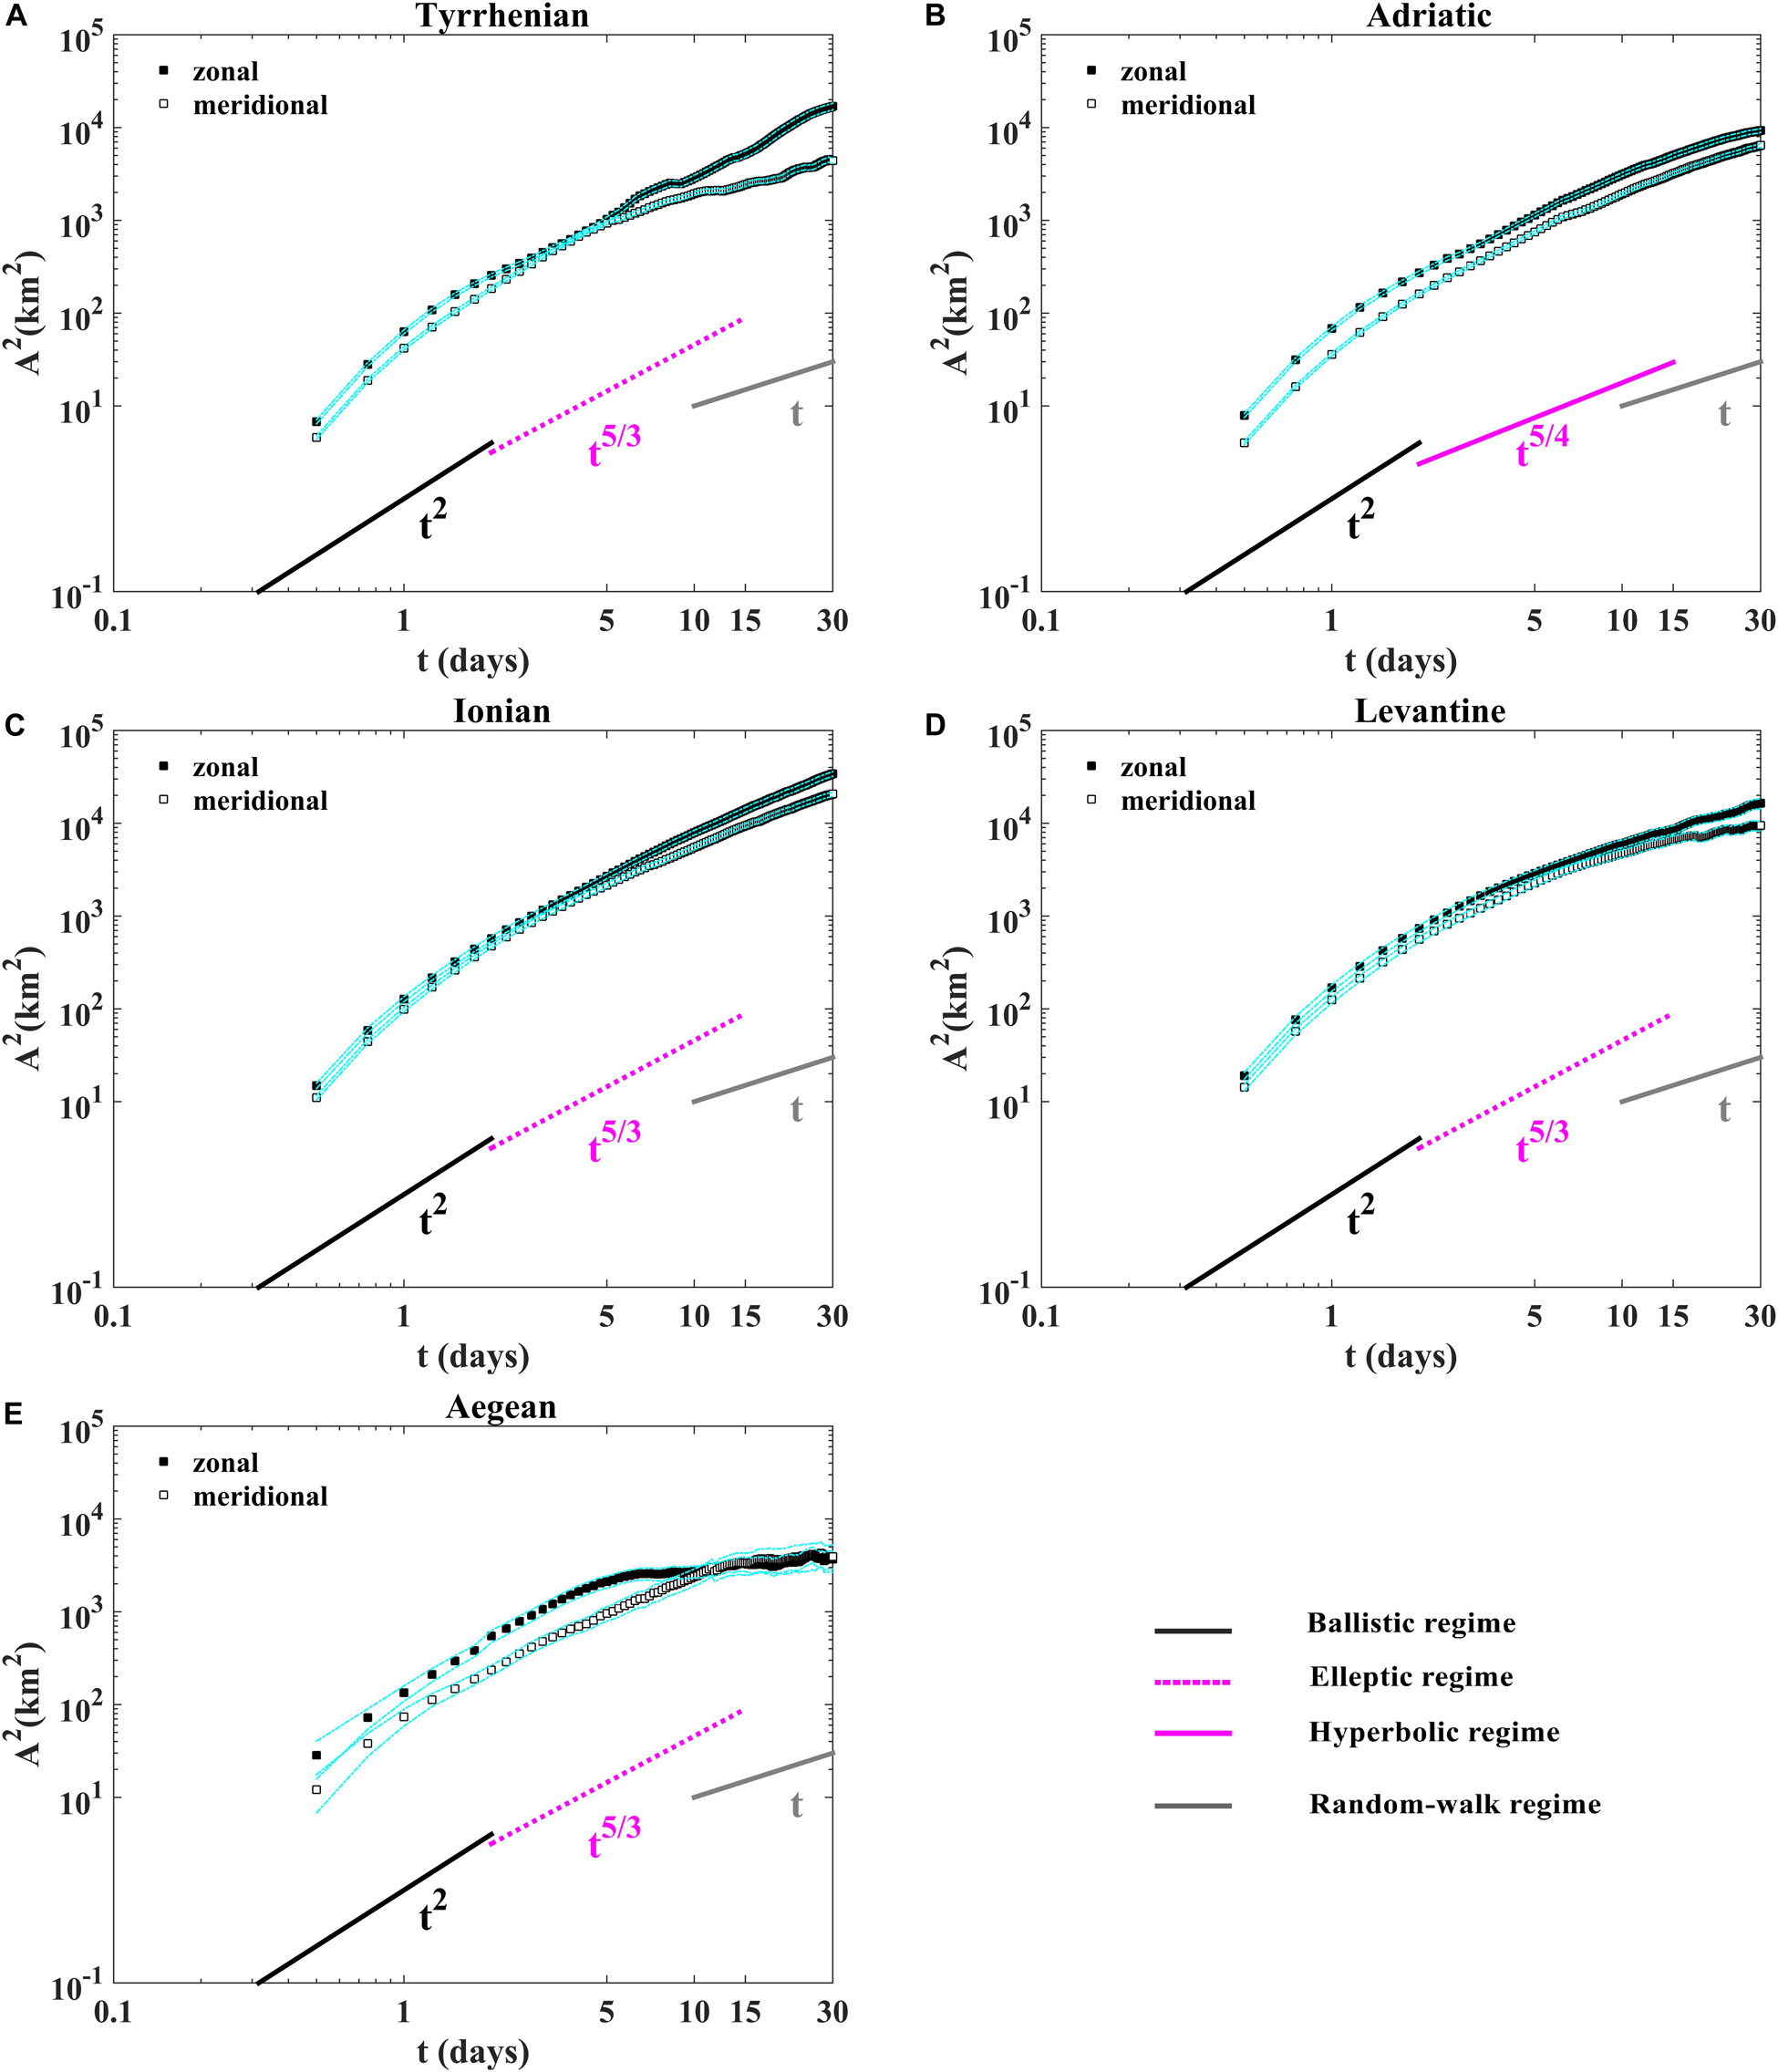
Figure 4. Absolute dispersion for the zonal and meridional components as a function of time in loglog plot (A) in the Tyrrhenian, (B) the Adriatic, (C) the Ionian, (D) the Levantine, and (E) the Aegean sub-basins. The ballistic (black line) random-walk (gray line), the elliptic (dashed magenta line) and the hyperbolic (magenta full line) laws. The dashed cyan lines indicate the 90% confidence intervals from bootstrap resampling, give a rough idea of the uncertainties for the statistics.
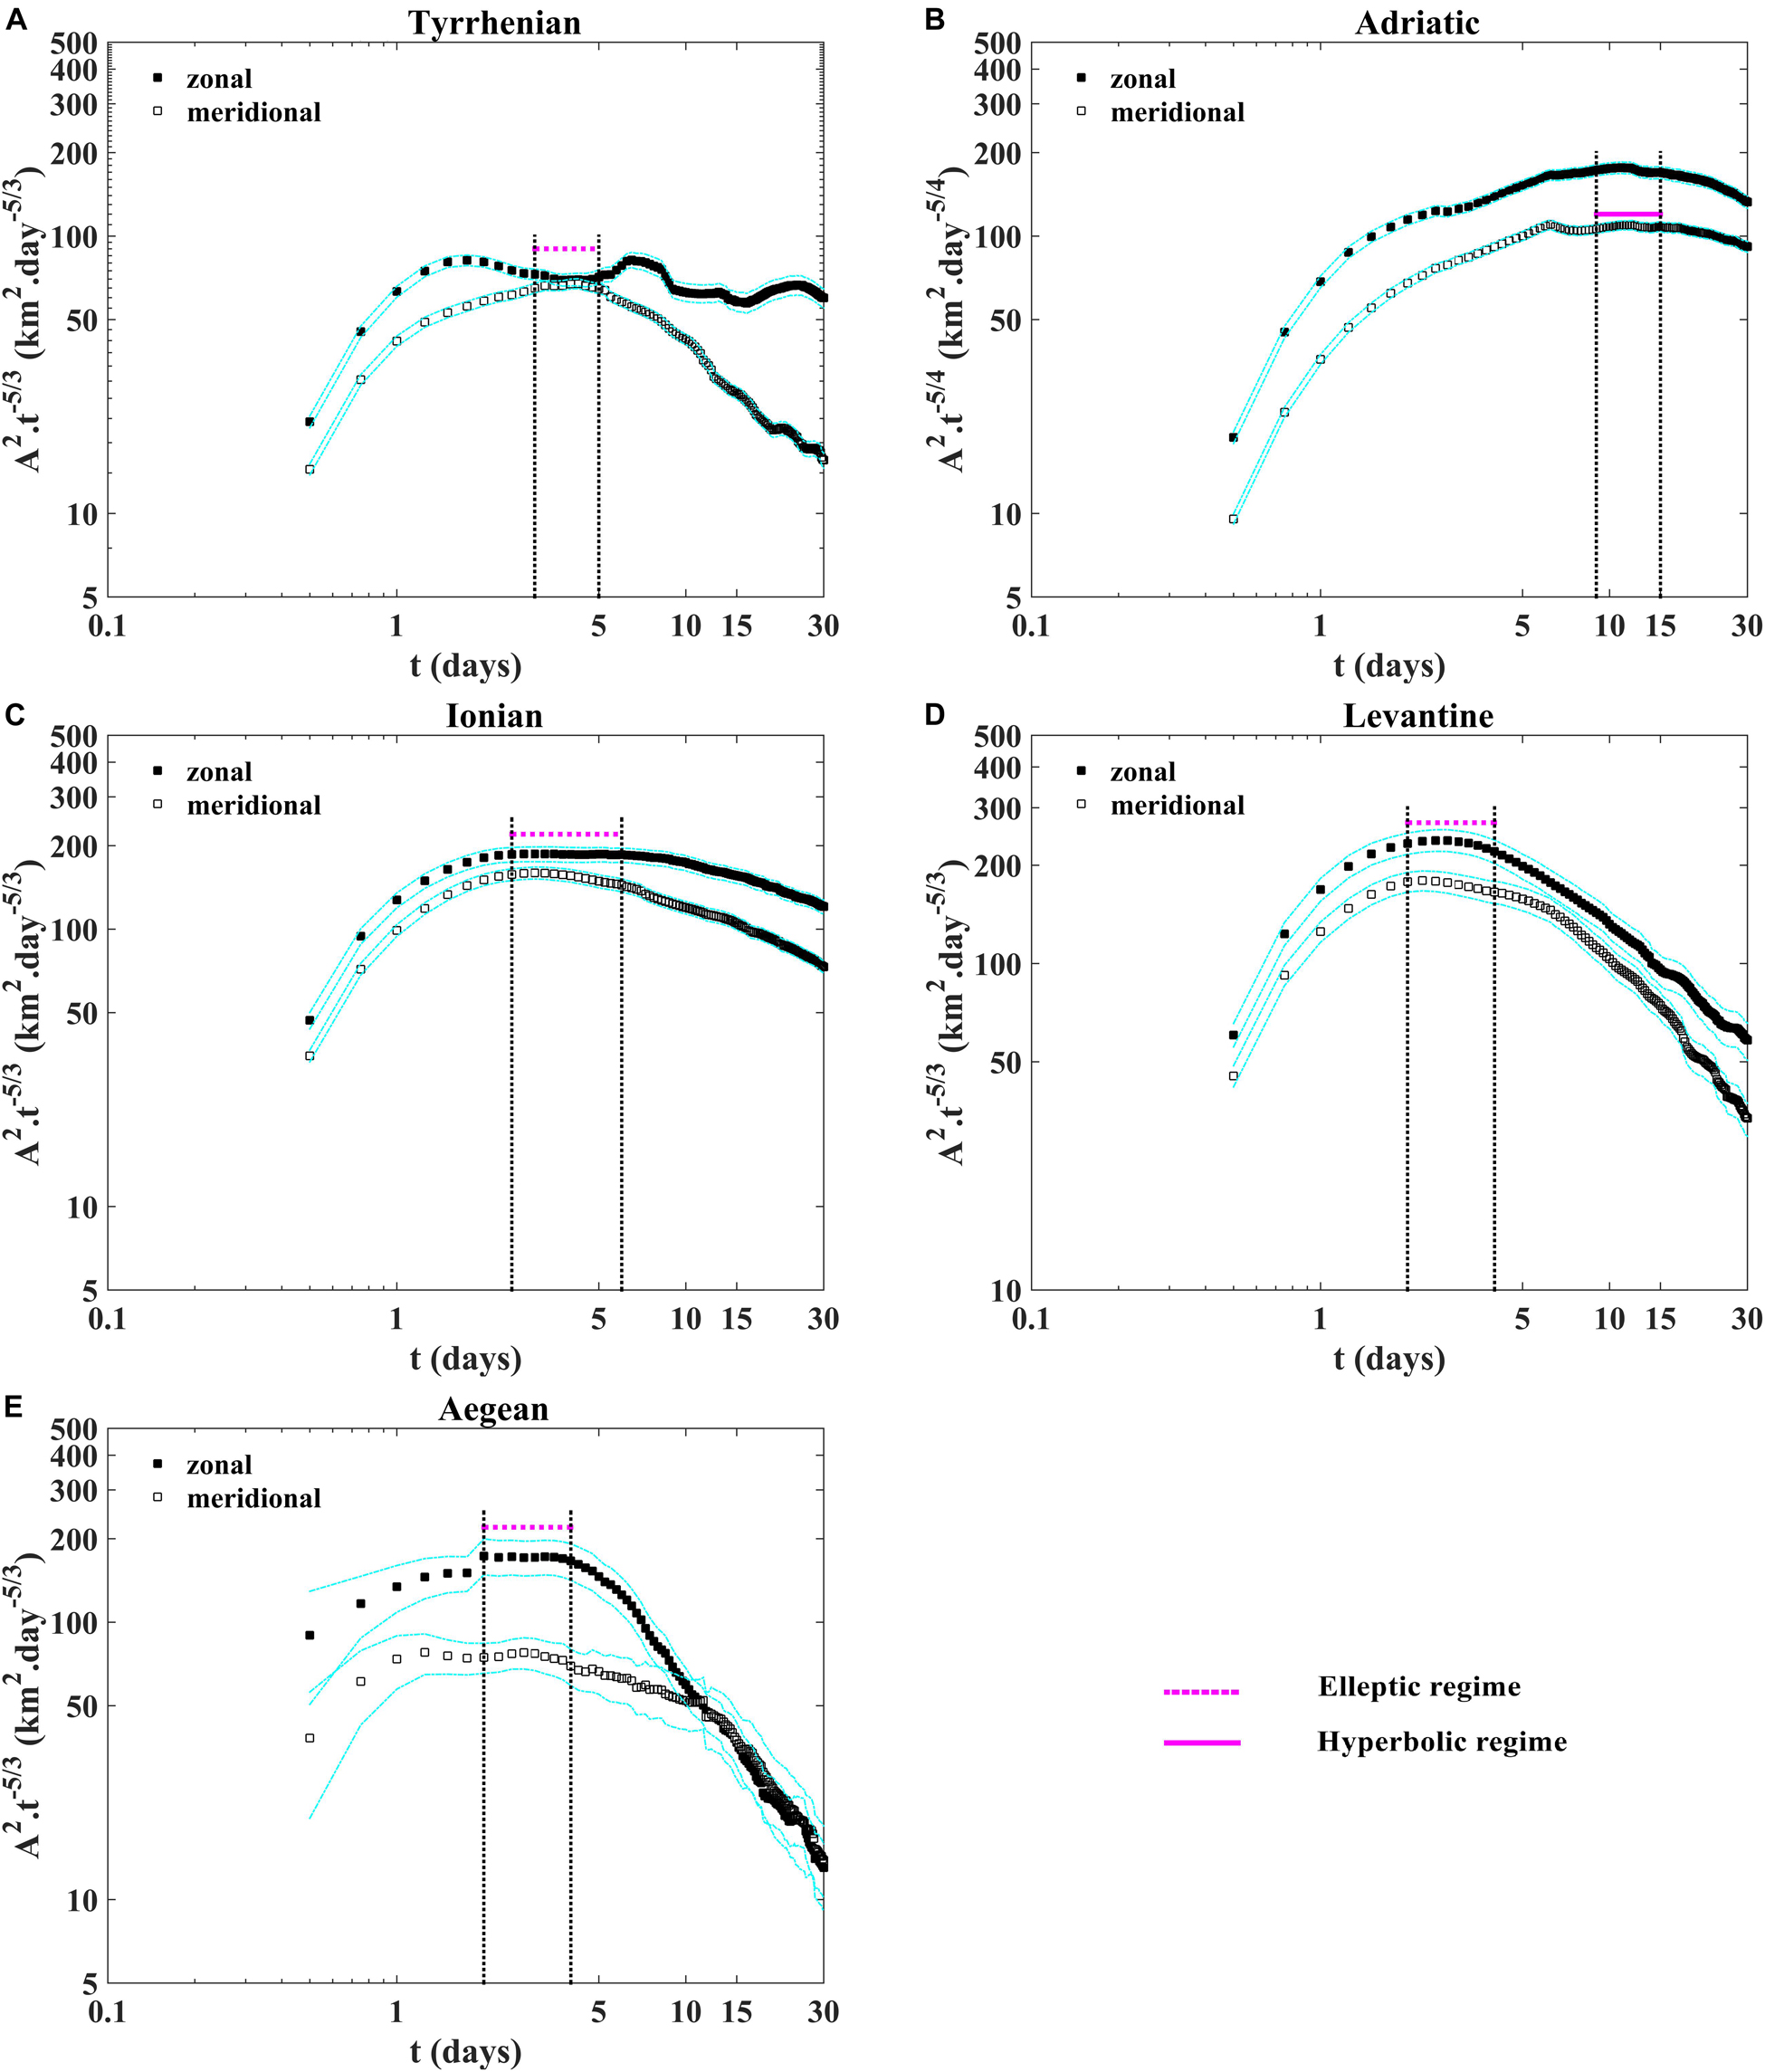
Figure 5. Absolute dispersion for the zonal and meridional components normalized by t5/3 as a function of time in loglog plot (A) in the Tyrrhenian, (C) the Ionian, (D) the Levantine (E) the Aegean and by t5/4 (B) the Adriatic sub-basins. The horizontal magenta lines show the presence of plateau for the occurrence of the elliptic (dashed magenta line) and hyperbolic (magenta full line) regimes. The vertical dashed black lines show the time period of the anomalous regimes. The dashed cyan lines indicate the 90% confidence intervals from bootstrap resampling, give a rough idea of the uncertainties for the statistics.
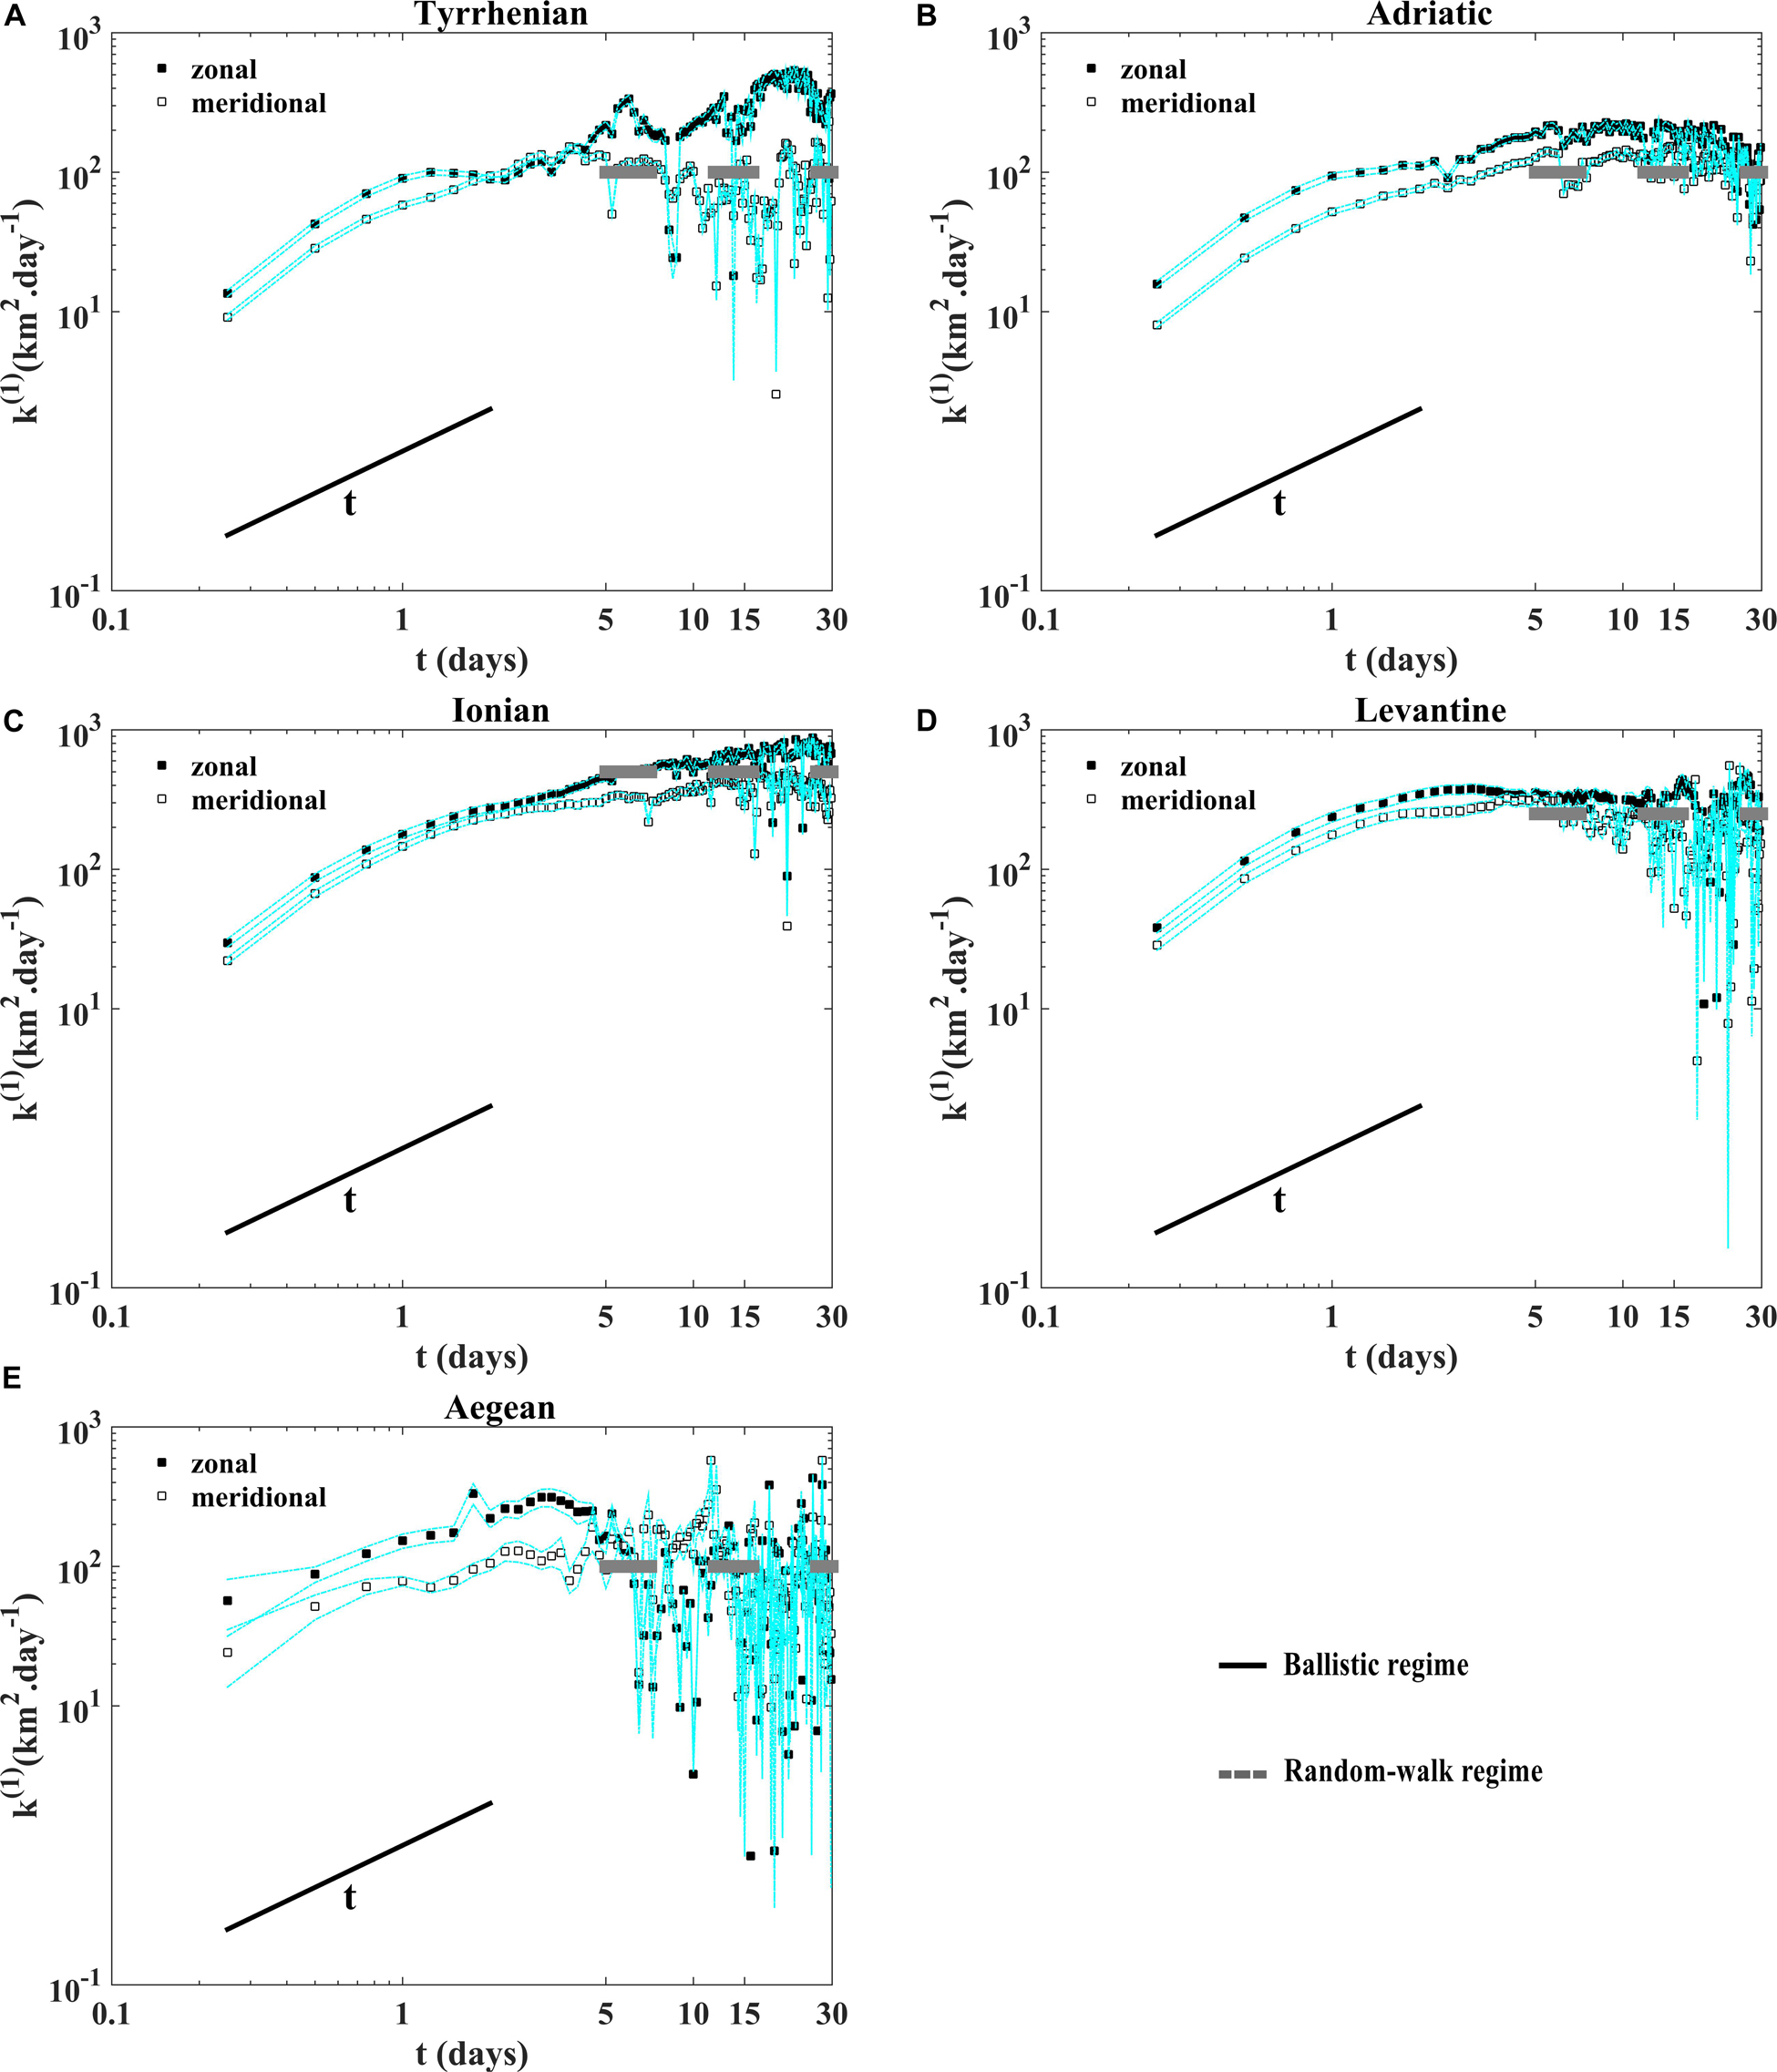
Figure 6. Absolute diffusivity for the zonal and meridional components as a function of time in loglog plot (A) in the Tyrrhenian, (B) the Adriatic, (C) the Ionian, (D) the Levantine, and (E) the Aegean sub-basins. The diffusive random-walk is shown with the thin black line and the horizontal dashed gray lines show the constant absolute diffusivity values. The dashed cyan lines indicate the 90% confidence intervals from bootstrap resampling, give a rough idea of the uncertainties for the statistics.
The temporal evolution of the mean squared distance between drifter pairs (relative dispersion) as a function of time shows the occurrence of an exponential growth with at short time scale (less than 4 days) in the Tyrrhenian sub-basin (Figure 7A); no exponential growths are observed in the other sub-basins (Figures 7B–E). The relative dispersion evolves as ∼5.2675β3t3 in the Tyrrhenian and the Aegean sub-basins for intermediate time (Richardson-like dispersion; 2 < t < 10 days) (Figures 7A,E), while it evolves as t2 (shear-ballistic dispersion) in the other sub-basins (insets of Figures 6B–D). The Richardson-like dispersion is related to pairs spreading driven by eddies with scales comparable to the separation distance and to the Rossby radius (Corrado et al., 2017; Bouzaiene et al., 2018). The shear-ballistic regime is usually associated in the ocean to the dominant action of a strong and well organized current system, i.e., the Gulf Stream (Corrado et al., 2017). This regime is clearly detected in the Adriatic, Ionian and Levantine sub-basins normalizing the relative dispersion by the squared time t2 (horizontal plateau in the insects of Figure 7) and is connected to the WAC, AIS/MIJ, and LEC, respectively. For large time scale (more than 15 days), the relative dispersion curves follow a quasi-linear growth as a function of time (Figure 7). Figure 8 shows the difference between the four time eddy kinetic energy 4E and the second-order structure function S2 as a function of time in the five sub-basins useful to estimate the uncorrelated pair velocities. When the pair velocities become decorrelated, the parameter (4E–S2) shows a value of zero (LaCasce and Bower, 2000; LaCasce and Ohlmann, 2003). The pair velocities are decorrelated very fast in the Aegean sub-basin (after the sixth day; Figure 8E), alter ∼25 days in the Tyrrhenian Sea and after 10–15 days in the Ionian and Levantine sub-basins (Figures 8C,D); in the Adriatic Sea the pair velocities are still correlated during the last 30 days (Figure 8B) due to the coastal and semi-enclosed nature of this sub-basin. In this case the dispersion is blocked to the Adriatic coasts and the pairs are not transported for separation distances as large to become uncorrelated.
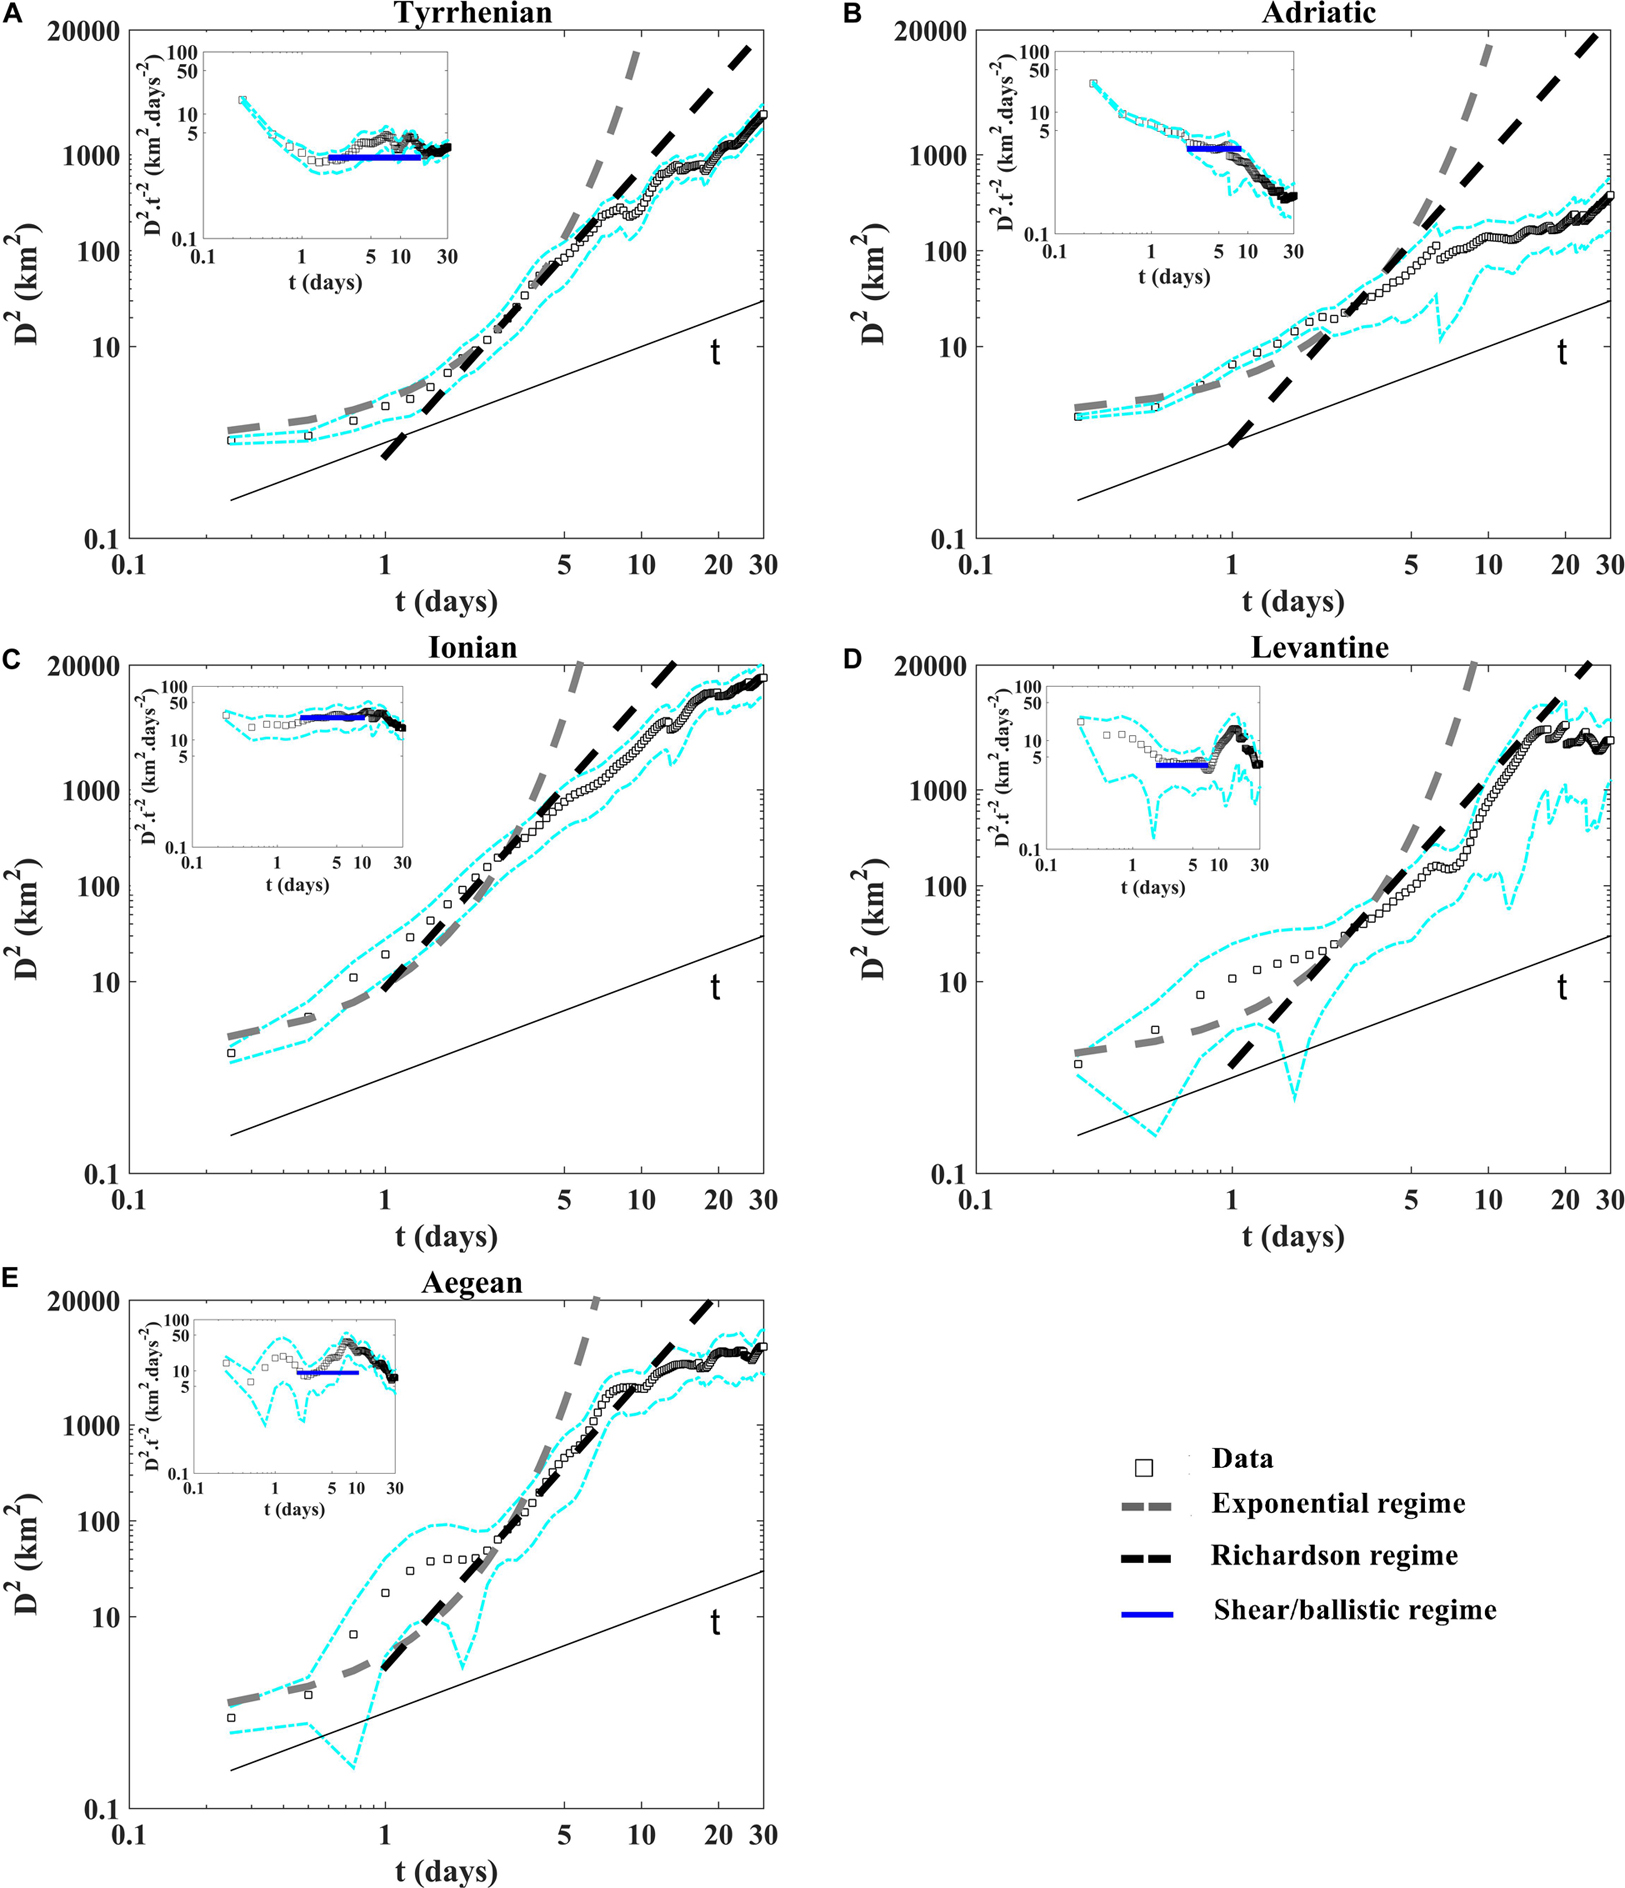
Figure 7. Relative dispersion as a function of time in loglog plot (A) in the Tyrrhenian, (B) the Adriatic, (C) the Ionian, (D) the Levantine and (E) the Aegean sub-basins. The exponential and the Richardson regimes are shown with the dashed gray and black lines, respectively. The diffusive regime is shown with the thin black line. In the insets we show the relative dispersion normalized by the squared time t2 would have a plateau (horizontal blue lines) for the occurrence of the shear/ballistic regime. The dashed cyan lines indicate the 90% confidence intervals from bootstrap resampling, give a rough idea of the uncertainties for the statistics.
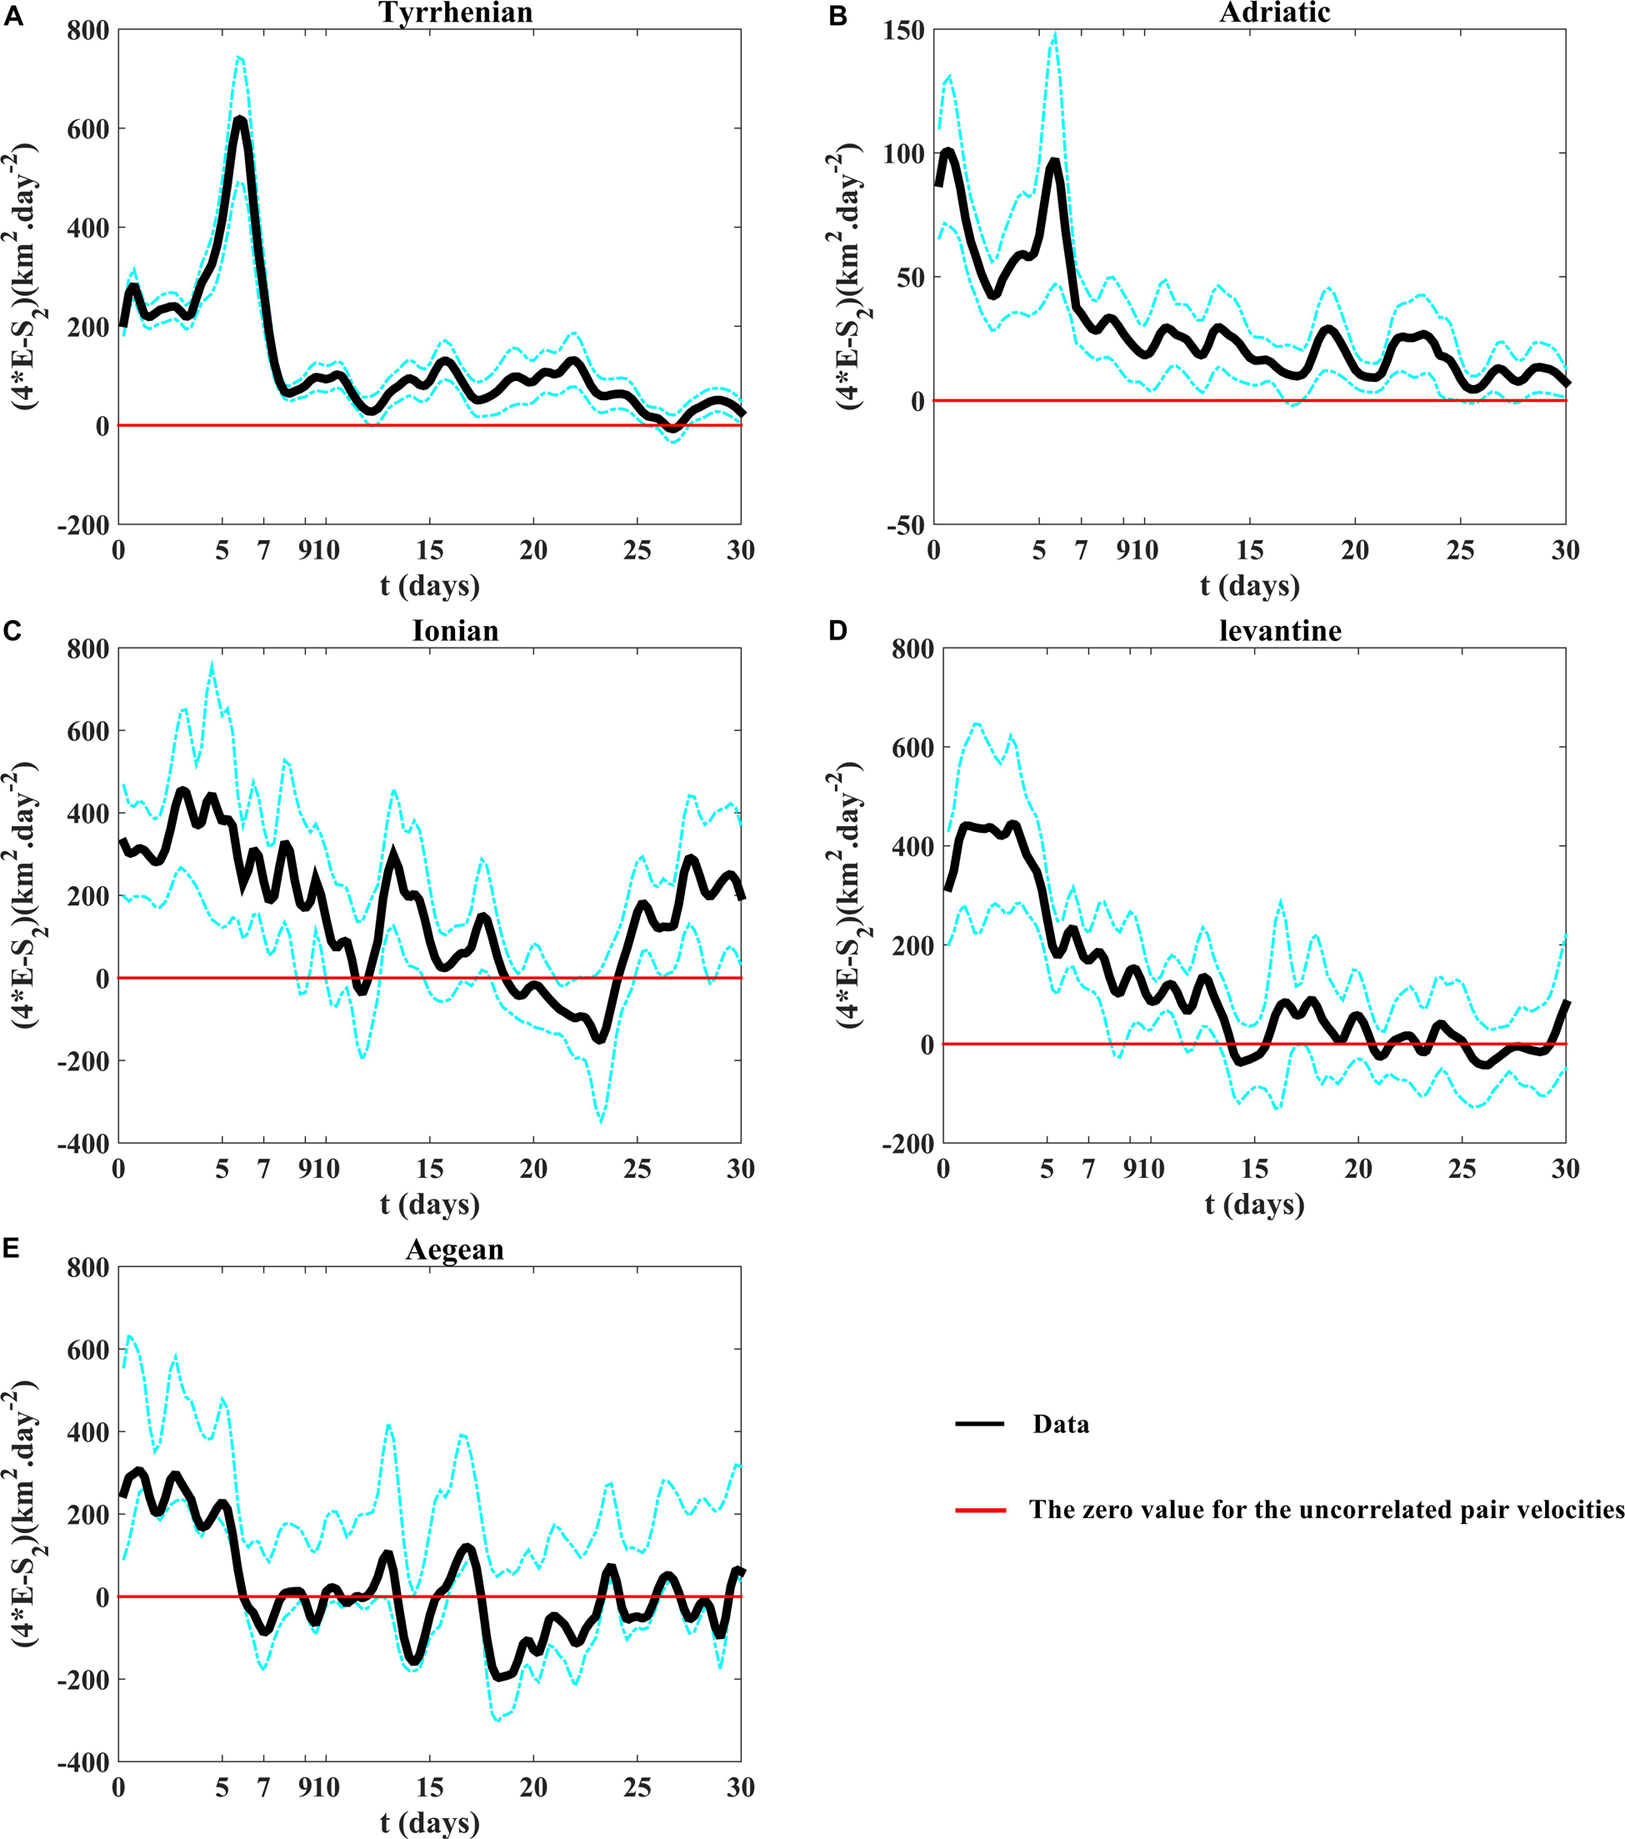
Figure 8. The difference between the four time eddy kinetic energy 4E and the second-order structure function S2 as a function of time (4E–S2)(t) (A) in the Tyrrhenian, (B) the Adriatic, (C) the Ionian, (D) the Levantine, and (E) the Aegean sub-basins. The uncorrelated pair velocities would have a (4E—S2) of zero (horizontal red lines). The dashed cyan lines indicate the 90% confidence intervals from bootstrap resampling, give a rough idea of the uncertainties for the statistics.
The relative diffusivities are calculated as a function of separation distances in two different ways: from the derivative of the relative dispersion (classical diffusivity) (Figure 9) and from the second-order structure function (Figure 10) as reported in Eqs.4 and 6, respectively. For scales <10 km, below the internal Rossby Radius of deformation (DI ∼10-20 km) (Schroeder et al., 2011; Beuvier et al., 2012), the diffusivities confirm the occurrence of the exponential regime in the Tyrrhenian sub-basin evolving as ∼δ2/T(Figure 9A). On the other hand, the diffusivities growth as ∼δ3/2 in the Adriatic, the Ionian and the Levantine regions (Figures 9B–D) and evolve as ∼βδ4/3 in the Tyrrhenian and in the Aegean sub-basins for scales comparables to the DI (Figures 9A,E). For spatial scales larger than DI the classical diffusivity shows approximately a constant value for all regions Y∼2k(t)(1), while it shows a lower value in the Adriatic sub-basin for a maximum distance between pairs is about 20 km because the majority pair velocities are still correlated at this maximum distance. The relative diffusivity curves displayed in the (Figure 10) are in good accordance with the theoretical relative dispersion laws given by the Table 2. The Exponential and Richardson fits presented in the Figures 7, 9 are calculated with the corresponding T and β values given by the following theoretical expressions (Exponential) and D2(t) = 5.2675β3t3 (Richardson) as displayed in the Table 2, i.e., at fixed time t = 3 days, T = [8.20, 9.04, 4.92, 7.30, 5.30]days and β = [0.51, 0.57, 1.18, 0.63, 0.83]km2/3 day−1 in the Tyrrhenian, Adriatic, Ionian, Levantine and Aegean sub-basins, respectively, as suggested in LaCasce (2010) and Sansón et al., 2017.
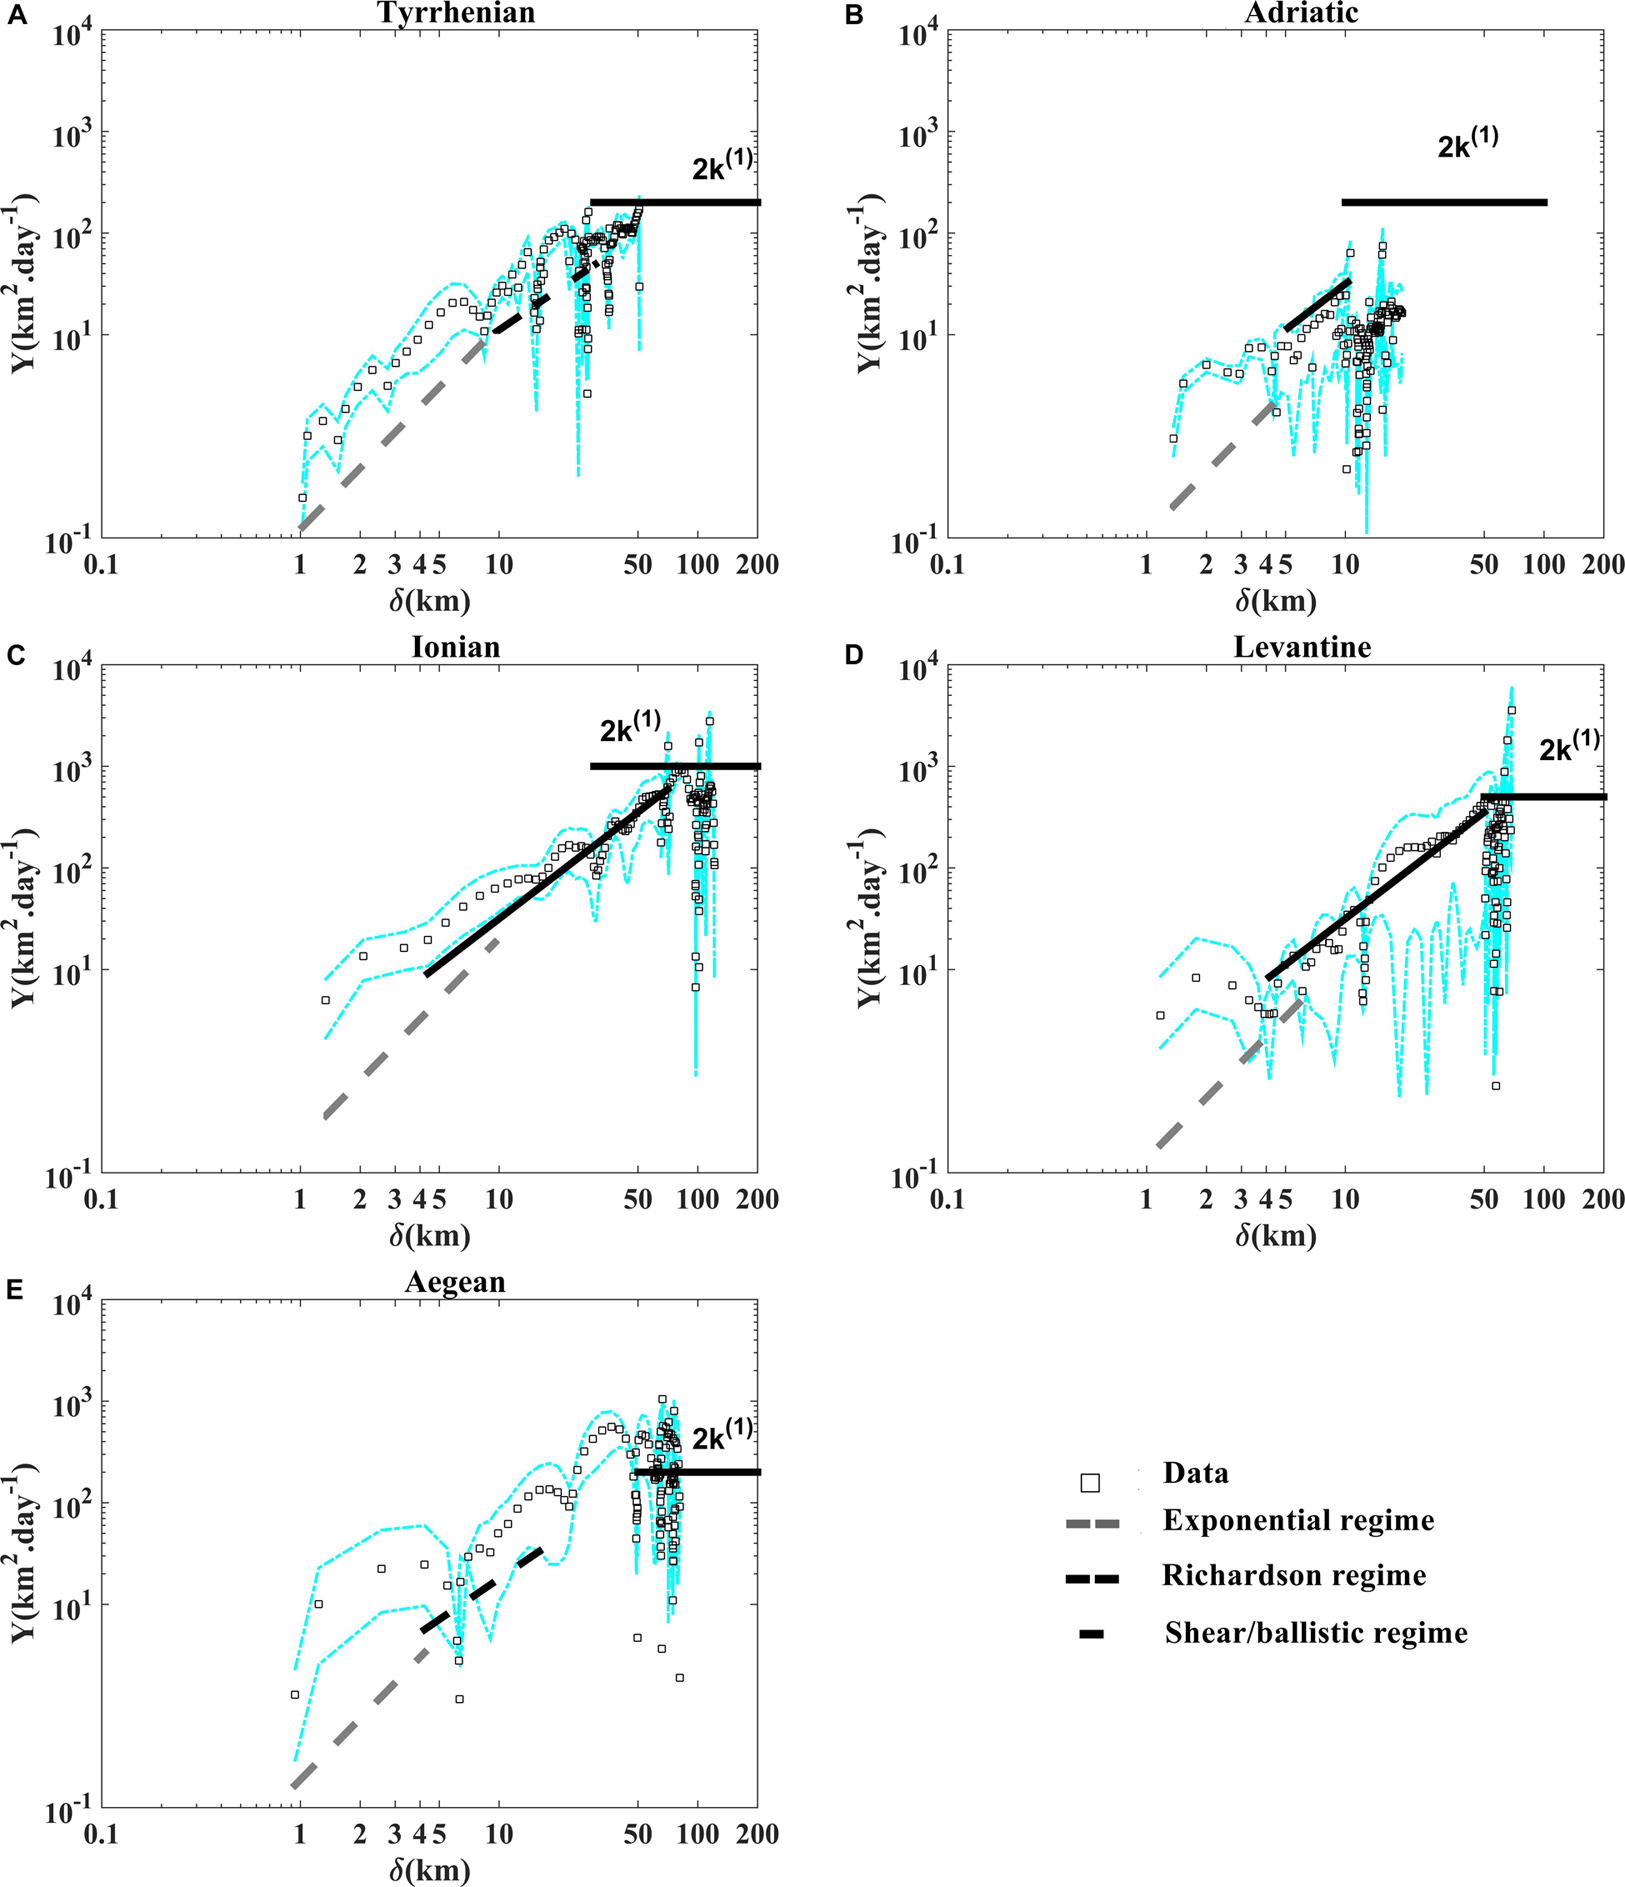
Figure 9. Relative diffusivity as a function of separation distance derived from the relative dispersion in Eq. 4 (A) in the Tyrrhenian, (B) the Adriatic, (C) the Ionian, (D) the Levantine, and (E) the Aegean sub-basins. The exponential, the Richardson and the shear/ballistic regimes are shown with the dashed gray, dashed black and black lines, respectively. The diffusive regime is shown with the horizontal thick black line. The dashed cyan lines indicate the 90% confidence intervals from bootstrap resampling, give a rough idea of the uncertainties for the statistics.
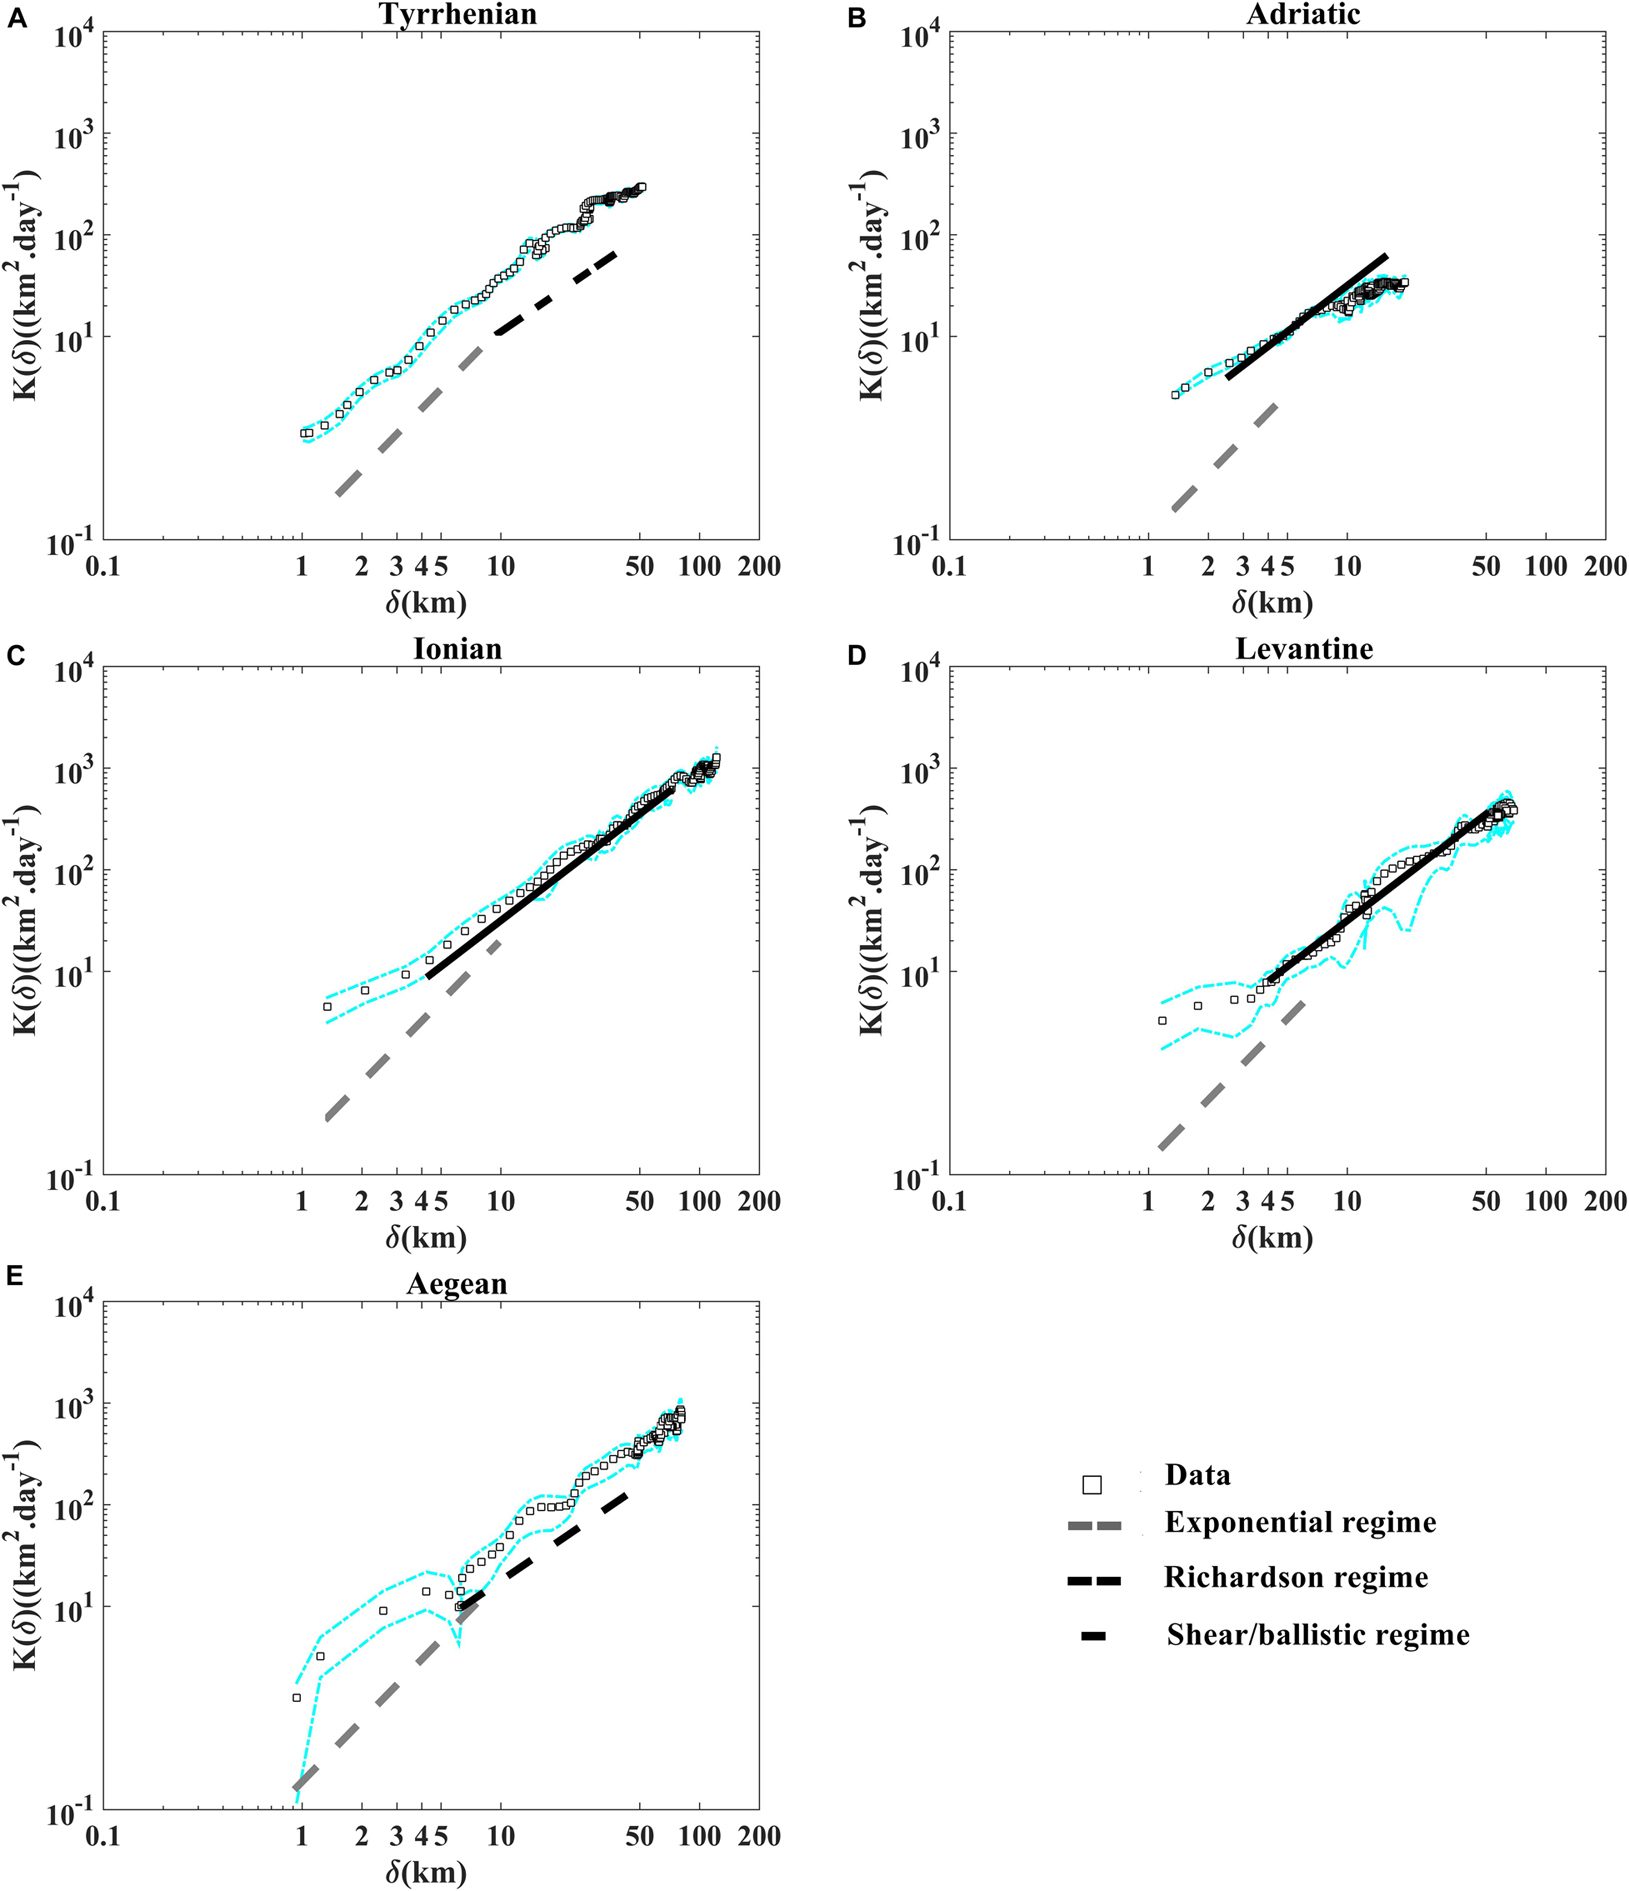
Figure 10. Relative diffusivity as a function of separation distance derived from the second-order structure function in Eq. 6 (A) in the Tyrrhenian, (B) the Adriatic, (C) the Ionian, (D) the Levantine and (E) the Aegean sub-basins. The exponential, the Richardson and the shear/ballistic regimes are shown with the dashed gray, dashed black and black lines, respectively. The dashed cyan lines indicate the 90% confidence limits from bootstrap resampling, give a rough idea of the uncertainties for the statistics.
Interestingly to represent more relative dispersion statistics in order to support the presence of the relative dispersion regimes discussed above. The second order structure function as a function of separation distance (Figure 11) and the energy spectra (versus wave number; Figure 12) are in good accordance with the classical relative dispersion regimes displayed in the Table 2. Both of them emphasize the occurrence of the non-local regime for small scales in the Tyrrhenian sub-basin, the two local (Richardson) regimes in the Tyrrhenian and Aegean sub-basins and (shear/ballistic) in the Adriatic, the Ionian and Levantine sub-basins for scales comparable to DI. Different mixing properties in the five Mediterranean sub-basins are ascribable to the total diffusivity pattern related to the eddies and to the mean flow characteristics in each regions as suggested in Ferrari and Nikurashin (2010) and Chen et al. (2014).
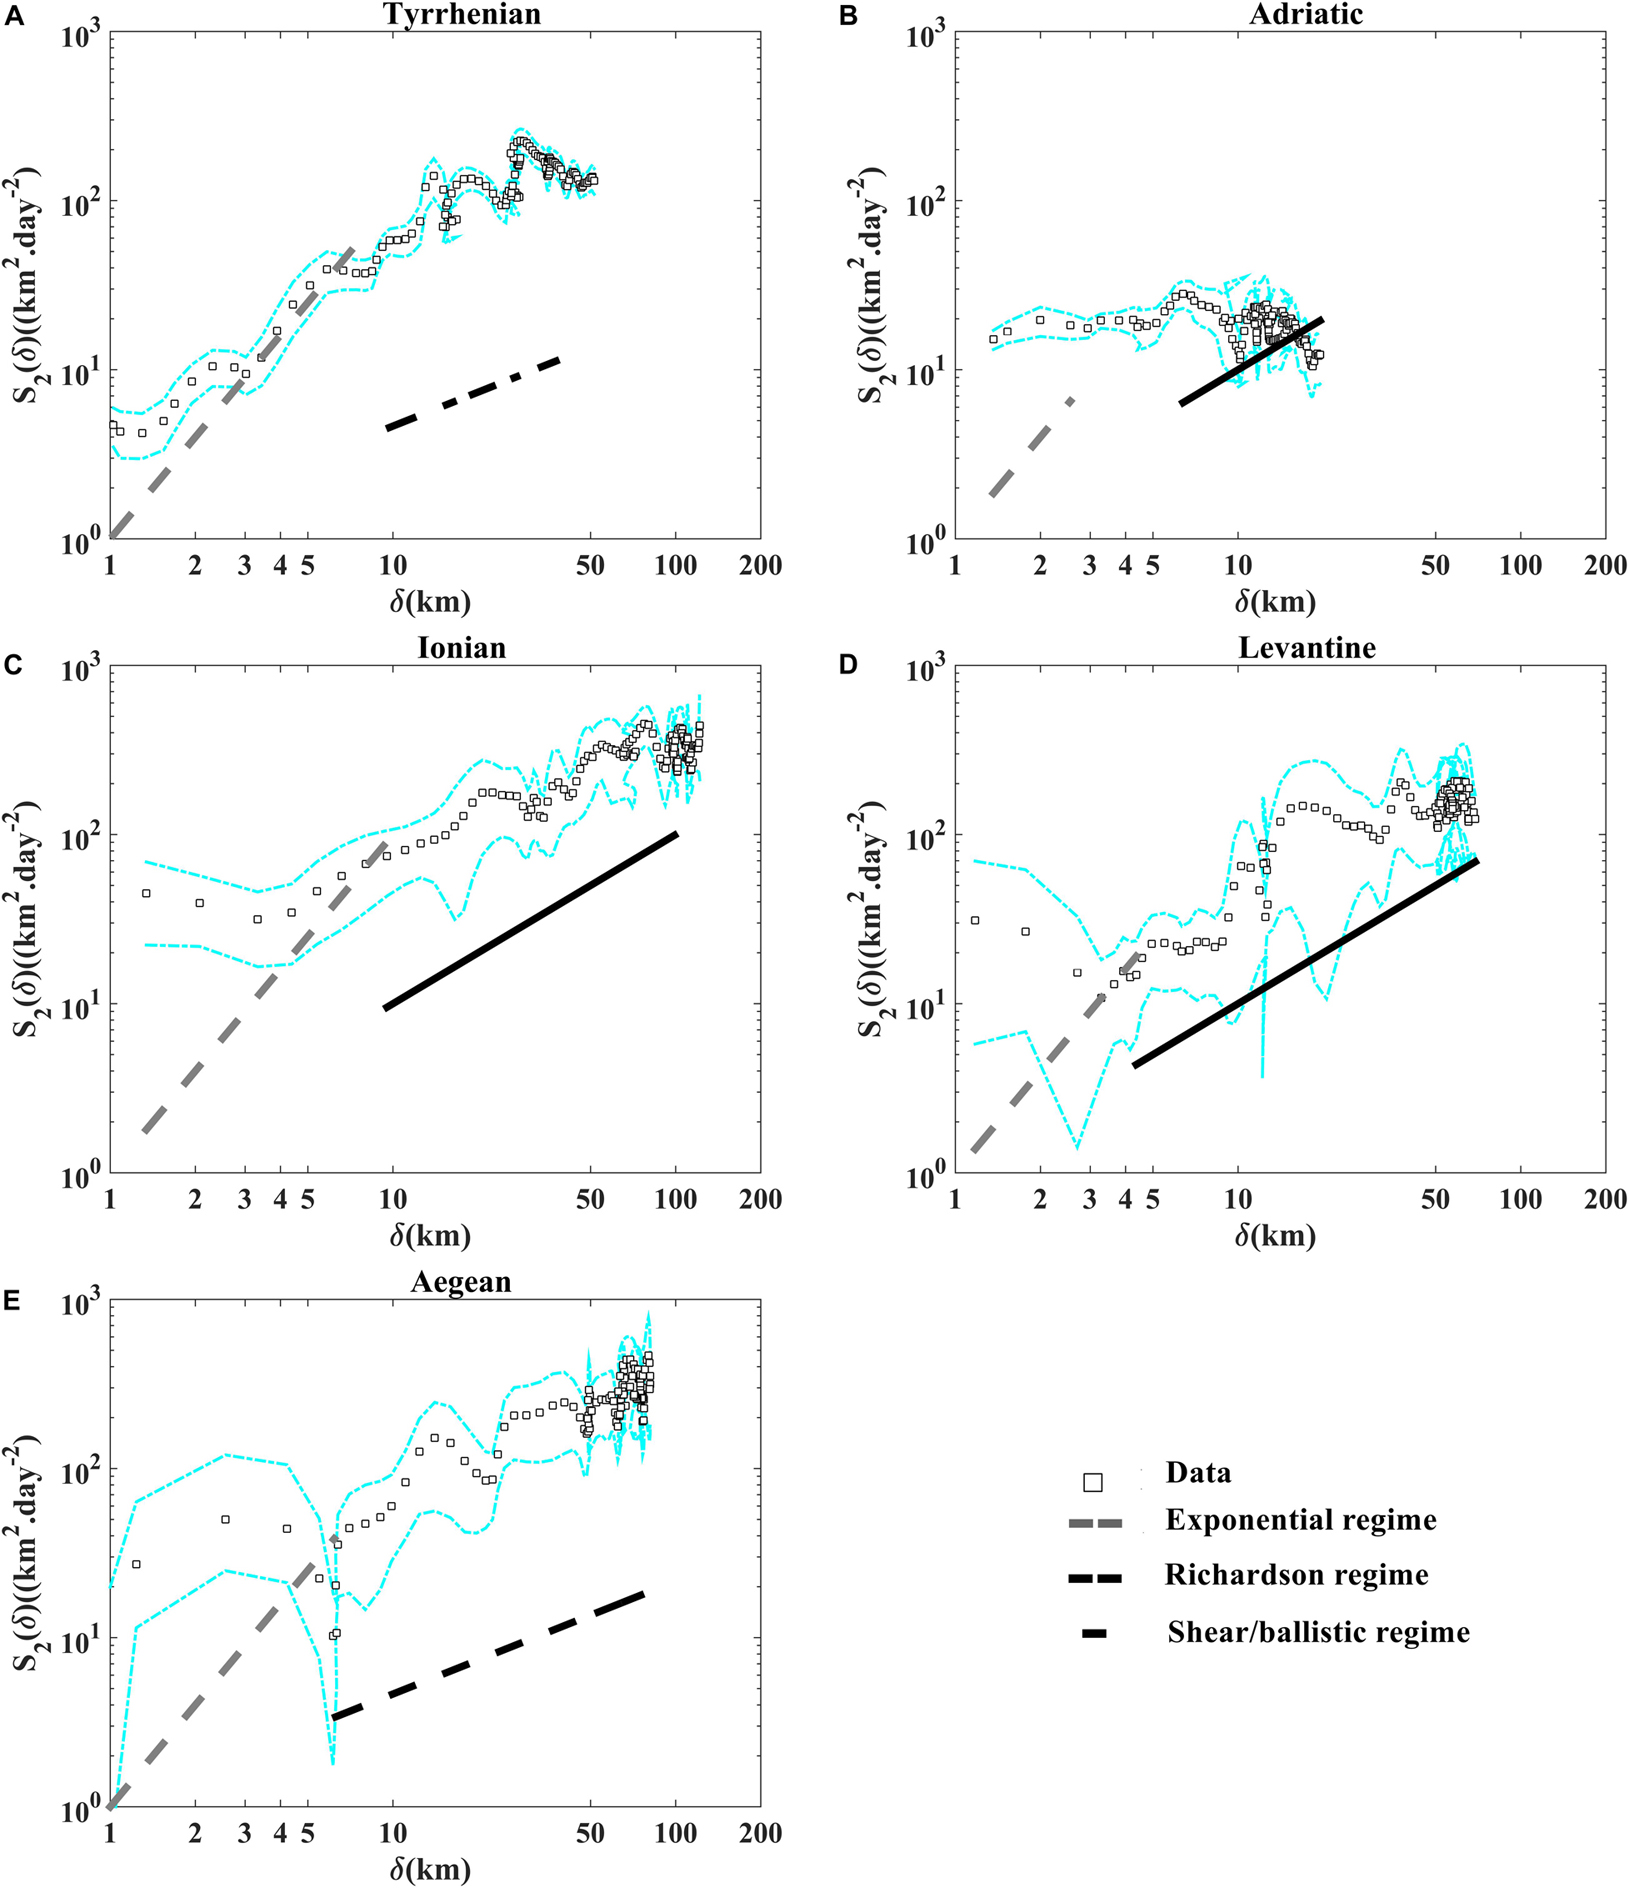
Figure 11. Second-order structure function versus separation distance (A) in the Tyrrhenian, (B) the Adriatic, (C) the Ionian, (D) the Levantine, and (E) the Aegean sub-basins. The exponential, the Richardson and the shear/ballistic regimes are shown with the dashed gray, dashed black and black lines, respectively. The dashed cyan lines indicate the 90% confidence intervals from bootstrap resampling, give a rough idea of the uncertainties for the statistics.
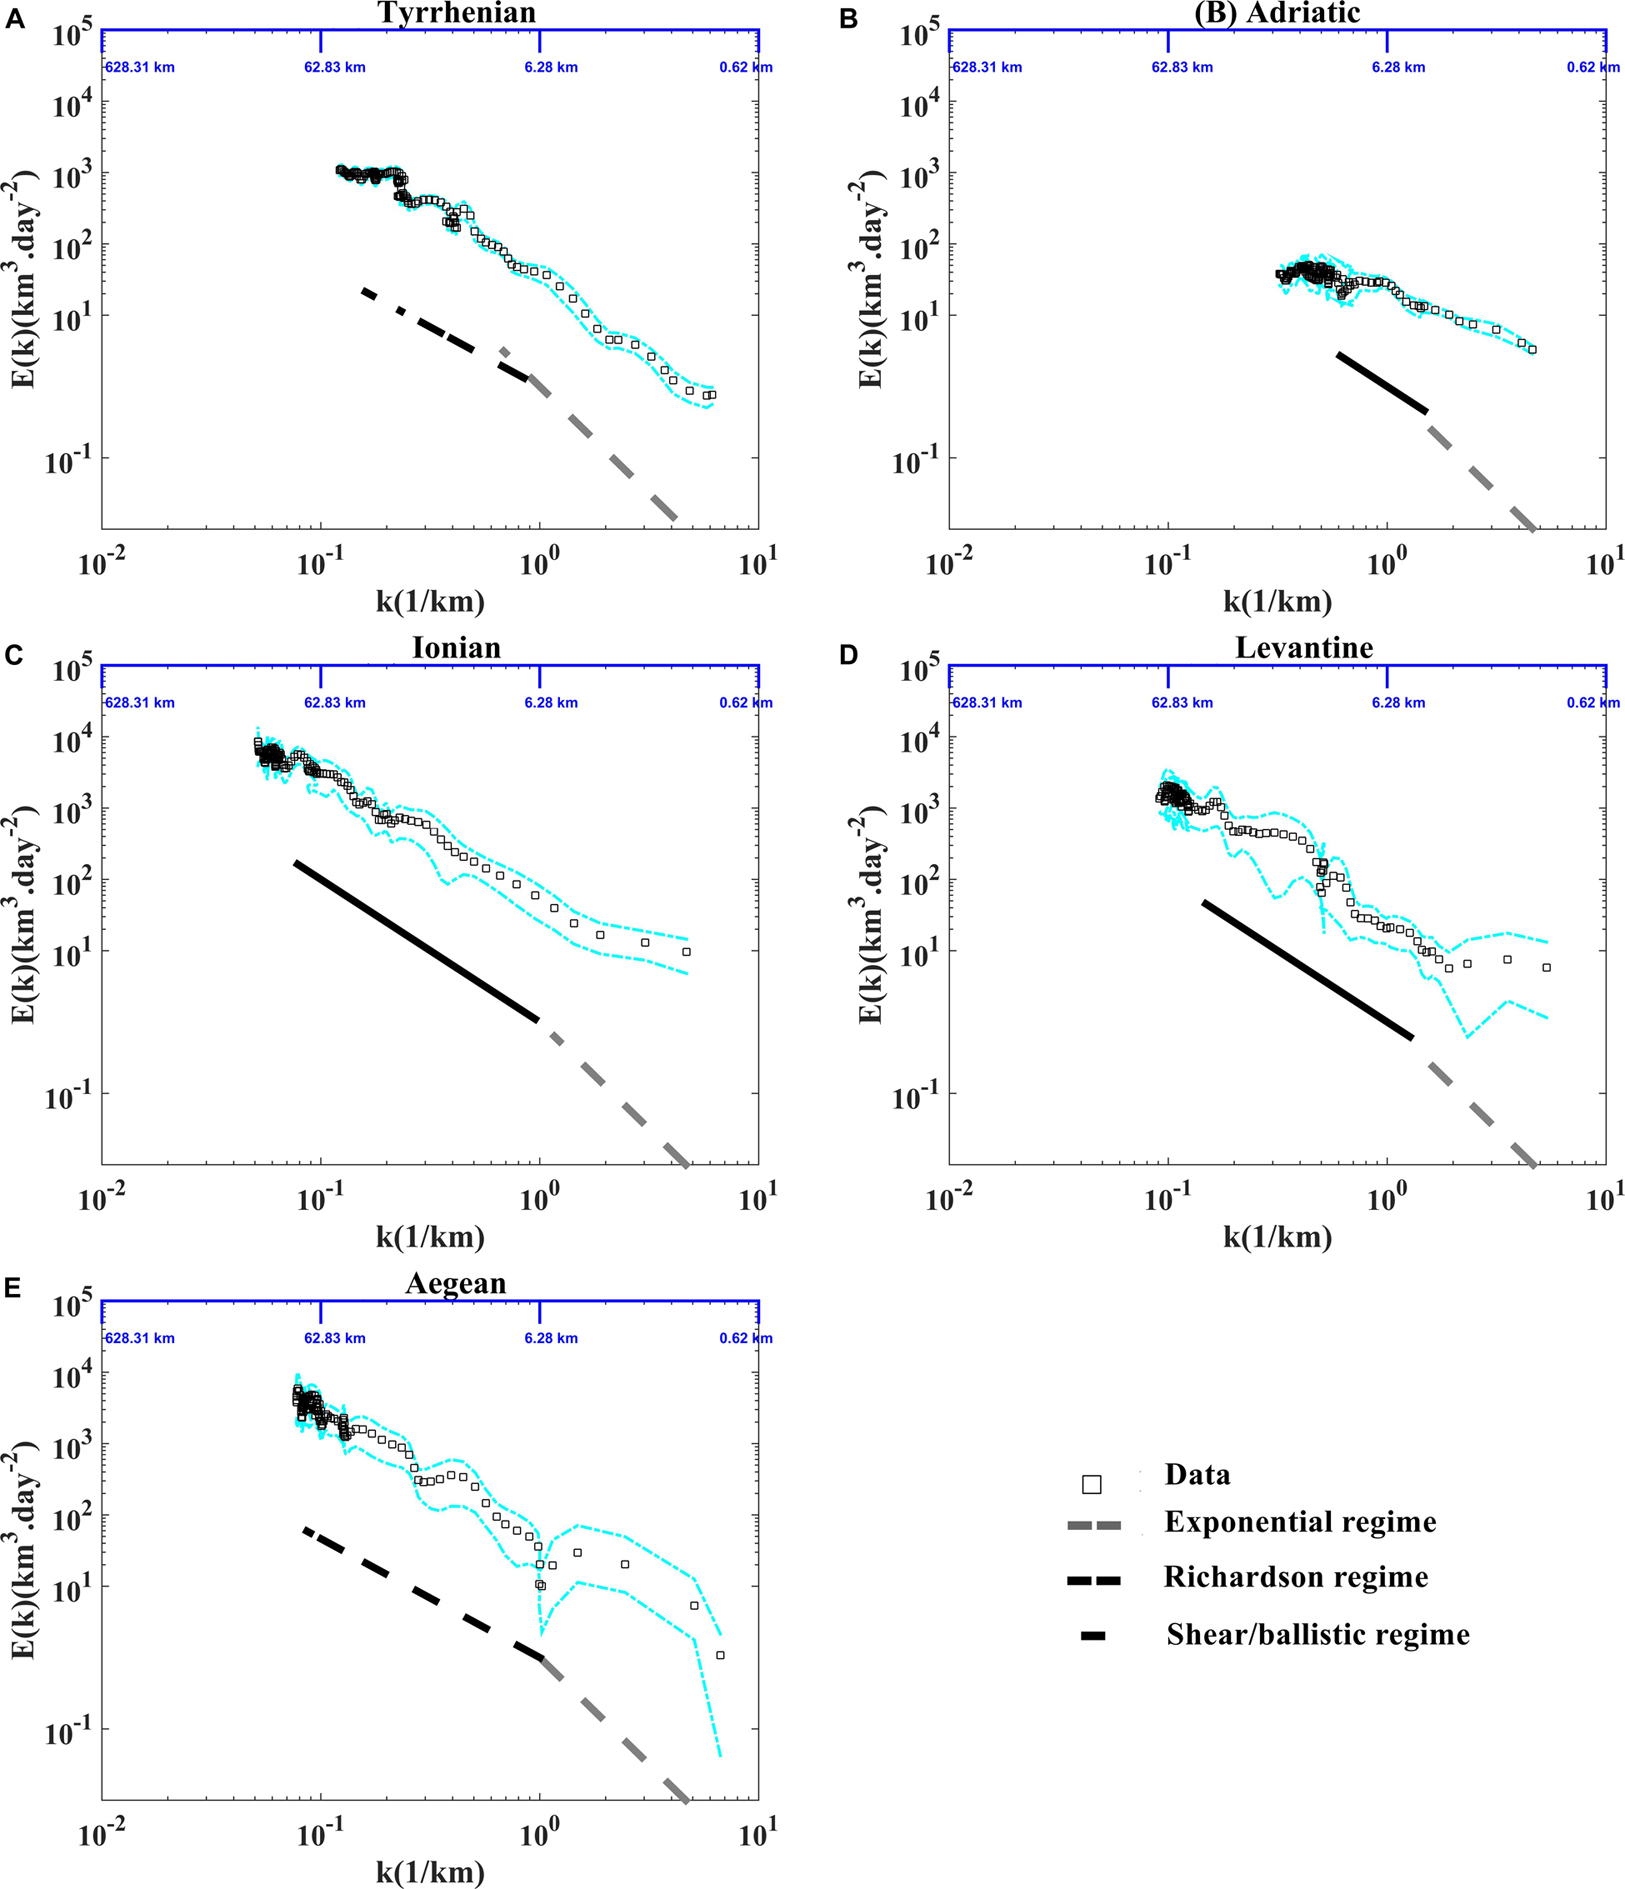
Figure 12. Energy spectra in function of wave number (A) in the Tyrrhenian, (B) the Adriatic, (C) the Ionian, (D) the Levantine, and (E) the Aegean sub-basins. The exponential, the Richardson and the shear/ballistic regimes are shown with the dashed gray, dashed black and black lines, respectively. The dashed cyan lines indicate the 90% confidence intervals from bootstrap resampling, give a rough idea of the uncertainties for the statistics.
Discussion
In this study we highlighted the occurrence of surface absolute and relative dispersion regimes related to the presence of coherent Mediterranean structures and currents. The absolute dispersion curves show anisotropic surface flow where the zonal motion is dominant in all Mediterranean sub-basins and an isotropic Aegean surface flow over the last 20 days, indicating that the flow is more homogeneous in this region than in the other sub-basins. The occurrence of anomalous elliptic (5/3) and hyperbolic (5/4) regimes is observed due to the influence of the coherent structures. The occurrence of these anomalous regimes was studied and detected in the WWM by Bouzaiene et al. (2018). Anomalous regimes were never studied before in Mediterranean sub-basins from Lagrangian drifters. Hence, we analyze the presence of these anomalous regimes in five Mediterranean sub-basins (Tyrrhenian, Adriatic, Ionian, Levantine and Aegean). The absolute dispersion curves show the hyperbolic regime in the Adriatic sub-basin and outline the dominance of elliptic regime in the other regions. The (5/4) regime is detected only in the Adriatic sub-basins because the majority of particles were advected along the WAC and the outer part of the Adriatic gyres for a strong stretching (deformation) as presented in the (Figure 2B), while the (5/3) regime is observed in the other sub-basins when numerous particles are located in the domains characterized by strong rotation (eddies and gyres) as is evident in the (Figures 2A,C,D,E).
The main relative dispersion results are summarized in Figure 13. The initial pair separation (D0 < 2 km) is smaller than the internal Rossby radius of deformation, giving information on the Coriolis Effect on the relative dispersion regimes. The non-local exponential regime is confirmed from all the relative dispersion statistics (relative dispersion, relative diffusivity, second-order structure function and energy spectra). This non-local regime is observed only in the Tyrrhenian sub-basin for scales comparable or less than 5 km (Figure 13B) because the majority of drifter pairs are located in the Tyrrhenian coherent structures (see Figure 3A). This result denotes the advection of particles by eddies with scales larger than their separation distances in the Tyrrhenian Sea. On the other hand, this regime is absent in the Ionian, the Adriatic and the Aegean sub-basins. The absence of the non-local regime in the other sub-basins can be related to methodological reasons, i.e., the potential inhomogeneous sampling of chance pairs as discussed in Lumpkin and Elipot (2010), and/or to a qualitatively different dispersion regimes at the submesoscale (Sansón, 2015) among the Mediterranean sub-basins. Not all these submesoscale flows are accurately resolved by the drifter dataset (Sansón, 2015). In the Adriatic Sea the presence of strong boundary currents induce the occurrence of local shear/ballistic regime, confirmed with all relative dispersion statistics, for scales ∼DI according to the results of Poulain et al. (2013). The shear/ballistic regime is observed also in the Ionian and Levantine regions, where the drifter pairs was advected from the boundary currents along the northern Ionian, Sicily Channel and the eastern Levantine coasts (Figures 2C,D, 13). The Richardson regime takes place for space scale comparable to the Internal Rossby radius in the Tyrrhenian and the Aegean sub-basins (Figure 13B) and the pair separation distances are comparable to the scales of dominated eddies.
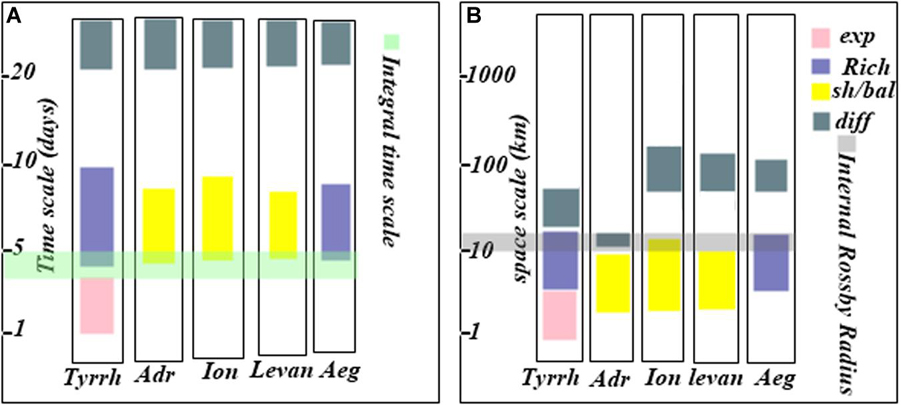
Figure 13. Occurrence of different relative dispersion regimes in the Tyrrhenian, the Adriatic, the Ionian, the Levantine and the Aegean sub-basins as a function of the time scale (A) and space scale (B). The colors are referred to relative dispersion regimes as follow: pink = exponential regime, blue-gray = Richardson regime, yellow = shear/ballistic regime and pale-blue = diffusive regime. The light green and gray colors indicate the integral time scale and the internal Rossby radius of deformation, respectively.
The relative diffusivities are calculated in two ways. In the first way, it is deduced from the derivative of relative dispersion in time (Figure 9) as suggested by Bouzaiene et al. (2018). It shows the presence of diffusive regime for large scales (when the pair velocities become uncorrelated) ∼50–100 km in four Mediterranean sub-basins (Tyrrhenian, Ionian, Levantine and Aegean), with the exception of the Adriatic Sea where the maximum pair separation distance after thirty days Dmax is about 20 km. The lower diffusivity value is related to the limited size of the Adriatic basin where the pair velocities are still correlated (Figure 8B). The relative diffusivity in the last case fluctuates around of a constant value but it was not equivalent to twice of the absolute diffusivity 2k(t)(1) because the majority of the pair velocities are correlated (Figures 8B, 9B), the relative diffusivity would enter in the diffusive regime for scales comparable or larger than DI (Figure 9B). The relative diffusivity presented in the second way is calculated from the second-order structure function and it appears less noisy than the first one (Figure 10). The two semi enclosed sub-basins (Adriatic and Aegean) show different behaviors related to the difference in the dynamics and eddy properties in each regions. Furthermore, the coastal Adriatic jets close to the large boundaries influence strongly the dispersion.
Conclusion
In this paper we present the dispersion analysis carried out in five Mediterranean sub-basins (Tyrrhenian, Adriatic, Ionian, Levantine and Aegean sub-basins). The analysis reveals the differences and similarities in term of surface dispersion regimes between the different sub-basins.
Quasi-ballistic and quasi-random walk regimes are observed at small and large time scales, respectively. A discrepancy between these two regimes and the two theoretical turbulent laws is observed, due to the non-uniform and non-stationary nature of the drifter dataset. The absolute dispersion shows that the surface Mediterranean flow is anisotropic in the five sub-basins while it seems to be isotropic in the Aegean sub-basin during the random-walk regime. The anomalous regimes (hyperbolic 5/4 and elliptic 5/3) are observed at intermediate time scales (2–15 days).
The surface relative dispersion shows the presence of an exponential relative dispersion regime for time scale smaller than the integral time scale (3 < TL < 5) days and for space scales below the internal Rossby Radius of deformation DI in the Tyrrhenian sub-basin (see, Figures 13A,B) with the presence of an enstrophy cascade range. For scales comparable to TL and DI, the relative dispersion implies the occurrence of the Richardson regime in the Tyrrhenian and Aegean sub-basins for the presence of an inverse cascade range (Figures 13A,B), while the shear/ballistic regime is observed in the other sub-basins (Figures 13A,B). For large time and space scales, the relative dispersion follows the diffusive regime (Figures 13A,B).
The results of this work improve our understanding of the surface dispersion mechanisms in the Mediterranean sub-basins and support the utility of Lagrangian data in the dispersion analysis of the ocean upper layer. Nowadays, there are still few dispersion studies in the intermediate and deep layers of the ocean. In the Western Mediterranean Sea numerical simulations have showed a decrease of the intermediate dispersion range with depth, due to the weaker influence of the vortices (Elhmaidi et al., 2010; Nefzi et al., 2014), but there are no specific studies on different types of regimes or comparisons between the different sub-basins. Previous analysis using in situ data for dispersion studies in the intermediate layer are reported in Price et al. (1987), LaCasce and Bower (2000), and Rudnickas et al. (2019). These authors use data of SOFAR and/or RAFOS floats in the Gulf Stream and North Atlantic. Roach et al. (2016, 2018) demonstrated that a two-particle analysis of Argo float trajectories produces robust estimates of horizontal mixing in the Southern Ocean and in the global ocean at float parking depth (nominally 1000 m). The method proposed here can also be applied to the Argo float trajectories available in the Mediterranean Sea (parking depth of 750 m). It would be hoped in the future to study dispersion phenomena at different depths in the Mediterranean Sea, with the help of models but also with in situ data acquired in specific experiments (e.g., using RAFOS floats and Argo floats or SVP drifters with drogue depths below the mixing layer). Such studies could help to understand the influence of deep processes on dispersion phenomena along the water column and their interaction with the surface layer. In this context, the method proposed in the present paper could be adapted to dispersion analysis even in deeper layers and/or to the comparison between different layers.
Data Availability Statement
All datasets generated for this study are included in the article/supplementary material.
Author Contributions
MB performed the analysis and wrote most of the manuscript. MM handled the drifter data sets, proposed the topic, supervised the work and took part in writing the manuscript. P-MP was in charge of funding acquisition, supervised and guided the work. AB handled the drifter datasets. DE supervised the manuscript preparation. All authors contributed to the article and approved the submitted version.
Conflict of Interest
The authors declare that the research was conducted in the absence of any commercial or financial relationships that could be construed as a potential conflict of interest.
Acknowledgments
The authors would like to thank all the people who have been involved and have kindly shared their drifter data in the Mediterranean Sea to build this work. Special thanks to Mr. Tarek Nemsi for producing some figures.
Footnotes
References
Artale, V., Boffetta, G., Celani, A., Cencini, M., and Vulpiani, A. (1997). Dispersion of passive tracers in closed basins: beyond the diffusion coefficient. Phys. Fluids 9, 3162–3171. doi: 10.1063/1.869433
Aulicino, G., Cotroneo, Y., Olmedo, E., Cesarano, C., Fusco, G., and Budillon, G. (2019). In situ and satellite sea surface salinity in the algerian basin observed through ABACUS glider measurements and BEC SMOS regional products. Remote Sens. 11:1361. doi: 10.3390/rs11111361
Aurell, E., Boffetta, G., Crisanti, A., Paladin, G., and Vulpiani, A. (1997). Predictability in the large: an extension of the concept of Lyapunov exponent. J. Phys. A Math. Gen. 30, 1–26. doi: 10.1088/0305-4470/30/1/003
Babiano, A., Basdevant, C., and Larchevêque, M. (1985). Fonction de structure et spectre lagrangiens d’un écoulement turbulent bidimensionnel. C. R. Acad. Sci. Paris 300, 195–198.
Babiano, A., Basdevant, C., LeRoy, P., and Sadourny, R. (1990). Relative dispersion in two-dimensional turbulence. J. Fluid Mech. 214, 535–557. doi: 10.1017/S0022112090000258
Berti, S., and dos Santos, F. A. (2016). Relative dispersion and turbulence in theSouthwestern Atlantic Ocean from drifters data. Chao. Mod. Sim. 1, 9–20.
Beuvier, J., Beranger, K., Lebeaupin Brossier, C., Somot, S., Sevault, F., Drillet, Y., et al. (2012). Spreading of the western Mediterranean deep water after winter 2005: time scales and deep cyclone transport. J. Geophys.Res. Oceans 117:C07022. doi: 10.1029/2011JC007679
Bouzaiene, M., Menna, M., Poulain, P.-M., and Elhmaidi, D. (2018). Lagrangian dispersion characteristics in the Western Mediterranean. J. Mar. Res. 76, 139–161. doi: 10.1357/002224018826473290
Callies, U., Carrasco, R., Floeter, J., Horstmann, J., and Quante, M. (2019). Submesoscale dispersion of surface drifters in a coastal near offshore wind farms. Ocean Sci. 15, 865–889. doi: 10.5194/os-15-865-2019
Chen, R., McClean, J. L., Gille, S. T., and Griesel, A. (2014). Isopycnal eddy diffusivities and critical layers in the Kuroshio Extension from an eddying ocean model. J. Phys. Oceanogr. 44, 2191–2211. doi: 10.1175/JPO-D-13-0258.1
Corrado, R., Lacorata, G., Palatella, L., Santoleri, R., and Zambianchi, E. (2017). General characteristics of relative dispersion in the ocean. J. Scient. Rep. 7:46291. doi: 10.1038/srep46291
D’Ovidio, F., Fernandez, V., Hernandez-Garcia, E., and Lopez, C. (2004). Mixing structures in the mediterranean sea from finite-size lyapunov exponents. Geophys. Res. Lett. 31:L17203. doi: 10.1029/2004GL020328
D’Ovidio, F., Isern-Fontanet, J., Lopez, J., Hernandez-Garcia, E., and Garcia-Ladona, E. (2008). Comparison between Eulerian diagnostics and finite-size Lyapunov exponents computed from altimetry in the Algerian basin. Deep Sea Res. Part I Oceanogr. Res. Pap. 56, 15–31. doi: 10.1016/j.dsr.2008.07.014
Dräger-Dietel, G., Jochumsen, K., Griesel, A., and Badin, G. (2018). Relative dispersion of surface drifters in the benguela upwelling region. J. Phys. Oceanogr. 48, 2325–2341. doi: 10.1175/JPO-D-18-0027.1
Elhmaidi, D., Nefzi, H., Carton, X., and Lili, T. (2010). Particle dispersion in the Western Mediterranean basin. Open Oceanogr. J. 4, 137–143. doi: 10.2174/1874252101004010137
Elhmaidi, D., Provenzale, A., and Babiano, A. (1993). Elementary topology of the two-dimensional turbulence from a Lagrangian viewpoint and single particle dispersion. J. Fluid Mech. 257, 533–558. doi: 10.1017/S0022112093003192
Ferrari, R., and Nikurashin, M. (2010). Suppression of eddy diffusivity across jets in the Southern Ocean. J. Phys. Oceanogr. 40, 1501–1519. doi: 10.1175/2010JPO4278.1
Hansen, D. V., and Poulain, P.-M. (1996). Quality control and interpolations of WOCE-TOGA drifter data. J. Atmos. Ocea. Techn. 13, 900–909. doi: 10.1175/1520-0426(1996)013<0900:qcaiow>2.0.co;2
Koh, T., and Legras, B. (2002). Hyperbolic lines and the stratospheric polar vortex. Chaos 12, 382–394. doi: 10.1063/1.1480442
Koszalka, I., LaCasce, J. H., and Orvik, K. A. (2009). Relative dispersion in the Nordic Seas. J. Mar.Res. 67, 411–433. doi: 10.1357/002224009790741102
LaCasce, J. H. (2008). Statistics from Lagrangian observations. Progr. Oceanogr. 77, 1–29. doi: 10.1016/j.pocean.2008.02.002
LaCasce, J. H. (2010). Relative displacement probability distribution functions from balloons and drifters. 451 J. Mar. Res. 68, 433–457. doi: 10.1357/002224010794657155
LaCasce, J. H., and Bower, A. (2000). Relative dispersion in the subsurface North Atlantic. J. Mar. Res. 58, 863–894. doi: 10.1357/002224000763485737
LaCasce, J. H., and Ohlmann, C. (2003). Relative dispersion at the surface of the Gulf of Mexico. J. Mar. Res. 61, 285–312. doi: 10.1175/JPO-D-16-0105.1
Lacorata, G., Aurell, E., and Vulpiani, A. (2001). Drifter dispersion in the adriatic sea: lagrangian data and chaotic model. Ann. Geophys. 19, 121–129. doi: 10.5194/angeo-19-121-2001
Lumpkin, R., and Elipot, S. (2010). Surface drifter pair spreading in the North Atlantic. J. Geophys. Res. Oceans 115:C12017.
Lumpkin, R., and Pazos, M. (2007). “Measuring surface currents with SVP drifters: the instrument, its data and some results,” in Lagrangian Analysis and Prediction of Coastal and Ocean Dynamics, eds A. Mariano, T. Rossby, and D. Kirwan (Cambridge, MA: Cambridge Univ. Press), 39–67. doi: 10.1017/cbo9780511535901.003
Mauri, E., Sitz, L., Gerin, R., Poulain, P.-M., Hayes, D., and Gildor, H. (2019). On the variability of the circulation and water mass properties in the Eastern Levantine Sea between September 2016–August 2017. Water 11:1741. doi: 10.3390/w11091741
Menna, M., Gerin, R., Bussani, A., and Poulain, P.-M. (2017). The OGS Mediterranean drifter database: 1986-2016. Trieste: OGS. technical report 2017/92 Sez.
Menna, M., Poulain, P.-M., Ciani, D., Doglioli, A., Notarstefano, G., and Gerin, R. (2019a). New insights of the Sicily Channel and Southern Tyrrhenian Sea variability. Water 11:1355. doi: 10.3390/w11071355
Menna, M., Poulain, P.-M., Mauri, E., Sampietro, D., Panzetta, F., Reguzzoni, M., et al. (2013). Mean surface geostrophic circulation of the Mediterranean Sea estimated from GOCE geoid models and Altimetric mean surface: initial validation and accuracy assessment. Bell. Geofisica Teorica Applic. 54, 347–365. doi: 10.4430/bgta0104
Menna, M., Poulain, P.-M., Zodiatis, G., and Gertman, I. (2012). On the surface circulation of the Levantine sub-basin derived from Lagrangian drifters and satellite altimetry data. Deep Sea Res. I Oceanogr. Res. Pap. 65, 46–58. doi: 10.1016/j.dsr.2012.02.008
Menna, M., Suarez, C. R., Civitarese, G., Gacic, M., Poulain, P.-M., and Rubino, A. (2019b). Decadal variations of circulation in the Central Mediterranean and its interactions with mesoscale gyres. Deep Sea Res. II Top. Stud. Oceanogr. 164, 14–24. doi: 10.1016/j.dsr2.2019.02.004
Nefzi, H., Elhmaidi, D., and Carton, X. (2014). Turbulent dispersion properties from a model simulation of the western Mediterranean Sea. J. Ocean Sci. 10, 167–175. doi: 10.5194/os-10-167-2014
Olson, D. B., Kourafalou, V. H., Johns, W. E., Samuels, G., and Veneziani, M. (2007). Aegean surface circulation from a satellite-tracked drifter array. J. Phys. Ocean. 37, 1898–1917. doi: 10.1175/JPO3028.1
Poje, A. C., Özgökmen, T. M., Lipphardt, B. L. Jr., Haus, B. K., Ryan, E. H., Haza, A. C., et al. (2014). Submesoscale dispersion in the vicinity of the Deepwater Horizon spill. Proc. Nat. Acad. Sci. U.S.A. 111, 12693–12698. doi: 10.1073/pnas.1402452111
Politikos, D. V., Ioakeimidis, C., Papatheodorou, G., and Tsiaras, K. (2017). Modeling the fate and distribution of floating litter particles in the Aegean Sea (E. Mediterranean). Front. Mar. Sci. 4:191. doi: 10.3389/fmars.2017.00191
Poulain, P.-M. (1999). Drifter observations of surface circulation in the Adriatic Sea between December 1994 and March 1996. J. Mar. Sys. 20, 231–253. doi: 10.1016/S0924-7963(98)00084-0
Poulain, P.-M. (2001). Adriatic Sea surface circulation as derived from drifter data between 1990 and 1999. J. Mar. Sys. 29, 3–32. doi: 10.1016/S0924-7963(01)00007-0
Poulain, P.-M., Bussani, A., Gerin, R., Jungwirth, R., Mauri, E., Menna, M., et al. (2013). Mediterranean surface currents measured with drifters: from basin to sub inertial scales. J. Oceanogr. Soc. 26, 38–47. doi: 10.5670/oceanog.2013.03
Poulain, P.-M., and Gerin, R. (2019). Assessment of the water-following capabilities of CODE drifters based on direct relative flow measurements. J. Atm. Ocean 36, 621–633. doi: 10.1175/JTECH-D-18-0097.1
Poulain, P.-M., Gerin, R., Rixen, M., Zanasca, P., Teixeira, J., Griffa, A., et al. (2012a). Aspects of the surface circulation in the Liguro-Provençal basin and Gulf of Lion as observed by satellite-tracked drifters (2007-2009). B. Geofis. Teor. Appl. 53, 261–279. doi: 10.5194/osd-9-3521-2012
Poulain, P.-M., Menna, M., and Mauri, E. (2012b). Surface geostrophic circulation of the Mediterranean Sea derived from drifter and satellite altimeter data. J. Phys. Oceanogr. 42, 973–990. doi: 10.1175/JPO-D-11-0159.1
Poulain, P. M., and Niiler, P. P. (1989). Statistical analysis of the surface circulation in the California 496 current system using satellite-tracked drifters. J. Phy. Oceanogr. 19, 1588–1603. doi: 10.1175/1520-0485(1989)019<1588:saotsc>2.0.co;2
Price, J. F., McKee, T. M., Owens, W. B., and Valdes, J. R. (1987). Site L SOFAR floats experiment, 1982–1985. Woods Hole Oceanographic Institution Technical Report, WHOI-, WHOI-97-52. Woods Hole, MA: WHOI.
Renault, L., Oguz, T., Pascual, A., Vizoso, G., and Tintore, J. (2012). Surface circulation in the Alboran Sea (western Mediterranean) inferred from remotely sensed data. J. Geophys. Res 117:C08009. doi: 10.1029/2011JC007659
Roach, C. J., Balwada, D., and Speer, K. (2016). Horizontal mixing in the Southern Ocean from Argo float trajectories. J. Geophys. Res. Oceans 121, 5570–5586. doi: 10.1002/2015JC011440
Roach, C. J., Balwada, D., and Speer, K. (2018). Global observations of horizontal mixing from Argo float and surface drifter trajectories. J. Geophys. Res. Oceans 123, 4560–4575. doi: 10.1029/2018JC013750
Rudnickas, D. Jr., Palter, J., Hebert, D., and Rossby, H. T. (2019). Isopycnal mixing in the North atlantic oxygen minimum zone revealed by RAFOS floats. J. Geophys. Res. Oceans 124, 6478–6497. doi: 10.1029/2019JC015148
Sansón, L. Z. (2015). Surface dispersion in the Gulf of California. J. Prog. Oceanogr. 137, 24–37. doi: 10.1016/j.pocean.2015.04.008
Sansón, L. Z., Perez-Brunius, P., and Sheinbaum, J. (2017). Surface relative dispersion in the southwestern Gulf of Mexico. J. Phys. Oceanogr. 47, 387–403.
Schroeder, K., Haza, A. C., Griffa, A., Ozgoekmen, T. M., Poulain, P.-M., Gerrin, R., et al. (2011). Relative dispersion in the Ligure-Provençal basin: from sub-mescoscale to mesoscale. J. Deep Sea Res. I Oceanogr. Res. Pap. 58, 209–228. doi: 10.1016/j.dsr.2010.11.004
Sybrandy, A. L., and Niiler, P. P. (1991). WOCE/TOGA Lagrangian Drifter Construction Manual. SIO Ref. 91/6, WOCE Rep. No. 63. San Diego, CA: Scripps Institution of Oceanography.
Theocharis, A., Balopoulos, E., Kioroglou, S., Kontoyiannis, H., and Iona, A. (1999). A synthesis of the circulation and hydrography of the south Aegean Sea and the Straits of the Cretan Arc (March 1994-January 1995). Progr. Ocean. 44, 469–509. doi: 10.1016/S0079-6611(99)00041-5
Tintoré, J., Pinardi, N., Álvarez-Fanjul, E., Eguiar, E., Álvarez-Berastegui, E., Aguinar, E., et al. (2019). Challenges for sustained observing and forecasting systems in the Mediterranean sea. Front. Env. Sci. 6:568. doi: 10.3389/fmars.2019.00568
Keywords: Mediterranean sub-basins, eddies, drifters, absolute dispersion, relative dispersion
Citation: Bouzaiene M, Menna M, Poulain P-M, Bussani A and Elhmaidi D (2020) Analysis of the Surface Dispersion in the Mediterranean Sub-Basins. Front. Mar. Sci. 7:486. doi: 10.3389/fmars.2020.00486
Received: 17 February 2020; Accepted: 02 June 2020;
Published: 26 June 2020.
Edited by:
Vincenzo Artale, Italian National Agency for New Technologies, Energy and Sustainable Economic Development (ENEA), ItalyReviewed by:
Ru Chen, Tianjin University, ChinaLei Zhou, Shanghai Jiao Tong University, China
Andrew Poje, The Graduate Center, The City University of New York, United States
Copyright © 2020 Bouzaiene, Menna, Poulain, Bussani and Elhmaidi. This is an open-access article distributed under the terms of the Creative Commons Attribution License (CC BY). The use, distribution or reproduction in other forums is permitted, provided the original author(s) and the copyright owner(s) are credited and that the original publication in this journal is cited, in accordance with accepted academic practice. No use, distribution or reproduction is permitted which does not comply with these terms.
*Correspondence: Maher Bouzaiene, maherbouzaiene73@gmail.com