Rock Magnetic Cyclostratigraphy of Permian Loess in Eastern Equatorial Pangea (Salagou Formation, South-Central France)
 Lily S. Pfeifer1*
  Linda Hinnov2
  Christian Zeeden3
  Christian Rolf3
  Christian Laag3,4 Gerilyn S. Soreghan1
- 1School of Geosciences, The University of Oklahoma, Norman, OK, United States
- 2Department of Atmospheric, Oceanic, and Earth Sciences, George Mason University, Fairfax, VA, United States
- 3Leibniz Institute for Applied Geophysics, Hanover, Germany
- 4Institut de Physique du Globe de Paris (IPGP), CNRS, Université de Paris, Paris, France
We present the findings from analysis and modeling of a stratigraphic series of magnetic susceptibility (MS) data measured with a portable MS meter from the Permian Salagou Formation loessite (south-central France). The results reveal discernible Milankovitch-scale paleoclimatic variability throughout the Salagou Formation, recording astronomically forced climate change in deep-time loessite of eastern equatorial Pangea. Optimal sedimentation rates are estimated to have ranged between 9.4 cm/kyr (lower Salagou Formation) and 13 cm/kyr (mid-upper Salagou Formation). A persistent 10-m-thick cyclicity is present that likely represents orbital eccentricity-scale (∼100 kyr) variability through the middle to late Cisuralian (ca. 285—275 Ma). Subordinate, higher frequency cycles with thicknesses of ∼3.3–3.5 and ∼1.8 m appear to represent obliquity and precession-scale variability. If the driver of magnetic enhancement is pedogenic, then the ∼10 m thick cyclicity that is consistent over ∼1000 m of section may represent the thickness of loessite–paleosol couplets in the Salagou Formation. Laboratory rock magnetic data show generally low magnetic enhancement compared to analogous Eurasian Quaternary loess deposits. This is related to the predominance of hematite (substantially weaker signal than magnetite or maghemite) in the Salagou Formation which may be explained by different conditions of formation (e.g., syn depositional processes, more arid, and/or oxidizing climate conditions) than in present Eurasia and/or post depositional oxidation of magnetite and maghemite.
Introduction
Loess-paleosol sequences of the Chinese Loess Plateau (CLP; thickness of ∼200 m) and other regions (e.g., Li et al., 2019) are widely regarded as high-resolution and continuous continental records of global Pleistocene climate change (e.g., Liu, 1985; Heller and Liu, 1986; Kukla, 1987; Kukla et al., 1988; Kukla and An, 1989; Maher and Thompson, 1991, 1992; Evans and Heller, 2001; Yang and Ding, 2004; Muhs, 2007; Maher and Possolo, 2013; Maher, 2016). These quasi-cyclic loess-paleosol deposits commonly record a combination of glacial-interglacial oscillations and changes in monsoonal precipitation, and trends in their magnetic susceptibility (MS) correlate with marine-based oxygen isotope records of continental ice volume (Heller and Liu, 1982; Kukla et al., 1988; Shackleton et al., 1990; Parrish, 1993; Porter, 2001; Porter et al., 2001; Basarin et al., 2014; Ahmed and Maher, 2017; Zeeden et al., 2018).
Thick loessite deposits have also been associated with the Late Paleozoic Ice Age (e.g., Murphy, 1987; Johnson, 1989; Kessler et al., 2001; Mack and Dinterman, 2002; Soreghan et al., 2002; Tramp et al., 2004; Soreghan and Soreghan, 2007; Soreghan et al., 2008a, b; Soreghan G. S. et al., 2014; Soreghan M. J. et al., 2014; Giles et al., 2013; Sweet et al., 2013; Foster et al., 2014; Pfeifer et al., 2020). Voluminous paleo-loess accumulated in low latitudes of western and eastern Pangea and are exposed today in the western United States (exceeding 700 m thick) and western Europe (up to ∼1500 m thick in southern France). Loessite–paleosol intercalations in the deep-time record of western equatorial Pangea have been posited to represent icehouse glacial-interglacial oscillations on a 100 kyr-scale (Soreghan et al., 1997, 2002; Soreghan M. J. et al., 2014; Tramp et al., 2004), as well as higher frequency climatic signals occurring on obliquity and possibly precession scales (Soreghan M. J. et al., 2014). Recently, a radioisotopically-dated lower Guadalupian cyclic lacustrine record from the Junggar Basin of eastern Pangea (30—32°N paleolatitude) was discovered to exhibit astronomical frequencies (Huang et al., 2020). Importantly, this new evidence supports the hypothesis explored in this work for presumably analogous Milankovitch cycles recorded in the thick (∼1000 m) record of upper Paleozoic loess in eastern equatorial Pangea.
The objectives of this work are to (1) document Permian climatic variability and assess Milankovitch characteristics using MS data from the Salagou Formation loessite obtained with a portable MS meter, (2) leverage laboratory rock magnetic measurements to better understand the origin of the magnetic signal, and (3) compare this upper Paleozoic record with analogous successions from the Eurasian Quaternary record.
Geological Setting
The Permian Salagou Formation is an exclusively fine-grained and internally massive deposit of red mudstone with local pedogenic overprinting and water-reworked interbeds that accumulated in the Lodève continental rift basin at equatorial latitudes (0–3°N; Domeier and Torsvik, 2014; Muttoni and Kent, 2019). Its characteristics are most consistent with eolian transport and deposition either as loess, or as dust deposited in a seasonal, shallow lacustrine environment (Pfeifer et al., 2020). The provenance of the Salagou Formation is the Montage Noire Dome, a local uplift of Variscan basement composed of gneiss, schist, and granite (Figure 1; Pfeifer et al., 2016). The recognition of great volumes of loess-sized silt, together with known coarse-grained granitic protoliths and deposition during global icehouse conditions, are all most consistent with a hypothesis of upland glaciation in this region (Pfeifer et al., 2020).
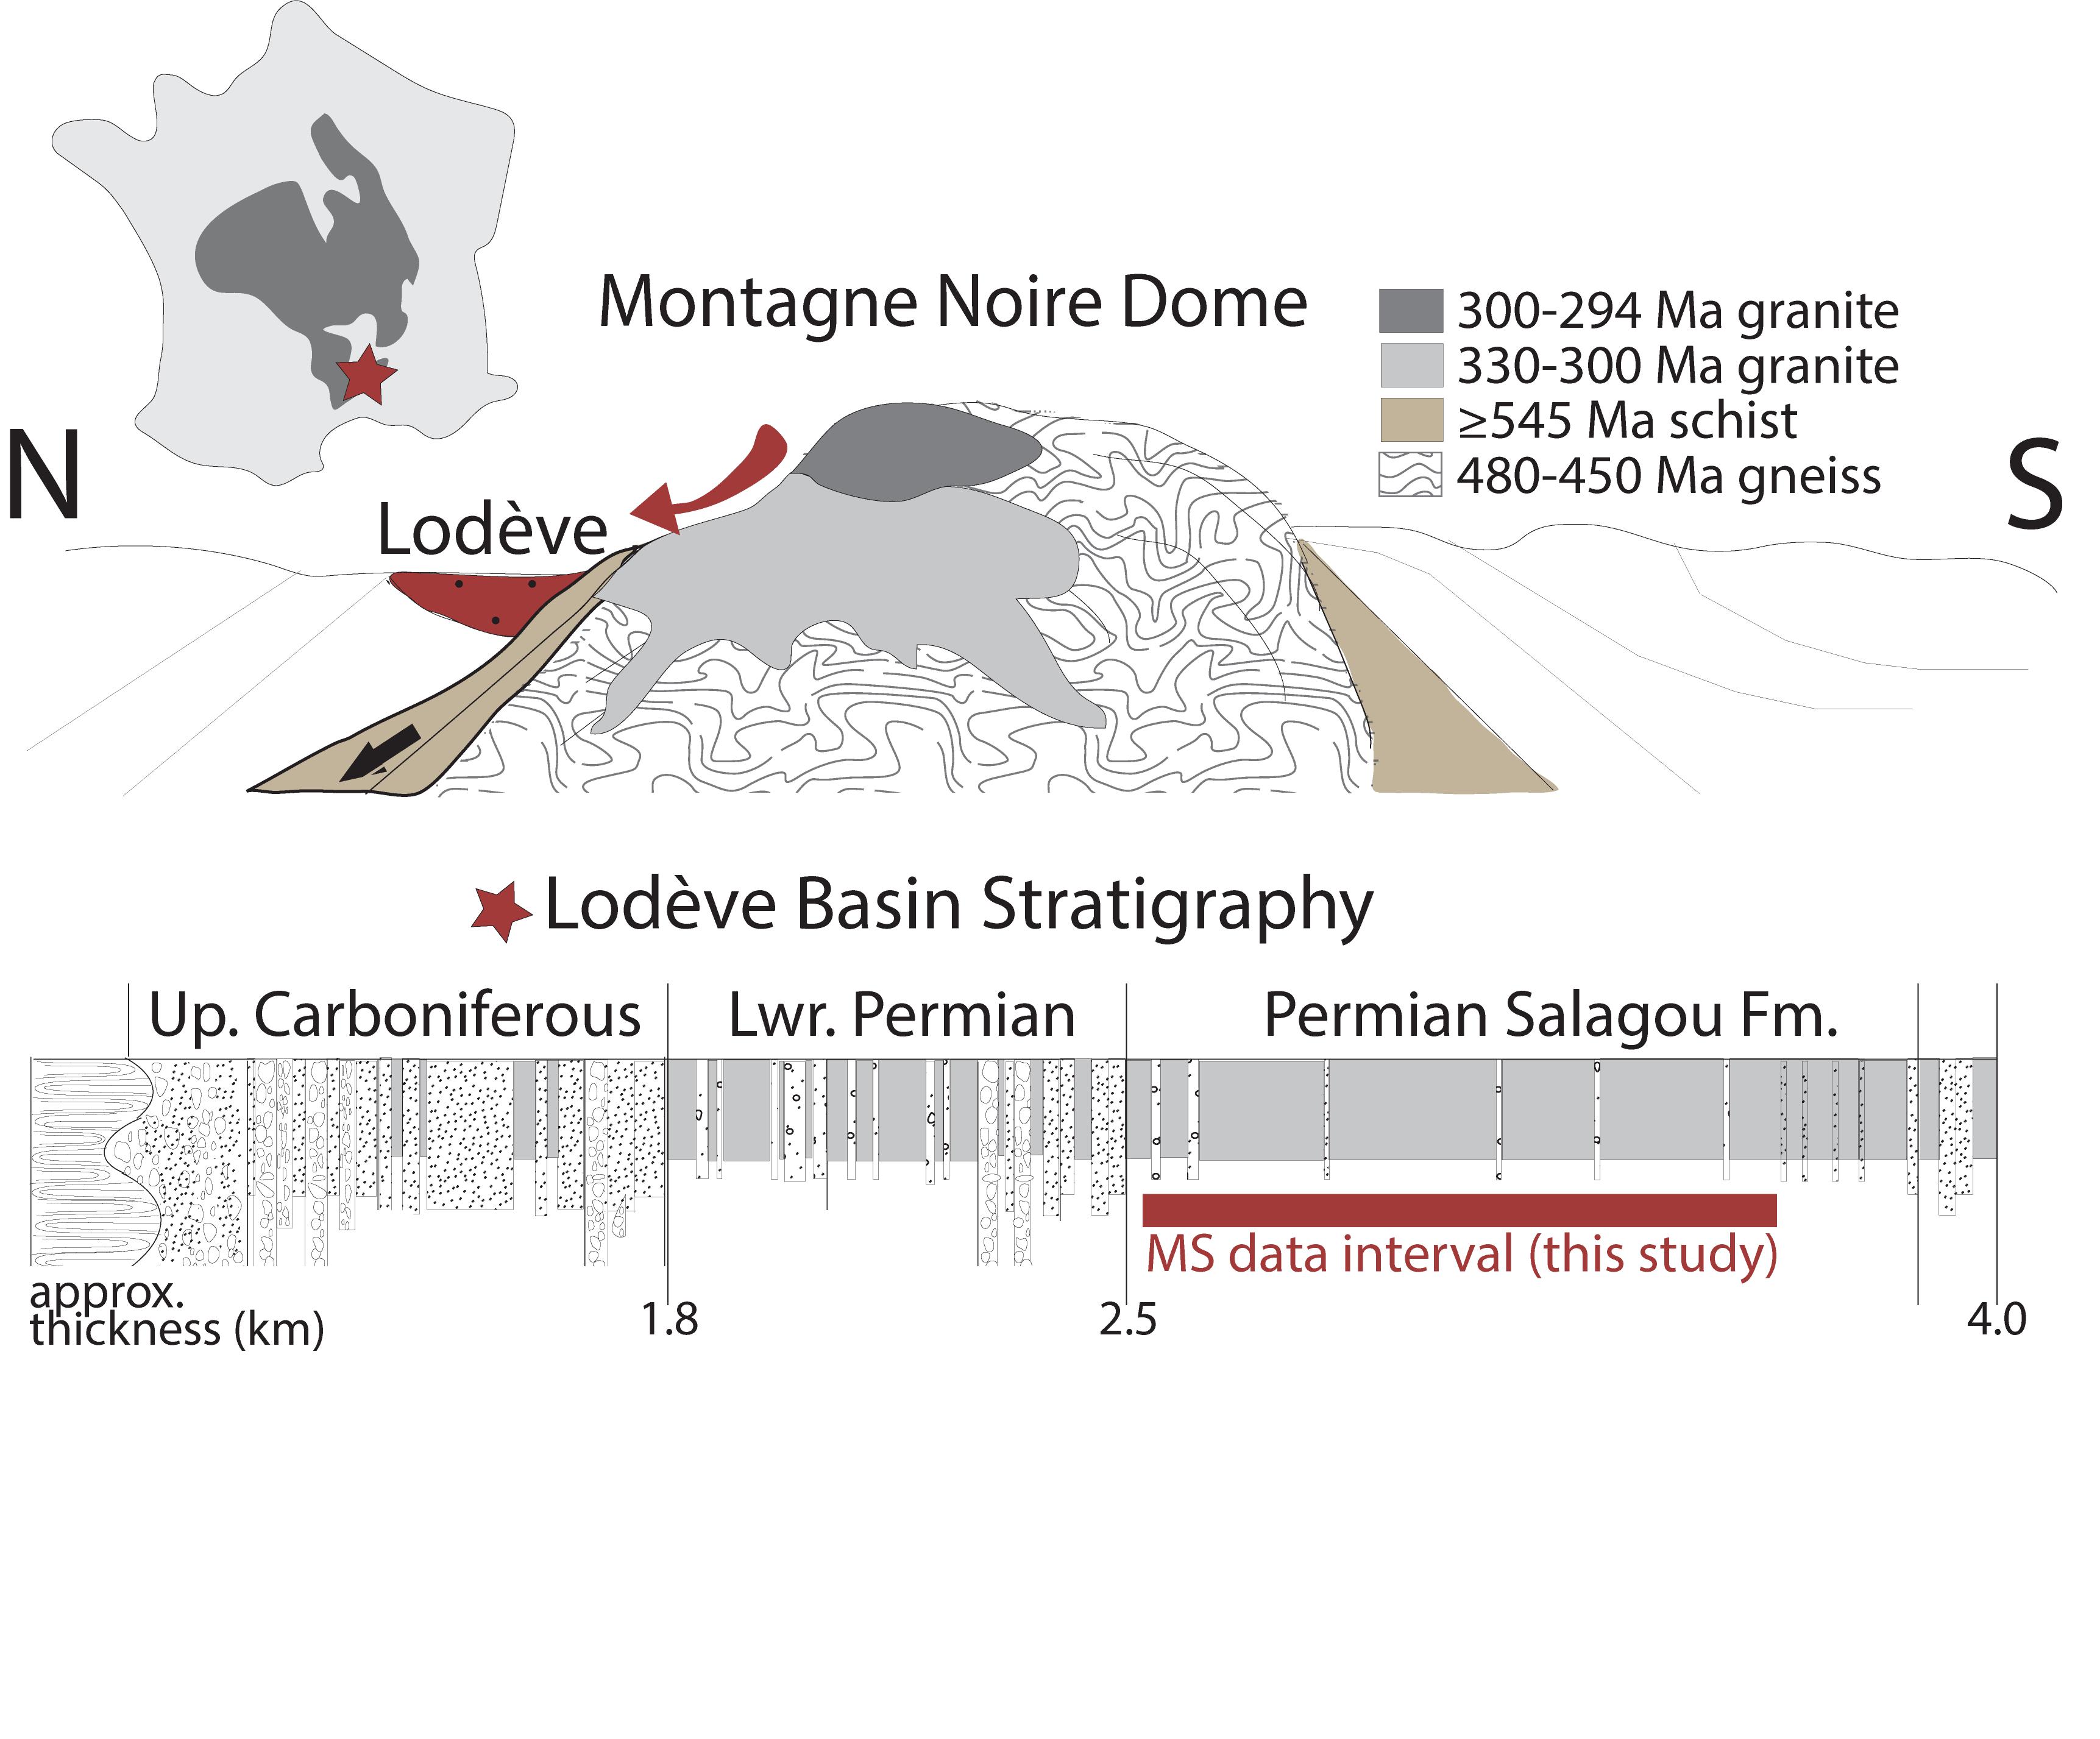
Figure 1. Geological setting of the Lodève Basin in south-central France (southern Massif Central). The N-S cross section depicts the generalized position of the Lodève basin in relation to several source lithologies in the Montagne Noire Dome (interpreted source of sediment in the Lodève Basin; Pfeifer et al., 2016). The generalized stratigraphic column (adapted from Pochat and Van Den Driessche, 2011) of the upper Carboniferous – Permian strata in the Lodève Basin, depicting the stratigraphic interval of focus in this study with a red bar.
The late Artinskian to mid-Kungurian (upper Rotliegend I; Kiersnowski, 2013) age of the lower Salagou Formation (Octon Member) is well constrained by U-Pb ID-TIMS dates from ash layers (Michel et al., 2015; Figure 2). Chronostratigraphic constraints for the top of the formation (Merifons Member) are lacking, so the extent of Guadalupian deposition (cf. Schneider et al., 2006; Pochat and Van Den Driessche, 2011) is unclear. The Octon Member (basal to mid-upper Salagou) makes up the majority of the Salagou Formation and consists primarily of massive red mudstone with loessitic characteristics (Pfeifer et al., 2020). The MS data for this study were collected from the Octon Member to lower Merifons Member (Figures 1, 2; red bar), which represents deposition through the mid-late Cisuralian (ca. 285–275 Ma).
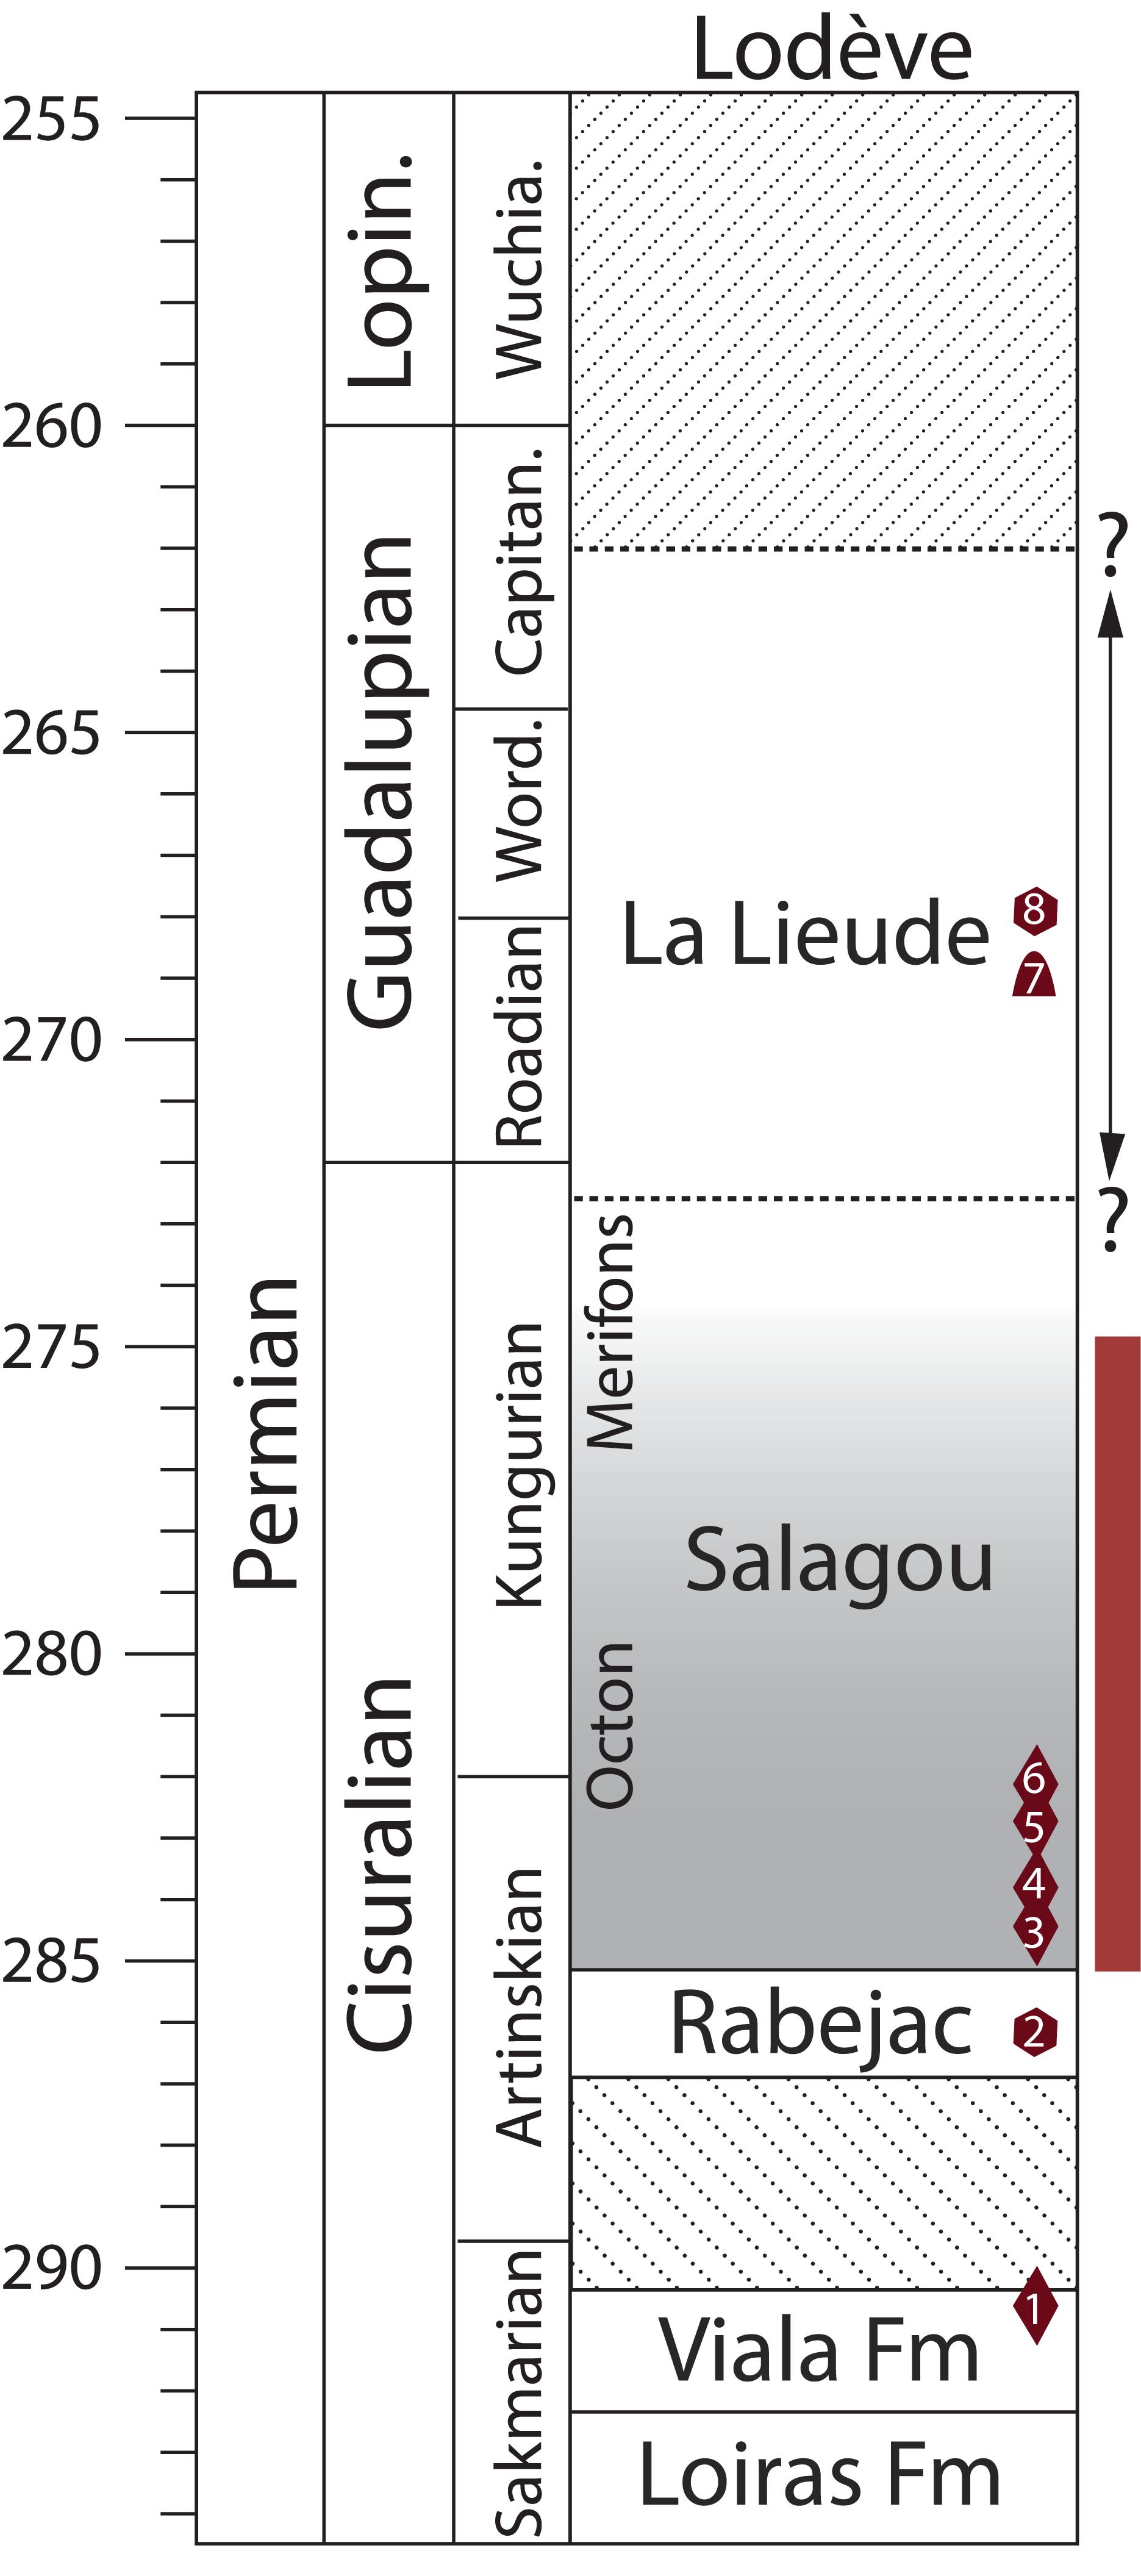
Figure 2. A summary of the current Permian chronostratigraphic constraints of the Salagou Formation (Lodève Basin). The section where MS data were measured in this study is highlighted in gray and also indicated with the red bar. Note that the upper age of the Salagou Formation is very poorly constrained. Icon shapes indicate different types of age data, numbered 1–8 according to the sources from which they are derived; Specifically: (1) U/Pb ID-TIMS on ash 291.0 ± 0.2 from the upper Viala Formation (Michel et al., 2015), (2) tetrapod tracks, Dromopus–Erpetopus biochron boundary, ∼290–284 Ma (Schneider, pers. commun. 2020); (3–6) U/Pb ID-TIMS on ash (in stratigraphic order: 284.4 ± 0.1, 284.5 ± 0.1, 283.5 ± 0.1, 282.9 ± 0.1) from the Octon Member of the Salagou Formation (Michel et al., 2015), (7) magnetostratigraphic data from the La Lieude Formation that suggests proximity to the end of the “Kiaman” or Permo-Carboniferous Reversed Superchron (PCRS), ca. 262 Ma (Evans, 2012), and (8) tetrapod track ichnofauna from the La Lieude Formation consistent with a Guadalupian age (Schneider et al., 2010, 2019).
Magnetic susceptibility has been used as a proxy for climatic signals in both Plio-Pleistocene loess, the Chinese “red clay,” and Permian loessite recording climate-dependent pedogenesis and dust influx (e.g., Heller and Liu, 1984; Maher and Taylor, 1988; Soreghan et al., 1997, 2002; Soreghan M. J. et al., 2014; Tramp et al., 2004). MS measures the concentration and grain size of ferrimagnetic minerals which consist primarily of magnetite, secondarily of maghemite, and supplemented by hematite (e.g., Maher, 1986; Kukla and An, 1989; Porter et al., 2001; Muhs, 2007; Ahmed and Maher, 2017). In saturated, gleyed (reduced) and thus Fe-leached soils, MS values in parent loess can exceed those in pedogenic intervals (e.g., see Muhs, 2007 and the references within; Beget et al., 1990; Hayward and Lowell, 1993; Chlachula, 2003). But otherwise, in situ precipitation of ultra-fine-grained ferrimagnetic material [e.g., super-paramagnetic (SP) magnetite or maghemite] during warmer and wetter interglacial conditions has been widely recognized as a driver of elevated MS in pedogenically altered intervals compared to unaltered parent loess (deposited during arid and dusty glacial periods, and/or phases of monsoonal interference). This is true for both the CLP (cf. Heller and Liu, 1984; Maher and Taylor, 1988; Zhou et al., 1990; Maher and Thompson, 1991, 1992; Zheng et al., 1991; Maher et al., 1994; Porter et al., 2001; Ahmed and Maher, 2017), where bulk MS of paleosols is ∼4–10x higher than in loess (Heller and Liu, 1984, 1986; Liu et al., 1993) and in lower Permian loessite of western equatorial Pangea where bulk MS is commonly ∼1.5–2x (and up to 9x) higher in paleosols relative to loess (Soreghan et al., 1997, 2002; Cogoini et al., 2001; Tramp et al., 2004; Soreghan G. S. et al., 2014). The origin of the magnetic signal in Permian loessite of western equatorial Pangea (e.g., Maroon Formation, CO) is dominantly hematite, but is also driven locally by the inferred presence of submicron SP magnetite (Soreghan et al., 1997; Cogoini et al., 2001; Jia, 2020).
Rock magnetism of Quaternary loess (and loess-based paleosols) has been used as a proxy (directly proportional) for mean annual precipitation (MAP) of ∼300–1500 mm/year (e.g., Porter, 2001; Maher and Possolo, 2013; Maher, 2016; Gao et al., 2019). Depending on the parent material, amount of biological mixing, carbonate leaching, and clay illuviation, soils less penetrable by precipitation in areas with MAP > ∼600 mm may result in water-logged conditions. Together with the presence of organic matter, this promotes anoxia and post-depositional dissolution of (fine) magnetic minerals.
Data and Methods
Magnetic Susceptibility Sampling
Sampling Magnetic Susceptibility in the Field (KT-10)
A detailed sedimentological investigation of the Salagou Formation (Pfeifer et al., 2020) included measurement and description (at a decimeter scale) of ∼1000 total meters of stratigraphic section exposed at the surface (Figure 3). One MS reading (each flanked by free air measurements) was taken every 0.5 m through the entire formation with the Terraplus KT-10 Plus v2 handheld MS meter that includes a pin and circular coil for uneven surfaces. In mathematical terms, MS (k) is the ratio of the intensity of magnetization (I) to the magnetic field (H) responsible for the magnetization. It is calculated with the KT-10 Plus handheld meter based on the difference in frequency between the rock and free air with a sensitivity of 1 × 10⁻⁶ SI units (Kt-10 manual, 2017). Results (k) in dimensionless units of 10–3 are reported as a curve constructed from the individual MS values at 0.5 m increments through each section.
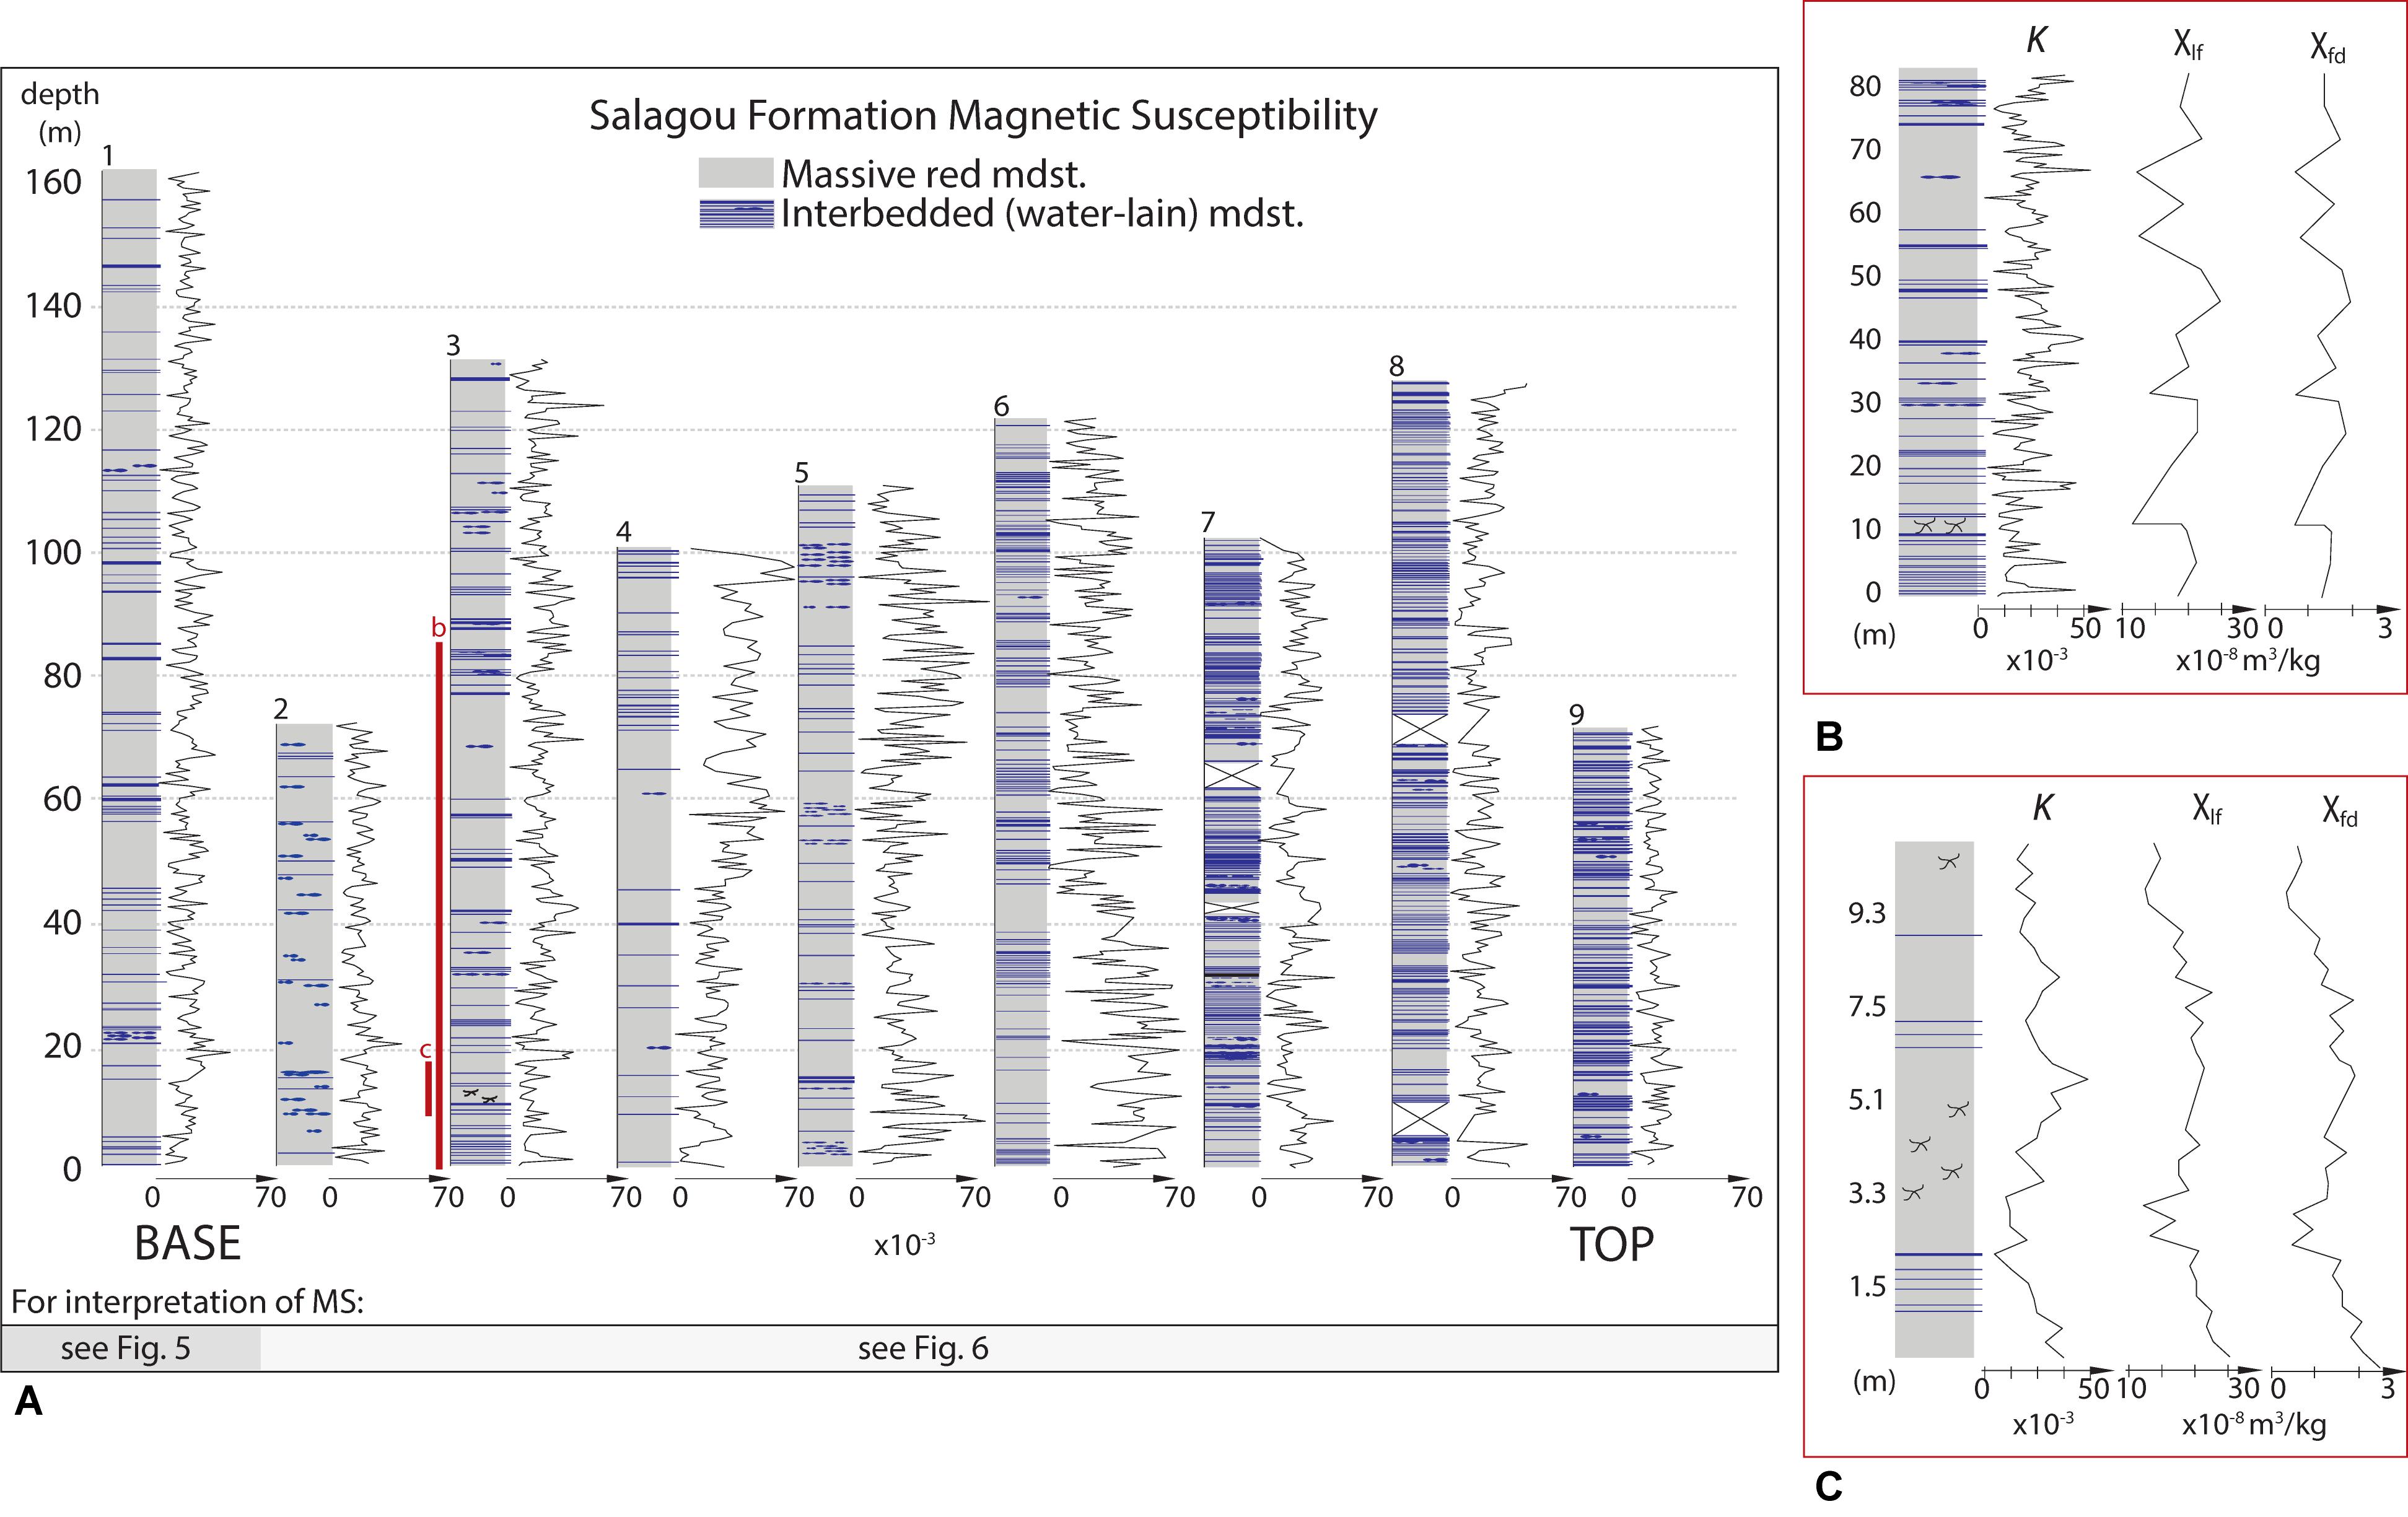
Figure 3. Rock magnetic data from the Salagou Formation. (A) Stratigraphy with handheld (outcrop) MS data (in units of 10–3). Section are numbered for reference and correspondence to Table 2. The dotted lines indicate depth intervals (see meter marks at left). The red bars on Section #3 represent the locations of detailed profiles sampled at two different intervals for detailed rock magnetic data (B,C; see insets). Bar at bottom of page indicates which stratigraphic section correspond with each interpreted MS series in Figure 5 (#1 only) and Figure 6 (#2–9). (B,C) Focused view showing the stratigraphy and outcrop MS again, but also displaying rock magnetic data obtained for these intervals. Specifically, mass normalized low-field MS (χlf) at 505 Hz in 10–8 m3/kg and delta χ (χfd). (B) An 80-m section sampled at 5-m intervals. Note the pedogenic interval ∼11 m. The correlation between MS measured in the field to χlf is negligible (r2 = 0.0059), but the relationship between the two datasets is highly significant (P-value < 0.05). (C) A 10-m section sampled at 30-cm intervals. Note the pedogenic interval ∼3–5 m. The correlation between MS measured in the field to χlf is weak (r2 = 0.1758), but the relationship between the two datasets is highly significant (P-value < 0.05).
The Salagou Formation was measured and described over nine stratigraphic sections (Figure 3A). Most sections are continuous (from the top of one to the base of the next) and can be concatenated for analysis. However, there is ∼500 m of missing section (inaccessible in outcrop) between the lowermost section (Section 1; Figure 3A) and the remainder of the formation (Sections 2–9; Figure 3A), necessitating the need to analyze Section 1 separately. Thus, time series analysis was done in two large segments (as noted in Figure 3A, lower horizontal bar): the lower (165 m of continuous Section 1; results in Figure 5) and the mid-upper (775 m of eight concatenated Sections 2–9; results in Figure 6).
Sampling for Laboratory Magnetic Measurements
Two sets of samples were collected from the middle Salagou Formation (Figure 3A) for laboratory rock magnetic analysis (section “Laboratory Magnetic Measurements”) at two different increments. In the first set (Figure 3B), a 10 g sample was collected at a 5 m resolution for ∼80 m of section. The second set (Figure 3C) is higher resolution (a 10 g sample collected every 30 cm) but covers a shorter interval (∼10.2 m total).
Time Series Analysis and Modeling
Time series analysis of the MS stratigraphic series was carried out in MATLAB and Astrochron for R (Meyers, 2014) (see Supplementary Appendix S1 for commands). MATLAB functions were used to display the stratigraphic series, and for spectral analysis and evolutionary spectrograms to assess the distribution of variability as a function of frequency (cycles/meter) and along stratigraphic position to assess potential changes in sedimentation rate. A low-pass Taner filter was applied to pre-whiten the stratigraphic series, for clarity in evaluating stratigraphic cyclicity potentially related to orbital eccentricity.
The absence of an adequately precise time scale (Figure 2) motivated the application of objective modeling with the average spectral misfit (ASM) method provided in Astrochron (Meyers and Sageman, 2007). The ASM method searches for astronomical frequencies in well-sampled stratigraphic series across a range of plausible sedimentation rates. For each test sedimentation rate, the stratigraphic series is converted to a time series and compared against an astronomical target (in kyr). Here the astronomical target is a collection of astronomical frequencies based on a precession frequency of k = 56.6 arcsec/year estimated for 298 Ma (Berger and Loutre, 1994) and assuming Solar System fundamental frequencies si, gi from Laskar et al. (2004; Table 1). The sedimentation rate yielding time frequencies in the data that most closely match those of the astronomical target (with Monte Carlo testing for assessing significance) is taken as the “optimal sedimentation rate.”
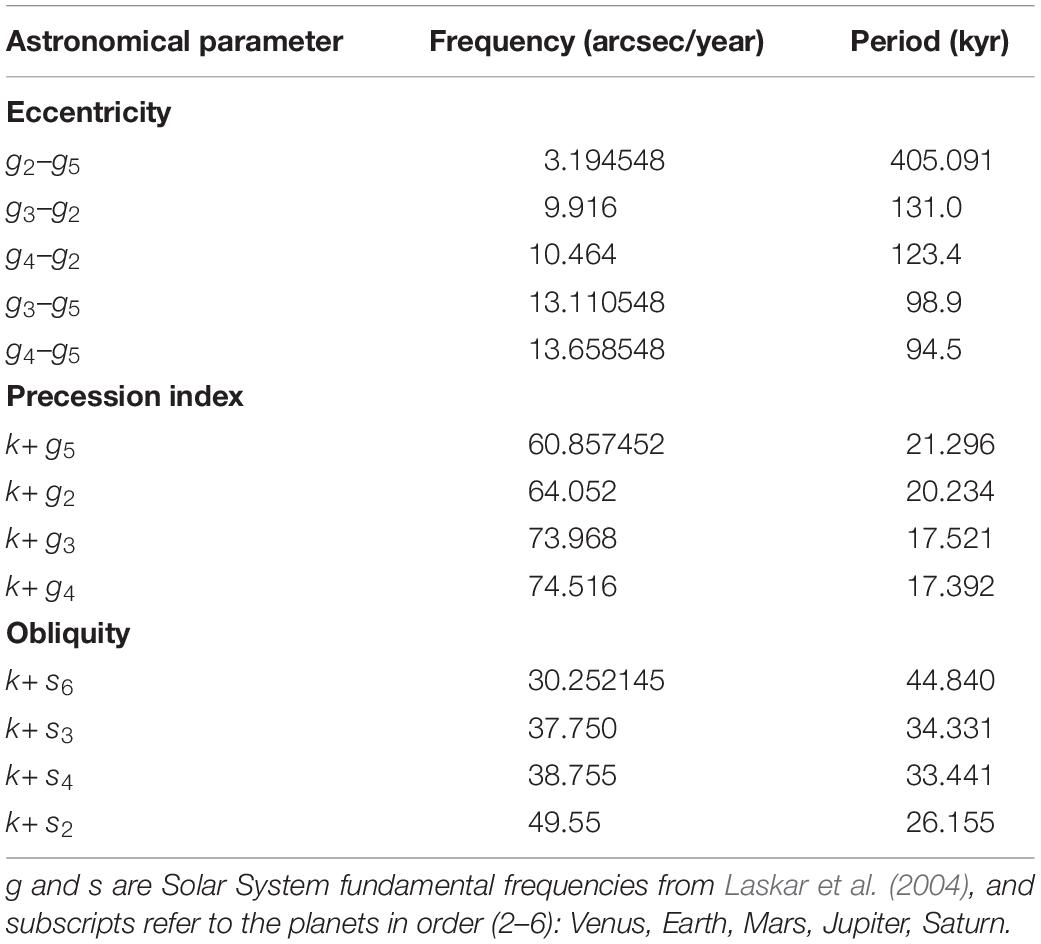
Table 1. Periodicities (in kyr) of orbital eccentricity (from Laskar et al., 2004); precession index, and obliquity are from Earth’s precession frequency (k) = 56.6 arcsec/year modeled at 298 Ma (Berger and Loutre, 1994).
Laboratory Magnetic Measurements
More elaborate rock magnetic analysis was carried out for representative sections from the middle Salagou Formation (Figures 3B,C) to determine the origin of the magnetic signal and strengthen the validity of MS as a proxy for the ancient paleoclimate record. The analyses were done at the rock and paleomagnetic laboratory of the Leibniz Institute for Applied Geophysics (LIAG) in Grubenhagen, Germany. The samples were dried, homogenized, weighed, and filled into non-magnetic plastic boxes of 6.4 cm3. The MS for all samples was measured using a frequency- and field-variable Magnon VSM susceptibility bridge at 505 Hz (low frequency susceptibility; χlf) and at 5050 Hz (high frequency susceptibility; χhf), both at a field of 400 A/m. These measurements were also used to detect the frequency dependence of the MS, which can be expressed as simple difference (Δχ or %χfd). The temperature-dependent MS was determined using an AGICO MFK1-FA Kappabridge and the CS4 furnace, covering a temperature range of 20–700°C (Figure 4). Additionally, the system was rinsed by Argon provided in a constant flux and pressure. Thermally stable furnace holders were measured in an empty state and subtracted, based on their MS rusting of the full-range heating. The applied field strength was set to 400 A/m.
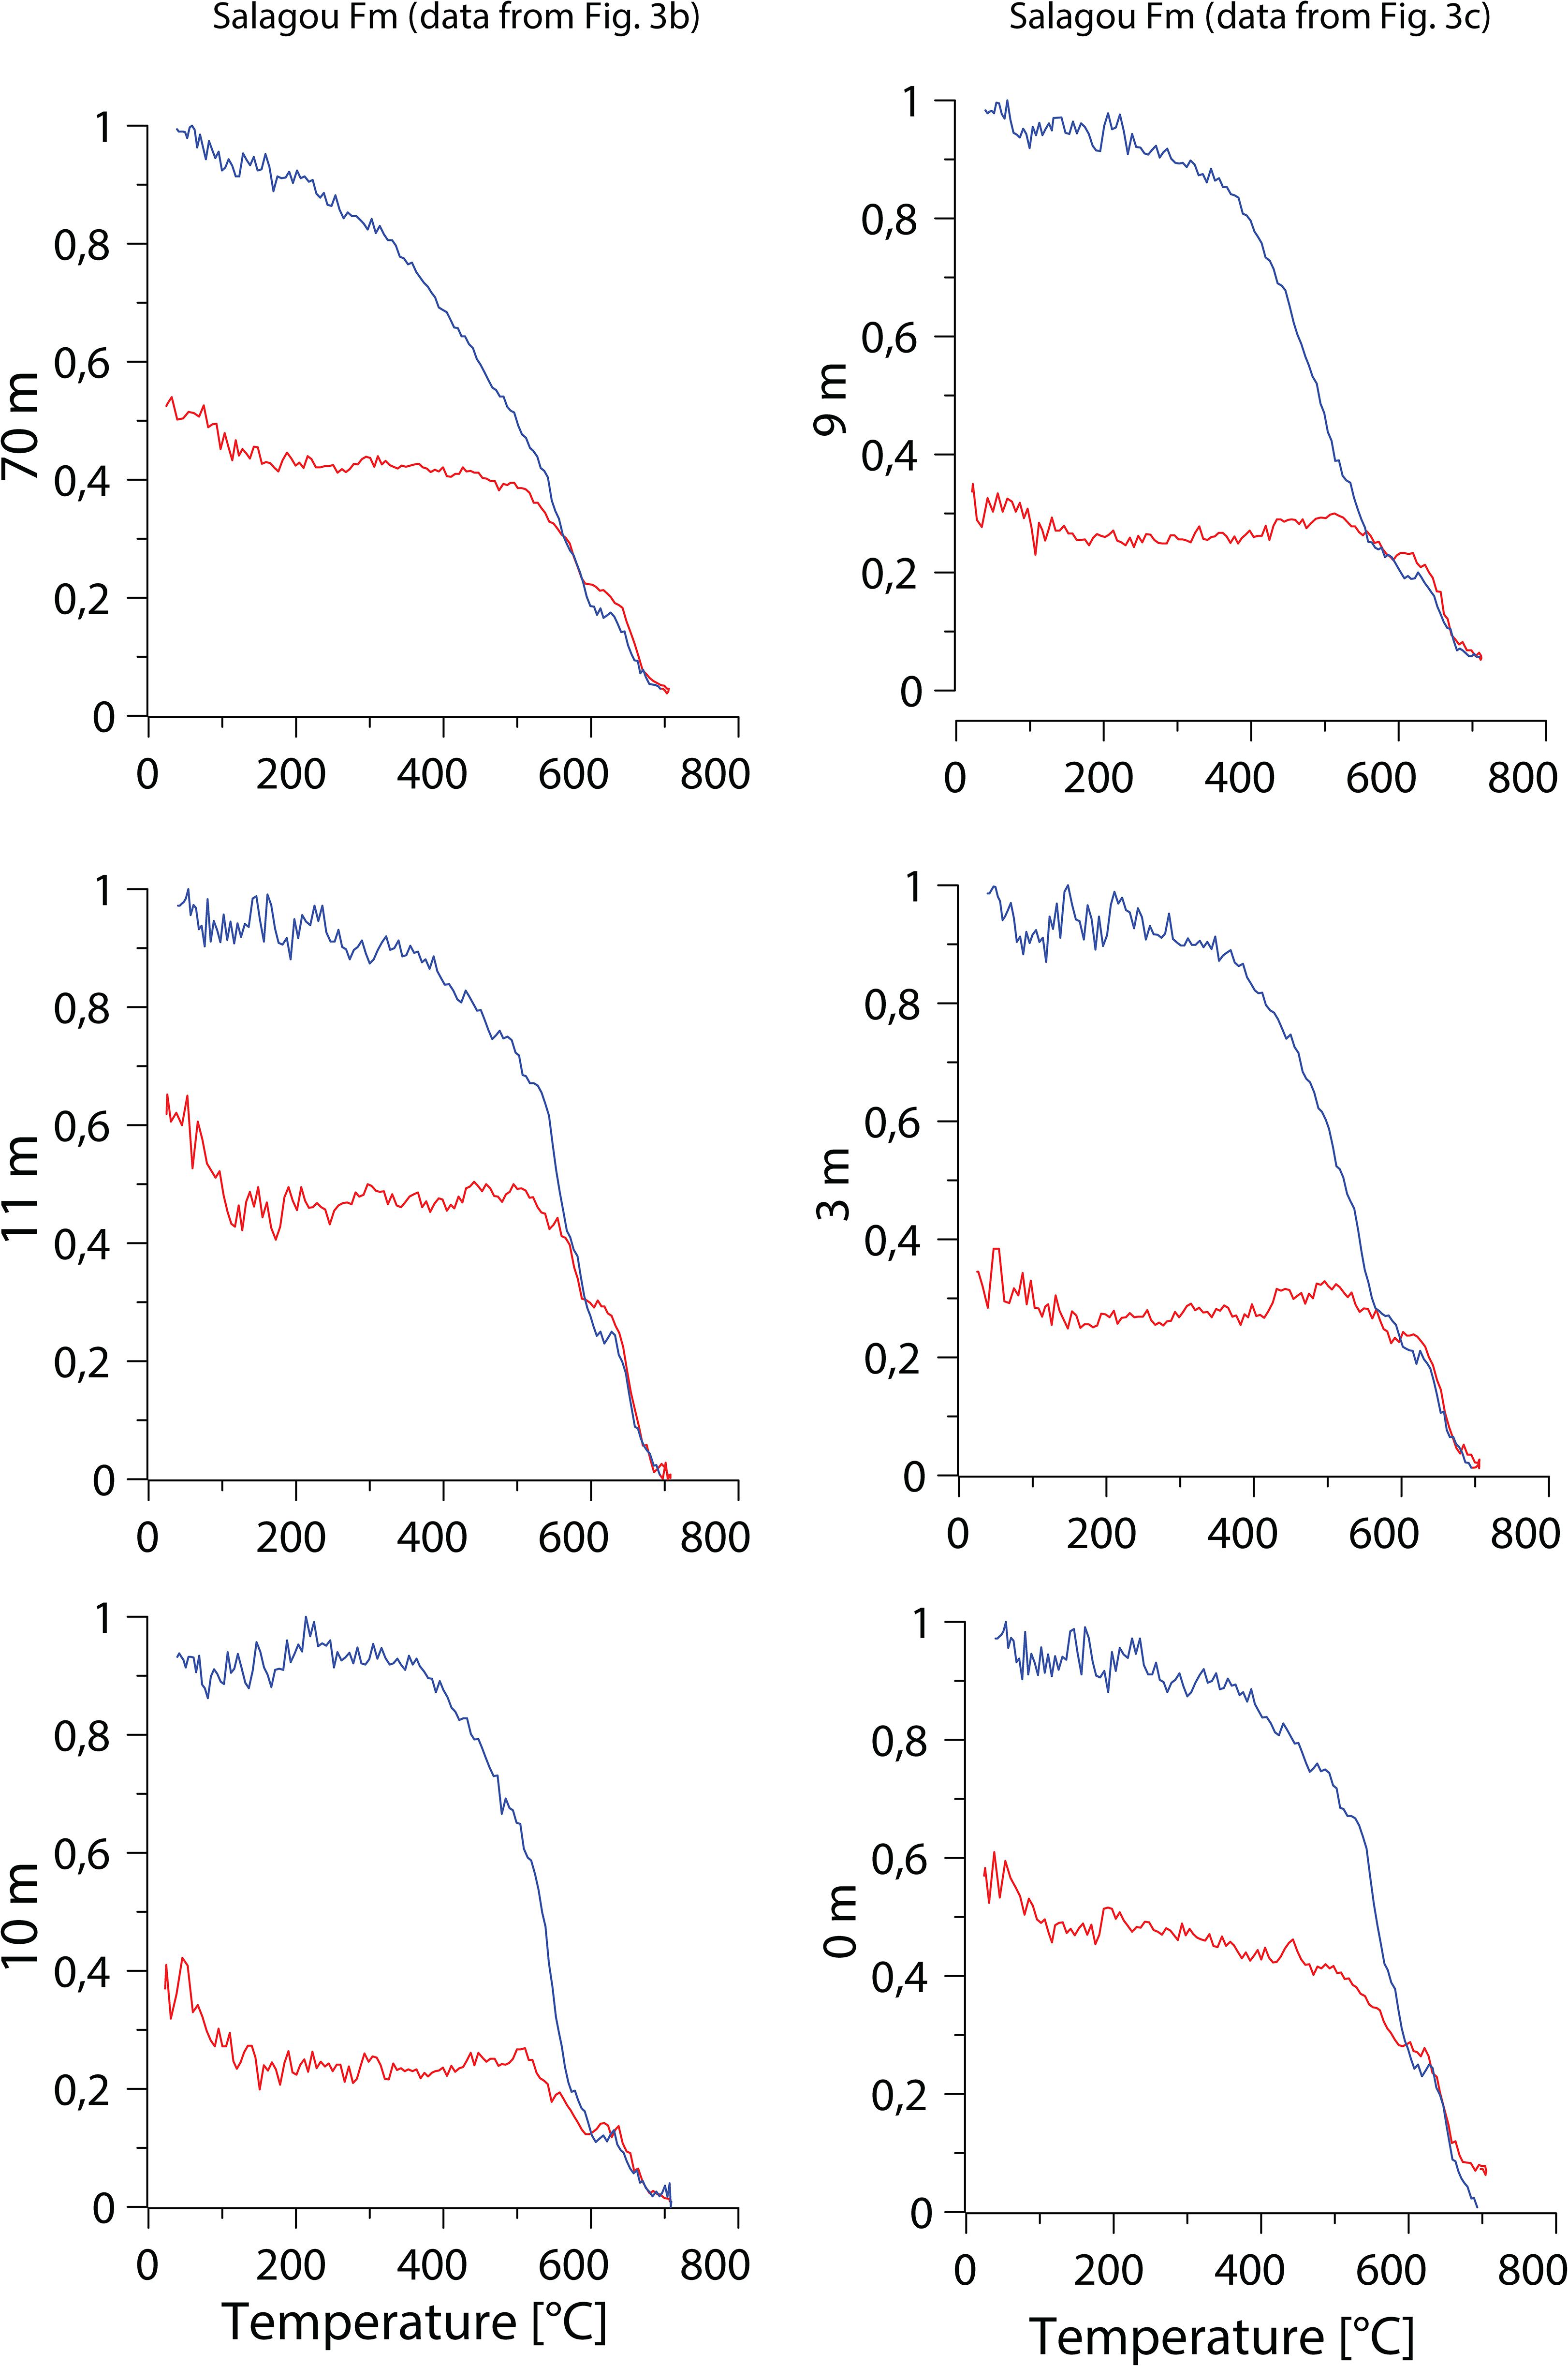
Figure 4. Temperature-dependent susceptibilities of datasets for selected samples from discussed sections in Figures 3B,C. Heating (red) and cooling curves (blue) are plotted against χlf, scaled to a maximum of 1 for comparison. Note that an χlf decrease at the Curie temperature of magnetite (580°C) tends to be less expressed than the clear χlf decrease at the Curie temperature of hematite (675°C).
Results
Sedimentology
Pfeifer et al. (2020) conducted detailed sedimentological analysis of the Salagou Formation. The dominant facies consist of thick and internally structureless mudstone beds (Figure 3A, gray; interpreted as loess deposits) with local pedogenic overprinting. There is a general up-section increase in interbedded units (calcareous mudstone, commonly with desiccation features and laminated mudstone, commonly with ripples) that reflect intermittent subaqueous deposition (Figure 3A, navy). Interpreted pedogenic intervals are nested within the loessite, defined in outcrop primarily by large (∼10+ cm), randomly oriented, semi-radial slickensides (Figures 3B,C). Micromorphologic attributes of samples from these localities include higher proportions of clay, wedge-shaped peds, clay coatings on grains, and porphyroskelic fabrics. Geochemical analyses reveal elevated chemical index of alteration (CIA) values from these intervals (compared to neighboring loessite). These features, together with a lack of horizonation, are most analogous to modern Vertisols which are typically indicative of environments with seasonal precipitation (e.g., Mack et al., 1993).
Magnetic Susceptibility Measurements by KT-10
Table 2 summarizes the statistics of MS data obtained by portable MS meter, reporting the mean and standard deviation of susceptibility readings overall and by section (#1–9; Figure 3A). Overall, the mean measurement of k (MS) for the Salagou formation is 0.253 ± 0.100 (×10–3). The section with the lowest readings (uppermost Salagou; Section 9) averages 0.179 ± 0.034 (×10–3) and the section with the highest readings (middle Salagou; Section 5) averages 0.366 ± 0.092 (×10–3).
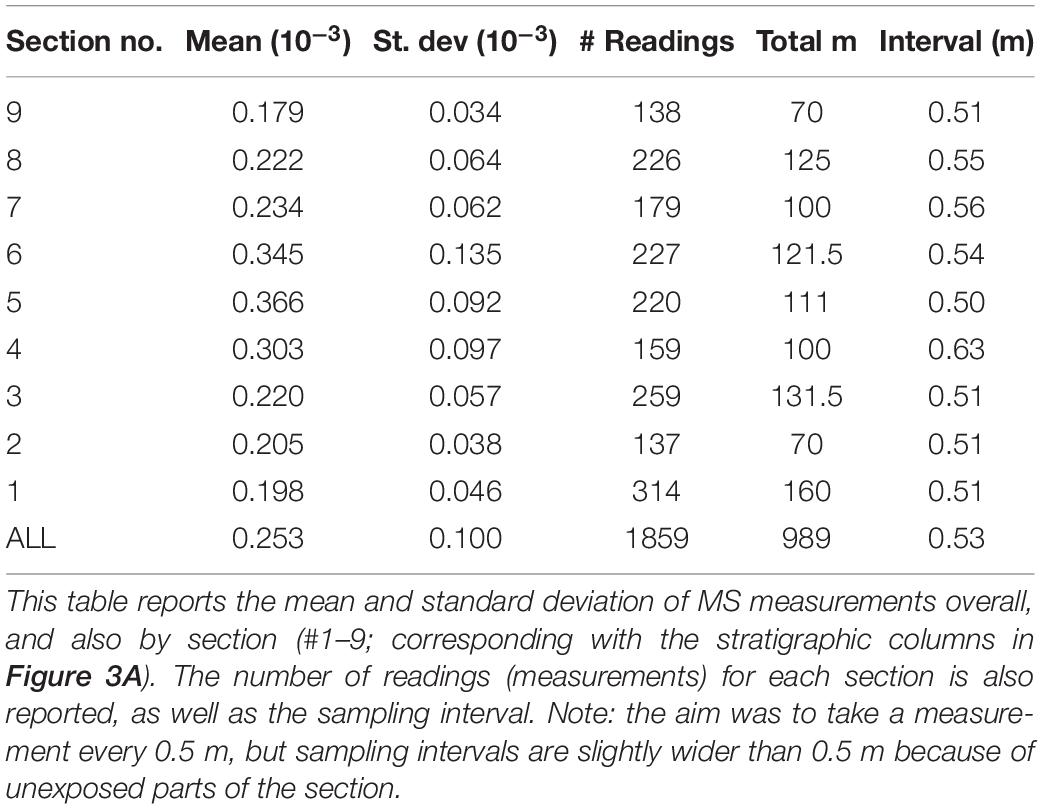
Table 2. Basic statistics of MS measurements by KT-10 (field data) depicted in Figure 3A as curves constructed from individual MS values.
Lower Salagou Formation
A repeating pattern appears in the MS series (Figure 5A), defined by a predominant peak at 0.1 cycles/m (10 m wavelength) in the power spectrum (Figure 5B) and warm colors in the spectrogram (Figure 5C). Prominent, shorter frequencies of 0.29 cycles/cm (3.45 m) and 0.57 cycles/m (1.75 m) are also consistent through the section. ASM analysis estimates an optimal sedimentation rate of ∼9.4 cm/kyr and indicates that astronomical forcing is statistically significant (P = 0.002; Figure 5D).
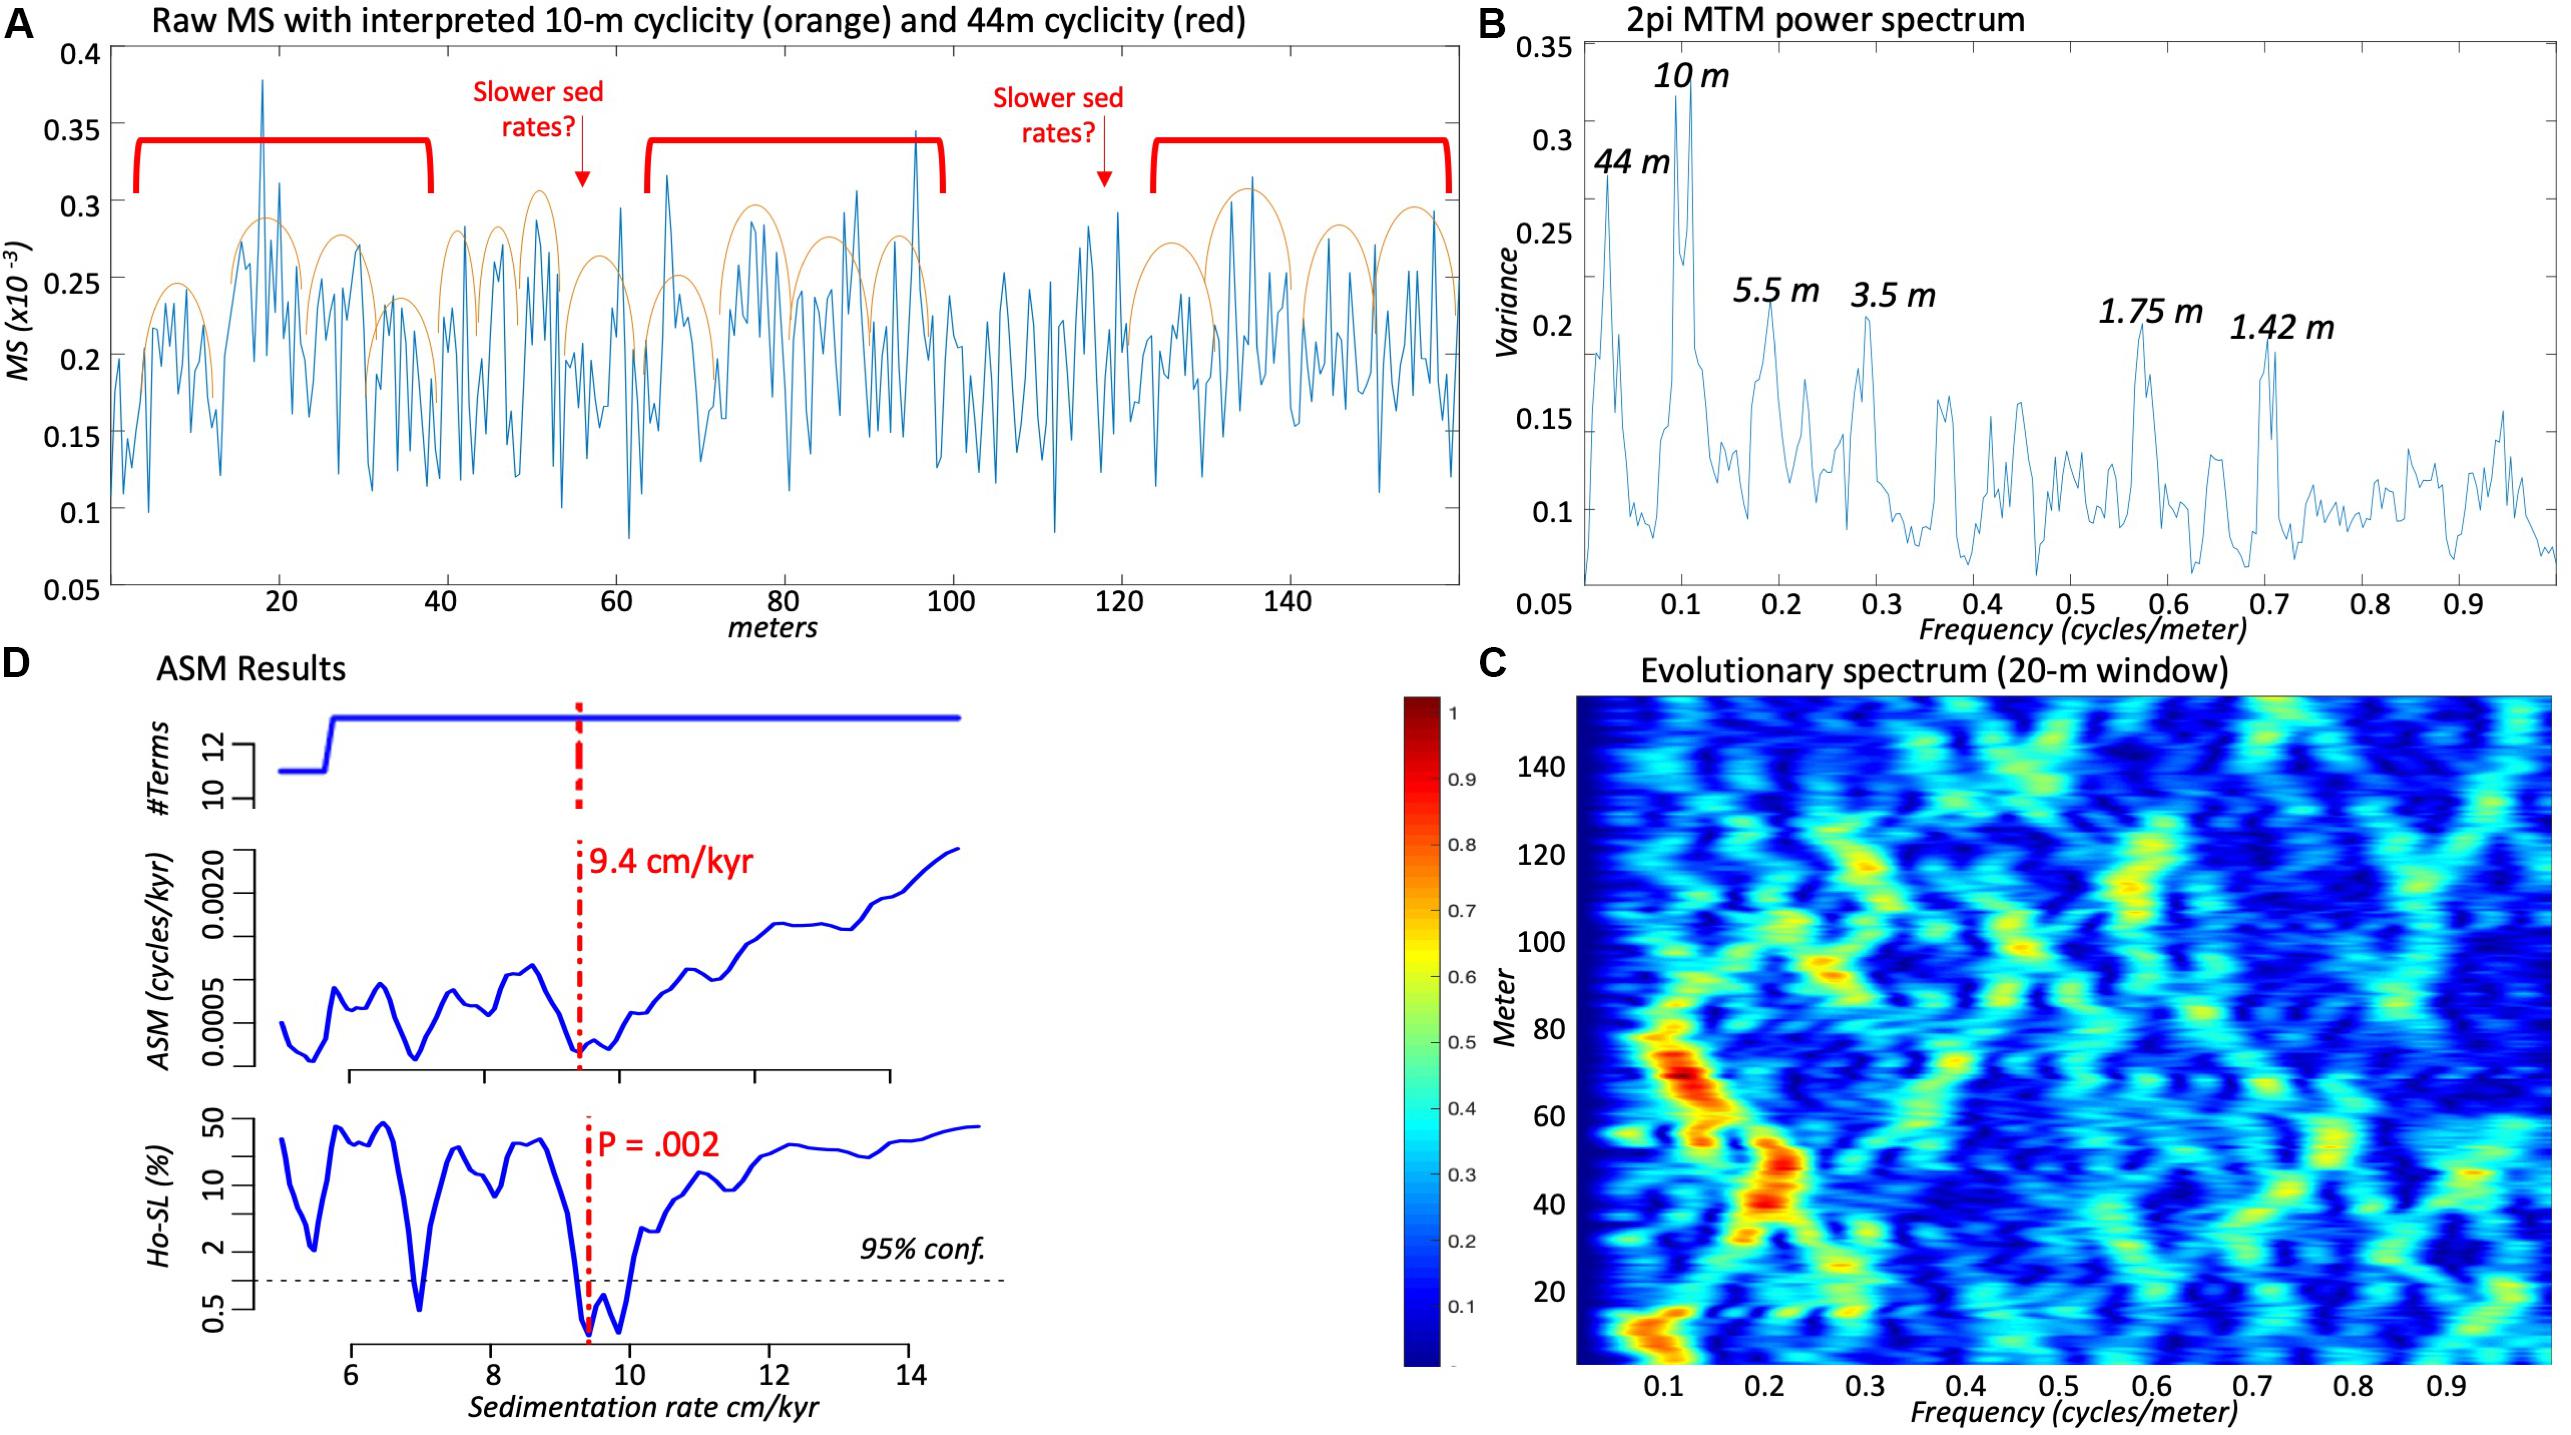
Figure 5. Results of time series analysis and modeling for MS data collected in outcrop from the lower Salagou Formation (see stratigraphic context in Figure 3; lower bar). The section is measured in meters (from low to high is moving up-section). (A) Magnetic susceptibility data with interpretations shown by orange arcs [10 m cycles—short (∼100 kyr) orbital eccentricity] and red brackets [44 m cycles—long (∼405 kyr) orbital eccentricity]. (B) The power spectrum shows the proportion of power (or variance) as a function of frequency (in cycles/m). (C) The FFT spectrogram, computed with a 20 m running window. Warmer (red) colors represent high power and cooler (blue) colors low power. (D) Results of ASM analysis with the optimal sedimentation rate identified by the vertical red dashed curve. Top: number of astronomical frequencies used in the fit; middle: ASM statistic; bottom: statistical significance of Monte Carlo modeling with the critical level shown by the horizontal black dashed line.
Mid-Upper Salagou Formation
Analysis of the mid-upper Salagou Formation (Figure 6) reveals a strong, very low-frequency signal—especially in the middle part of the section—coincident with observed ∼100–130 m (large-amplitude variations) in the MS series (Figure 6A). The most significant cyclicity is ∼0.1 cycles/m (0.13–0.08 cycles/m), i.e., 10 m thick cycles. Subordinate, higher frequency peaks at 0.28–0.31 and 0.55 cycles/m appear intermittently throughout the series. ASM analysis estimates an optimal sedimentation rate of 13 cm/kyr and indicates that astronomical forcing is statistically significant (P = 0.002; Figure 6D).
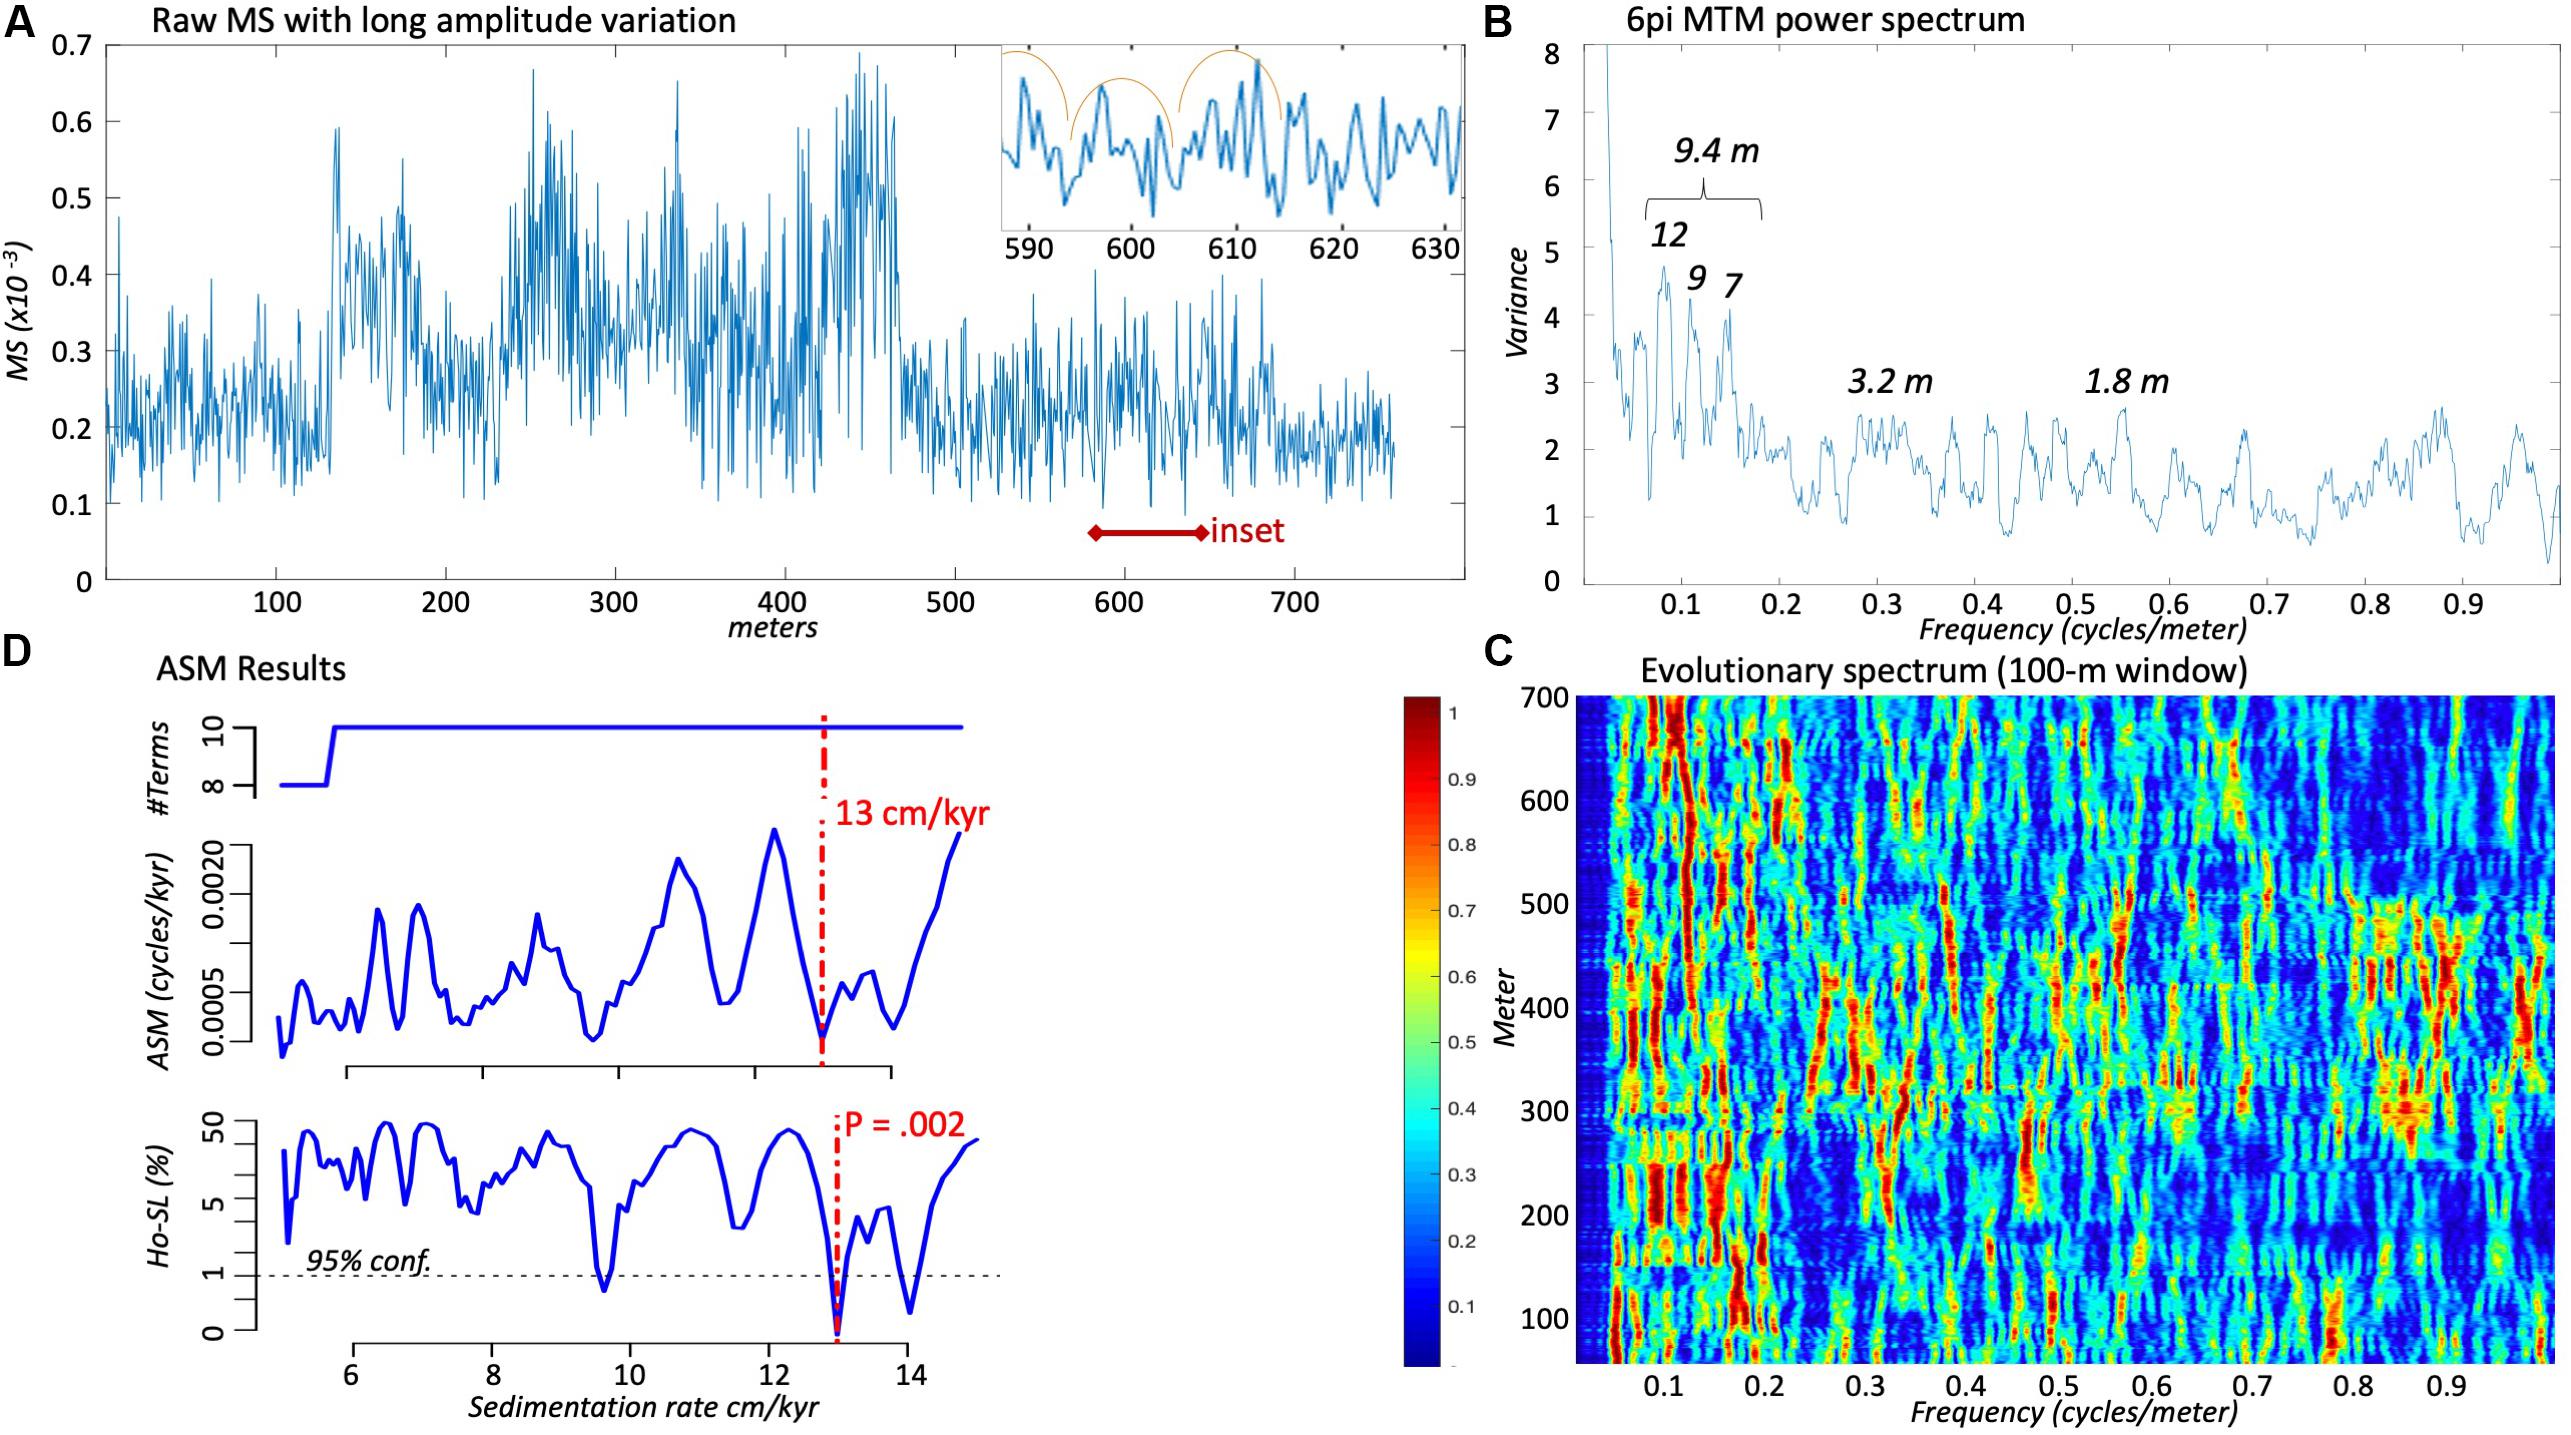
Figure 6. Results from time series analysis and modeling for MS data collected in outcrop from the mid-upper Salagou Formation (see stratigraphic context in Figure 3; lower bar). The section is measured in meters (from low to high is moving up-section). (A) Magnetic susceptibility data with long-term amplitude variation (∼100–130 m cycles). Higher frequency signals are not notable at this scale, but the inset zooms into an interval (590–630 m) to provide an example of the 10 m cycles (interpreted with orange arcs) that are also present in this section. (B) The power spectrum shows the proportion of power (or variance) as a function of frequency (in cycles/m). (C) The FFT spectrogram, computed with a 100 m running window and subtraction of low pass Taner filter with a cutoff frequency of 0.035 cycles/m (see Supplementary Appendix S1 for script). Warmer (red) colors represent high power and cooler (blue) colors low power. (D) Results of ASM analysis with the optimal sedimentation rate identified by the vertical red dashed curve. Top: number of astronomical frequencies used in the fit; middle: ASM statistic; bottom: statistical significance of Monte Carlo modeling with the critical level shown by the horizontal black dashed line.
Laboratory Magnetic Measurements
Temperature (Figure 4) and frequency-dependent susceptibility measurements from the representative section (Figures 3B,C) indicate that the origin of the magnetic signal is primarily driven by hematite, as evinced by the decrease of the MS at its Curie temperature at 675°C, with a varying but generally minor contribution of magnetite at a Curie temperature of 580°C (Figure 4).
Discussion
Calibration of Magnetic Susceptibility Measurements by KT-10
The data acquired by portable MS meter (see Section “Cyclicity in the Salagou Formation”) demonstrate the tool’s ability to recognize cyclic trends through extended stratigraphic successions of loessite. This methodology is relatively rapid, convenient, and inexpensive, but it is important to calibrate in situ outcrop MS data with rock magnetic analysis from the laboratory. The correlation between MS acquired by the portable MS meter in the field and detailed rock magnetic data acquired in the laboratory (χlf and Δχ) is weak (r2 = 0.1758; Figure 3C), but a simple t-test indicates with 95% confidence that the relationships between χlf and field MS, and Δχ and field MS, are both highly significant (P-values < 0.05). The standard deviations in most sections (Table 2; Sections 1–3 and 7–9) for MS readings obtained with the portable meter (0.179 × 10⁻³–0.234 × 10⁻³) are between 0.034 × 10⁻³–0.064 × 10⁻³, which further supports reproducibility. Prior to taking measurements through a section, several readings were recorded on the same sample to understand variability in the magnetic signal by lithology, and the tool always measured within 0.05 × 10⁻³. For example, in Section 3 (Figure 3A), six measurements were taken on calcareous interbeds for a mean reading of 0.158 ± 0.037 × 10⁻³ and 11 measurements were taken on pedogenic slickensides for a mean reading of 0.232 ± 0.055 × 10⁻³. In comparison to the average loess reading for this same section (0.220 ± 0.056 × 10⁻³), this demonstrates the reliability of the tool to capture magnetic signal variations in different lithologies as well as reproducibility of readings on the same sample.
However, there are limitations with in situ MS measurements. The poor correlation between field and laboratory data may be caused by inhomogeneous volumes measured in the field (e.g., uneven surfaces or fractures/cavities in outcrop). Elevated mean MS readings from the portable meter (0.303 × 10⁻³–0.366 × 10⁻³) in the middle Salagou formation (Table 2; Sections 4–6) have especially high standard deviations (0.092 × 10⁻³–0.135 × 10⁻³) compared to other sections. It is possible that elevated values in the middle Salagou Formation relate to a decline in calcareous cement observable in this interval.
Origin of the Magnetic Signal and Comparison to Quaternary Eurasian Loess
The direct relationship between χlf and Δχ (Figure 7; frequency dependence) demonstrates that magnetic enhancement (increased χ) is triggered by ultrafine SP particles close to the domain transition boundary. The production of SP magnetic grains can occur either in situ via pedogenic processes (Singer et al., 1996; Maher, 1998), by incorporation of detrital particles (e.g., Reynolds et al., 2001), and/or through conversion of magnetic mineral species during fluid or burial diagenesis (Katz et al., 1998; Woods et al., 2002). Given the burial history of the basin (Tmax up to 500–600°C; Copard et al., 2000), we cannot dismiss the possibility that some SP particles may have formed as a result of diagenesis, but minimal evidence occurs for fluid flow or veining in the Salagou Formation exposures. We prefer the interpretation of primarily pedogenically formed magnetic particles for the following reasons: (1) Association with evidence for pedogenesis, namely Vertic features (section “Sedimentology”), and elevated clay mineral content and CIA (compared to parent loessite). Lindquist et al. (2011) show that the seasonal wetting and drying typical of Vertisols facilitate the formation of ferrimagnetic SP minerals. (2) There is no evidence for gleying: The Vertic characteristics of Salagou Formation paleosols are inconsistent with ever-wet conditions (Tabor and Myers, 2015). Numerous studies on recent and modern soils show consistently that non-water-logged (gleyed) soils have higher MS and greater abundances of pedogenically produced ultra-fine-grained ferrimagnetic material than in surrounding loess (cf. Heller and Liu, 1984; Maher and Taylor, 1988; and other references in section “Geological Setting”). Furthermore, (3) the alignment of χlf and Δχ with other Eurasian loess (Figure 7) suggests pedogenic control on the magnetic signal (see also discussion below) as opposed to trends typical of diagenesis.
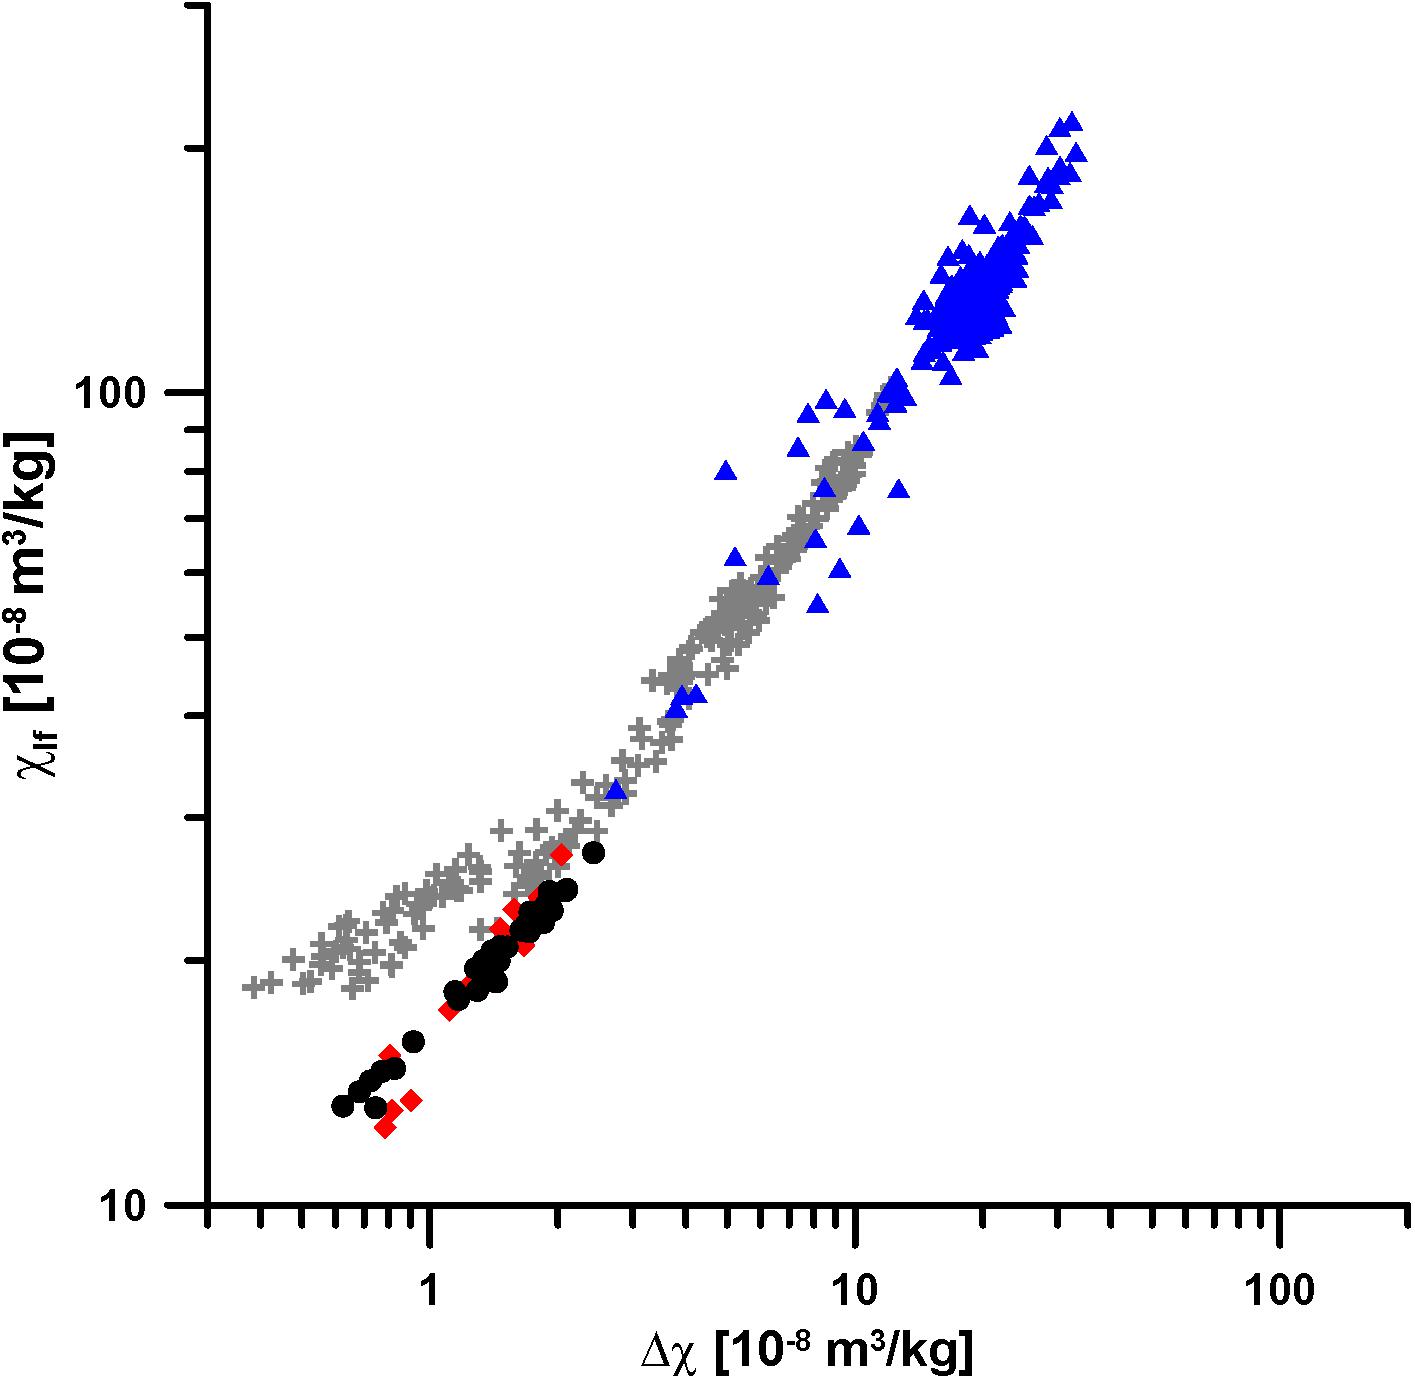
Figure 7. Frequency-dependent susceptibility (χlf vs. Δχ) of the Salagou Formation loess samples (red spades from Figure 3B; black circles from Figure 3C) compared to data from the Quaternary CLP red clay (blue triangles; Song et al., 2007) and a loess-paleosol section from Romania (gray crosses; Zeeden et al., 2016).
Rock magnetic data from the Salagou Formation shows magnetic enhancement, but distinctly lower χlf and lower Δχ compared to reference data (Figure 7) from the Pliocene red clay on the CLP (Song et al., 2007) and a loess-paleosol sequence in Romania (Zeeden et al., 2016). A systematically lower χlf and Δχ relates to the predominance of hematite, which generally exhibits a weaker magnetic signal than magnetite and maghemite. The dominance of hematite and lower contribution of magnetite and maghemite in the Salagou Formation is similar to that found in Permian loessite from western equatorial Pangea (Soreghan et al., 1997; Cogoini et al., 2001; Jia, 2020), but unusual relative to Quaternary loess deposits. This difference may be attributable to syn-depositional processes (e.g., eolian sorting or dilution from rapid deposition of quartz and other non-iron-bearing minerals), more arid and/or oxidizing climate conditions preferring hematite formation over magnetite genesis or preservation (Maher, 1998), weak or stifled pedogenesis (documented sedimentologically; section “Sedimentology”), and/or post-depositional oxidation (of magnetite and maghemite). Eolian sorting is unlikely, because instead of the direct relationship between χlf and Δχ in the Salagou Formation (Figure 7), sorting tends to generate an inverse pattern (high χlf with low Δχ; e.g., Matasova and Kazansky, 2004). Similarly, hematite precipitates formed during post-depositional processes tend to generate a magnetic signal with an inconsistent pattern between χlf and Δχ. The well-defined alignment of χlf and Δχ between these datasets (Figure 7) strongly suggests that the magnetic signal in the Salagou Formation is driven by pedogenesis. If there is no post-depositional (diagenetic) conversion of magnetite/maghemite to hematite, then the low contribution of magnetite in the Salagou Formation loess compared to Eurasian Quaternary loess might reflect substantially different paleoclimatic settings in the Permian of France.
If changes in the magnetic signal are pedogenically driven, then samples in this dataset represent a range of pedogenic alteration, where samples with more magnetic enhancement are more enriched in ultrafine particles of hematite. However, the average bulk χ from interpreted paleosol (1.3 ± 0.3 × 10⁻³) and loess (1.5 ± 0.4 × 10⁻³) units in the Salagou Formation overlap within error. This is atypical of Quaternary Eurasian loess, and even compared to ancient loessite from western equatorial Pangea wherein the magnetic signal of paleosols—also driven primarily by hematite—is 1.5–2× higher than in the parent loess. But the rock magnetic measurements in the Salagou Formation (1–1.5 × 10⁻³) are overall much lower compared to the Permian loessitic paleosols of western equatorial Pangea (∼2–6 × 10⁻³; Soreghan et al., 1997, 2002; Cogoini et al., 2001; Tramp et al., 2004; Soreghan G. S. et al., 2014), so it seems that the Salagou Formation preserves distinctively low concentrations of magnetite or maghemite in comparison even to time-equivalent loessite on the other (western) side of Pangea.
Cyclicity in the Salagou Formation
In the lower Salagou MS series (Figure 5), the persistent frequency at 0.1 cycles/m indicates a 10 m thick cyclicity. Higher frequencies at 0.29 and 0.57 cycles/m indicate 3.5 and 1.75 m thick cycles, respectively. This nested cyclicity, i.e., five to six shorter cycles within each 10 m “bundle,” also appears in the MS series (Figure 5A). If the predominant (10 m thick) cyclicity represents the orbital eccentricity, then this section (160 m) represents a duration of ∼1.6 Myr, and the well-defined 3.5 and 1.75 m cycling represents the obliquity and precession index, respectively. There is also a very low frequency corresponding to a 44-m cycle, i.e., a candidate for 405 kyr orbital eccentricity.
In the mid-upper Salagou MS series (Figure 6), there is long-term amplitude variation that is potentially associated with the decreased presence of calcareous cement in the middle part of the section (resulting in elevated MS values) and/or missing or repeated strata in the concatenation of successive sections (Figure 3A). Regardless, the predominant cyclicity is ∼9.4 m thick, which appears to be broadened by variable sedimentation rates along the series, with multiple closely spaced spectral peaks from 0.13 to 0.08 cycles/m (7–12 m thick cycles). Higher frequencies at 0.28–0.31 and 0.55 cycles/m translate to ∼3.3 and 1.8 m thick cycles, respectively. If the predominant 9.4 m cycles represent short orbital eccentricity, then this section (775 m) represents ∼7.8 Myr of sedimentation. It is possible that ∼3.3 and 1.8 m thick cycles represent obliquity and precession (respectively) but are inconsistent through the section and locally poorly defined.
The ASM analysis confirms that astronomical frequencies are present and statistically significant (P-values < 0.05 for both MS series), rejecting the null hypothesis of no astronomical forcing for specific sedimentation rates of 9.4 cm/kyr (lower Salagou) and 13 cm/kyr (mid-upper Salagou). The up-section increase of optimal (ASM-based) sedimentation rates from 9.4 to 13 cm/kyr suggests that the Salagou Formation represents a duration of 9–10 Myr. This result is similar to estimates for the Salagou Formation from previous work (11–17 cm/kyr; Pochat and Van Den Driessche, 2011) as well as average sedimentation rates for the middle Permian Lucaogou Formation of northwest China (8.9–10.3 cm/kyr; Huang et al., 2020). It is slightly faster than lower Permian loess deposition in western equatorial Pangea (>700 m over ∼9 Myr so ≥7.8 cm/kyr; Johnson, 1989; Tramp et al., 2004; Soreghan M. J. et al., 2014), and on the lower end of sedimentation rates proposed for the Plio-Pleistocene CLP (Stevens and Lu, 2009).
If the driver of magnetic enhancement is pedogenesis (see section “Origin of the Magnetic Signal and Comparison to Quaternary Eurasian Loess”), then these data demonstrate fluctuation between loess accumulation and soil formation with loessite–paleosol couplets around 10 m thick in the Salagou Formation, which is similar to the lower Permian loessite of western equatorial Pangaea (Soreghan M. J. et al., 2014). Irregular cyclicity (e.g., 100–130 m; Figure 5A) may reflect long-term variability in atmospheric circulation, hydroclimate, and/or changes in sedimentation rates.
Conclusion
This study documents statistically significant astronomically forced climate change recorded in deep-time loessite of low-latitude Pangea. The results are as follows:
• Spectral analysis of handheld MS stratigraphic data shows a persistent 10 m thick cyclicity through the Permian Salagou Formation that denotes orbital eccentricity-scale (∼100 kyr) variability. Accordingly, subordinate, higher frequency cycles, at ∼3.3–3.5 and ∼1.8 m thick (most prominent in the lower Salagou Formation) likely represent 35 kyr obliquity and 17–21 kyr precession index-scale variations.
• Average spectral misfit analysis supports the interpretation of the presence of astronomical forcing frequencies, which are statistically significant in the MS series for optimal sedimentation rates of 9.4 cm/kyr (lower Salagou Formation) and 13 cm/kyr (mid-upper Salagou Formation): similar to the Permian of northwest China (∼9–10 cm/kyr) and the western United States (∼8 cm/kyr).
• Rock magnetic data from the Salagou Formation indicates magnetic enhancement wherein we interpret that magnetic particles (hematite) likely formed by pedogenesis, possibly with a diagenetic overprint.
• The uniquely low magnetic signal in the Salagou Formation compared to analogous Eurasian Quaternary loess deposits
• relates to the predominance of hematite, which generally has a much weaker magnetic signal than magnetite and maghemite, and may be explained by differing conditions of formation (e.g., syn depositional processes, more arid and/or oxidizing climate conditions) than in present Eurasia (not unexpected), and/or post depositional oxidation of magnetite and maghemite.
• The portable MS meter allows for rapid and convenient in situ data acquisition. This study demonstrates the ability to recognize cyclic trends through extended stratigraphic successions of loessite using this method when calibrated with detailed rock magnetic analysis from the laboratory.
The evidence demonstrates that the Salagou Formation records climatic variability over a time interval of ∼9–10 Myr during the early Permian (middle to late Cisuralian). If the driver of magnetic enhancement is pedogenic, then the ∼10 m thick cyclicity that is consistent over ∼1000 m of section may represent the thickness of loessite–paleosol couplets in the Salagou Formation.
Data Availability Statement
The raw data supporting the conclusions of this article will be made available by the authors, without undue reservation.
Author Contributions
LP and GS (advisor) collected MS data and samples for rock magnetic analysis. LH mentored LP in MS interpretation (including MATLAB and R scripts). CZ conducted advanced rock magnetic analysis and interpreted this data (with close advice from CZ and CR). LP synthesized all data and conversations into manuscript format. All authors have made significant contributions to the editing and revision of this work, and approved the submitted version.
Funding
This work was supported by the National Science Foundation under International Research Experiences for Students (IRES) grant OISE-1658614 (PIs GS, M. J. Soreghan) and also EAR-1338331 (Sedimentary Geology and Paleobiology Program to GS).
Conflict of Interest
The authors declare that the research was conducted in the absence of any commercial or financial relationships that could be construed as a potential conflict of interest.
Acknowledgments
We thank M. J. Soreghan for suggesting collection of handheld MS data and our 2018 NSF IRES student participants for assistance with data collection (L. Alaniz, E. Simpson, V. Smith, and K. Yeager). We thank Stephane Pochat and Jean Van Den Driessche for field assistance and collaboration. We thank Kathrin Worm for support in the magnetic laboratory. This is IPGP contribution number 4143. Thank you to reviewers RZ and DJ, and editor HA.
Supplementary Material
The Supplementary Material for this article can be found online at: https://www.frontiersin.org/articles/10.3389/feart.2020.00241/full#supplementary-material
APPENDIX S1 | Coding procedures (MATLAB and R scripts).
References
Ahmed, I. A. M., and Maher, B. A. (2017). Identification and paleoclimatic significance of magnetite nanoparticles in soils. PNAS 115:201719186. doi: 10.1073/pnas.1719186115
Basarin, B., Buggle, B., Hambach, U., Markoviæ, S. B., Dhand, K. O., Kovaèeviæ, A., et al. (2014). Time-scale and astronomical forcing of Serbian loess-palaeosol sequences. Glob. Planet. Change 122, 89–106. doi: 10.1016/j.gloplacha.2014.08.007
Beget, J. E., Stone, D. B., and Hawkins, D. B. (1990). Paleoclimatic forcing of magnetic susceptibility variations in Alaskan loess during the Quaternary. Geology 18, 40–43.
Berger, A., and Loutre, M. F. (1994). Astronomical forcing through geological time. Spec. Publs Int. Ass. Sediment. 19, 15–24. doi: 10.1002/9781444304039.ch2
Chlachula, J. (2003). The Siberian loess record and its significance for reconstruction of Pleistocene climate change in north- central Asia. Q. Sci. Rev. 22, 1879–1906. doi: 10.1016/s0277-3791(03)00182-3
Cogoini, M., Elmore, R. D., Soreghan, G. S., and Lewchuk, M. T. (2001). Contrasting rock-magnetic characteristics of two upper Paleozoic loessite-paleosol profiles. Phys. Chem. Earth 26, 905–910. doi: 10.1016/s1464-1895(01)00140-5
Copard, Y., Disnar, J. R., Becq-Giraudon, J.-F., and Boussafir, M. (2000). Evidence and effects of fluid circulation on organic matter in intramontane coalfields (Massif Central, France). Int. J. Coal Geol. 44, 49–68. doi: 10.1016/s0166-5162(99)00049-x
Domeier, M., and Torsvik, T. H. (2014). Plate tectonics in the late Paleozoic. Geosci. Front. 5, 303–350. doi: 10.1016/j.gsf.2014.01.002
Evans, M. E. (2012). Magnetostratigraphy of the Lodève Basin, France: Implications for the Permo-Carboniferous reversed superchron and the geocentric axial dipole. Stud. Geophys. Geodaetica 56, 725–734. doi: 10.1007/s11200-010-0082-y
Evans, M. E., and Heller, F. (2001). Magnetism of loess/paleosol sequences: Recent developments. Earth Sci. Rev. 54, 129–144. doi: 10.1016/s0012-8252(01)00044-7
Foster, T. M., Soreghan, G. S., Soreghan, M. J., Benison, K. C., and Elmore, R. D. (2014). Climatic and paleogeographic significance of eolian sediment in the Middle Permian Dog Creek Shale (Midcontinent U.S.). Palaeogeogr. Palaeoclimatol. Palaeoecol. 402, 12–29. doi: 10.1016/j.palaeo.2014.02.031
Gao, X., Hao, Q., Oldfield, F., Bloemendal, J., Deng, C., Wang, L., et al. (2019). New high-temperature dependence of magnetic susceptibility-based climofunction for quantifying paleoprecipitation from Chinese loess. Geochem. Geophys. Geosyst. 20, 4273–4291. doi: 10.1029/2019GC008401
Giles, J. M., Soreghan, M. J., Benison, K. C., Soreghan, G. S., and Hasiotis, S. T. (2013). Lakes, loess, and paleosols in the Permian Wellington Formation of Oklahoma, USA: implications for paleoclimate and paleogeography of the midcontinent. J. Sediment. Res. 83, 825–846. doi: 10.2110/jsr.2013.59
Hayward, R. K., and Lowell, T. V. (1993). Variations in loess accumulation rates in the mid-continent, United States, as reflected by magnetic susceptibility. Geology 21, 821–824.
Heller, F., and Liu, T.-S. (1982). Magnetostratigraphical dating of loess deposits in China. Nature 300, 431–433. doi: 10.1038/300431a0
Heller, F., and Liu, T.-S. (1984). Magnetism of Chinese loess deposits. Geophys. J. R. Astron. Soc. 77:125. doi: 10.1111/j.1365-246x.1984.tb01928.x
Heller, F., and Liu, T.-S. (1986). Palaeoclimatic and sedimentary history from magnetic susceptibility of loess in China. Geophys. Res. Lett. 13, 1169–1172. doi: 10.1029/gl013i011p01169
Huang, H., Gao, Y., Jones, M. M., Tao, H., Alan, R., Ibarra, D. E., et al. (2020). Astronomical forcing of Middle Permian terrestrial climate recorded in a large paleolake in northwestern China. Palaeogeogr. Palaeoclimatol. Palaeoecol. 2020:109735. doi: 10.1016/j.palaeo.2020.109735
Jia, J. (2020). Magnetic properties of upper Paleozoic loessite-paleosol couplets in the Western USA: The role of pedogenic hematite in magnetic enhancement. Q. Int. 544, 57–64. doi: 10.1016/j.quaint.2020.02.014
Johnson, S. Y. (1989). Significance of loessite in the Maroon Formation (Middle Pennsylvanian to lower Permian), Eagle Basin, Northwest Colorado. J. Sediment. Petrol. 59, 782–791.
Katz, B., Elmore, R. D., Cogoini, M., and Ferry, S. (1998). Widespread chemical remagnetization: Orogenic fluids or burial diagenesis of clays. Geology 26, 603–606.
Kessler, J. L. P., Soreghan, G. S., and Wacker, H. J. (2001). Equatorial aridity in western Pangea: Lower Permian loessite and dolomitic paleosols in northeastern New Mexico. J. Sediment. Res. 71, 818–833.
Kiersnowski, H. (2013). “Late Permian Aeolian sand seas from the Polish Upper Rotliegend Basin in the context of palaeoclimatic periodicity,” in Palaeozoic Climate Cycles: Their Evolutionary and Sedimentological Impact, Vol. 376, eds A. Gasiewicz and M. Słowakiewicz (London: Geological Society Special Publication), 431–456. doi: 10.1144/SP376.20
Kt-10 manual (2017). KT-10 v2 Magnetic Susceptibility, Conductivity and Combined Magnetic Susceptibility-Conductivity Meter with GeoView: User’s Guide. Version 2.2. Terraplus Geophysical Equipment Supplier. Available online at: http://www.terraplus.ca (accessed May, 2018).
Kukla, G. (1987). Loess stratigraphy in central China. Q. Sci. Rev. 6, 191–219. doi: 10.1016/0277-3791(87)90004-7
Kukla, G., and An, Z. S. (1989). Loess stratigraphy in central China. Palaeogeogr. Palaeoclimatol. Palaeoecol. 72, 203–225. doi: 10.1016/0031-0182(89)90143-0
Kukla, G., Heller, F., Liu, X. M., Xu, T. C., Liu, T. S., and An, Z. S. (1988). Pleistocene climates in China dated by magnetic susceptibility. Geology 16, 811–814.
Laskar, J., Robutel, P., Joutel, F., Gastineau, M., Correia, A. C. M., and Levrard, B. (2004). A long-term numerical solution for the insolation quantities of the Earth. Astron. Astrophys. 428, 261–285. doi: 10.1051/0004-6361
Li, Y., Shi, W., Aydin, A., Beroya-Eitner, M. A., and Gao, G. (2019). Loess genesis and worldwide distribution. Earth-Sci. Rev. 2019:102947. doi: 10.1016/j.earscirev.2019.102947
Lindquist, A. K., Feinberg, J. M., and Waters, M. R. (2011). Rock magnetic properties of a soil developed on an alluvial deposit at Buttermilk Creek, Texas, USA. Geochem. Geophys. Geosyst. 12, 1–12. doi: 10.1029/2011GC003848
Liu, X. M., Shaw, J., Liu, T. S., and Heller, F. (1993). Magnetic susceptibility of the Chinese loess- paleosol sequence: Environmental change and pedogenesis. Geol. Soc. Lond. 150, 583–588. doi: 10.1144/gsjgs.150.3.0583
Mack, G. H., and Dinterman, P. A. (2002). Depositional environments and paleogeography of the Lower Permian (Leonardian) Yeso and correlative formations in New Mexico. Mountain Geol. 39, 75–88.
Mack, G. H., James, W. C., and Monger, H. C. (1993). Classification of paleosols. GSA Bull. 105, 129–136. doi: 10.1130/0016-7606(1993)105<0129:cop>2.3.co;2
Maher, B. (1986). Characterisation of soils by mineral magnetic measurements. Phys. Earth Planet. Inter. 42, 76–92. doi: 10.1016/s0031-9201(86)80010-3
Maher, B. A. (1998). Magnetic properties of modern soils and Quaternary loessic palaeosols: Palaeoclimatic implications. Palaeogeogr. Palaeoclimatol. Palaeoecol. 137, 2554. doi: 10.1016/S0031-0182(97)00103-X
Maher, B. A. (2016). Palaeoclimatic records of the loess/palaeosol sequences of the Chinese Loess Plateau. Q. Sci. Rev. 154, 23–84. doi: 10.1016/j.quascirev.2016.08.004
Maher, B. A., and Possolo, A. (2013). Statistical models for use of palaeosol magnetic properties as proxies of palaeorainfall. Glob. Planet. Change 111, 280–287. doi: 10.1016/j.gloplacha.2013.09.017
Maher, B. A., and Taylor, R. M. (1988). Formation of ultrafine-grained magnetite in soils. Nature 336, 368–370. doi: 10.1038/336368a0
Maher, B. A., and Thompson, R. (1991). Mineral magnetic record of the Chinese loess and paleosols. Geology 19, 3–6.
Maher, B. A., and Thompson, R. (1992). Paleoclimatic significance of the mineral magnetic record of the Chinese loess and paleosols. Q. Res. 37, 155–170. doi: 10.1016/0033-5894(92)90079-x
Maher, B. A., Thompson, R., and Zhou, L. P. (1994). Spatial and temporal reconstructions of changes in the Asian palaeomonsoon: A new mineral magnetic approach. Earth Planet. Sci. Lett. 125, 462–471.
Matasova, G. G., and Kazansky, A. Y. (2004). Magnetic properties and magnetic fabrics of Pleistocene loess/palaeosol deposits along west-central Siberian transect and their palaeoclimatic implications. Geol. Soc. Lond. Spec. Publ. 238, 145–173. doi: 10.1144/GSL.SP.2004.238.01.11
Meyers, S. R. (2014). Astrochron: An R Package for Astrochronology. Available online at: https://cran.r-project.org/package=astrochron (accessed March, 2019).
Meyers, S. R., and Sageman, B. B. (2007). Quantification of deep-time orbital forcing by average spectral misfit. Am. J. Sci. 307, 773–792. doi: 10.2475/05.2007.01
Michel, L. A., Tabor, N. J., Montanez, I. P., Schmitz, M. D., and Davydov, V. I. (2015). Chronostratigraphy and Paleoclimatology of the Lodève Basin, France: Evidence for a pan-tropical aridification event across the Carboniferous–Permian boundary. Palaeogeogr. Palaeoclimatol. Palaeoecol. 430, 118–131. doi: 10.1016/j.palaeo.2015.03.020
Muhs, D. R. (2007). “Loess deposits, origins, and properties,” in Encyclopedia of Quaternary Science, eds C. J. Mock and S. Elias (Amsterdam: Elsevier), 1405. doi: 10.1016/b0-444-52747-8/00158-7
Murphy, K. (1987). Eolian origin of upper Paleozoic red siltstones at Mexican Hat and Dark Canyon. 127. Utah M.S. Thesis, University of Nebraska-Lincoln, Lincoln.
Muttoni, G., and Kent, D. V. (2019). Adria as promontory of Africa and its conceptual role in the Tethys twist and Pangea B to Pangea A transformation in the Permian. Res. Paleontol. Stratigr. 12, 249–269.
Parrish, J. T. (1993). Climate of the Supercontinent Pangea. J. Geol. 101, 215–233. doi: 10.1086/648217
Pfeifer, L. S., Soreghan, G. S., Pochat, S., and Van Den Driessche, J. (2020). Loess in eastern equatorial Pangea archives a dusty atmosphere and possible upland glaciation. GSA Bull. doi: 10.1130/B35590.1
Pfeifer, L. S., Soreghan, G. S., Pochat, S., Van Den Driessche, J., and Thomson, S. N. (2016). Permian exhumation of the Montagne Noire core complex recorded in the Graissessac- Lodève Basin. Basin Res. 30, 1–14. doi: 10.1111/bre.12197
Pochat, S., and Van Den Driessche, J. (2011). Filling sequence in Late Paleozoic continental basins: A chimera of climate change? A new light shed given by the Graissessac – Lodève basin (SE France). Palaeogeogr. Palaeoclimatol. Palaeoecol. 302, 170–186. doi: 10.1016/j.palaeo.2011.01.006
Porter, S. C. (2001). Chinese loess record of monsoon climate during the last glacial–interglacial cycle. Earth Sci. Rev. 54, 115–128. doi: 10.1016/s0012-8252(01)00043-5
Porter, S. C., Hallet, B., Wu, X., and An, Z. (2001). Dependence of near-surface magnetic susceptibility on dust accumulation rate and precipitation on the Chinese Loess Plateau. Q. Res. 55, 271–283. doi: 10.1006/qres.2001.2224
Reynolds, R., Belnap, J., Reheis, M., Lamothe, P., and Luiszer, F. (2001). Aeolian dust in Colorado Plateau soils: Nutrient inputs and recent change in source. Proc. Natl. Acad. Sci. 98, 7123–7127. doi: 10.1073/pnas.121094298
Schneider, J. W., Körner, F., Roscher, M., and Kroner, U. (2006). Permian climate development in the northern peri-Tethys area —The Lodève basin, French Massif Central, compared in a European and global context. Palaeogeogr. Palaeoclimatol. Palaeoecol. 240, 161–183. doi: 10.1016/j.palaeo.2006.03.057
Schneider, J. W., Lucas, S. G., Scholze, F., Voigt, S., Marchetti, L., Werneburg, R., et al. (2019). Late paleozoic-early mesozoic continental biostratigraphy - links to the standard global chronostratigraphic scale. Palaeoworld. 531, 1–53.
Schneider, J. W., Lucas, S. G., Werneburg, R., and Rößler, R. (2010). Euramerican Late Pennsylvanian / Early Permian arthropleurid/tetrapod associations – implications for the habitat and paleobiology of the largest terrestrial arthropod in Lucas, S. G., Schneider, J. W. and Spielmann, J. A., eds, Carboniferous-Permian transition in Canõn del Cobre, northern New Mexico. New Mexico Museum Nat. History Sci. Bull. 49, 49–70.
Shackleton, N. J., Berger, A., and Peltier, W. R. (1990). An alternative astronomical calibration of the lower Pleistocene timescale based on ODP Site 677. Trans. R. Soc. Edinb. Earth Sci. 81, 251–261. doi: 10.1017/s0263593300020782
Singer, M. J., Verosub, K. L., Fine, P., and TenPas, J. D. (1996). A conceptual model for the enhancement of magnetic susceptibility in soils. Quat. Int. 3436:243248. doi: 10.1016/1040-6182(95)00089-85
Song, Y., Fang, X., Torii, M., Ishikawa, N., Li, J., and An, Z. (2007). Late Neogene rock magnetic record of climatic variation from Chinese eolian sediments related to uplift of the Tibetan Plateau. J. Asian Earth Sci. 30, 324–332. doi: 10.1016/j.jseaes.2006.10.004
Soreghan, G. S., Elmore, R. D., Katz, B., Cogoini, M., and Banerjee, S. (1997). Pedogenically enhanced magnetic susceptibility variations preserved in Paleozoic loessite. Geology 25, 1003–1006.
Soreghan, G. S., Elmore, R. D., and Lewchuk, M. T. (2002). Sedimentologic–magnetic record of western Pangean climate in Upper Paleozoic loessite (Lower Cutler Beds, Utah). Geol. Soc. Am. Bull. 114, 1019–1035. doi: 10.1130/0016-7606(2002)114<1019:smrowp>2.0.co;2
Soreghan, G. S., Soreghan, M. J., and Hamilton, M. A. (2008a). Origin and significance of loess in late Paleozoic western Pangaea: a record of tropical cold. Palaeogeogr. Palaeoclimatol. Palaeoecol. 268, 234–259. doi: 10.1016/j.palaeo.2008.03.050
Soreghan, G. S., Soreghan, M. J., Poulsen, C. J., Young, R. A., Sweet, D. E., and Davogustto, O. C. (2008b). Anomalous cold in Pangaean tropics. Geology 36, 659–662.
Soreghan, G. S., Sweet, D. E., and Heavens, N. G. (2014). Upland Glaciation in tropical pangaea: geologic evidence and implications for late paleozoic climate modeling. J. Geol. 122, 1–30.
Soreghan, M. J., Heavens, N., Soreghan, G. S., Link, P. K., and Hamilton, M. A. (2014). Abrupt and high-magnitude changes in atmospheric circulation recorded in the Permian Maroon Formation, tropical Pangaea. Geol. Soc. Am. Bull. 126, 569–584. doi: 10.1130/B30840.1
Soreghan, M. J., and Soreghan, G. S. (2007). Whole-rock geochemistry of Upper Paleozoic loessite, Western Pangea: implications for paleo-atmospheric circulation. Earth Planet. Sci. Lett. 255, 117–132. doi: 10.1016/j.epsl.2006.12.010
Stevens, T., and Lu, H. (2009). Optically stimulated luminescence dating as a tool for calculating sedimentation rates in Chinese loess: comparisons with grain-size records. Sedimentology 56, 911–934. doi: 10.1111/j.1365-3091.2008.01004.x
Sweet, A. C., Soreghan, L. S., Sweet, D. E., Soreghan, M. J., and Madden, A. S. (2013). Permian dust in Oklahoma: source and origin for middle Permian (Flowerpot-Blaine) redbeds in Western Tropical Pangaea. Sediment. Geol. 28, 181–196. doi: 10.1016/j.sedgeo.2012.12.006
Tabor, N. J., and Myers, T. S. (2015). Paleosols as Indicators of Paleoenvironment and Paleoclimate. Annu. Rev. Earth Planet. Sci. 43, 333–363. doi: 10.1146/annurev-earth-060614-105355
Tramp, K. L., Soreghan, G. S., and Elmore, R. D. (2004). Paleoclimatic inferences from paleopedology and magnetism of the Permian Maroon Formation. GSA Bull. 116, 671–686. doi: 10.1130/B25354.1
Woods, S., Elmore, R. D., and Engel, M. (2002). Paleomagnetic dating of the smectite-to-illite conversion: Testing the hypothesis in Jurassic sedimentary rocks, Skye, Scotland. J. Geophys. Res. 107, 2–9. doi: 10.1029/2000JB000053
Yang, S. L., and Ding, Z. L. (2004). Comparison of particle size characteristics of the Tertiary “red clay” and Pleistocene loess in the Chinese Loess Plateau: Implications for origin and sources of the “red clay.”. Sedimentology 51, 77–93. doi: 10.1046/j.1365-3091.2003.00612.x
Zeeden, C., Hambach, U., Obreht, I., Hao, Q., Abels, H. A., Veres, D., et al. (2018). Patterns and timing of loess-paleosol transitions in Eurasia: Constraints for paleoclimate studies. Glob. Planet. Change 162, 1–7. doi: 10.1016/j.gloplacha.2017.12.021
Zeeden, C., Kels, H., Hambach, U., Schulte, P., Protze, J., Eckmeier, E., et al. (2016). Three climatic cycles recorded in a loess-palaeosol sequence at Semlac (Romania) – Implications for dust accumulation in south-eastern Europe. Quat. Sci. Rev. 154, 130–142. doi: 10.1016/j.quascirev.2016.11.002
Zheng, H., Oldfield, F., Yu, L., Shaw, J., and An, Z. (1991). The magnetic properties of particle-sized samples from the Luo Chuan loess section: evidence for pedogenesis. Phy. Earth Planet. Inter. 68, 250–258. doi: 10.1016/0031-9201(91)90044-i
Keywords: loess, cyclostratigraphy, magnetic susceptibility, Permian, rock magnetic
Citation: Pfeifer LS, Hinnov L, Zeeden C, Rolf C, Laag C and Soreghan GS (2020) Rock Magnetic Cyclostratigraphy of Permian Loess in Eastern Equatorial Pangea (Salagou Formation, South-Central France). Front. Earth Sci. 8:241. doi: 10.3389/feart.2020.00241
Received: 01 April 2020; Accepted: 03 June 2020;
Published: 26 June 2020.
Edited by:
Hagay Amit, Université de Nantes, FranceReviewed by:
Rui Zhang, Northwest University, ChinaDiana Jordanova, National Institute of Geophysics, Geodesy and Geography (BAS), Bulgaria
Copyright © 2020 Pfeifer, Hinnov, Zeeden, Rolf, Laag and Soreghan. This is an open-access article distributed under the terms of the Creative Commons Attribution License (CC BY). The use, distribution or reproduction in other forums is permitted, provided the original author(s) and the copyright owner(s) are credited and that the original publication in this journal is cited, in accordance with accepted academic practice. No use, distribution or reproduction is permitted which does not comply with these terms.
*Correspondence: Lily S. Pfeifer, Lspfeifer@ou.edu