Article

Chemostratigraphic Correlations of Deep-Sea Sediments in the Western North Pacific Ocean: A New Constraint on the Distribution of Mud Highly Enriched in Rare-Earth Elements

1
Department of Systems Innovation, School of Engineering, The University of Tokyo, 7-3-1 Hongo, Bunkyo-ku, Tokyo 113-8656, Japan
2
Frontier Research Center for Energy and Resources, School of Engineering, The University of Tokyo, 7-3-1 Hongo, Bunkyo-ku, Tokyo 113-8656, Japan
3
Ocean Resources Research Center for Next Generation, Chiba Institute of Technology, 2-17-1 Tsudanuma, Narashino, Chiba 275-0016, Japan
4
Submarine Resources Research Center, Research Institute for Marine Resources Utilization, Japan Agency for Marine-Earth Science and Technology (JAMSTEC), 2-15 Natsushima-cho, Yokosuka, Kanagawa 237-0061, Japan
5
Department of Planetology, Graduate School of Science, Kobe University, 1-1 Rokkodai-cho, Nada-ku, Kobe, Hyogo 657-8501, Japan
*
Authors to whom correspondence should be addressed.
Minerals 2020, 10(6), 575; https://doi.org/10.3390/min10060575
Submission received: 16 May 2020 / Revised: 18 June 2020 / Accepted: 23 June 2020 / Published: 26 June 2020
(This article belongs to the Special Issue Marine Geology and Minerals)

Abstract

:
Deep-sea sediments with total rare-earth elements and yttrium (ΣREY) concentrations exceeding 400 ppm, which are termed REY-rich mud, are widely distributed in the world oceans. Specifically, deep-sea sediments within the Japanese exclusive economic zone (EEZ) surrounding Minamitorishima Island in the western North Pacific have attracted significant attention as a new REY resource, because they contain REY-enriched layers exceeding 2000 ppm of ΣREY. However, neither the sediments deeper than 15 m below the seafloor (mbsf) nor those outside the Minamitorishima EEZ have ever been studied. Recently, a number of distinct geochemical features which are aligned in stratigraphic order were recognized in these sediments, based on multi-elemental composition data. Chemostratigraphy enables us to laterally correlate three REY peaks among apparently featureless pelagic clays. Here, we apply chemostratigraphic correlation to 19 new cores collected from the northern Pigafetta Basin and several small basins within the Marcus-Wake Seamounts. This study revealed that the REY-enriched layers occur at greater depths than the piston core length in a wider area than previously investigated (e.g., ~20.5 mbsf at Ocean Drilling Program Site 801A). This finding suggests that the depositional environments in these areas were basically similar, although local geographic conditions could have affected the continuity of REY peaks.

1. Introduction

Rare-earth elements and yttrium (REY) have unique magnetic and optical characteristics, and can be used to produce important industrial materials such as high-power permanent magnets and various fluorescent substances [1]. Nowadays, they are indispensable to various high- and green-tech products, including electric vehicles, wind power generators, and light-emitting diodes. Because the useful properties of REY are attributed to their characteristic electron configuration, it is fundamentally difficult to substitute them with other elements [1]. Considering the long-term economic growth of emerging countries, the global demand for REY will increase over the coming decades. To satisfy the increasing demand, exploring for new sources is crucial [1,2].
Recently, deep-sea sediments containing high concentrations of REY were reported by Kato et al. (2011) [3]. Sediments with more than 400 ppm of total REY (ΣREY) are defined as “REY-rich mud”, and are widely distributed in the Pacific [3,4,5,6], Indian [7,8,9], and Atlantic Oceans [10]. These previous studies revealed large heterogeneity in the REY distribution within deep-sea sediments. In recent years, REY-rich mud with very high REY concentrations has been discovered in the North and South Pacific Ocean [5,11,12]. To distinguish the characteristics of REY-rich mud, sediments with remarkably high REY contents were termed highly REY-rich mud (ΣREY > 2000 ppm) and extremely REY-rich mud (ΣREY > 5000 ppm; [11]).
The Japanese exclusive economic zone (EEZ) surrounding Minamitorishima Island in the western North Pacific is one of the most prospective areas as a potential source for REY and Sc [11,13,14]. In particular, to the south of Takuyo Daigo Seamount, sediments with extremely REY-rich mud within 2500 km2 × 10 m below the sea floor (mbsf) contain 1.2 million tons of rare-earth oxides [14]. These sediments could also be a potential resource of Sc owing to their relatively high concentrations (more than 100 ppm [13]) and easy extraction via the same method used to extract REY [14].
A recent study revealed several distinct features in a large stack of multi-elemental composition data from these sediments, which can be aligned consistently in stratigraphic order [15]. This multi-elemental chemostratigraphy observed within the Minamitorishima EEZ consists of five units intercalated by three REY-enriched layers, termed “REY peaks” (ΣREY > 2000 ppm), with the following sequence from top to bottom: Unit I, Unit II, the 1st REY peak, Unit III, the 2nd REY peak, and alternation of Unit IV and Unit V with the 3rd REY peak [15]. The chemostratigraphic correlation unveiled a lateral distribution of the REY peaks; the 1st REY peak is commonly observed in most of the piston cores collected in the deep-sea basin south of Takuyo Daigo Seamount, whereas the 2nd and 3rd REY peaks were confirmed in a more limited number of cores [15].
Chemostratigraphy also sheds new light on a formation mechanism of the REY peaks. A previous study demonstrated that one or multiple chemostratigraphic units including the REY peaks are missing in almost all the cores within the Minamitorishima EEZ [15]. Specifically, many of the cores are missing the chemostratigraphic units and REY peaks below the 1st REY peak (i.e., Units III to V and the 2nd and 3rd REY peaks) [15]. On the other hand, visual core descriptions and detailed microscopic observations showed that the REY peaks are composed of much coarser grains, such as biogenic calcium phosphates (BCP) and phillipsite, compared to other units [16]. Considering these sedimentological and geochemical observations, the formation of the REY peaks may be related to erosion of the sediment column, which was probably caused by enhanced bottom currents during the deposition of the 1st REY peak, and likely washed out the fine grains, such as clay-sized grains [15,16,17].
Notably, a previous study applied the chemostratigraphic correlation to the sediments collected using piston cores (maximum of ~15 mbsf) only within the Minamitorishima EEZ ([15]; Figure 1). Neither the sediments at a depth greater than 15 mbsf nor those outside of the Minamitorishima EEZ have ever been studied; hence, the spatial extent of the REY peaks in the western North Pacific Ocean have not been completely determined. In this study, we expand the target dimensions in both the vertical and horizontal directions, and show the continuity of the REY peaks in the western North Pacific Ocean (18°38′ N–26°46′ N, 150°49′ E–159°00′ E). To confirm the validity of the chemostratigraphy constructed from the sediments within the Minamitorishima EEZ and the spatial continuity of the REY peaks, we analyzed the bulk chemical composition of (1) Ocean Drilling Program (ODP) cores, (2) piston cores from the northern Pigafetta Basin and other small basins surrounded by the Marcus-Wake Seamounts, east to southeast of the Minamitorishima EEZ, and (3) piston cores south and east of Takuyo Daigo Seamount. Our results have implications for the distribution of REY-enriched layers and the effectiveness of the chemostratigraphic correlation to explore potential areas for REY-rich mud development in the future.

2. Materials and Methods

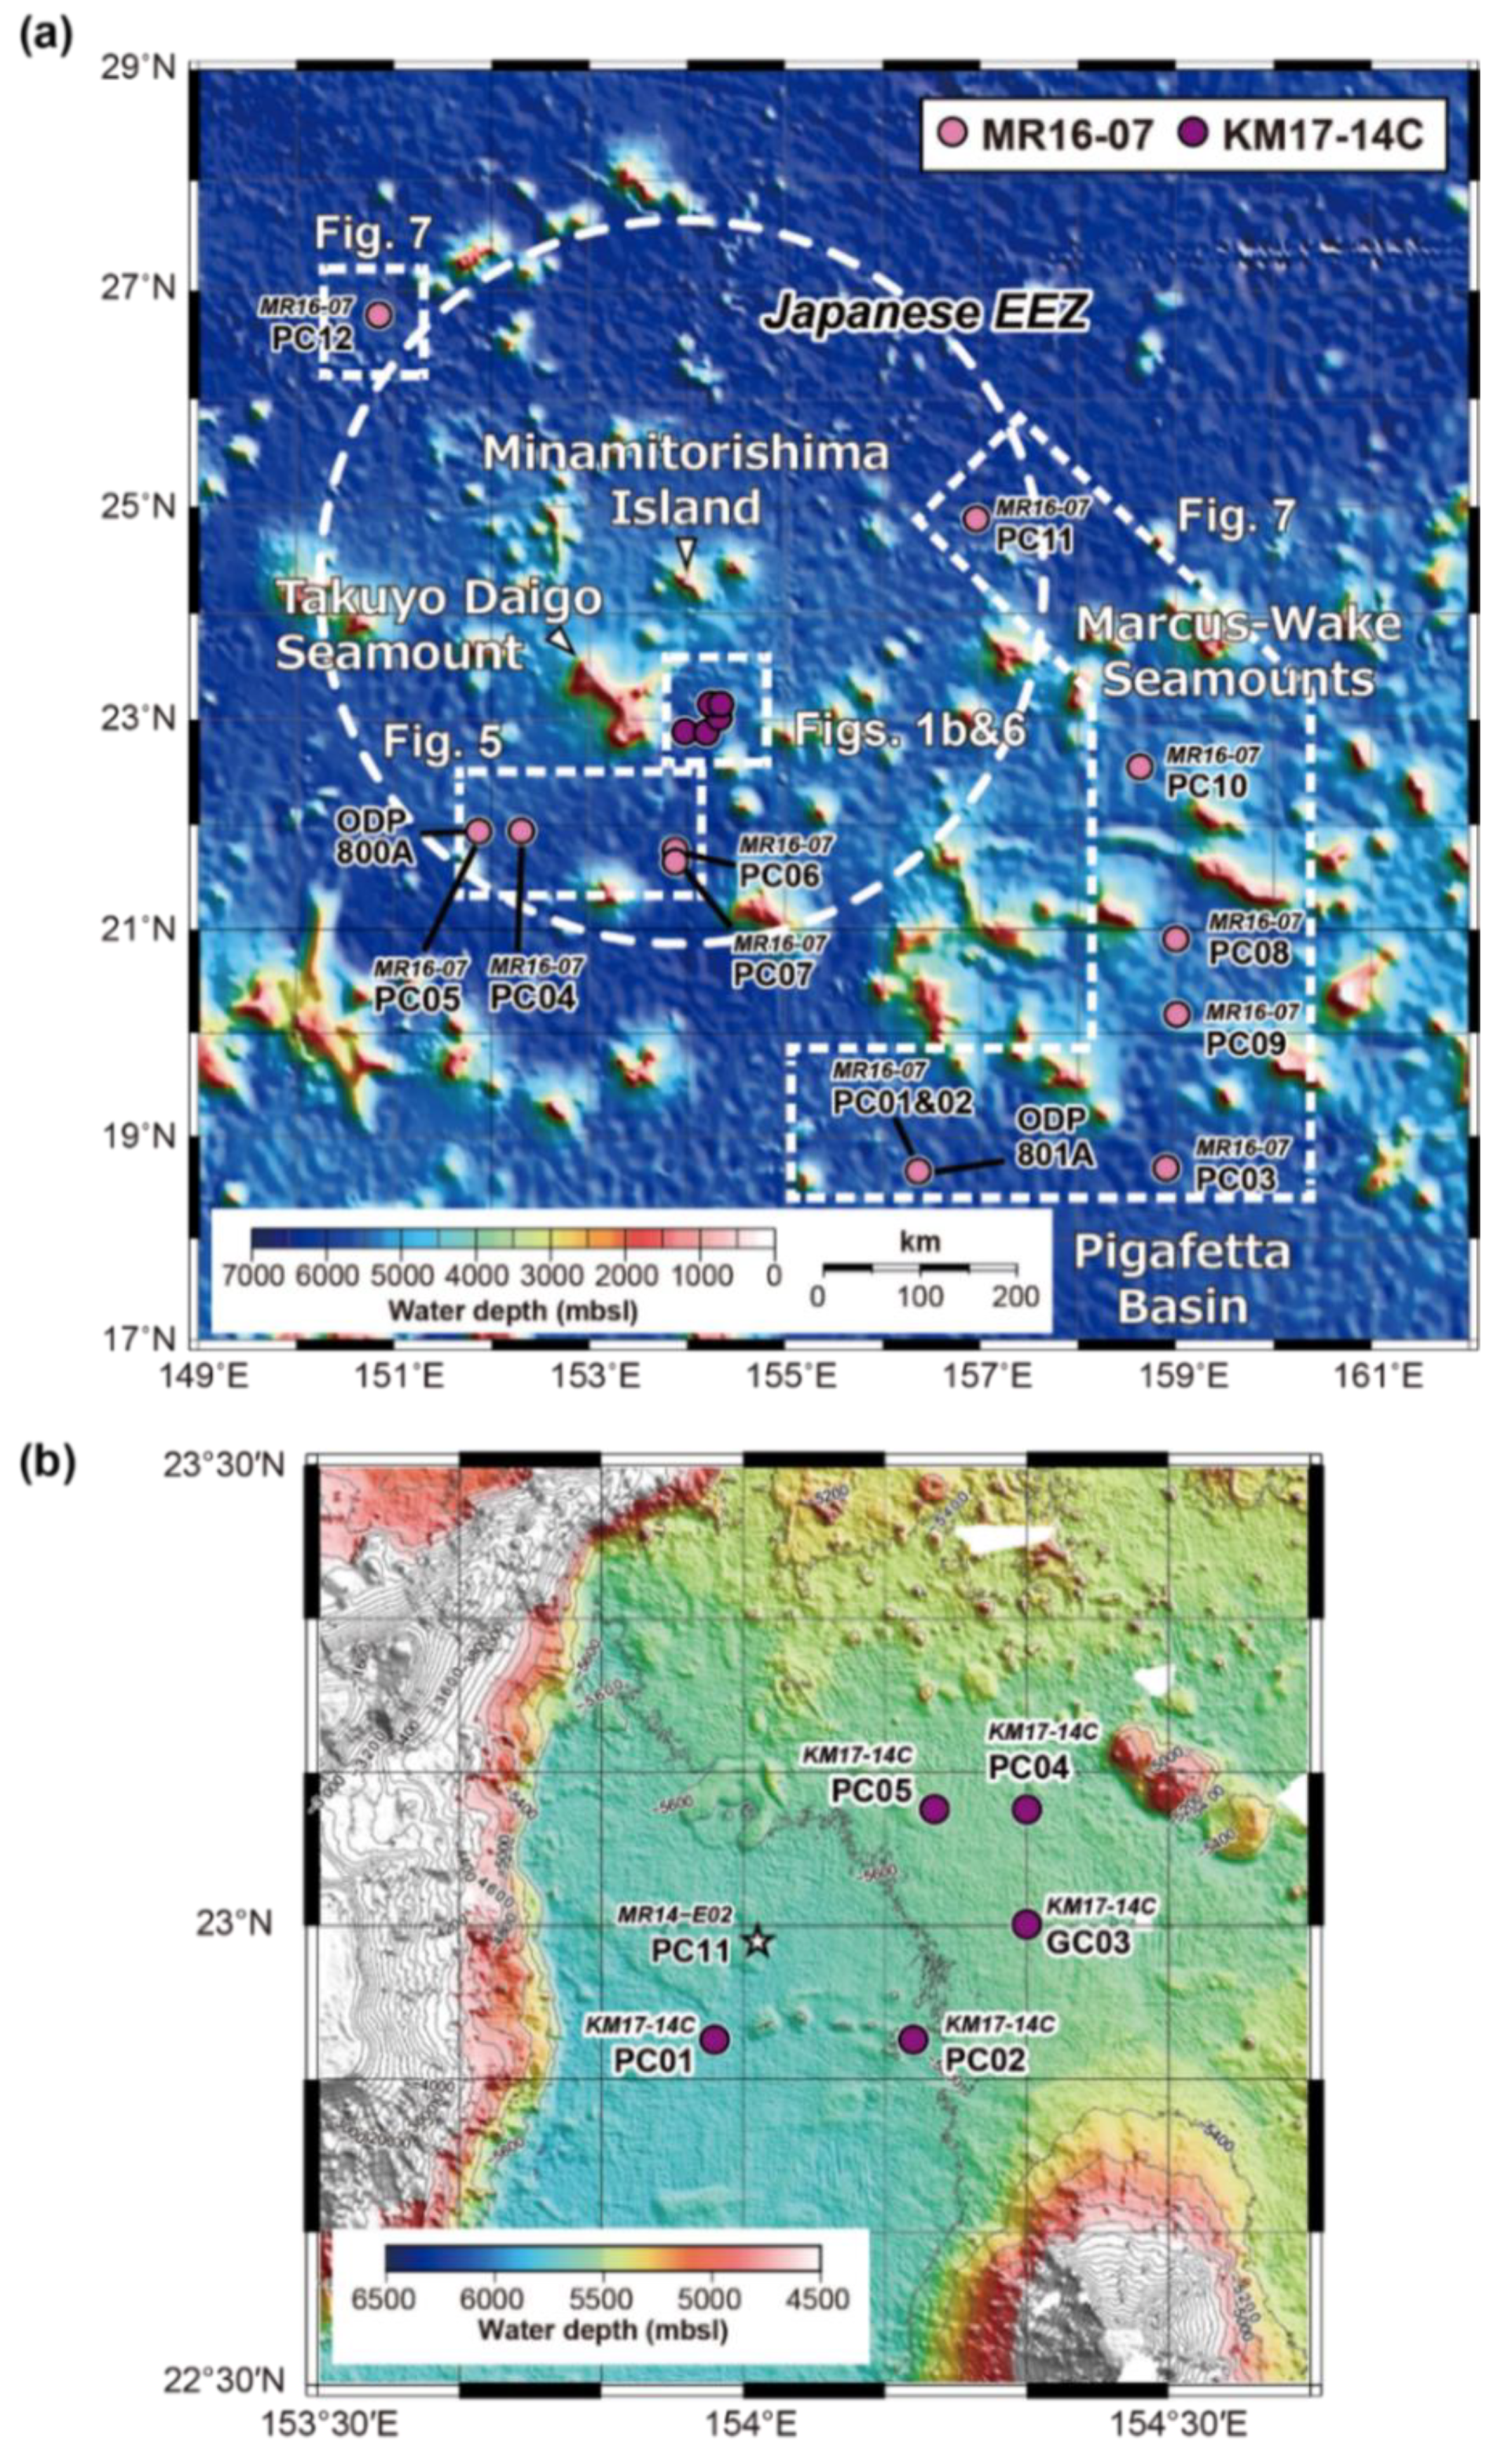
2.1. Sample Information

We targeted two drilling cores collected in the northern Pigafetta Basin and the area south of Takuyo Daigo Seamount, western North Pacific Ocean (Figure 1; Table 1): ODP Site 800A (21°55.38′ N, 152°19.37′ E, water depth 5686.0 m below sea level; mbsl) and ODP Site 801A (18°38.568′ N, 156°21.57′ E, water depth 5673.8 mbsl) [18,19]. The depths of the entire cores drilled are 544.4 mbsf at Site 800A and 186.0 mbsf at Site 801A. Although the core recoveries were very poor (<30%), they contained pelagic brown clay between the top and 38.0 mbsf at Site 800A and between 8.0 and 63.8 mbsf at Site 801A [18,19]. Initial reports based on the shipboard analyses [18,19,20,21] showed the lithological information of Sites 800A and 801A. Herein, we refine and summarize the description based on the protocols of the International Ocean Discovery Program (IODP) [22] and Ohta et al. (2016) [16]. Core images of Sites 800A and 801A are available on the ODP web directory [23]. At Site 800A, the pelagic brown clay is mainly composed of clay (<4 μm grains), zeolites, quartz, feldspar, and red-brown, semi-opaque Fe oxides [18,21]. An X-ray diffraction (XRD) analysis showed that the predominant clay mineral is smectite, with minor fraction of illite [24]. Moreover, an XRD analysis indicated a change in the mineralogical composition of zeolite; phillipsite is relatively abundant in the upper part of the sediment column, whereas clinoptilolite increases in the lower part of pelagic clay unit [24]. At Site 801A, the pelagic brown clay consists of two subunits: dark reddish-brown pelagic clay with zeolites, and brown pelagic clay with light-colored streaks [19,24,25]. The upper part is composed of clay (<4 μm grains), quartz, red-brown, semi-opaque Fe oxides, ferromanganese (Fe-Mn) micronodules, phillipsite, and rare benthic foraminifers. In addition, the presence of nannofossil ooze intervals were reported in Sections 129-801A-4R-2 to 129-801A-5R-1. The lower brown pelagic clay with light-colored streaks is composed of clay (<4 μm grains), zeolites, red-brown, semi-opaque Fe oxides, Fe-Mn micronodules, radiolaria, and silt-sized quartz. The difference between the brown-colored matrix and light-colored streaks is the concentration of red-brown, semi-opaque Fe oxides and Fe-Mn micronodules [19]. An XRD analysis showed the predominance of smectite and the presence of illite [24]. Similar to Site 800A, phillipsite is abundant in the upper part of the pelagic clay unit [24]. Clinoptilolite increases below the nannofossil ooze intervals [24]. In this study, we analyzed 13 samples from Site 800A and 25 samples from Site 801A, all of which were collected from the pelagic brown clay unit. The age at the bottom of the pelagic brown clay unit was estimated as early Campanian [18,19]. Major-element and REY data for Sites 800A and 801A have been reported by Yasukawa et al. (2016) [5]. In this study, we report new trace-element content data other than REY.
In addition, 16 piston cores and one gravity core from the study area were collected and newly analyzed during Cruises MR16-07 by R/V Mirai and KM17-14C by R/V Kaimei. Cruises MR16-07 and KM17-14C were conducted from 1 to 25 November 2016 and from 16 December 2017 to 7 January 2018, respectively. The location of each core is shown in Figure 1 and Table 1. Notably, cores MR16-07 PC01 to PC03 were collected from the Pigafetta Basin, and cores MR16-07 PC08 to PC10 were collected from other small basins surrounded by the Marcus-Wake Seamounts. During the cruises, we implemented microscopic observation under a polarizing microscope following the protocols of the International Ocean Discovery Program (IODP) [22] and Ohta et al. (2016) [16] (Figure 2). The lithology of the cores is mainly homogeneous, pelagic brown clay composed of clay (<4 μm grains) with minor amounts of quartz and feldspar, red-brown, semi-opaque Fe oxides, volcanic glass, ferromanganese micronodules, and other heavy minerals, with little calcareous or siliceous microfossils. Moreover, MR16-07, PC01 to PC03, and PC06 to PC10 were also confirmed to contain a zeolite-rich layer (>10% of zeolite), and KM17-14C PC01 to PC05 contained apatite- and zeolite-rich layers (>10% of apatite and zeolite). Notably, the zeolite and apatite in the studied samples were mainly phillipsite and BCP, respectively.

2.2. Analytical Methods
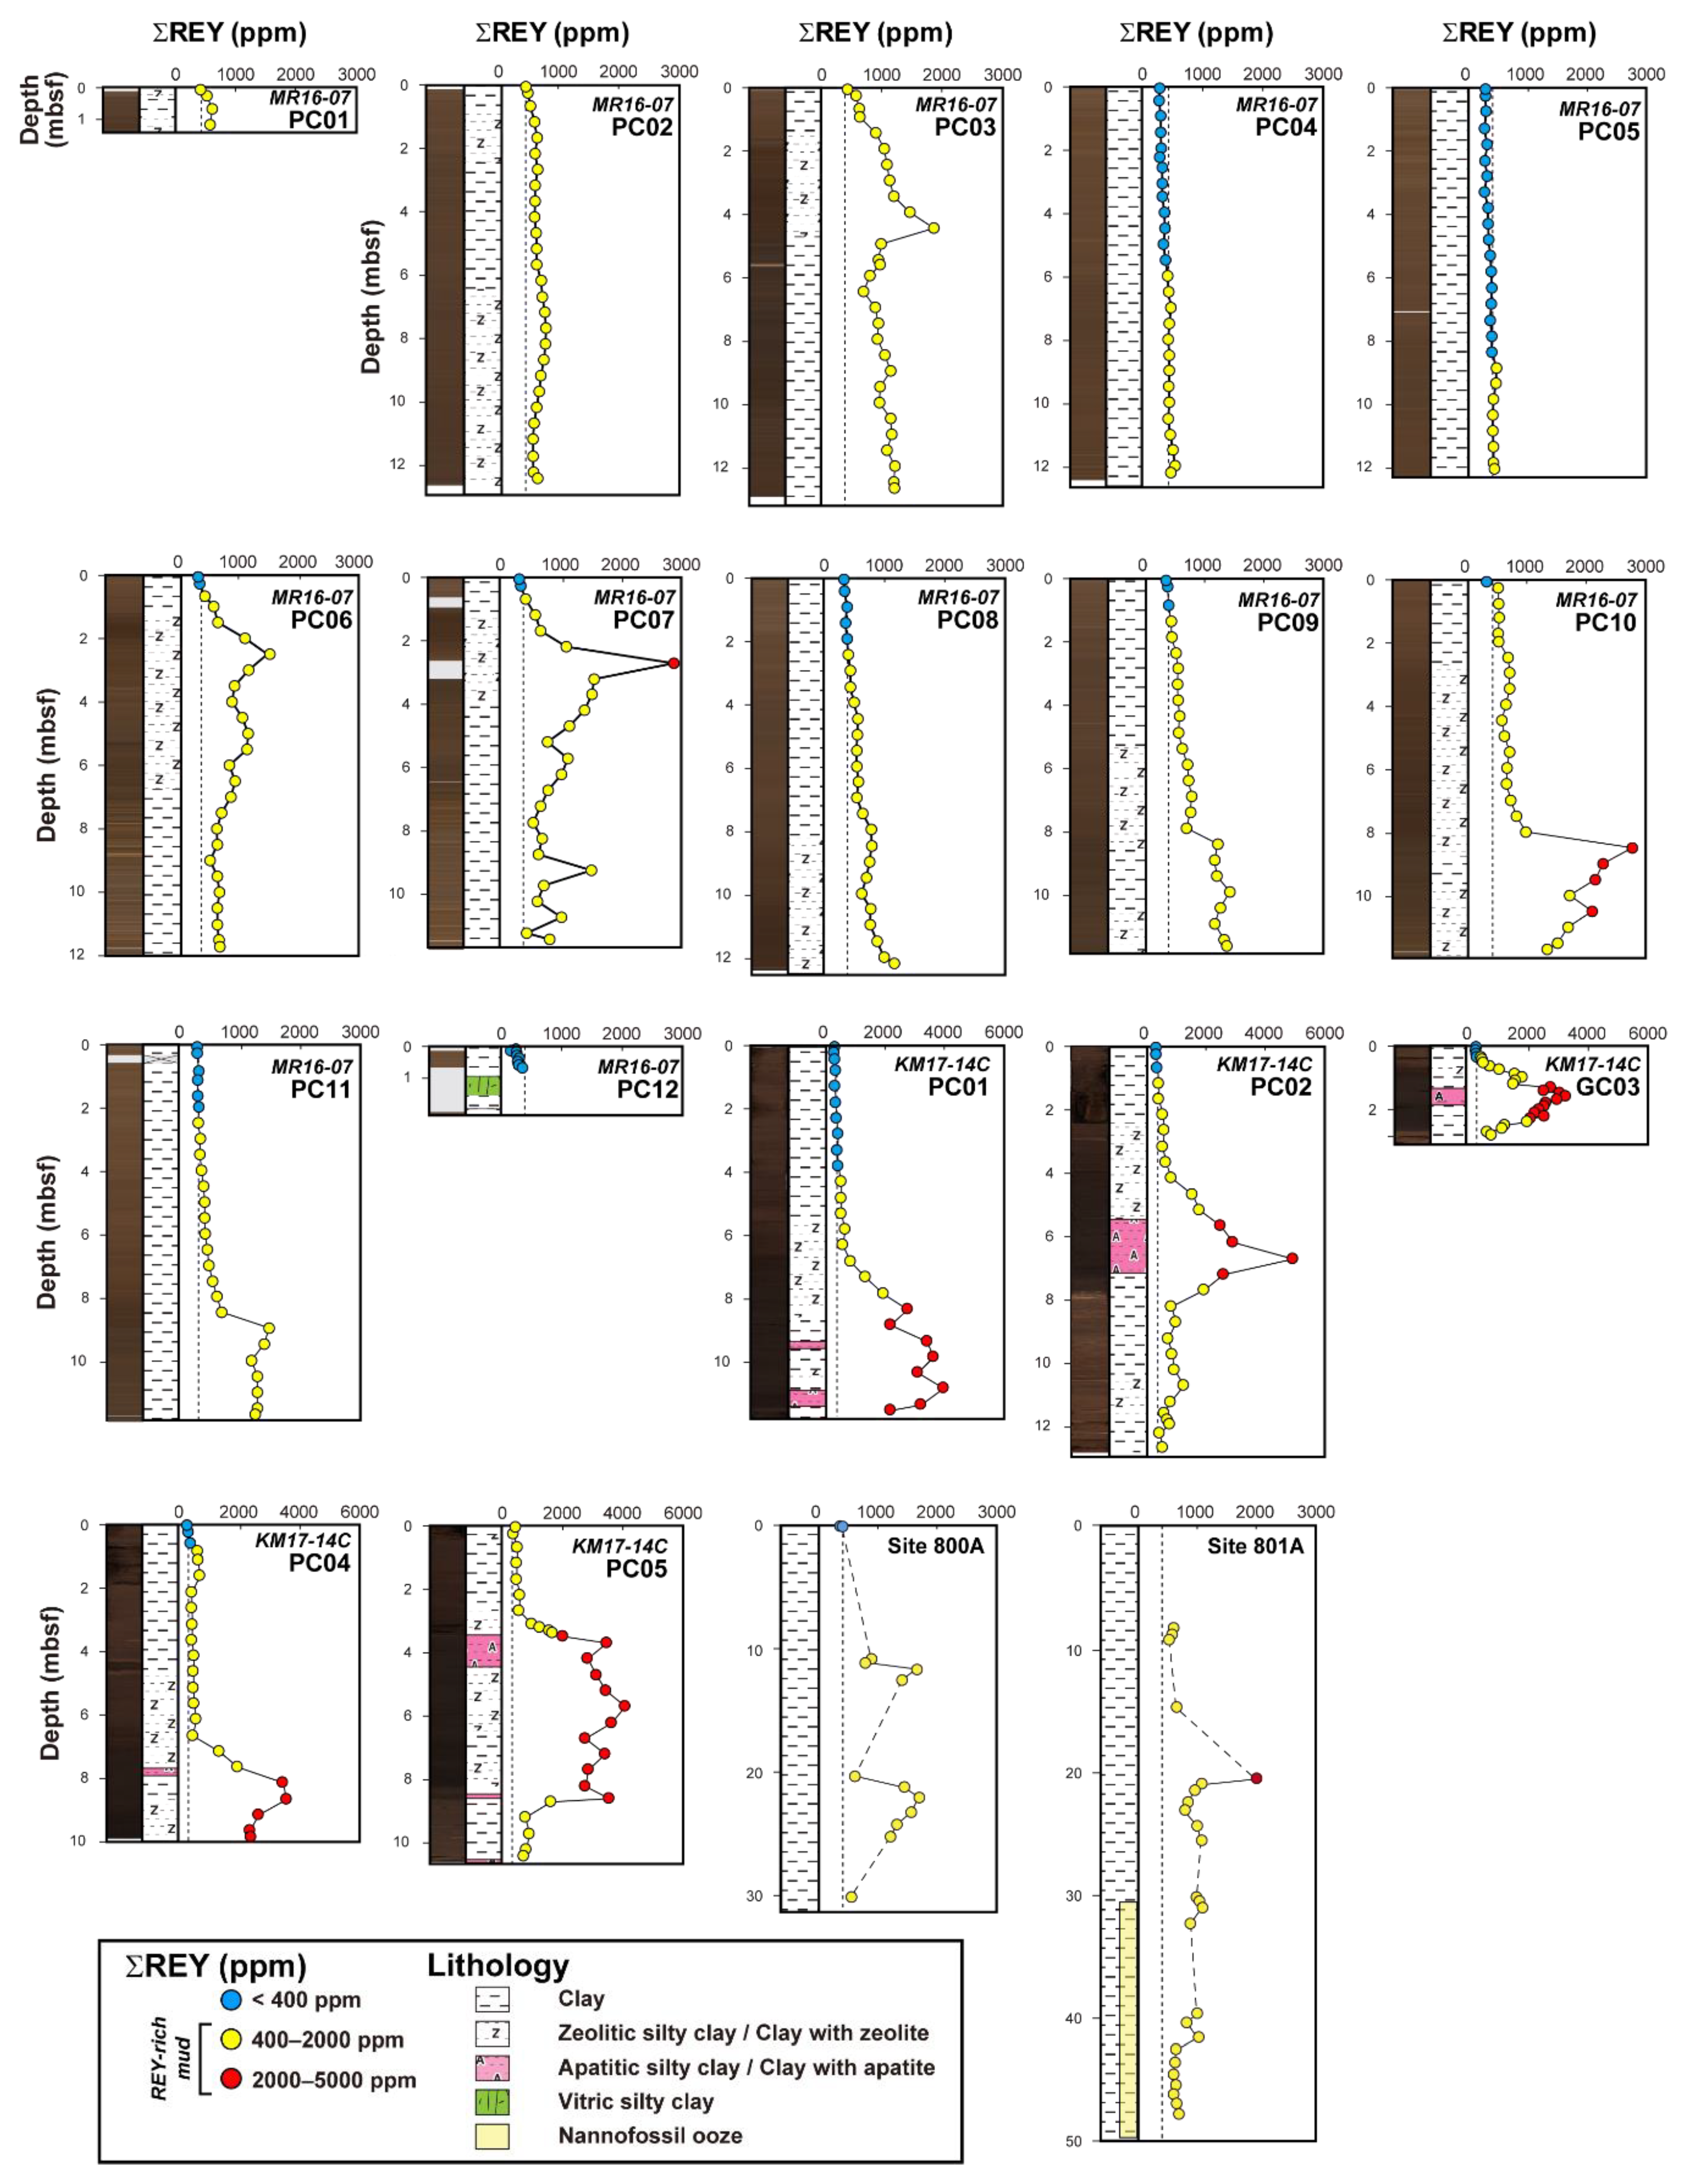
All of the major- and trace-element analytical processes were conducted at the Department of the Systems Innovation, University of Tokyo, Japan. Bulk sediment samples for chemical analyses were collected using ~20 cm3 scoops and homogenously powdered after drying at 40 °C. For trace-element analysis, TAMAPURE®-AA-100 grade reagents, 70% HClO4 (Tama Chemical Co., Ltd., Kawasaki, Japan), AAS grade reagents (for atomic absorption analysis), 50% HF, 60% HNO3, and 36% HCl (Kanto Chemical Co., Inc., Tokyo, Japan), were used without any additional purification. For major-element analysis, dried Li2B4O7 (Merck Millipore Co. Spectromelt®A10, Burlington, MA, USA) was used as a reagent.
Analytical determination of the major-element contents followed the methods described by Kato et al. (1998, 2002) and Yasukawa et al. (2014) [7,26,27]. Major-element contents were measured using an X-ray fluorescence (XRF) spectrometer Rigaku ZSX Primus II at the Department of the Systems Innovation, University of Tokyo. The powdered samples were dried at 110 °C for ~12 h and ignited at 950 °C in a muffle furnace for over 6 h. Loss on ignition (LOI) was calculated from the sample weight loss during the ignition process. The XRF analysis was conducted using glass beads, which were made from 0.400 g of the ignited sample powder homogeneously mixed with 4.000 g of Li2B4O7 flux by fusing at 1190 °C for 7 min in a Pt/Au crucible with an electrical bead sampler (Tokyo Kagaku TK-4100). Before fusing, a few drops of 2 wt.% LiBr solution were added to the sample as a releasing agent. Geochemical reference materials issued by the Geological Survey of Japan (GSJ) were used to make calibration curves for the measurements. The analytical results were within 3% (relative percent difference) of the accepted values for GSJ reference material JB-1b.
Analytical determination of the trace-element and REY contents followed the methods by Kato et al. (2005), Yasukawa et al. (2014), Takaya et al. (2018), and Tanaka et al. (2020) [7,14,15,28]. The measurements were collected using an inductively coupled plasma-quadrupole mass spectrometer (ICP-QMS; Thermo Fisher Scientific i-CAP Q, MA, USA) at the Department of Systems Innovation, University of Tokyo. After the powdered samples were dried at 110 °C, 0.050 g of the sample powder was decomposed by a mixed acidic solution of HNO3–HF–HClO4 in a tightly sealed Savillex® Teflon perfluoroalkoxy alkane (PFA) vial on a hot plate at 130 °C for 2 h. Then, the mixed acidic solution was evaporated at 110 °C for 12 h, 160 °C for 6 h, and 190 °C until it was dry. The residue was dissolved with 2 mL of aqua regia on a hot plate at 90 °C for 6 h, followed by progressive evaporation at 120 °C for 2 h and 160 °C until it was dry. The residue was dissolved by 10 mL of a 2 wt.% mixed acidic solution of HNO3:HCl:HF = 20:5:1 on a hot plate at 90 °C for 3 h. Finally, it was diluted to 1:10,000 by mass using the same 2 wt.% HNO3–HCl–HF mixed acidic solution. During the ICP-QMS measurements, correction of the spectral overlaps from oxides and hydroxides (44Ca16O on 60Ni, 47Ti16O on 63Cu, 50Ti16O on 66Zn, 135Ba16O and 134Ba16O1H on 151Eu, 137Ba16O and 136Ba16O1H on 153Eu, 141Pr16O and 140Ce16O1H on 157Gd, 143Nd16O on 159Tb, 147Sm16O and 146Nd16O1H on 163Dy, 149Sm16O on 165Ho, and 150Nd16O, 150Sm16O on 166Er, and 165Ho16O on 181Ta) was conducted following Aries et al. (2000) [29]. The analyses yielded results generally within 5% of accepted values of the GSJ reference material JB-2.

3. Results

The new major- and trace-element data measured in this study are shown in Table S1. Downhole variations in REY content at Sites 800A and 801A and the 17 piston/gravity cores of Cruises MR16-07 and KM17-14C are shown in Figure 2. All of the samples, except for MR16-07 PC12, contained the REY-rich mud, i.e., sediments with more than 400 ppm of ΣREY [1].
Except for a sample at the surface of Site 800A (360 ppm of ΣREY at 0.11 mbsf), all the samples from both Sites 800A and 801A were categorized as REY-rich mud. In addition, at least one REY peak of over 2000 ppm ΣREY was confirmed at 20.5 mbsf at Site 801A. Although ΣREY from Site 800A was up to 1700 ppm, Site 800A contained two REY-enriched layers at 11.6 mbsf and 22.0 mbsf. For the piston cores collected during Cruise MR16-07, REY peaks (ΣREY > 2000 ppm) were observed in only two cores: MR16-07 PC07 and PC10. MR16-07 PC07 has a REY peak with 2880 ppm ΣREY at 2.69 mbsf. MR16-07 PC10, which is the easternmost core containing REY peaks in the study area, contained samples showing ΣREY > 2000 ppm at 8.46–9.46 mbsf and at 10.5 mbsf. MR16-07 PC04, 05, and 06 had no REY peaks, even though they were collected near the high potential area for REY south of Takuyo Daigo Seamount. The other cores collected during Cruise MR16-07, i.e., MR16-07 PC01, PC02, PC03, PC08, PC09, PC11, and PC12, did not have REY peaks. All five cores collected during Cruise KM17-14C had thick REY peaks (Figure 2); the peaks occurred at 8.33–11.54 mbsf in PC01, 5.67–7.21 mbsf in PC02, 1.30–2.31 mbsf in GC03, 8.16–9.86 mbsf in PC04, and 3.50–8.59 mbsf in PC05.
Figure 3 shows the REY patterns of all the samples normalized by the post-Archean average Australian shale (PAAS) [30]. Similar to the data from previous studies around Minamitorishima Island [11,14,31], the samples in this study had significantly higher REY concentrations than PAAS and showed middle to heavy REE-enrichment with negative Ce anomalies. Additionally, the samples with low REY concentrations, i.e., MR16-07 PC04 to PC09, PC11, PC12, and KM17-14C PC01 to GC03 (ΣREY > 400 ppm; colored in gray in Figure 3), showed a flat REY pattern or positive Ce anomalies.

4. Discussion

4.1. Major Components of REY-Rich Mud

Scatter diagrams of ΣREY–Fe2O3* (total iron as Fe2O3), ΣREY–P2O5, and ΣREY–CaO are shown in Figure 4. Previous studies [3,5,7,32,33] reported that REY-enrichment is attributed to three key components: hydrothermal Fe-oxyhydroxides, hydrogenous Mn-oxides, and BCP. In the REY- rich mud around Minamitorishima Island, BCP was the main host phase of REY and played a predominant role in the remarkably high REY content in the bulk sediment [11,14,31]. The samples newly analyzed in this study also showed distinct positive correlations on the ΣREY–P2O5 and ΣREY–CaO diagrams, but not on the ΣREY–Fe2O3* diagram (Figure 4). This result suggests that the REY-enrichment of the bulk sediment samples in this study was also been caused by a significant accumulation of BCP with high REY concentrations, whereas the contribution of hydrothermal Fe-oxyhydroxides seemed to be negligible. In addition, normalized REY patterns (Figure 3 and Figure S2) showed that most of the REY-rich mud samples (ΣREY > 400 ppm) had negative Ce anomalies similar to those of BCP, supporting the significant contribution of BCP to the REY compositions of the studied samples. The slightly positive Eu anomalies in all the samples and reference materials, which did not show up in our previous publications [5,11,15], were due to the updated reference values of the PAAS composition from Taylor and McLennan (1985) [34] to Pourmand et al. (2012) [30].
Although REY is supplied into seawater by both continental and hydrothermal inputs [40,41], the river input flux is estimated to be greater than the hydrothermal flux by approximately two orders of magnitude [40]. Therefore, the ultimate source of REY dissolved in seawater is likely to be continental input. Due to the difference in redox sensitivity, Ce is preferentially removed from oxic seawater, resulting in the characteristically Ce-depleted seawater REY pattern [42]. It is believed that BCP incorporates the dissolved REY from seawater and/or porewater after their deposition on the seafloor [4,5,43,44,45]. Therefore, the sediments enriched in BCP (e.g., REY peaks) inherit the seawater-like negative Ce anomaly.
Figure 3 also includes the samples showing flat REY patterns or positive Ce anomalies. Considering that these samples were not REY-rich mud (ΣREY < 400 ppm), they contained minimal amounts of BCP and originated mostly from terrigenous components [15,16,31]. Moreover, the positive Ce anomaly in the PAAS-normalized REY pattern can be regarded as an effect of hydrogenous Mn-oxides, as reported by previous studies [10,46,47]. Figure 4d shows a strongly positive correlation between Co and MnO contents, even among the samples with ΣREY < 400 ppm, colored in gray. This finding also supports the effects of Mn-oxides, because Co can be incorporated into hydrogenous Mn-oxides via the oxidation process of Co(II) to Co(III) [5,33,48].

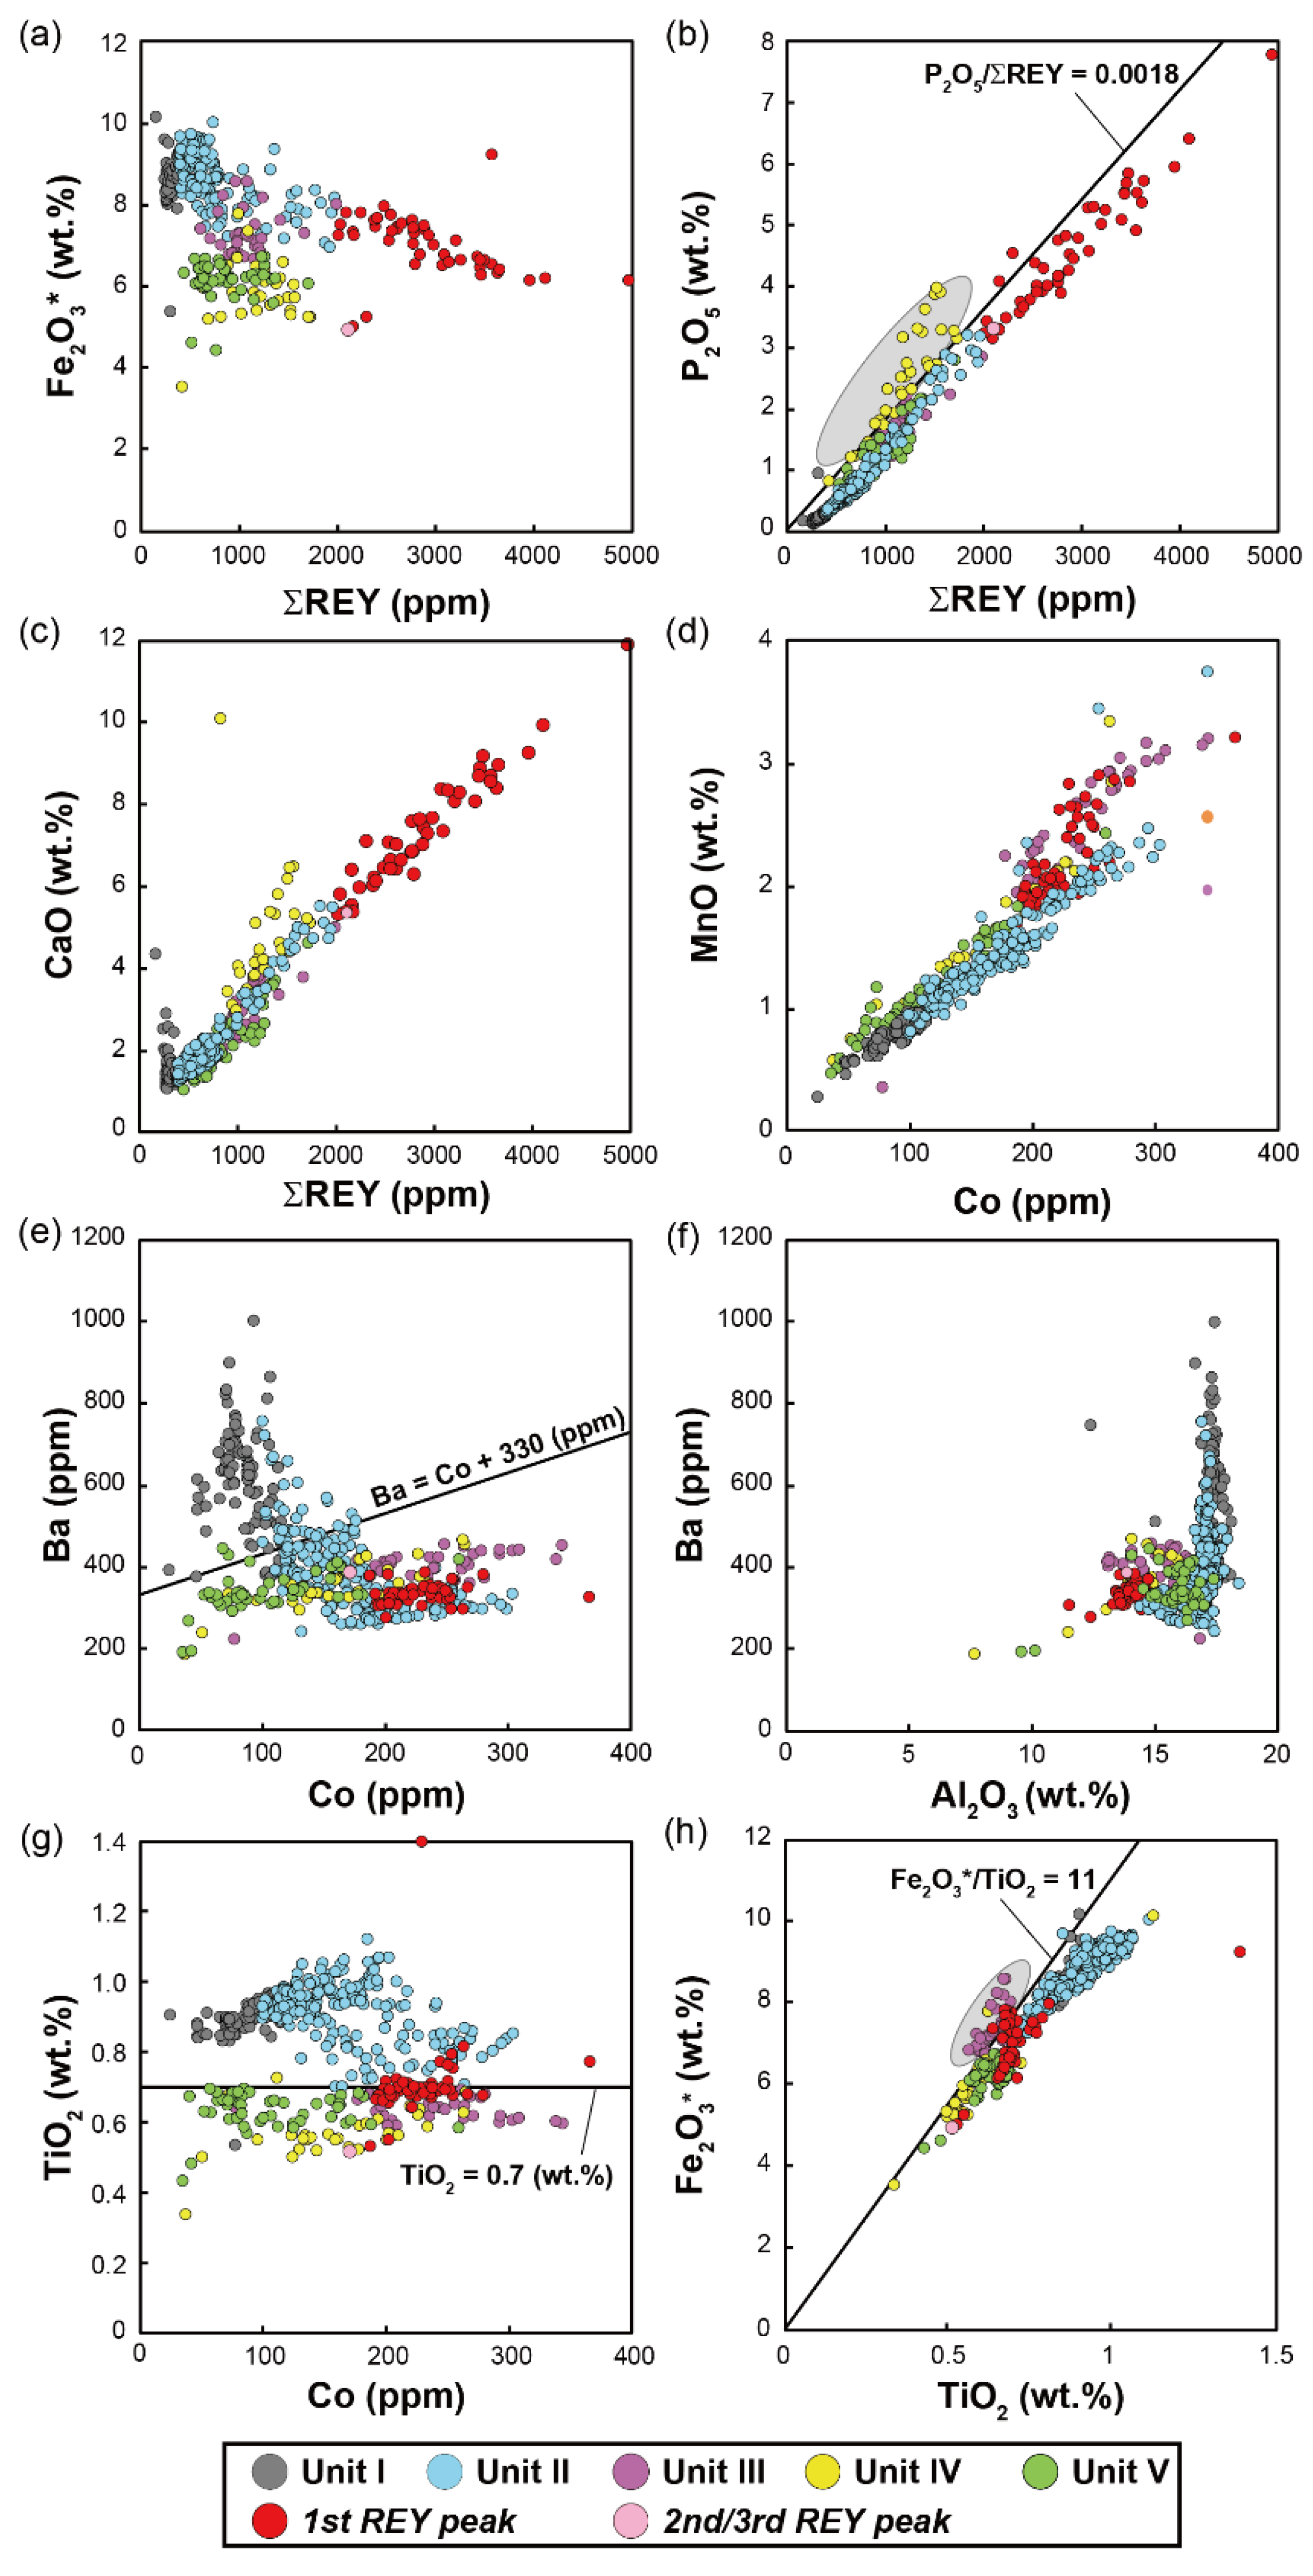
4.2. Geochemical Characterization and Classification of Samples

Tanaka et al. (2020) [15] established the multi-elemental chemostratigraphy within the Minamitorishima EEZ based on bulk chemical compositions of more than 1200 samples. The basic definitions of the chemostratigraphic units are as follows.
  • REY peak: ΣREY (ppm) > 2000
  • Unit I: Ba (ppm) > Co (ppm) + 330 (ppm) and ΣREY (ppm) < 400
  • Unit II: TiO2 (wt.%) > 0.7 and ΣREY (ppm) > 400
  • Unit III: Fe2O3* (wt.%)/TiO2 (wt.%) > 11 and ΣREY (ppm) > 400
  • Unit IV: P2O5 (wt.%)/ΣREY (ppm) > 0.0018 and ΣREY (ppm) > 400
  • Unit V: the remaining samples
In this study, the new samples also showed characteristics similar to those reported by Tanaka et al. (2020) [15]. Therefore, we categorized our new sediment samples based on the above classification, as described below.
First, samples with over 2000 ppm of ΣREY were categorized into the REY peak, because this is the primary focus of the present study. Afterwards, samples showing Ba enrichment on the Co–Ba diagram (Figure 4e) corresponded to those with ΣREY < 400 ppm near the surface of the cores, satisfying the definition of Unit I. In this study, 86 samples were categorized into Unit I. In the diagram between Al2O3 and Ba (Figure 4f), these Unit I samples were also characterized by high Al contents (Al2O3 > 17 wt.%), which implies that detrital components had a substantial influence on these surface sediments, as discussed in Section 4.1, based on the PAAS-normalized REY-pattern.
Figure 4g is a scatter diagram between Co and TiO2, in which the data structure shows a circular shape. The upper part of the circular shape is composed of two groups: the samples in Unit I and just below Unit I in the stratigraphic position. Because the samples of the latter group have relatively high TiO2 (>0.7 wt.%) and ΣREY > 400 ppm, they are categorized into Unit II. In this study, 192 samples are assigned to Unit II on the basis of the above thresholds.
The samples just below Unit II in the sediment column, termed Unit III by Tanaka et al. (2020) [15], showed a deviation from the overall linear trend in the TiO2–Fe2O3* diagram (Figure 4h). These 32 samples had a relatively high ratio of Fe2O3* to TiO2 (i.e., Fe2O3*/TiO2 > 11) with ΣREY > 400 ppm, and were thus categorized into Unit III.
On the scatter diagram between ΣREY and P2O5 (Figure 4b), several samples in this study deviated from the major linear trend that is composed of Units I to III. These samples had a P2O5/ΣREY ratio higher than 0.0018 with ΣREY > 400 ppm. Therefore, these 30 samples were classified into Unit IV. The remaining 63 samples with ΣREY > 400 ppm existed at the bottom of the core or showed alternation with Unit IV, and were categorized into Unit V. Further information is shown in Table S2.

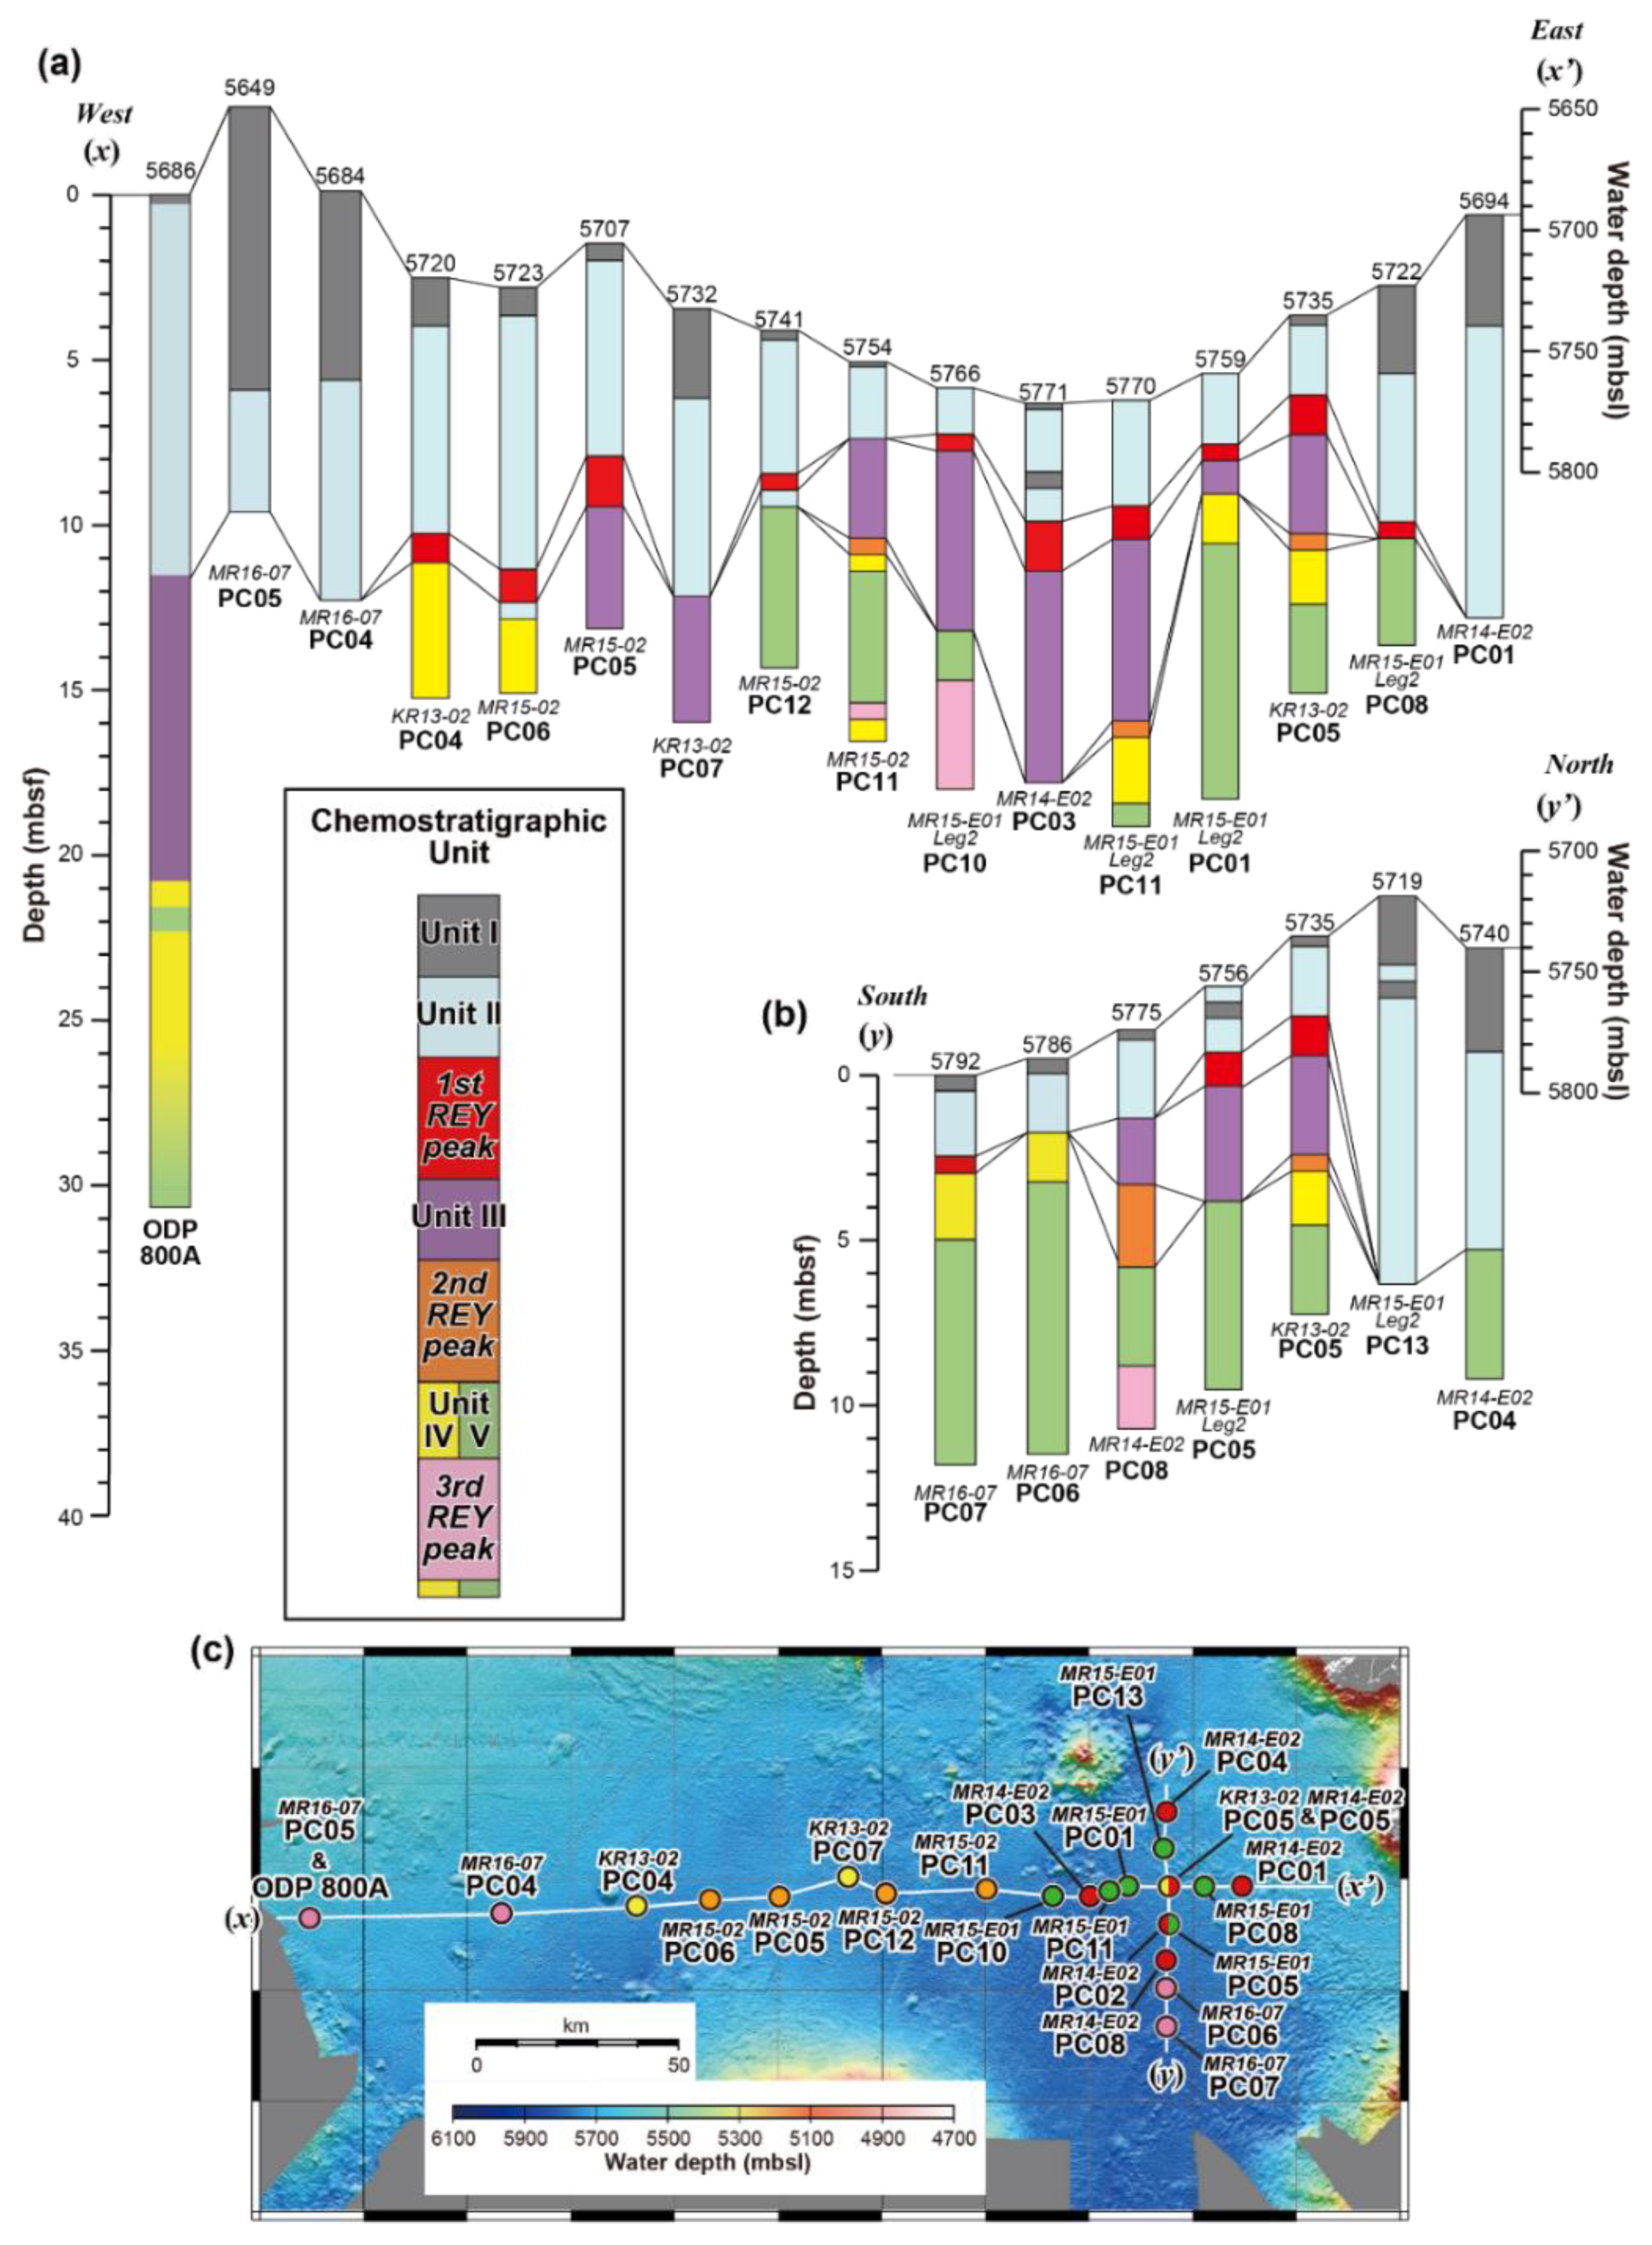
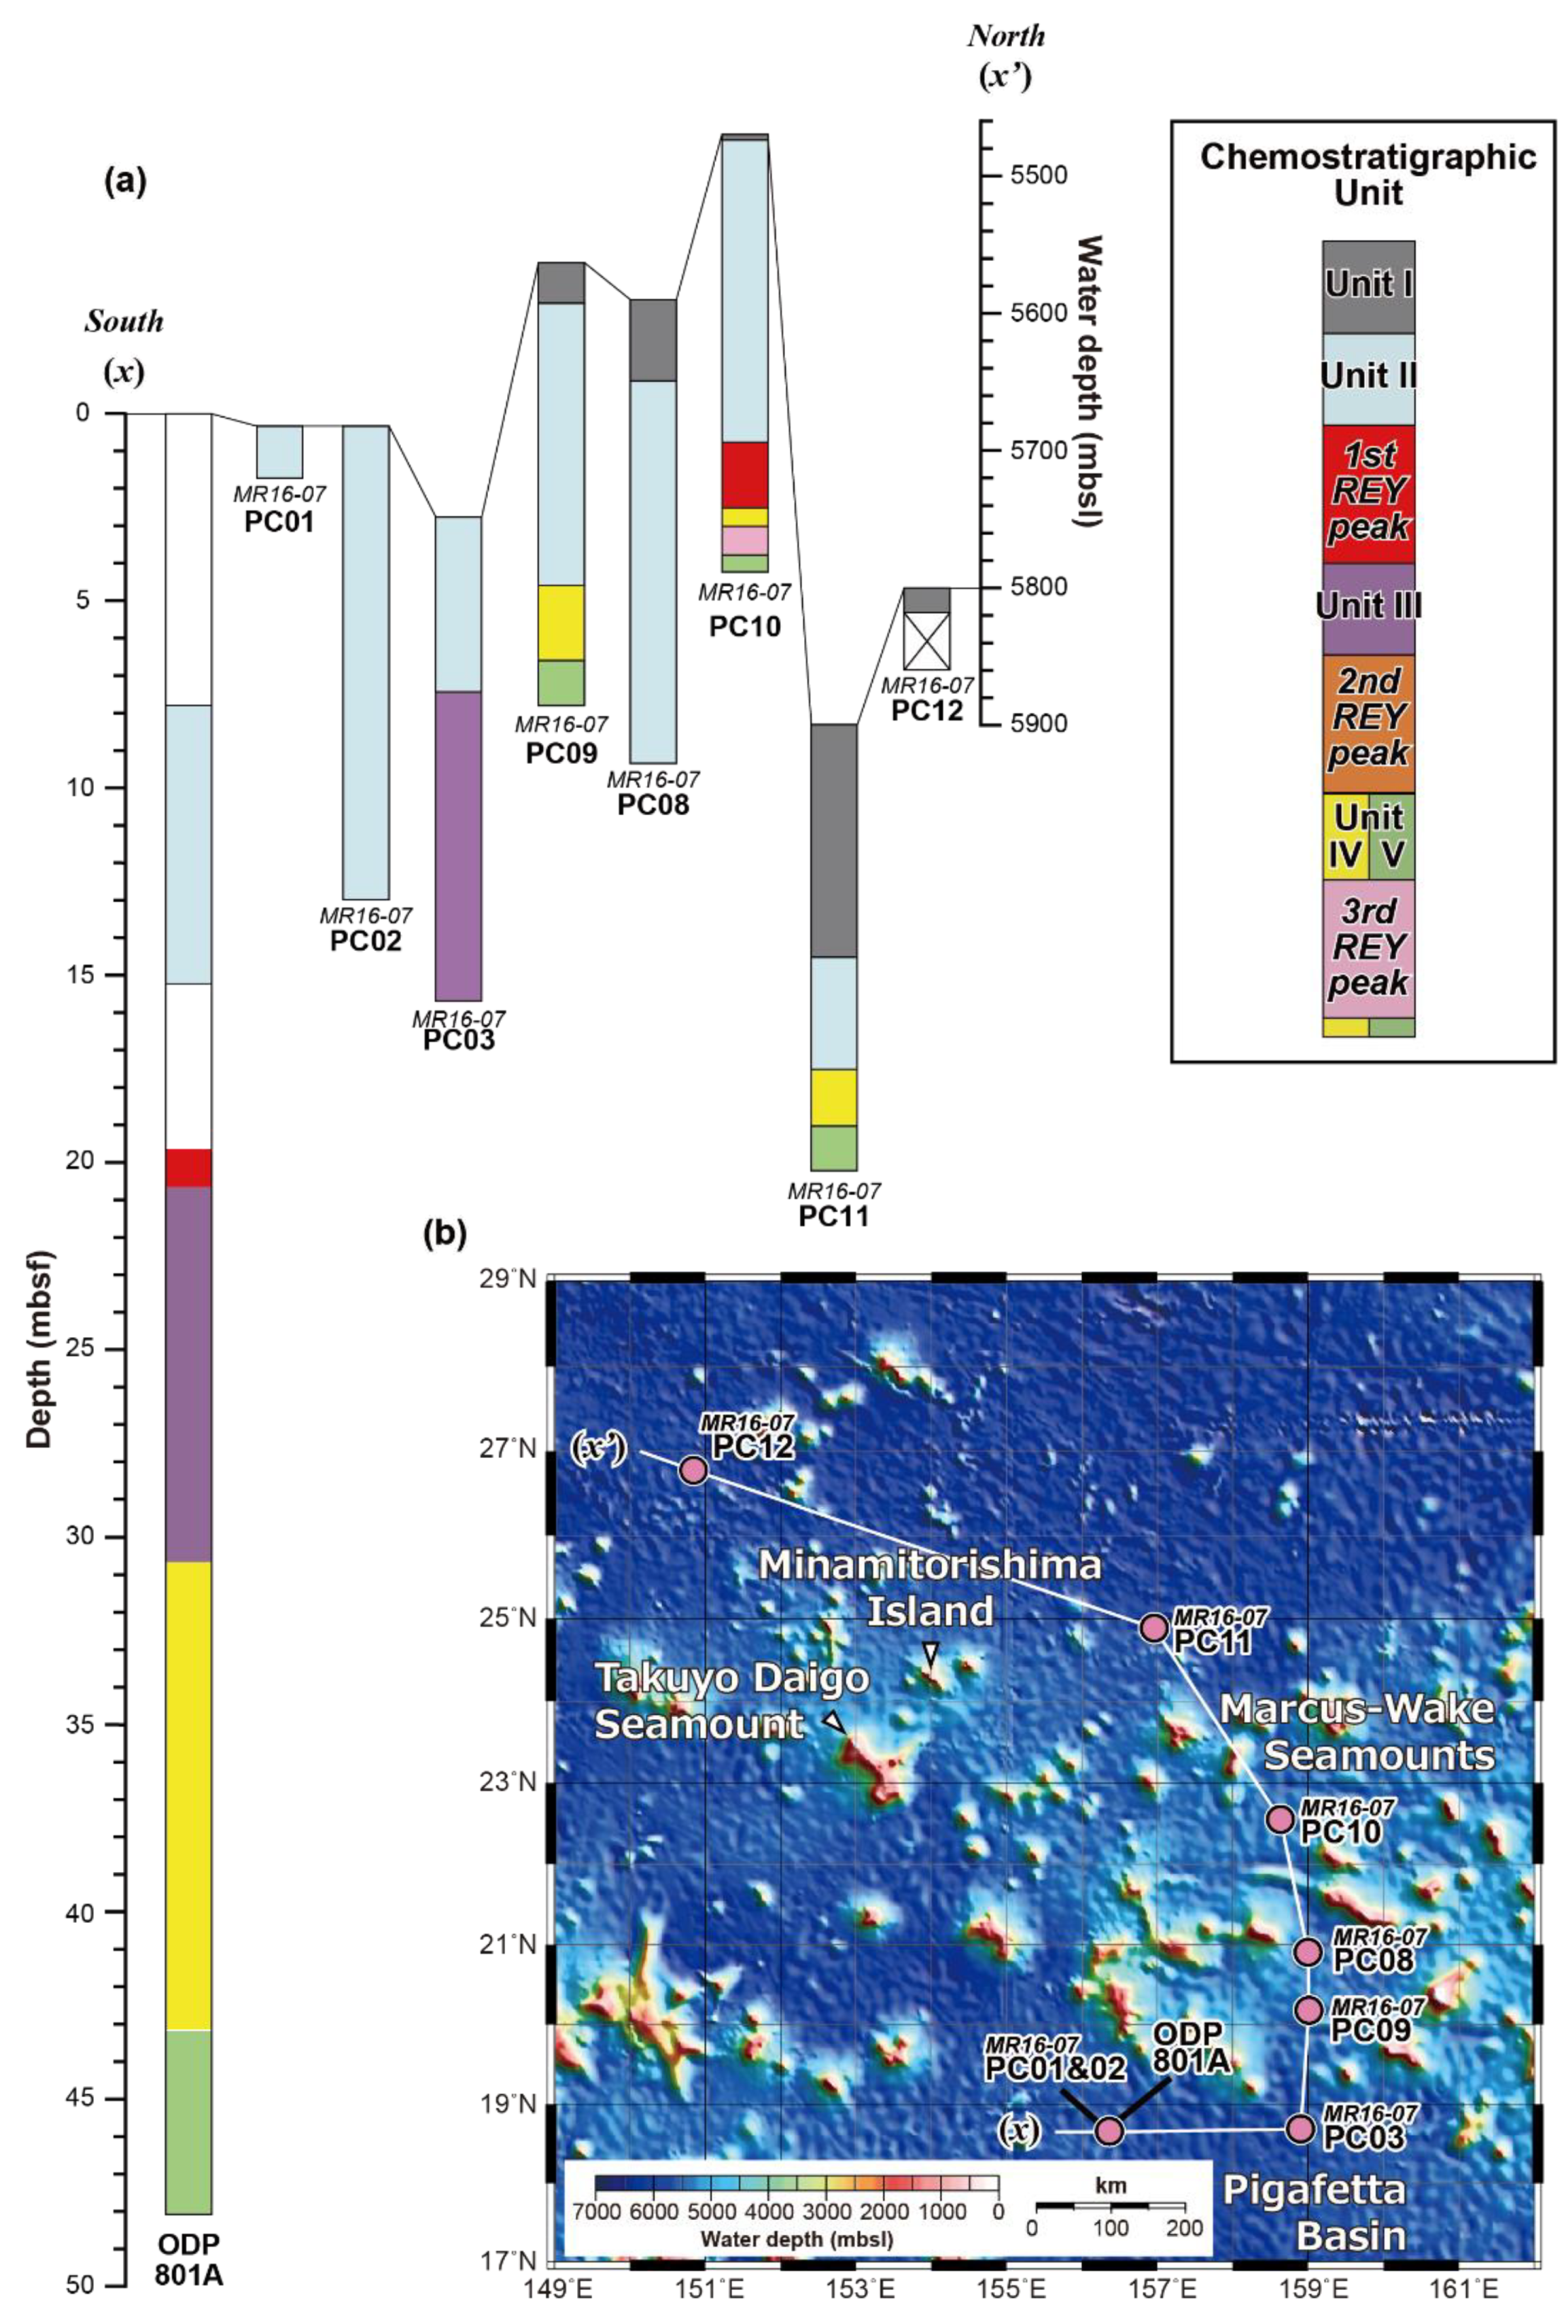
4.3. Chemostratigraphic Correlations of Sediments in the Western North Pacific Ocean

4.3.1. South of Takuyo Daigo Seamount

The area south of Takuyo Daigo Seamount is regarded as a prospective area with substantial resource potential for REY and Sc [13,14] (Figure 5). Among the studied cores, MR16-07 PC04 and PC05 were in the westernmost part, and MR16-07 PC06 and PC07 were in the southernmost part of the prospective area. In the westernmost part, MR16-07 PC04 and PC05 contained thick sections of Units I and II without any REY peaks (Figure 5). On the other hand, PC06 and PC07, collected from the southernmost part, also contained Units IV and V (with a REY peak in PC07; Figure 5). Based on the observation that the TiO2 content changed across the REY peak in PC07 (Figure S1), the REY peak could be the 1st REY peak.

4.3.2. East of Takuyo Daigo Seamount

For the area east of Takuyo Daigo Seamount, chemostratigraphic classification was applied to five piston/gravity cores: KM17-14C PC01 to PC05 (Figure 6). All of the cores contained Unit II and a thick REY peak (Figure 6). This REY peak can be considered the 1st REY peak, because it occurred below Unit II in all the cores. In addition, PC02, GC03, and PC05 contained the following units below the 1st REY peak: Units IV and V in PC02, Units III and V in GC03, and Unit V in PC05. In addition, PC01 to PC04 contained Unit I at the top of the cores.

4.3.3. North of Minamitorishima Island and Outer Basins around the Minamitorishima EEZ

MR16-07 PC12 in the small basin northwest of the Minamitorishima EEZ contained only Unit I (Figure 7), probably due to the poor recovery length of the core (<1 mbsf). On the other hand, MR16-07 PC11 collected from the deep-sea basin northeast of Minamitorishima Island contained Units I, II, IV, and V, while it lacked Unit III and did not contain any REY peaks (Figure 7). This finding suggests that the chemostratigraphy observed south of Takuyo Daigo Seamount may be extended to the north of Minamitorishima Island with similar sedimentary sequences.
In addition, six piston cores, i.e., MR16-07 PC01, PC02, PC03, PC08, PC09, and PC10, were collected from outer basins east to southeast of the Minamitorishima EEZ, including the northern Pigafetta Basin and several small basins in the Marcus-Wake Seamounts (Figure 7). All of the cores showed a chemostratigraphic sequence similar to that within the Minamitorishima EEZ (Figure 7). PC01 to PC03 lacked Unit I and had a thick Unit II, whereas PC08 to PC10 had both Units I and II. In addition, PC03 contained Unit III, and PC09 and PC10 contained Units IV and V. It should be noted that only PC10 contained REY peaks among the six cores: it had double REY peaks at 8.46–9.46 mbsf and 10.5 mbsf (Figure 7). Focusing on their chemostratigraphic units, the upper and lower REY peaks in PC10 were located just below Unit II and intercalated in Units IV and V, respectively, suggesting that these two REY peaks in PC10 corresponded to the 1st and 3rd REY peaks.

4.3.4. Drilled cores at ODP Sites 800A and 801A

For ODP Sites 800A and 801A, Units II, III, IV, and V were confirmed in both cores (Figure 5 and Figure 7). Unit I at Site 800A and a REY peak at Site 801A were also identified. The REY peak at Site 801A is likely the 1st REY peak because it clearly occurred above Unit III.

4.4. Spatial Continuity and Implications for the Formation Mechanism of the REY Peaks

4.4.1. South and east of Takuyo Daigo Seamount

In the area south of Takuyo Daigo Seamount, 38 piston cores were collected. Focusing on the horizontal correlations of the REY peaks in the east–west transect (Figure 5a), from KR13-02 PC05 to MR15-E01 Leg 2 PC10, the 1st REY peak occured at approximately 5 mbsf. However, the more distant the cores were from KR13-02 PC05, the deeper the depth at which the REY peaks occurred. In this transect, MR16-07 PC04 and PC05 in the west and MR14-E02 PC01 in the east did not contain any REY peaks, probably because of the large thickness of Units I and II. Considering that Unit I is dominated by terrigenous components [15,49], this observation indicates that thicker terrigenous components were deposited in the western part of the prospective area, preventing the piston cores from reaching the REY peaks [49,50]. In fact, Site 800A, at almost the same location as MR16-07 PC04, had a relatively REY-enriched layer (~1660 ppm ΣREY; Figure 2) at 11.6 mbsf in Unit III, below Unit II. Considering the depth of the boundary between Units II and III, which could be the position of the 1st REY peak in the multi-elemental chemostratigraphy, this observation is consistent with the trend that the occurrence of the 1st REY peak was deeper in the western part of the prospective area than in the central part. Moreover, the other REY-enriched layer at 22.0 mbsf at Site 800A implied the existence of the 2nd or 3rd REY peak(s) at the deeper part that could not be penetrated by a 15 m-long piston core.
In the north-south transect (Figure 5b), the occurrence and thickness of each unit and the position of the unit boundaries differed from core to core. For example, both MR16-07 PC06 and PC07 had Units I, II, IV, and V, but only PC07 contained the 1st REY peak. MR14-E02 PC08 and MR15-E01 Leg 2 PC05, located at ~10 km and ~20 km north of MR16-07 PC06, respectively, had Units I, II, III, and V. Notably, MR14-E02 PC08 contained the 2nd and 3rd peaks, whereas MR15-E01 Leg 2 PC05 had only the 1st REY peak. The reason why these cores lacked several units and REY peaks could be the presence of a bottom current [16] which is strong enough to erode sediments during deposition of the REY peaks. Erosional events could have contributed to the accumulation of BCP grains through selective deposition of coarse BCP grains, resulting in the formation of REY peaks [15,16,17]. However, if the bottom current was too strong due to local conditions, even the BCP grains could not have been deposited on the seafloor [51]. In other words, the REY peak could have also been eroded with the lower units. Thus, the variability in the lack of units or REY peaks could be attributable to spatial heterogeneity in the bottom current strength.
Compared the occurrence of chemostratigraphic units with water depth (Figure 5), the cores located at the greatest water depth (e.g., MR16-07 PC06 at 5786 mbsf and PC07 at 5792 mbsf) tended to lack Unit III and the 2nd REY peak. Meanwhile, the cores at relatively shallower water depths (e.g., MR15-E01 Leg 2 PC13 at 5719 mbsf and MR14-E02 PC01 at 5694 mbsf) had thick deposits of Units I and II. Notably, the cores at intermediate water depths (e.g., KR13-02 PC05 at 5735 mbsf) contained most of the units and multiple REY peaks. These observations imply that the erosion could have been stronger in the areas with the greatest water depth than in the relatively shallow areas during the 1st REY peak deposition.
East of Takuyo Daigo Seamount, Core KM17-14C GC03 had the 1st REY peak at the shallowest position (~2 mbsf) in the sediment column and KM17-14C PC05 haf the thickest peak (~5 m) among all the cores collected within the Minamitorishima EEZ (Figure 6). The lateral chemostratigraphic continuity revealed that the magnitude of sediment erosion was different between the areas south and east of Takuyo Daigo Seamount (Figure 5 and Figure 6), considering the thin 1st REY peak to the south and the thick 1st REY peak to the east of Takuyo Daigo Seamount. In addition, two cores east of Takuyo Daigo Seamount, KM17-14C PC02 and PC05, lacked Unit III and the 2nd and 3rd REY peaks, which was similar to MR15-E01 Leg 2 PC08 (Figure 5 and Figure 6). This finding suggests that the bottom current was sufficiently vigorous for chemostratigraphic unit removal (e.g., Units III and IV) in this area, as well as to the south of Takuyo Daigo Seamount [15]. Furthermore, the difference in the thickness of the 1st REY peak in this area implies local heterogeneity in the bottom current strength during deposition of the REY peak, similar to that in the area south of Takuyo Daigo Seamount.

4.4.2. North of Minamitorishima Island and outer basins around the Minamitorishima EEZ

In the area north of Minamitorishima Island and the outer basins around the Minamitorishima EEZ, only MR16-07 PC10 had a REY peak, even though seven piston cores were collected (cf. Section 4.3). The cores without any REY peaks could be classified into two types. First, MR16-07 PC09 and PC11 had Units I, II, IV, and V, and MR16-07 PC03 had Units II and III. These cores could have experienced sedimentary erosion because they lacked at least one chemostratigraphic unit or REY peak. On the other hand, MR16-07 PC01, PC02, and PC08 had only Units I or II, the units shallower than the 1st REY peak. Based on the previous discussion about the cores south of Takuyo Daigo Seamount (cf. Section 4.4.1 and Tanaka et al., 2020 [15]), the thickness of Units I and II prevented the retrieval of the 1st REY peak by 15-m piston coring. This inference seems reasonable, because ODP Site 801A, which has the same location as MR16-07 PC01 and PC02, contained the 1st REY peak at 20.5 mbsf below Unit II (Figure 7).
These features indicate that the multi-elemental chemostratigraphy characterizing the deep-sea sediments around Minamitorishima Island is consistent in the entire study area, although it is vertically expanded or compressed from place to place. Furthermore, the chemostratigraphic correlations including the REY peaks are common, even in other basins located outside of the Minamitorishima EEZ. Hence, our chemostratigraphic classification of the sediments provides a key to correlating the REY peaks and pursuing their continuity and spatial extent over a broader area of the western North Pacific.
This study validated the multi-elemental chemostratigraphy in the new areas and cores. Our results showed that (1) the thickest ever, i.e., ~5 m, 1st REY peak lies east of Takuyo Daigo Seamount, (2) the 1st REY peak exists deeper than the piston core length at Site 801A in succession with that confirmed within the Minamitorishima EEZ [11,14,15], and (3) the chemostratigraphy, including the 1st REY peak, was confirmed in the Pigafetta Basin and other small basins surrounded by the Marcus-Wake Seamounts, which are ~700 km away from Minamitorishima Island. These observations demonstrated that the 1st REY peak is distributed more widely than exhibited in previous studies that targeted only the Minamitorishima EEZ. We conclude that the multi-elemental chemostratigraphy is a useful tool to visualize the distinct characteristics latent in the apparently featureless pelagic clay. However, the genesis of such systematic geochemical variation in deep-sea clay and its implication on oceanography and resource geology should be a focus in future studies.

5. Conclusions

To confirm the continuity of the REY peaks, this study implemented a chemostratigraphic correlation between previously studied cores and ODP Sites 800A and 801A and 17 newly analyzed piston/gravity cores collected around Minamitorishima Island in the western North Pacific Ocean. These cores include deeper sediments (~30 mbsf at ODP Site 800A and ~48 mbsf at ODP Site 801A) and sediments outside of the Minamitorishima EEZ; this finding deepens the geochemical information about the pelagic clay in both the vertical and horizontal directions. Based on the major- and trace-element data set, this study confirmed that all of the cores except one contain the REY-rich mud (ΣREY > 400 ppm). Moreover, the REY peaks (ΣREY > 2000 ppm) were observed at 20.5 mbsf in ODP Site 801A, outside of the Minamitorishima EEZ (i.e., MR16-07 PC07 and PC10), and east of Takuyo Daigo Seamount (i.e., KM17-14C PC01 to PC05).
All of the studied samples could be reasonably categorized into the chemostratigraphic units proposed by Tanaka et al. (2020) [15]. Although the thickness of each unit was significantly variable, the stratigraphic sequence was consistent between the ODP drilling cores and the piston/gravity cores. This finding indicates that the depositional environment around Minamitorishima Island in the western North Pacific Ocean, including the Pigafetta Basin and other small basins in the Marcus-Wake Seamounts, was basically common, with some erosion involving the formation of the REY peak. However, REY peaks were confirmed in a very limited number of cores outside of the Minamitorishima EEZ, which implies that local geographic conditions could have affected the deposition of the REY peak layers.

Supplementary Materials

The following are available online at https://www.mdpi.com/2075-163X/10/6/575/s1. Figure S1: Depth profiles of color, lithology, ΣREY content, and geochemical indices characterizing the chemostratigraphy of all cores. The ΣREY content of the ODP sites includes the data from Yasukawa et al. (2016) [5]. Figure S2: CI-chondrite [30]-normalized REY pattern of all the samples. The data sources of the reference materials are as follows: Biogenic calcium phosphate (Takaya et al., 2018 [14]); deep-sea water in the western South Pacific (Zhang and Nozaki, 1996 [35]) and in the North Pacific (Alibo and Nozaki, 1999 [36]); hydrothermal sediment (Barrett and Jarvis, 1988 [37]); Mn-nodule in the Peru Basin and Clarion-Clipperton Zone (CCZ; Hein and Koschinsky, 2013 [38]) and in the Minamitorishima EEZ (Machida et al., 2016 [39]). Table S1: Major, trace, and rare-earth element data of ODP Cores 800A and 801A and 17 piston/gravity cores collected by Cruises MR16-07 and KM17-14C. Table S2: Complementary categorization of samples that cannot be characterized on the basis of the criteria defined in the text.

Author Contributions

Conceptualization, E.T., K.N., K.Y. and Y.K.; Methodology, K.F. and K.Y.; Resources, S.M., T.N., E.T., K.M., K.F., J.O., K.I. and K.Y.; Data Curation, E.T., K.Y. and K.N.; Writing—Original Draft Preparation, E.T.; Writing—Review and Editing, all authors; Visualization, E.T., K.Y., K.N. and K.F.; Supervision, Y.K.; Funding Acquisition, E.T., K.Y., K.N. and Y.K. All authors have read and agreed to the published version of the manuscript.

Funding

This research was financially supported by Japan Society for the Promotion of Science (JSPS) KAKENHI, grants numbers JP15H05771 to Y.K., JP25289334 and JP17H01361 to N.K., JP18K14168 to K.Y., and JP18J22633 to E.T.

Acknowledgments

We thank the shipboard scientific parties, captain, and crews of R/Vs Mirai and Kaimei for their dedicated work. We are grateful to Y. Itabashi and C. Kabashima for their assistance with the chemical analyses. This study was supported by the Council for Science, Technology and Innovation (CSTI), the Cross-ministerial Strategic Innovation Promotion Program (SIP) “Next-generation technology for ocean resources exploration”.

Conflicts of Interest

The authors declare no conflict of interest.

References

  1. Goodenough, K.M.; Wall, F.; Merriman, D. The rare earth elements: Demand, global resources, and challenges for resourcing future generations. Nat. Resour. Res. 2018, 27, 201–216. [Google Scholar] [CrossRef] [Green Version]
  2. Alonso, E.; Sherman, A.M.; Wallington, T.J.; Everson, M.P.; Field, F.R.; Roth, R.; Kirchain, R.E. Evaluating rare earth element availability: A case with revolutionary demand from clean technologies. Environ. Sci. Technol. 2012, 46, 3406–3414. [Google Scholar] [CrossRef]
  3. Kato, Y.; Fujinaga, K.; Nakamura, K.; Takaya, Y.; Kitamura, K.; Ohta, J.; Toda, R.; Nakashima, T.; Iwamori, H. Deep-sea mud in the Pacific Ocean as a potential resource for rare-earth elements. Nat. Geosci. 2011, 4, 535–539. [Google Scholar] [CrossRef]
  4. Sa, R.; Sun, X.; He, G.; Xu, L.; Pan, Q.; Liao, J.; Zhu, K.; Deng, X. Enrichment of rare earth elements in siliceous sediments under slow deposition: A case study of the central North Pacific. Ore Geol. Rev. 2018, 94, 12–23. [Google Scholar] [CrossRef]
  5. Yasukawa, K.; Nakamura, K.; Fujinaga, K.; Iwamori, H.; Kato, Y. Tracking the spatiotemporal variations of statistically independent components involving enrichment of rare-earth elements in deep-sea sediments. Sci. Rep. 2016, 6, 29603. [Google Scholar] [CrossRef] [PubMed]
  6. Zawadzki, D.; Maciag, Ł.; Abramowski, T.; McCartney, K. Fractionation trends and variability of rare earth elements and selected critical metals in pelagic sediment from abyssal basin of NE Pacific (Clarion-Clipperton Fracture Zone). Minerals 2020, 10, 320. [Google Scholar] [CrossRef] [Green Version]
  7. Yasukawa, K.; Liu, H.; Fujinaga, K.; Machida, S.; Haraguchi, S.; Ishii, T.; Nakamura, K.; Kato, Y. Geochemistry and mineralogy of REY-rich mud in the eastern Indian Ocean. J. Asian Earth Sci. 2014, 93, 25–36. [Google Scholar] [CrossRef]
  8. Yasukawa, K.; Nakamura, K.; Fujinaga, K.; Machida, S.; Ohta, J.; Takaya, Y.; Kato, Y. Rare-earth, major, and trace element geochemistry of deep-sea sediments in the Indian Ocean: Implications for the potential distribution of REY-rich mud in the Indian Ocean. Geochem. J. 2015, 49, 621–635. [Google Scholar] [CrossRef]
  9. Zhang, X.; Tao, C.; Shi, X.; Li, H.; Huang, M.; Huang, D. Geochemical characteristics of REY-rich pelagic sediments from the GC02 in central Indian Ocean Basin. J. Rare Earths 2017, 35, 1047–1058. [Google Scholar] [CrossRef]
  10. Menendez, A.; James, R.H.; Roberts, S.; Peel, K.; Connelly, D. Controls on the distribution of rare earth elements in deep-sea sediments in the North Atlantic Ocean. Ore Geol. Rev. 2017, 87, 100–113. [Google Scholar] [CrossRef]
  11. Iijima, K.; Yasukawa, K.; Fujinaga, K.; Nakamura, K.; Machida, S.; Takaya, Y.; Ohta, J.; Haraguchi, S.; Nishio, Y.; Usui, Y.; et al. Discovery of extremely REY-rich mud in the western North Pacific Ocean. Geochem. J. 2016, 50, 557–573. [Google Scholar] [CrossRef] [Green Version]
  12. Mimura, K.; Nakamura, K.; Yasukawa, K.; Machida, S.; Ohta, J.; Fujinaga, K.; Kato, Y. Significant impacts of pelagic clay on average chemical composition of subducting sediments: New insights from discovery of extremely rare-earth elements and yttrium-rich mud at Ocean Drilling Program Site 1149 in the western North Pacific Ocean. J. Asian Earth Sci. 2019, 186, 104059. [Google Scholar] [CrossRef]
  13. Yasukawa, K.; Ohta, J.; Mimura, K.; Tanaka, E.; Takaya, Y.; Usui, Y.; Fujinaga, K.; Machida, S.; Nozaki, T.; Iijima, K.; et al. A new and prospective resource for scandium: Evidence from the geochemistry of deep-sea sediment in the western North Pacific Ocean. Ore Geol. Rev. 2018, 102, 260–267. [Google Scholar] [CrossRef]
  14. Takaya, Y.; Yasukawa, K.; Kawasaki, T.; Fujinaga, K.; Ohta, J.; Usui, Y.; Nakamura, K.; Kimura, J.I.; Chang, Q.; Hamada, M.; et al. The tremendous potential of deep-sea mud as a source of rare-earth elements. Sci. Rep. 2018, 8, 5763. [Google Scholar] [CrossRef] [PubMed] [Green Version]
  15. Tanaka, E.; Nakamura, K.; Yasukawa, K.; Mimura, K.; Fujinaga, K.; Iijima, K.; Nozaki, T.; Kato, Y. Chemostratigraphy of deep-sea sediments in the western North Pacific Ocean: Implications for genesis of mud highly enriched in rare-earth elements and yttrium. Ore Geol. Rev. 2020, 119, 103392. [Google Scholar] [CrossRef]
  16. Ohta, J.; Yasukawa, K.; Machida, S.; Fujinaga, K.; Nakamura, K.; Takaya, Y.; Iijima, K.; Suzuki, K.; Kato, Y. Geological factors responsible for REY-rich mud in the western North Pacific Ocean: Implications from mineralogy and grain size distributions. Geochem. J. 2016, 50, 591–603. [Google Scholar] [CrossRef] [Green Version]
  17. Ohta, J.; Yasukawa, K.; Nozaki, T.; Takaya, Y.; Mimura, K.; Fujinaga, K.; Nakamura, K.; Usui, Y.; Kimura, J.-I.; Chang, Q.; et al. Fish proliferation and rare-earth deposition by topographically induced upwelling at the late Eocene cooling event. Sci. Rep. 2020, 10, 9896. [Google Scholar] [CrossRef]
  18. Shipboard Scientific Party Site 800. In Proceedings of the Ocean Drilling Program, 129 Initial Reports; Lancelot, Y.; Larson, L. (Eds.) Ocean Drilling Program: College Station, TX, USA, 1990; Volume 129, pp. 33–89. [Google Scholar]
  19. Shipboard Scientific Party Site 801. In Proceedings of the Ocean Drilling Program, 129 Initial Reports; Lancelot, Y.; Larson, L. (Eds.) Ocean Drilling Program: College Station, TX, USA, 1990; Volume 129, pp. 91–170. [Google Scholar]
  20. Shipboard Scientific Party Explanatory Notes. In Proceedings of the Ocean Drilling Program, 129 Initial Reports; Lancelot, Y.; Larson, L. (Eds.) Ocean Drilling Program: College Station, TX, USA, 1990; Volume 129, pp. 49–79. [Google Scholar]
  21. Shipboard Scientific Party Shipboard core description: Site 800. In Proceedings of the Ocean Drilling Program, 129 Initial Reports; Lancelot, Y.; Larson, L. (Eds.) Ocean Drilling Program: College Station, TX, USA, 1990; pp. 247–302. [Google Scholar]
  22. Mazzullo, J.; Graham, G.A.; Braunstein, C. Handbook for Shipboard Sedimentologists; Ocean Drilling Program: College Station, TX, USA, 1988. [Google Scholar]
  23. Ocean Drilling Program Leg 129 Core Images. Available online: http://www-odp.tamu.edu/publications/129_IR/VOLUME/CORES/IMAGES/ (accessed on 11 June 2020).
  24. Karpoff, A.M. Cenozoic and Mesozoic Sediments from the Pigafetta Basin, Leg 129, Sites 800 and 801: Mineralogical and Geochemical Trends of the Deposits overlying the Oldest Oceanic Crust. In Ocean Drilling Program, 129 Scientific Results; Larson, L., Lancelot, Y., Eds.; Ocean Drilling Program: College Station, TX, USA, 1992; Volume 129, pp. 3–30. [Google Scholar]
  25. Shipboard Scientific Party Shipboard core description: Site 801. In Ocean Drilling Program, 129 Initial Reports; Lancelot, Y.; Larson, R.L. (Eds.) Ocean Drilling Program: College Station, TX, USA, 1990; pp. 303–418. [Google Scholar]
  26. Kato, Y.; Ohta, I.; Tsunematsu, T.; Watanabe, Y.; Isozaki, Y.; Maruyama, S.; Imai, N. Rare earth element variations in mid-Archean banded iron formations: Implications for the chemistry of ocean and continent and plate tectonics. Geochim. Cosmochim. Acta 1998, 62, 3475–3497. [Google Scholar] [CrossRef]
  27. Kato, Y.; Nakao, K.; Isozaki, Y. Geochemistry of Late Permian to Early Triassic pelagic cherts from southwest Japan: Implications for an oceanic redox change. Chem. Geol. 2002, 182, 15–34. [Google Scholar] [CrossRef]
  28. Kato, Y.; Fujinaga, K.; Suzuki, K. Major and trace element geochemistry and Os isotopic composition of metalliferous umbers from the Late Cretaceous Japanese accretionary complex. Geochem. Geophys. Geosyst. 2005, 6, Q07004. [Google Scholar] [CrossRef] [Green Version]
  29. Aries, S.; Valladon, M.; Polvé, M.; Dupré, B. A routine method for oxide and hydroxide interference corrections in ICP-MS chemical analysis of environmental and geological samples. Geostand. Newsl. 2000, 24, 19–31. [Google Scholar] [CrossRef]
  30. Pourmand, A.; Dauphas, N.; Ireland, T.J. A novel extraction chromatography and MC-ICP-MS technique for rapid analysis of REE, Sc and Y: Revising CI-chondrite and Post-Archean Australian Shale (PAAS) abundances. Chem. Geol. 2012, 291, 38–54. [Google Scholar] [CrossRef]
  31. Fujinaga, K.; Yasukawa, K.; Nakamura, K.; Machida, S.; Takaya, Y.; Ohta, J.; Araki, S.; Liu, H.; Usami, R.; Maki, R.; et al. Geochemistry of REY-rich mud in the Japanese exclusive economic zone around Minamitorishima island. Geochem. J. 2016, 50, 575–590. [Google Scholar] [CrossRef] [Green Version]
  32. Kashiwabara, T.; Toda, R.; Nakamura, K.; Yasukawa, K.; Fujinaga, K.; Kubo, S.; Nozaki, T.; Takahashi, Y.; Suzuki, K.; Kato, Y. Synchrotron X-ray spectroscopic perspective on the formation mechanism of REY-rich muds in the Pacific Ocean. Geochim. Cosmochim. Acta 2018, 240, 274–292. [Google Scholar] [CrossRef]
  33. Liao, J.; Sun, X.; Wu, Z.; Sa, R.; Guan, Y.; Lu, Y.; Li, D.; Liu, Y.; Deng, Y.; Pan, Y. Fe-Mn (oxyhydr)oxides as an indicator of REY enrichment in deep-sea sediments from the central North Pacific. Ore Geol. Rev. 2019, 112, 103044. [Google Scholar] [CrossRef]
  34. Taylor, S.R.; McLennan, S.M. The Continental Crust, Its Composition and Evolution: An Examination of the Geochemical Record Preserved in Sedimentary Rocks; Blackwell Scientific: Oxford, UK, 1985. [Google Scholar]
  35. Zhang, J.; Nozaki, Y. Rare earth elements and yttrium in seawater: ICP-MS determinations in the East Caroline, Coral Sea, and South Fiji basins of the western South Pacific Ocean. Geochim. Cosmochim. Acta 1996, 60, 4631–4644. [Google Scholar] [CrossRef]
  36. Alibo, D.S.; Nozaki, Y. Rare earth elements in seawater: Particle association, shale-normalization, and Ce oxidation. Geochim. Cosmochim. Acta 1999, 63, 363–372. [Google Scholar] [CrossRef]
  37. Barrett, T.J.; Jarvis, I. Rare-earth element geochemistry of metalliferous sediments from DSDP Leg 92: The East Pacific Rise transect. Chem. Geol. 1988, 67, 243–259. [Google Scholar] [CrossRef]
  38. Hein, J.R.; Koschinsky, A. Deep-Ocean Ferromanganese Crusts and Nodules. In Treatise on Geochemistry, 2nd ed.; Elsevier: Amsterdam, The Netherlands, 2013; Volume 13, ISBN 9780080983004. [Google Scholar]
  39. Machida, S.; Fujinaga, K.; Ishii, T.; Nakamura, K.; Hirano, N.; Kato, Y. Geology and geochemistry of ferromanganese nodules in the Japanese Exclusive Economic Zone around Minamitorishima Island. Geochem. J. 2016, 50, 539–555. [Google Scholar] [CrossRef] [Green Version]
  40. Elderfield, H.; Schultz, A. Mid-ocean ridge hydrothermal fluxes and the chemical composition of the ocean. Annu. Rev. Earth Planet. Sci. 1996, 24, 191–224. [Google Scholar] [CrossRef]
  41. Craddock, P.R.; Bach, W.; Seewald, J.S.; Rouxel, O.J.; Reeves, E.; Tivey, M.K. Rare earth element abundances in hydrothermal fluids from the Manus Basin, Papua New Guinea: Indicators of sub-seafloor hydrothermal processes in back-arc basins. Geochim. Cosmochim. Acta 2010, 74, 5494–5513. [Google Scholar] [CrossRef] [Green Version]
  42. De Baar, H.J.W.; Bacon, M.P.; Brewer, P.G.; Bruland, K.W. Rare earth elements in the Pacific and Atlantic Oceans. Geochim. Cosmochim. Acta 1985, 49, 1943–1959. [Google Scholar] [CrossRef]
  43. Liao, J.; Sun, X.; Li, D.; Sa, R.; Lu, Y.; Lin, Z.; Xu, L.; Zhan, R.; Pan, Y.; Xu, H. New insights into nanostructure and geochemistry of bioapatite in REE-rich deep-sea sediments: LA-ICP-MS, TEM, and Z-contrast imaging studies. Chem. Geol. 2019, 512, 58–68. [Google Scholar] [CrossRef]
  44. Trueman, C.N.; Tuross, N. Trace elements in recent and fossil bone apatite. Rev. Mineral. Geochem. 2002, 48, 489–521. [Google Scholar] [CrossRef]
  45. Deng, Y.; Ren, J.; Guo, Q.; Cao, J.; Wang, H.; Liu, C. Rare earth element geochemistry characteristics of seawater and porewater from deep sea in western Pacific. Sci. Rep. 2017, 7, 16539. [Google Scholar] [CrossRef] [Green Version]
  46. Piper, D.Z. Rare earth elements in the sedimentary cycle: A summary. Chem. Geol. 1974, 14, 285–304. [Google Scholar] [CrossRef]
  47. Addy, S.K. Rare earth element patterns in manganese nodules and micronodules from northwest Atlantic. Geochim. Cosmochim. Acta 1979, 43, 1105–1115. [Google Scholar] [CrossRef]
  48. Takahashi, Y.; Shimizu, H.; Usui, A.; Kagi, H.; Nomura, M. Direct observation of tetravalent cerium in ferromanganese nodules and crusts by X-ray-absorption near-edge structure (XANES). Geochim. Cosmochim. Acta 2000, 64, 2929–2935. [Google Scholar] [CrossRef]
  49. Yasukawa, K.; Ohta, J.; Miyazaki, T.; Vaglarov, B.S.; Chang, Q.; Ueki, K.; Toyama, C.; Kimura, J.-I.; Tanaka, E.; Nakamura, K.; et al. Statistic and isotopic characterization of deep-sea sediments in the western North Pacific Ocean: Implications for genesis of the sediment extremely enriched in rare-earth elements. Geochem. Geophys. Geosyst. 2019, 20, 3402–3430. [Google Scholar] [CrossRef] [Green Version]
  50. Nakamura, K.; Machida, S.; Okino, K.; Masaki, Y.; Iijima, K.; Suzuki, K.; Kato, Y. Acoustic characterization of pelagic sediments using sub-bottom profiler data: Implications for the distribution of REY-rich mud in the Minamitorishima EEZ, western Pacific. Geochem. J. 2016, 50, 605–619. [Google Scholar] [CrossRef] [Green Version]
  51. McCave, I.N.; Manighetti, B.; Robinson, S.G. Sortable silt and fine sediment size/composition slicing: Parameters for palaeocurrent speed and palaeoceanography. Paleoceanography 1995, 10, 593–610. [Google Scholar] [CrossRef] [Green Version]
Figure 1. Locations of the piston core sites and bathymetry around Minamitorishima Island and Takuyo Daigo Seamount: (a) broad map and (b) detailed map east of Takuyo Daigo Seamount. Different research cruises are distinguished by color coding. Bathymetric data are from ETOPO1 (NOAA National Centers for Environmental Information; NCEI, https://www.ngdc.noaa.gov/mgg/global/global.html). The locations of Ocean Drilling Project (ODP) Sites 800A and 801A are the same as those of Site MR16-07 PC05 and Sites MR16-07 PC01 and PC02, respectively.
Minerals 10 00575 g001
Figure 2. Depth profiles of color, lithology, and total rare-earth elements and yttrium (ΣREY) concentrations of sediment cores collected during Cruises MR16-07 and KM17-14C. The data of ODP Sites 800A and 801A are from Yasukawa et al. (2016) [5].
Minerals 10 00575 g002
Figure 3. Post-Archean average Australian shale (PAAS; [30])-normalized REY pattern of all the samples. (ak) MR16-07 PC01 to PC11, (lp) KM17-14C PC01 to PC05, (q,r) ODP Sites 800A and 801A, and (s) reference materials. The data sources of the reference materials are as follows: Biogenic calcium phosphate (Takaya et al., 2018 [14]); deep-sea water in the western South Pacific (Zhang and Nozaki, 1996 [35]) and in the North Pacific (Alibo and Nozaki, 1999 [36]); hydrothermal sediment (Barrett and Jarvis, 1988 [37]); Mn-nodule in the Peru Basin and Clarion-Clipperton Zone (CCZ; Hein and Koschinsky, 2013 [38]) and in the Minamitorishima EEZ (Machida et al., 2016 [39]).
Minerals 10 00575 g003
Figure 4. Representative scatter diagrams of sample data color-coded on the basis of the chemostratigraphic scheme established in this study (Section 4.2): (a) ΣREY vs. Fe2O3*, (b) ΣREY vs. P2O5, (c) ΣREY vs. CaO, (d) Co vs. MnO, (e) Co vs. Ba, (f) Al2O3 vs. Ba, (g) Co vs. TiO2, and (h) TiO2 vs. Fe2O3*. Fe2O3* indicates total iron as Fe2O3 measured by X-ray fluorescence (XRF) analysis. The gray ellipses in Figure 4b,h indicate the samples that deviate from the overall trend, corresponding to Units IV and III, respectively.
Minerals 10 00575 g004
Figure 5. Chemostratigraphic correlation along representative (a) east–west (x–x′) and (b) north–south (y–y′) transects south of Takuyo Daigo Seamount, and (c) detailed map south of Takuyo Daigo Seamount. The vertical positions correspond to their water depth (meters below sea level; mbsl) on the right scale. Their core lengths (meters below sea floor; mbsf) correspond to the left scale.
Minerals 10 00575 g005
Figure 6. Chemostratigraphic correlation east of Takuyo Daigo Seamount along the cores (a) in the west (x–x′) and (b) in the east (y–y′), and (c) detailed map east of Takuyo Daigo Seamount. The vertical positions correspond to their water depth (meters below sea level; mbsl) on the right scale. Their core lengths (meters below sea floor; mbsf) correspond to the left scale.
Minerals 10 00575 g006
Figure 7. (a) Chemostratigraphic correlation in the area north of Minamitorishima Island, the northern Pigafetta Basin, and other small basins surrounded by the Marcus-Wake Seamounts (x–x′), and (b) broad map around Minamitorishima Island. The vertical positions correspond to their water depth (meters below sea level; mbsl) on the right scale. Their core lengths (meters below sea floor; mbsf) correspond to the left scale.
Minerals 10 00575 g007
Table 1. Locations of the sediment cores collected by the Ocean Drilling Program (ODP) Leg 129, Cruises MR16-07, and KM17-14C.
CoreLatitudeLongitudeWater Depth (mbsl)Core Length (m)
ODP Leg 129
800A21°55.38′ N152°19.37′ E568638.00 1
801A18°38.568′ N156°21.57′ E567455.80 1
Cruise MR16-07
PC0118°38.54′ N156°21.55′ E56821.38
PC0218°38.51′ N156°21.59′ E568212.64
PC0318°39.99′ N158°53.28′ E574612.91
PC0421°55.41′ N152°19.39′ E568412.40
PC0521°54.41′ N151°52.40′ E564912.28
PC0621°44.97′ N153°55.97′ E578611.96
PC0721°39.70′ N153°55.96′ E579211.76
PC0820°53.00′ N158°59.96′ E559012.36
PC0920°08.97′ N159°00.04′ E556511.81
PC1022°31.29′ N158°37.98′ E546611.87
PC1124°48.37′ N156°58.82′ E590011.90
PC1226°45.97′ N150°49.72′ E58002.18
Cruise KM17-14C
PC0122°52.49′ N153°57.99′ E570811.71
PC0222°52.49′ N154°12.00′ E561312.79
GC0323°00.00′ N154°20.00′ E55563.08
PC0423°07.49′ N154°20.02′ E55649.92
PC0523°07.50′ N154°13.50′ E556810.71
1 The length of the target lithologic unit, which is composed of the pelagic brown clay, is shown as the core length at Site 800A and 801A.

