
Abstract
When automatically generating programs for flatbed laser cutting machines, it is advantageous to know the position of the supporting tips of the raw material. This allows the nesting layout and tool path to be adapted in an intelligent way. The problem of measuring the supporting tips of a laser cutting machine has not been considered in published literature before. We introduce possible methods first and choose a laser triangulation system. A novel setup, where none of the components is at a right angle to the measured surface, is proposed to account for the circumstances in a laser cutting machine. Its performance is investigated thoroughly with special regard to robustness and accuracy. In order to achieve very high accuracies, the setup is extrinsically calibrated on the measured object and different line extraction algorithms are tested for their effect on the measurement result. It is shown that the measurement setup is robust for different changes in the environment, such as different slat materials, bent supporting tips, and slagging. The measurement accuracy of the setup is calculated to be within ± 0.8 mm.
1 Introduction
When producing goods with modern machine tools, it is necessary to know what configuration the machine is in and to what extent the machine has wear and tear in order to program the machine efficiently. Once the state of the machine is known, automated programming of the machine is possible, where the machine changes its short-term behavior without manual intervention based on its state and the workpieces to be processed. Of course, in any algorithm programming, the machine is dependent on the robustness and accuracy of the system measuring the state of the machine.
In this work, we focus on flatbed laser cutting machines (LFMs) for metal cutting. In the laser cutting process, the laser beam heats the material until it melts and a stream of process gas is used to push the molten material down and out of the cutting kerf [32]. Therefore, the raw material sheet must have mostly free space beneath it, as otherwise the process gas could not exit the kerf. In current machines, the raw material is supported by a number of metal slats that each consists of a number of supporting tips made up by isosceles triangles (see Fig. 1b). The slats are held in place by a pallet that has a given number of sockets. Each socket is a possible position for a slat. However, slats can easily be configured and it is quite common in practice to only put a slat in every second possible position.

a TRUMPF laser cutting machine and pallet with supporting slats; b close-up of supporting tips
Depending on where on the pallet the raw material sheet is placed and the geometry of a part to be cut, the part may tilt once cut free. This happens when the force applied by the process gas is not supported by the slats. Tilted parts decrease the process reliability of the machine, as the cutting head or automation systems used to take cut parts off the machine may collide with them. The extensive experience of working with LFMs of the authors shows that collisions of the cutting head are responsible for the great majority of unwanted machine stops during manufacturing. The productivity of LFMs as well as the degree of automation can be increased significantly, if fewer parts tilt or fall after being cut free.
Tilting parts can be reduced by either changing the tool path or the nesting layout, as suggested in [7] and [33], respectively. A preliminary simulation study showed that the number of tilting parts can be roughly halved and collisions can be reduced to almost none with changes only to the tool path, if the position of the supporting slats is known. Further changes in the nesting layout can help lower the number of tilting parts even further; however, this usually comes at the cost of a nesting layout with lower packing density [33]. Obviously, every strategy to reduce the unwanted effects of supporting slats, whether in manual or automatic programming, will be dependent on a precise measurement of the slats and tips to work efficiently.
In the next section, we describe the surrounding conditions and requirements of a measurement system, before quickly justifying the choice of a laser triangulation system and introducing the state of the art of such systems in Section 3. In Section 4, we describe the setup of the laser triangulation system and its image processing and calibration. The results and validation of the algorithm are presented in Section 5. Section 6 gives a conclusion and an outlook on further work.
2 Requirements and surrounding conditions
A measurement system should be robust to all likely changes in the environment, i.e., changing lighting conditions, vibrations, or changes in optical properties of the slats, such as reflectivity due to slagging or different materials. Also, it should be able to measure not only slats in a good condition. Tips being bent slightly or completely out of shape, slugs welded onto tips, and incorrectly inserted slats should all be detected.
Lighting conditions cannot be controlled outside of the machine body, for example in Fig. 1a there is sunlight visible on parts of the pallet. As a LFM has a closed encasing to provide safety to workers from scattered laser light, the lighting conditions inside the machine are much more predictable and independent of outside conditions. Therefore, measurement systems on the inside of the machine body will be more robust.
Also, a potential solution should only minimally interfere with the current production process, if at all. Mostly, that means that there should be as little time as possible spent on the measuring cycle, which would add to the auxiliary process time. Additionally, possible positions for equipment are limited to the machine body, as there must be space around the pallet to load new raw material on the machine.
Lastly, it is not quite clear whether complete slats or every single supporting tip should be measured. Instead of installing a system that is capable of measuring every single supporting tip, one can install a system that is only capable of detecting slats and then inferring the exact tip positions from prior knowledge of the shape of the pallet, slats, and supporting tips. This of course comes at the cost of decreased accuracy, as a single supporting tip might have molten or might have been bent. Note that a standard size of raw metal sheets is 1500 mm× 3000 mm, which is why many machine tool manufacturers offer LFMs with a pallet of roughly that size. Depending on the slat configuration, there can be around 9500 supporting tips. Measuring the position of every single one comes at a higher effort and a significantly longer measuring cycle compared with detecting the configuration of up to 90 slats.
If only the configuration of slats is measured, it must be accurate, because wrong measurement results have a big impact on the tilting calculation and the following optimization. For example, if a slat is wrongly detected, the tilting calculation will use supporting tips that are at least 30 mm away from an actual supporting tip. This can have a large impact on the result of the tilting calculation. On the other hand, if a slat in a socket is not detected, unnecessary measures in the tool path planning and nesting might be taken, leading to a lower packing density and longer cutting times. If every single supporting tip is measured, a measurement accuracy of ± 1 mm or less seems acceptable, as this measurement error will likely have a marginal effect on the tilting calculation.
3 Previous work
While there were the mentioned publications about the improvements that a NC program considering the position of slats would have, there are no publications about methods for measuring the position or state of wear and tear of the slats to the knowledge of the authors. Neither are the authors aware of any product that is marketed for this purpose. There are patents that mention the idea of measuring slats. However, these concepts do not go further than claiming that the measurement can be conducted with a camera or other distance sensors, and no details are given [1, 15].
Detection and measurement of 3D objects with vision-based methods have been a very active research field for decades. In order to select a method, we will give a brief overview of possible methods and their suitability for this measurement task. A laser triangulation system is chosen and the state of the art of the general principle, possible setups, and further details are introduced.
3.1 Potential measurement methods and general considerations
Different visual measurement methods are possible candidates to detect supporting slats or tips in a LFM. Firstly, one can classify regions in a single image. Possible image processing algorithms to apply to this problem include edge detection, texture analysis, or analyses of the Fourier space [3, 30]. The location of these features can be extracted and a classifier can be used to detect the location of slats.
However, the accuracy of single image detection seems limited, since supporting tips look similar and slats are likely to slightly overlap, making it hard to predict the exact number or location of slats without active lighting. While it seems possible to successfully locate slats, it seems questionable whether the accuracy is high enough to detect every single supporting tip.
The principle of stereo vision has a similar problem. Stereo vision works analogous to the human perception of depth [24]. If a point in a scene is viewed from two different known positions, the coordinates of that point can be calculated from the different angles under which it is observed. The difficulty here lies in the identification of the same point in both images, which is called the correspondence problem [3, 25, 30]. It is hard to solve for structures that are solely periodic or if non-Lambertian reflection occurs, as the same point of an object may look very different in the two images [3, 16, 21]. This is the case with the supporting slats considered in this work and will certainly decrease the measurement accuracy, if not make measurements impossible. A preliminary test with a commercial stereo vision camera based on active dot projections in the near-infrared bandwidth confirmed these doubts.
A widespread approach in robotics for the localization of objects is the time-of-flight (TOF) method [22]. In recent years, it has attracted much attention in autonomous vehicles [10, 23, 29]. The TOF method measures the time a light pulse needs to travel from a projector to an object and back to a sensor that is located close to the projector. As the speed of light is known, the distance can be calculated [21, 25].
A major drawback of the TOF method is accuracy, which is in the single-digit centimeter range for working distances from 7.5 to 10 m [12, 21]. Also, the setup of the scene can have further influence on the accuracy, as light rays coming into the camera and having had multiple reflections cannot be separated from light rays that only had a single reflection in most hardware setups. This leads to lower measurement accuracy [12] and should be expected in a sheet metal environment. Hence, the TOF method seems unsuitable for measuring the supporting slats.
Laser triangulation is a well-known method for visually measuring the shape of 3D objects. It has been used in environments with metallic reflection before [19] and offers good measurement accuracy. Detection of the supporting slats and tips seems very well possible with suitable hardware. The biggest drawback is the interference with the production process with rather long scanning times. However, this seems acceptable to the authors when seen in relation to the expected robustness and accuracy. Therefore, an implementation of a laser triangulation setup inside the machine will be presented in the following sections.
3.2 Laser triangulation
The general principle of measuring distances by triangulation is long known. It is based on the fact that a triangle is fully defined if two angles and the length of one side are known. Usually, one angle and the length of one side are known and a second angle is measured to determine the other geometrical properties of the triangle [3].
A laser triangulation system (LTS) measures the shape of an object by projecting a laser dot or laser line on the object and measuring the position with an optical sensor. In a classical laser triangulation setup, the laser is placed perpendicular to the measured surface and the camera is placed at an angle to the laser plane (see Fig. 2a; note that the coordinate system defined there is used for the rest of this paper). Therefore, all measurements are within the same y-z-plane at a x-position and deviations of the line position directly correspond to different z-values [3, 6]. The object is then scanned either point by point or line by line, with either the laser projection or the object being moved. Point scanning of course takes considerably more time.
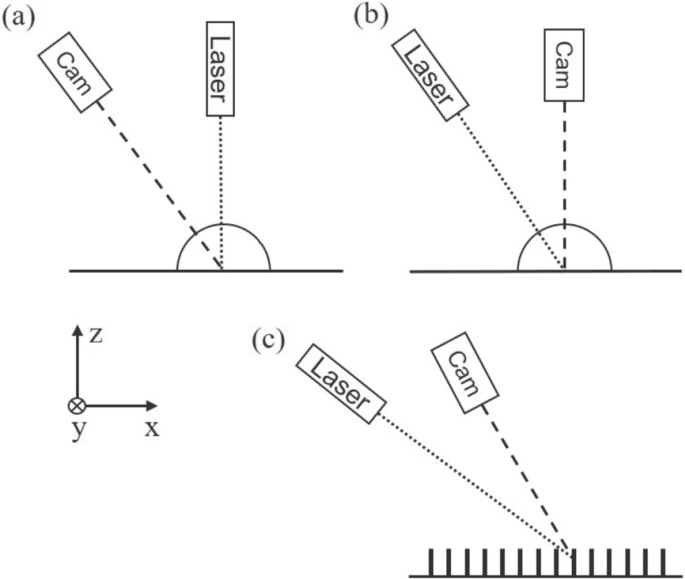
Different setups for laser triangulation: a usual setup, b setup in [6], c setup used in this work
A different setup was used in a study, where a color image was supposed to be matched to the height image. By placing the camera straight above the surface to be measured (see Fig. 2b), no occlusion of lower parts by higher parts of the surface occurred [19].
A problem linked to the setup of any LTS is shading. Since the camera and laser have to have a certain angle between their viewing planes, they do have a different view on the object. If the object has different protrusions, one might not be able to see the whole laser line from the camera perspective or parts of the object cannot be illuminated by the laser line. The setup must therefore be adjusted to the object to be measured [3].
3.2.1 Calibration
Every LTS needs to be calibrated, which has two steps: intrinsic calibration and extrinsic calibration. Intrinsic calibration deals with setting the camera parameters, mostly the distortion of the camera lens. Extrinsic calibration establishes a transformation between camera coordinates and world coordinates [14, 30].
A widespread method for intrinsic calibration is to assume a pinhole camera model. In this model, points with known coordinates are used to establish the camera parameters, namely the camera matrix M and distortion parameters. The camera matrix consists of the focal lengths fx, fy and the image principal point (cx, cy). There are three parameters to correct for radial distortion k1,2,3 and two parameters p1,2 to correct for tangential distortion [2, 37].
In extrinsic calibration, a mapping between camera coordinates and world coordinates is established. This is usually done by scanning an object of known dimensions [35]. If one is only interested in the height profile of the object, extrinsic calibration is a simple scaling of the height coordinates, as for example in [19]. Extrinsic calibration can be a source of error, if the surface properties of the calibration object and the measured object differ and hence the measurement errors induced by surface properties are not accounted for [26].
Calibration procedures can also be divided into explicit and implicit methods. Explicit methods try to calculate physically interpretable parameters, such as the focal length of a lens or the coordinates of the optical center on the camera chip. Instead, implicit methods have enough distortion, rotation, and translation parameters to adjust any occurring error; however, these parameters cannot be associated with any physical part of the measurement system [14].
3.2.2 Line extraction algorithms
A major advantage of a LTS is the high measurement accuracy. Depending on the hardware used, accuracies in the sub-millimeter range are possible [6, 8]. The uncertainty of measurement in laser triangulation setups generally stems from four reasons [3]:
-
Projection quality of the camera optics
-
Quality of the laser projection
-
Resolution of the sensor
-
Speckle noise of the laser beam
The last point has been investigated substantially [8, 13], as it defines the physical limits of the laser triangulation principle. The resolution of the sensor and projection quality of the camera optics are just given by the choice of hardware. A low-quality laser projection, however, can be mitigated to some extent. The wider the laser line is, the lower the measurement accuracy will generally be. However, if the laser line causes an intensity distribution across many pixels of the camera, the position of the peak of the line can be calculated to a sub-pixel scale [27].
There are a number of possible methods to do this calculation. The underlying problem is to detect a peak in discrete and noisy data. In [17], the center of mass peak (CoMP) method is introduced. As the name suggests, it calculates the center of mass of all pixel values in a column v of the image, where v(r) is the intensity at row r. If there is just one clear peak in the column, this will work as intended. However, if other peaks are present in v(r), one might be interested in just an interval [k, l] of v, with k < l. The sub-pixel location of the peak pmax is calculated as:
The CoMP method proved best in a previous study that also dealt with metallic components and reflection [19].
Another study introduced a peak detector that is based on the numerical derivative of the signal and a finite impulse response filter to suppress high-frequency noise [4]. A filter of nth order is given by:
The peak is then derived by convolution:
The major advantage of this method is its computational speed, which was one of the major criteria for the authors of that study.
Since a laser beam has a Gaussian intensity profile as a first estimate, another method is to select the peak of the best fitting Gaussian distribution [19]:
a method we will refer to as GaussP. The sup-pixel peak pmax is then calculated as:
Following the idea of fitting a Gaussian profile, another study suggested calculating the derivative of the pixel values and estimating it linearly around the peak of the profile [11]. The sub-pixel location is then defined as the position where the linearized derivative crosses the x-axis. In numerical tests, this method showed good performance in some cases; however, it could not outperform the fit of a Gaussian profile.
4 System setup and measurement methods
4.1 Laser triangulation system setup
There are a number of different possible setups to implement a LTS to measure the slats. For example, one could take a small section of slats and build a small pallet on a laboratory table and install the LTS around it. The advantage of this is that the geometry of the setup, such as the distance between camera and laser and the respective angles, can be fully controlled and many measurements can be made easily. The working distance and field of view are limited. Such a setup was for example used in [6] or [19], though the object was much smaller. A different approach is to install the system in an actual LFM. This would mean having less control over the exact geometry of the setup, as the working distance and field of view are considerably larger. However, this setup uncovers all the problems that might occur due to circumstances only present in the LFM, including but not limited to reflections, vibrations, or space constraints.
The usual laser triangulation method introduced in the previous section has the laser in the y-z-plane above the object and the camera slanted (see Fig. 2a). This setup could not be realized for two reasons. Firstly, there would obviously be occlusion of some part of the triangular contour of a slat, if only one laser was used, since the inner supporting points directly under the laser line projector would shade the outer supporting points. Likewise, a supporting point not directly under the laser would shade its own outer flank. Also, there is no space under the roof of the machine, where the laser would have to be placed, as cables attached to the cutting head take up that space. Placing the hardware on top of the machine is not an option, since the ceiling is movable. For the same reason, the setup found in [6], where the positions of the camera and laser were interchanged, could not be implemented as well.
An alternative approach, turning the whole setup upside down and trying to measure the slats from below, is also not possible, as there are a lot of sparks and drops of molten material spraying from the cutting kerf during the cutting process. This might damage the camera or the laser line projector.
A setup that circumvents the drawbacks mentioned before is to attach both the camera and the laser to the upper side panel of the machine at an angle to the pallet and its moving direction (see Fig. 2c). This setup also has the advantage of viewing the slat from the side, which means that more camera frames include useful information. Either the measurement will return more measurement points or the number of frames per second can be decreased in comparison with a setup where either the camera or the laser is straight above a slat. However, the angled laser and camera planes need more coordinate transformations to result in measurement points in the coordinate system of the machine. These will be discussed in Section 4.3.
The camera used was a FLIR Blackfly S, with a monochrome Sony IMX264 CMOS sensor and global shutter. The image size was reduced to 90 rows of the chip, in order to increase the frame rate to 150 fps. The images therefore had a size of 90 × 2448 pixels. The camera was combined with a computer M0824-MPW2 lens with 8-mm focal length. The sheet of light was projected by a Z-Laser ZM18-RF686 with 640-nm wavelength. The setup had a working distance of roughly 880 mm and a field of view of 755 mm, which is about half of the width of the complete pallet. Scanning the whole pallet would require two cameras or a camera with an ultra wide-angle lens. The LFM used was a TRUMPF TruLaser 5030 with the inner lights turned off. The speed of the pallet changer was about 70 mm/s.
4.2 Calibration method
For this work, the camera was first calibrated intrinsically using the widespread method of images of a checkerboard plate, in this case a 14 × 14 grid, taken from 23 different perspectives [2, 37]. The corners of the squares are detected in the images and used as points for the calibration, using the respective functions of the software library OpenCV [5], which assumes a pinhole camera model. The resulting camera matrix M and distortion parameters k1,2,3 and p1,2 are:
Since the slats are cut on the machine itself and the shape tolerance of the machine is within ± 0.05 mm, the slats themselves can be used as calibration objects for the extrinsic calibration, if they are new and do not have any signs of wear and tear. Thus, no additional calibration objects are required. This novel method of calibration comes with two major advantages. Firstly, every time the slats are new, a new extrinsic calibration can be calculated. This might be necessary if the machine body warps slightly over time, which can happen when the foundations are not strong enough or something collides with the machine. Secondly, the extrinsic calibration is carried out on the actual measurement object, thereby reducing potential measurement uncertainties stemming from different surface properties of the calibration object and the measured object.
In order to derive the position of tips and sinks, which will be used as calibration points, multiple steps are necessary. The raw images taken show the laser line or parts of the laser line if it is projected onto the tips (see Fig. 4). Since there is no further material under the slats, the rest of the line is not in the field of view of the camera. Because the pallet moves into the machine (from top to bottom in Fig. 3), the bottom of a slat comes into view first at the top of an image and the tip of the slat is seen last close to the bottom of an image.

The laser triangulation setup inside the machine body of a TRUMPF flatbed laser cutting machine with light turned on. Note that the light is off during measurements

A segment of three raw images of the same slat: a below the tips, where the slat is solid; b in the middle of the tips; c near the tip
The tips and sinks of the slats are extracted through the following procedure. First, the images are thresholded at a rather low value to eliminate any noise and binarize the image, making all pixels apart from those belonging to the laser line black. Then, starting with the first image, it is checked whether the number of white pixels in an image exceeds a certain threshold. This indicates the base of a new slat, since the image shows the complete laser line at the bottom of the slat first (see Fig. 4a). The following images are then added to the first image. When the scanning gets closer to the tips, a lot less of the projected line can be seen in the image, leading to fewer white pixels (see Fig. 4b and c). The last image in the sequence showing one slat is detected when the number of white pixels falls below a threshold value. The start of the next slat is searched for as mentioned above. This procedure is repeatedly executed until all images are processed. The result are images showing every slat in full (see Fig. 5a).

Image processing during the calibration procedure: a raw images thresholded and added for one slat; b polyline of the contour and detected tips (red) and sinks (purple)
Next, the contour of every slat is calculated by border following as presented in [34]. It is difficult to extract the tips and sinks from this information, since the contour is too noisy. To solve this problem, a polyline approximation is conducted using the Ramer-Douglas-Peucker algorithm [9, 28]. This algorithm first calculates the line between the first and last points of the given contour. Then, it checks whether the largest distance of said line to any point of the contour is larger than a given threshold. If this is the case, the contour is split into two parts at that point and the algorithm is called in a recursive manner for each of the two contours. If the given threshold is larger, the point is simply disregarded. In this way, the noise which causes the straight edges of each supporting tip to have small fluctuations is reduced effectively. Based on these straightened lines, the corners are detected with the Shi-Tomasi algorithm [31].
The results are checked for plausibility and disregarded, if they are not at the right distance to the neighboring tip or at a different height level. The final result can be seen in Fig. 5b. Keep in mind that the slats are upside down; therefore, tips are at the bottom and sinks at the top of the image. While the procedure works well for most tips, some manual corrections were made in locating the points to obtain an even better calibration.
With the tips and sinks and therefore also their respective image coordinates (u, v) identified, the calibration can be approximated using an equation system that assumes the pinhole camera model mentioned in Section 4.2 and ground truth points. First, a perspective transformation is necessary since the tips to the left or right of the camera center are not seen from directly in front. The image point (u, v) is mapped onto the transformed point (upt, vpt) by matrix A (see Eq. 1). The residual t is a scaling factor.
These points are then used in a transformation from image coordinates to machine coordinates by matrix B, that maps every point (upt, vpt, w) onto a point pact in machine coordinates. w denotes the number of the image in the sequence.
A ground truth point pgt is known approximately, as the contour of the slat is given. However, the pallet has larger production tolerances than the slat, leading to slats being slightly distorted or not in the correct distance. The deviations caused are in the low millimeter range.
The elements of the matrices A and B are approximated by minimizing ε, the sum of all Euclidean distances of the points pgt and pact, as shown in Eq. 3, where 51 peaks and sinks of 10 slats were used for this part of calibration, making a total of 510 calibration points. The minimization problem was solved with a combined algorithm that uses basin hopping for global optimization [36] and sequential least squares programming for local optimization [20], as implemented in the software package SciPy [18].
The basin hopping algorithm was applied for 15 iterations, while the local optimization stopped if the improvement of ε dropped below 10− 6. The residual without manual correction of the tips and sinks was 649.27 which led to an average reprojection error of 0.712 mm in Euclidean distance per point. With partial manual correction of the tips and sinks, the residual could be reduced to 577.87 which led to an average reprojection error of 0.541 mm.
The calibration consists of the matrices M, A, and B and the distortion parameters k1,2,3 and p1,2 that will be applied to the measuring points in the next section.
4.3 Image processing methods
Once a calibration has been established, one can measure the slats’ shape. In order to get from raw images to actual measurements, some image processing functions have to be performed.
First, the images are cropped, so that only the region of interest is actually processed. In this example, the images were cropped from 90 × 2440 pixels to 45 × 1660 pixels, which leads to a field of view of about 755 mm.
Being able to locate the laser line in the images is important for the accuracy of the measurement system, as the line can be extracted to sub-pixel precision [27]. Since there are many images of the supporting tips that show only a broken laser line (see Fig. 4), a threshold has to be set, so that only those columns of the image are processed in the peak detection algorithms that actually show a part of the laser line.
To locate the laser line in the images, three approaches were tested, namely two versions of the CoMP method and GaussP, as introduced in Section 3. All three methods were shown to have good performance in a previous study that dealt with metallic surfaces and reflection [19]. One version of CoMP, which we will refer to as CoMP11, is symmetric around the absolute peak of v and l − k = 10, which means that 11 pixels are considered in total. A second version is CoMP45 and considers all 45 rows of the cropped image for the calculation.
As a result of the line extraction algorithms, a list of points p = [x, y, z] is generated. The x-coordinate comes from the number of the image currently processed, which is possible because the images are processed in an ordered sequence. The y-coordinate is the number of the image column and the z-coordinate is the result of the line extraction algorithm. Note that x and y are integers, whereas z is a floating point number to represent its sub-pixel accuracy.
The distortion matrices from the calibration are than applied to take the different kinds of distortion into account. Since the time an image was taken is disregarded in the calibration procedure and both the laser plane and the camera plane are not at a right angle to the measured surface, the slats are not upright but slanted backwards in this calibrated point cloud. In a usual LTS setup, this would not happen, but since a new setup was necessary, the following transformations need to be carried out. Since the speed of the pallet changer, the frame rate, and height of the supporting tips h are known, the rotation angle γ required to compensate this effect can be calculated easily. The horizontal distance between a tip and a sink d in numbers of images i can be counted and converted to millimeters with the frame rate f and speed of the pallet changer v. Together this gives:
The rotation using γ can then be stated as:
This results in three problems. Firstly, all slats do not have the right distance to each other along the x-axis. Secondly, all slats are being compressed in the z-axis and lastly slats that are visible on images taken later than others have a higher z-value. A final transformation rectifies the mentioned problems and gives the actual measurement point pm:
Applying this transformation results in the final point cloud. An example with roughly three million points can be seen in Fig. 6. Depending on what features of the slats are important for some applications, different features of the slats can be calculated from the point cloud, such as the matrix of supporting tips and their location, the location of bent supporting tips, or regions of a slat with heavy slagging.

Point cloud of the left half of a pallet with roughly three million points
4.4 Multiple reflection effects
Generally, there is almost no light other than the laser line visible in the images, as shown before in Fig. 4. However, there are some artifacts visible in the 3D point cloud at a certain position of the slat. These artifacts appear where the pallet has a longitudinal copper beam to stabilize the slats across the width of the pallet. Some light is reflected off this copper beam and detected by the camera. The image processing interprets every detected point to be on the sheet of laser light, which the copper beam is not at that point in time. This leads to artifacts with a cylindrical shape that are at an angle behind the slat. A characteristic example of such an artifact can be seen in Fig. 7. Around 75% of the slats scanned during a run show these artifacts. The longitudinal copper beam does not appear in any other images of the sequence, as it is too low and partly occluded by the slats.

An example of the artifacts due to multiple reflections
One easy way of fixing this problem is to increase the threshold used to decide whether a column should be disregarded during the line extraction algorithms, as the reflection leading to the artifacts has a rather low intensity. However, this would come at the cost of processing fewer columns at the left and right ends of the broken laser line projection on the upper parts of a tip.
A different approach considered was the use of narrow band-pass filters for the wavelength of the laser, which would solve the problem if the light causing the artifacts was ambient light not originating from the laser. As there is no sign of ambient light at that position on other images of the sequence, it is almost certain that the light originates from the laser and has been reflected multiple times before. Hence, the correction of this effect must be carried out with image processing methods.
An efficient filter that is not difficult to implement is a template matching filter. Since the artifacts appear behind a slat and do not go through or above it, filtering can be done with a simple cuboid that stretches along the whole z-axis, 30 units along the y-axis at the position where the artifacts occur and is 5 units wide along the x-axis. The step size was set to 1.5 units along the x-axis. The filter response is the number of measurement points inside the filter template. If this is below a threshold, in this case 50 points, all points inside the filter are deleted from the point cloud.
While a single bent tip or a slug welded onto a slat tip can have similar characteristics, they still have a lot more measurement points than at most 80 points of the artifacts to be filtered. Therefore, all the points deleted by the filter belong to artifacts. While not removing any correct measurement points, the template matching filter removed 99% of all artifact points. The resulting reduction of the artifacts can clearly be seen in the differences between Fig. 8a and b.

A part of the scanned area: a before filtering with artifacts clearly visible; b the same area after filtering
5 Results and discussion
The LTS was used to measure a pallet in multiple slat configurations. One such configuration with new mild steel slats in equal distances can be seen in Fig. 6. Other configurations were also recorded, where the different scenarios for checking the robustness of the system, such as bent tips and incorrectly inserted slats among others, were implemented.
Every configuration was recorded at least twice, namely with workspace lighting on and off. The record with workspace lighting off is the actual measurement. As it is hard to track the cause of unexpected effects in almost binary images (compare Fig. 4), the same slat configuration was also recorded with workspace lighting on. Each recorded sequence resulted in a point cloud.
Validating the measurement accuracy of the presented setup is not easy, as no ground truth data exists in the necessary resolution. In the next subsections, two different ways of establishing the measurement accuracy are presented and the performance of the system is evaluated, followed by a comparison of the laser line extraction methods and an assessment of the robustness of the setup given the usual changes in the environment of a LFM.
5.1 Laser line extraction and measurement accuracy
In this work, the resolution of the camera sensor and the frame rate have the largest effect on measurement uncertainty compared with other possible reasons, such as projection qualities or speckle noise. The resolution in all three dimensions is about 0.45 mm/pixel. In two dimensions, this stems from the resolution of the camera chip. In the third dimension, the ratio between the frame rate and the speed of the pallet changer was chosen accordingly. The quality of the laser projection could have been better at about 2 mm width on the object; however, that should be compensated by the line extraction algorithms. The projection quality of the camera optics should not have a great effect, as industrial-grade hardware was used.
Since the shape of the slat and the position of the tips are known, they are used as ground truth for validating the accuracy of the setup. Note however that it cannot be ruled out that the slats deviate slightly from their shape due to torsions, when the slats are inserted into the pallet. One way to validate the setup is to look at the difference between the measured and ground truth positions of the supporting tip. Another way is to compare the distance between two neighboring tips to the known distance. The latter method is less prone to unwanted torsion in the slat, leading to deviations in the x-axis even though the tips of perfect slats only have a single x-position.
In order to get from the point cloud data to a 2D projection of the supporting tips, a section of the point cloud in a certain z-axis range is mapped to a 2D array with a parallel projection. The result is a black and white image with blobs of points where a tip is located (see Fig. 9). The location of the tip is then defined for validation purposes as the center of mass of the points of a single tip.

An example of the parallel projection of four supporting tips forming blobs of points used for validation
The validation was calculated on the measurements of ten new slats that had 51 supporting tips each. As mentioned above, in the first method the ground truth tip position derived from the geometry of the pallet and the slats was compared with the measured position. The results for CoMP11, CoMP45, and GaussP can be seen in Table 1. The best line extraction algorithm in this case is CoMP45 with a maximum uncertainty of less than ± 0.8 mm. However, the difference to CoMP11 and GaussP is very small at 0.056 mm and 0.036 mm, respectively. Note that the average and median errors are in the range of a hundredth of a millimeter.
The second method only calculated the distance between two neighboring tips. The results can be seen in Table 2. The average and median errors are in the range of a thousandth of a millimeter. The maximum uncertainty of GaussP is best in this case; however, the performance of CoMP11 and CoMP45 is not substantially worse. The maximum error is lower compared with the first method for every algorithm, which supports the assertion that the tips of new slats are not exactly at a single x-position.
There were four tips that were bent on purpose, two forward and two backward (see Fig. 10). The dislocation of a supporting tip can only be measured to a millimeter accuracy by hand. For calculating the dislocation of a tip in the measurement, the same procedure based on a parallel projection and center of mass, as outlined above, was used. The manual measurement and the laser triangulation measurement are compared in Table 3. The distances are in accordance with the measurement uncertainty established before, with values around ± 0.6 mm. Even though a sample of four is of course not meaningful in a statistical sense, it shows that there are no reflection issues decreasing the measurement accuracy on bent tips. As a validation technique it is not useful, however, since bending and measuring hundreds of tips manually is not feasible.

The four bent supporting tips. a A picture taken from directly above; b the parallel projection
5.2 Robustness
The robustness of the presented measuring system is evaluated by qualitatively evaluating the categories mentioned before: different slat materials, slagging, bent tips, slugs welded onto the tips, incorrectly inserted slats, and vibration. The problems with artifacts stemming from multiple reflections and methods to mitigate these problems have already been discussed in Section 4.4. Due to the setup inside the machine body, ambient light does not cause any other issues.
Supporting slats can be made from different materials, mostly copper, stainless steel, or mild steel. These three materials were tested and all had the same basic characteristic. A higher reflectivity on the front surface of the slat, such as in stainless steel, leads to a generally darker laser line, as more light was reflected away from the camera. However, this effect was small enough to not pose a challenge to the described system and one can find suitable threshold values for the image processing that account for all material types.
Some slats showed heavy slagging and other forms of wear and tear such as molten tips. An example of a slat with slagging is shown in Fig. 11. Of course, the shape of the slat is measured only from the front, as both the camera and the laser line are occluded at the back. It was expected that reflectivity would be problematic in this case, however that proved to be untrue.

An example of slat with heavy slagging
Molten tips can easily be detected, as there is a void in the row of tips. As expected, there were no issues with recording molten tips.
Supporting tips being bent in either direction are a frequent occurrence when looking at slats in industrial use. A major difference is by how much the tips have been bent. If they are just lightly bent by a few millimeters, this can be measured successfully by the system (see Table 3 and Fig. 12). However, sometimes the whole slat is bent at a certain position, an example of which can be seen in Fig. 12. The system had no problem detecting this. Note, however, that strongly bent tips might be occluded by the slat in front. In this case, the occlusion is not a problem, since such a strongly bent tip cannot be used as a supporting tip and knowing its absence from the standard position is more important than its exact tilted position for the following tilting calculation.

An example of very strongly bent tips
Another source of possible problems in the laser cutting process are slugs that are welded to the tips and can hardly be removed by automated systems that take cut metal sheets off the pallet and load a new raw metal sheet. However, if a new metal sheet is placed on top of a slug, it will sag, which can cause increased vibration leading to a lower quality cut. In the worst case, the height difference causes the cut part to not have the desired dimensions. In the pallets measured, there was one such slug (see Fig. 13). Detecting a slug in the point cloud can easily be achieved by filtering for the number of points in the z-range where slugs are expected, which is above the supporting tips.

A hexagonal slug welded onto a tip
Because it takes some force to push each slat down in its socket, they can be inserted incorrectly and be higher than surrounding slats. This is undesirable because it will cause the metal sheet to be wavy. These incorrectly inserted slats can easily be identified by the number of points in a certain range of the z-axis, analogous to detecting slugs. In Fig. 14, two such slats can easily be identified by the higher z-values indicated by a darker shade.

Two incorrectly inserted slats with higher tips in the midst of three correctly inserted slats
The raw images were checked for signs of other sources of decreasing robustness, such as vibration by checking for any periodic misalignment between following images of the sequence. No effects on the measurement were found.
6 Conclusion
This paper dealt with measuring the supporting tips of laser cutting machines, which was achieved by a novel laser triangulation setup. First, different possible visual measurement methods were introduced. From the methods considered, a laser triangulation system inside the machine body was chosen for implementation because of its expected accuracy and robustness. However, this setup meant having a slanted sheet of light and camera relative to the surface to be measured due to space constraints inside the machine body. This caused different transformations to be necessary in the image processing, compared with the ones introduced in the literature before. While the intrinsic calibration was established using a standard procedure, the extrinsic calibration of the system was achieved through a novel technique, namely using the slats of the machine as calibration objects. This has the advantage of being easily repeatable every time the slats are changed. Also, measurement noise is reduced due to the calibration object and the measured object having the same optical surface properties. During the image processing, different line extraction algorithms that showed good performance in another study that also dealt with metallic reflections were tested and their performance did not vary much. Because of the geometry of the setup, there was a problem with artifacts from multiple reflections. A template matching filter was proposed to mitigate this and showed satisfactory results. Multiple slat configurations were recorded. The accuracy of the measurement system was validated in two different ways based on the distance between supporting tips. The uncertainty of measurement was quantified to be within ± 0.8 mm. The setup proved to be robust to changes in the condition of the slats, such as material, slagging, and bent tips. Reflections could generally be kept at a low level through the geometry of the setup.
Further work should focus on implementing other methods discussed in Section 3.1, but not implemented in this work. While they may not reach the robustness and accuracy of a laser triangulation system, some methods interfere less with the production process. For example, what level of robustness and accuracy can be reached by object detection on single images seems worth exploring.
When looking at the setup presented, the validation is not optimal from a measurement engineering perspective. Further work could improve the validation techniques by choosing a setup in a laboratory environment instead of the machine. This would enable a validation against ground truth data in the resolution range of the measurement system.
Another interesting approach is to measure the slagging and molten tips of the supporting slats, which could be described as a kind of “health monitoring.” With these results, one could potentially better understand the process of slagging and its influencing factors, which could be used to design measures to prevent it effectively in the first place. Also, understanding the slagging process could reveal new insights on the laser cutting process itself.
A further open question regards the reflective properties of different metals in different wavelengths. For example, instead of taking a laser with 640-nm wavelength, any other visible or near-infrared wavelength could have been used. However, the reflection or rather absorption properties for different metals, that might depend on factors like alloy components, rolling direction, and surface finish, have never been thoroughly investigated in a single study to the knowledge of the authors. Such a study would greatly help in designing vision-based systems for metal processing industries.
Change history
02 June 2021
A Correction to this paper has been published: https://doi.org/10.1007/s00170-021-07289-8
References
Bader R (2017) Method for controlling a jet/beam cutting device having a cutting tool, a computer-implemented method for the automatic determination and generation of movement commands for controlling a cutting tool of a jet/beam cutting device, and jet/beam cutting device for carrying out said method. Patent WO2018224697A1
Bailey DG (2002) A new approach to lens distortion correction. Proceedings Image and Vision Computing New Zealand, pp 59–64
Beyerer J, Puente León F, Frese C (2016) Machine vision: Automated visual inspection: theory, practice and applications. Springer Berlin, Heidelberg
Blais F, Rioux M (1986) Real-time numerical peak detector. Signal Process 11(2):145–155
Bradski G (2000) The OpenCV Library. Dr Dobb’s Journal of Software Tools
Breier M, Möller P, Li W, Bosling M, Pretz T, Merhof D (2015) Accurate laser triangulation using a perpendicular camera setup to assess the height profile of pcbs. In: International Conference on Industrial Technology, IEEE, pp 1613–1618
Dewil R, Vansteenwegen P, Cattrysse D (2016) A review of cutting path algorithms for laser cutters. The International Journal of Advanced Manufacturing Technology 87(5-8):1865– 1884
Dorsch RG, Häusler G, Herrmann JM (1994) Laser triangulation: fundamental uncertainty in distance measurement. Applied optics 33(7):1306–1314
Douglas DH, Peucker TK (1973) Algorithms for the reduction of the number of points required to represent a digitized line or its caricature. Cartographica: the international journal for geographic information and geovisualization 10(2):112–122
Durrant-Whyte H, Rye D, Nebot E (1996) Localization of autonomous guided vehicles. In: Robotics Research, Springer, pp 613–625
Forest J, Teixidor JM, et al. (2003) A proposal for laser scanners sub-pixel accuracy peak detector. Workshop on European Scientific and Industrial Collaboration, pp 525–532
Gudmundsson SA, Aanæs H, Larsen R (2007) Environmental effects on measurement uncertainties of time-of-flight cameras. In: International symposium on signals, circuits and systems, IEEE, vol 1, pp 1–4
Häusler G, Ettl S (2011) Limitations of optical 3d sensors. In: Leach R (ed), pp 23–48
Heikkila J, Silven O, et al. (1997) A four-step camera calibration procedure with implicit image correction. In: Conference on computer vision and pattern recognition, IEEE, vol 97, pp 1106–1112
Himeno T, Nogi K (2009) Nesting data generation device and nesting data generation method. Patent WO2011004767A1
Hirschmuller H (2007) Stereo processing by semiglobal matching and mutual information. IEEE Transactions on pattern analysis and machine intelligence 30(2):328–341
Jacobus CJ, Chien RT (1981) Two new edge detectors. IEEE Transactions on pattern analysis and machine intelligence 5:581–592
Jones E, Oliphant T, Peterson P, et al. (2001) SciPy: Open source scientific tools for Python, version 1.16.1. http://www.scipy.org/, accessed 2019/07/08
Koch T, Breier M, Li W (2013) Heightmap generation for printed circuit boards (pcb) using laser triangulation for pre-processing optimization in industrial recycling applications. In: International Conference on Industrial Informatics, IEEE, pp 48–53
Kraft D (1988) A software package for sequential quadratic programming. Forschungsbericht- Deutsche Forschungs- und Versuchsanstalt fur Luft- und Raumfahrt
Lange R, Seitz P (2001) Solid-state time-of-flight range camera. IEEE Journal of quantum electronics 37(3):390–397
Larsson U, Forsberg J, Wernersson A (1996) Mobile robot localization: integrating measurements from a time-of-flight laser. IEEE Trans Ind Electron 43(3):422–431
Levinson J, Askeland J, Becker J, Dolson J, Held D, Kammel S, Kolter JZ, Langer D, Pink O, Pratt V et al (2011) Towards fully autonomous driving: Systems and algorithms. In: 2011 Intelligent Vehicles Symposium, IEEE, pp 163–168
Marr D, Poggio T (1979) A computational theory of human stereo vision. Proceedings of the Royal Society of London Series B Biological Sciences 204(1156):301–328
Moring I, Heikkinen T, Myllyla R, Kilpela A (1989) Acquisition of three-dimensional image data by a scanning laser range finder. Optical engineering 28(8):897–902
Mohammadikaji M, Bergmann S, et al. (2016) A framework for uncertainty propagation in 3d shape measurement using laser triangulation. IEEE International Instrumentation and Measurement Technology Conference. pp. 1–6
Naidu DK, Fisher RB (1991 ) A comparative analysis of algorithms for determining the peak position of a stripe to sub-pixel accuracy. In: British Machine Vision Conference, Springer, pp 217–225
Ramer U (1972) An iterative procedure for the polygonal approximation of plane curves. Computer graphics and image processing 1(3):244–256
Schwarz B (2010) Lidar: Mapping the world in 3d. Nat Photonics 4(7):429
Shapiro LG, Stockman GC (2001) Computer vision Prentice Hall. Upper Saddle River, NJ
Shi J, Tomasi C (1994) Good features to track. In: Conference on Computer Vision and Pattern Recognition, pp 593–600
Steen WM, Mazumder J (2010) Laser material processing, 4th edn. Springer, London
Struckmeier F, Puente León F (2019) Nesting in the sheet metal industry: dealing with constraints of flatbed laser-cutting machines. Procedia Manufacturing 29:575–582
Suzuki S, Keiichi A (1985) Topological structural analysis of digitized binary images by border following. Computer vision, graphics, and image processing 30(1):32–46
Tsai R (1987) A versatile camera calibration technique for high-accuracy 3d machine vision metrology using off-the-shelf tv cameras and lenses. Journal on Robotics and Automation 3(4):323–344
Wales DJ, Doye JP (1997) Global optimization by basin-hopping and the lowest energy structures of lennard-jones clusters containing up to 110 atoms. The Journal of Physical Chemistry A 101 (28):5111–5116
Zhang Z (2000) A flexible new technique for camera calibration. IEEE Transactions on pattern analysis and machine intelligence 22(11):1330–1334
Acknowledgments
The authors would like to thank Philipp Blättner, who helped with both acquiring the images and implementing the algorithms for this work during his internship with TRUMPF Werkzeugmaschinen GmbH & Co. KG, Ditzingen, Germany.
Funding
Open Access funding enabled and organized by Projekt DEAL.
Author information
Authors and Affiliations
Corresponding author
Ethics declarations
Conflict of interest
The authors declare that they have no conflict of interest.
Additional information
Publisher’s note
Springer Nature remains neutral with regard to jurisdictional claims in published maps and institutional affiliations.
Rights and permissions
Open Access This article is licensed under a Creative Commons Attribution 4.0 International License, which permits use, sharing, adaptation, distribution and reproduction in any medium or format, as long as you give appropriate credit to the original author(s) and the source, provide a link to the Creative Commons licence, and indicate if changes were made. The images or other third party material in this article are included in the article's Creative Commons licence, unless indicated otherwise in a credit line to the material. If material is not included in the article's Creative Commons licence and your intended use is not permitted by statutory regulation or exceeds the permitted use, you will need to obtain permission directly from the copyright holder. To view a copy of this licence, visit http://creativecommons.org/licenses/by/4.0/.
About this article

Cite this article
Struckmeier, F., Zhao, J. & León, F.P. Measuring the supporting slats of laser cutting machines using laser triangulation. Int J Adv Manuf Technol 108, 3819–3833 (2020). https://doi.org/10.1007/s00170-020-05640-z
Received:
Accepted:
Published:
Issue Date:
DOI: https://doi.org/10.1007/s00170-020-05640-z