Entropy-Based Pandemics Forecasting
 Umberto Lucia
 Thomas S. Deisboeck
 Giulia Grisolia
- 1Dipartimento Energia “Galileo Ferraris”, Politecnico di Torino, Torino, Italy
- 2Department of Radiology, Harvard-MIT Martinos Center for Biomedical Imaging, Massachusetts General Hospital, Harvard Medical School, Charlestown, MA, United States
A great variety of natural phenomena follows some statistical distributions. In epidemiology, such as for the current COVID 19 outbreak, it is essential to develop reliable predictions of the evolution of an infectious disease. In particular, a statistical projection of the time of maximum diffusion of infected carriers is fundamental in order to prepare healthcare systems and organize a robust public health response. In this paper, we develop a thermodynamic approach based on the infection statistics related to the total citizenry of a country. It represents a novel tool for evaluating the time of maximum diffusion of an epidemic or pandemic.
1. Introduction
In the natural, social, economic, and physical sciences a large variety of phenomena are characterized by regularities, which can be analytically described by a defined statistical distribution [1]. Consequently, in any field of research, scientists, and engineers have always taken attention to find the best statistical distribution to predict the systems behavior.
This is particularly true in epidemiology. Indeed, epidemics can occur in a community or region by causing illness in excess of normal expectancy; pandemics are no more than a large-scale global epidemic which determine a growth in morbidity and mortality over a wide geographic area [2, 3]. Some recent examples of pandemics are the 2003 SARS (Severe Acute Respiratory Syndrome), the 2014 West Africa Ebola epidemic, and the present COVID-19 caused by the coronavirus SARS-Cov-2. Moreover, epidemics and pandemics can cause also significant, widespread economic hardship and potentially lead to social unrest. Consequently, the interest in forecasting the diffusion of such global infectious disease threats is continuously increasing [2, 4, 5].
To implement effective public health measures in a timely manner and allocate scarce resources according to geographic need, it is very important to forecast the diffusion or spread of the infection amongst the population. Consequently, it is fundamental to develop a reliable analytical approach that allows such predictive modeling.
Traditionally, epidemiological analyses are based on sigmoidal models, which indeed are useful if the evolution of the epidemics follows well-established patterns. However, especially in the beginning of any epidemics we have only partial access to validated data also because the number of infected people is still rather small and follows a dynamic process. Scientists and engineers have always searched for the best statistical distribution useful to predict the behavior of the systems under consideration [6, 7]. Indeed, the usual statistical approach is based on the Kolmogorov's law of large numbers which requires the existence of the first finite moment, and the Lyapunov's version of the central limit theorem assumes an existence of the finite moment of an order higher than two. But, when the data are collected by a heavy-tailed distribution, the mathematical bases of the usual statistics is not satisfied. The existence of specific finite moments is closely related to the concept of a tail index, and its estimation is one of key problems in statistics. At present, there are a great number of estimators of the tail-index [8–16], but, a generic approach is required in order to generalize the statistical approach to complex systems, such as in the case of epidemics or pandemics.
Furthermore, the spread of infection can be studied as the evolution of an open thermodynamic system. In this context, we note that Jaynes developed a non-equilibrium statistical mechanics approach for the stationary state constraint, on the basis of the principle of maximum entropy [17, 18]. He maximized the Shannon entropy for information in relation to the pathway followed in the thermodynamic phase space, by considering the probability subject to the actual constraints [19]. This results in finding the most probable macroscopic pathway realized by the greater number of microscopic paths compatible with the imposed constraints [19–24]. Entropy has been proven to represent a fundamental key for the analysis of some biosystems [25–32].
In this paper, we therefore extend a thermodynamic approach of complex systems to the analysis of epidemics by introducing entropy as a tool to predict the evolution of an infectious disease.
2. Materials and Methods
First, we must consider a reference statistics for a human to be infected. To do so, we consider the recent results obtained in relation to the use of the logistic approach by Loum et al. [33]; the cumulative probability of infection vs. time t follows the logistic shape:
where P is the probability of infection, t is the time, α and β are two constants. The shapes of SARS-Cov-2 expansion for China, USA, Italy and Spain are shown in Figure 1.
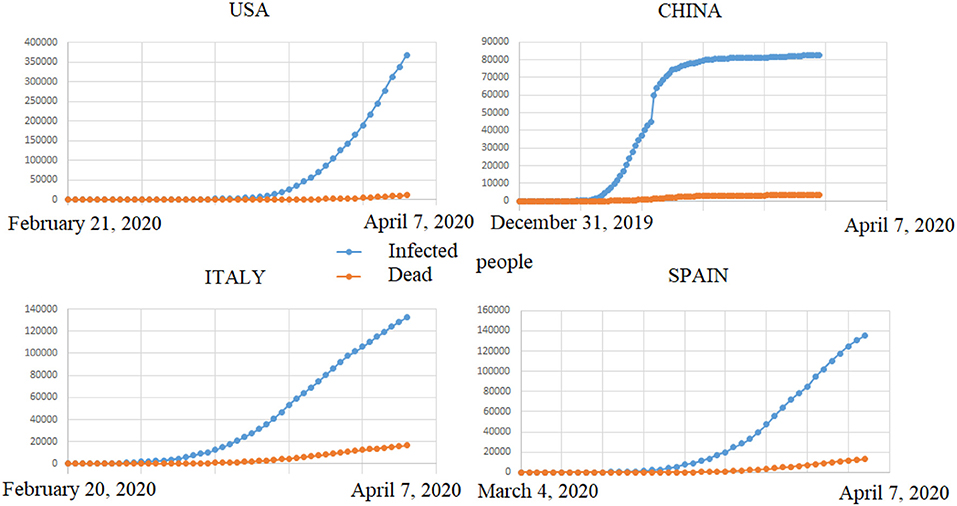
Figure 1. Cumulative number of SARS-Cov-2 infected people (blue) vs. deaths (orange) per country as of the beginning of April, 2020. Data recoiled on https://www.ecdc.europa.eu/sites/default/files/documents/COVID-19-geographic-disbtribution-worldwide.xlsx (April 8th, 2020).
On the other hand, in relation to the probability of infections, by following the usual statistical thermodynamic approach, we can define the Gibbs dimensionless entropy as [34, 35]:
where f is the frequency of the infected people on the total citizenry of the country considered:
where n(t) is the number of infected people at the time t and ntot is the population at the time t.
For any system, the most probable state is reached when the entropy (Equation 2) reaches its maximum, so, in relation to epidemics/pandemics, we expect that the maximum diffusion or expansion of the infectious disease occurs at the maximum entropy.
3. Results
Entropy is a function which allows us to determine the time of maximum diffusion or spread of the infections. In order to use such a thermodynamic approach, we must obtain medical data, usually collected by the health authorities. However, at the start of outbreak, available data are rare, and so we can obtain only a tail shape of the entropy function; still, we must try to obtain a best fit of the entropy shape by using at least 5–8 days of observational data to evaluate the interpolation function by a tail Taylor power development [36, 37].
Once we are able to obtain the function fitting the entropy shape vs. time, we can forecast the maximum of the entropy and, consequently, the corresponding time point of maximum infections amongst the citizenry. In summary, the epidemiological forecasting tool that we suggest consists in:
• Finding the occurrence frequency distribution in time;
• Finding the cumulative value of the occurrence frequency distribution in time;
• Evaluating the entropy through the Equation (2);
• Evaluating the best fit for the entropy obtained at the previous point;
• Determining its maximum and the related time, directly by the shape or by mathematical methods [36, 37].
To demonstrate the utility of the model, we have represented the shapes of the evolution of entropy for the USA, China, Italy, and Spain in Figure 2 (using the data summarized in Table 1); depicted is the interpolation function that is used to evaluate the maximum entropy which in turn relates to the time of maximum SARS-Cov-2 infection among a countrys citizens. We can highlight that:
• For China: the time of maximum expansion of the coronavirus infection results 23 days after January 17th (around February 11th). The slight discrepancy with the value reported in the Table (i.e., February 13) is due to the function used for fitting (the better the fit, the more accurate is the forecasting); Moreover, China declared a correction on April 17, 2020.
• For Italy it results 34 days after February 22nd (March 27th), which corresponds exactly with the observed time point reported in the Table 1;
• For Spain it results 36 days after February 25th (April 1st), which again corresponds precisely with the observed time point;
• For the USA it results 58 days after March 2nd, i.e., around April 28th, which is prospective at the time this manuscript has been submitted;
• As an example that this approach also has applicability at a higher spatial granularity, for New York City (Table 2 and Figure 3), for instance, it results 38 days after March 17th, i.e., around April 25th, also prospective at this point.
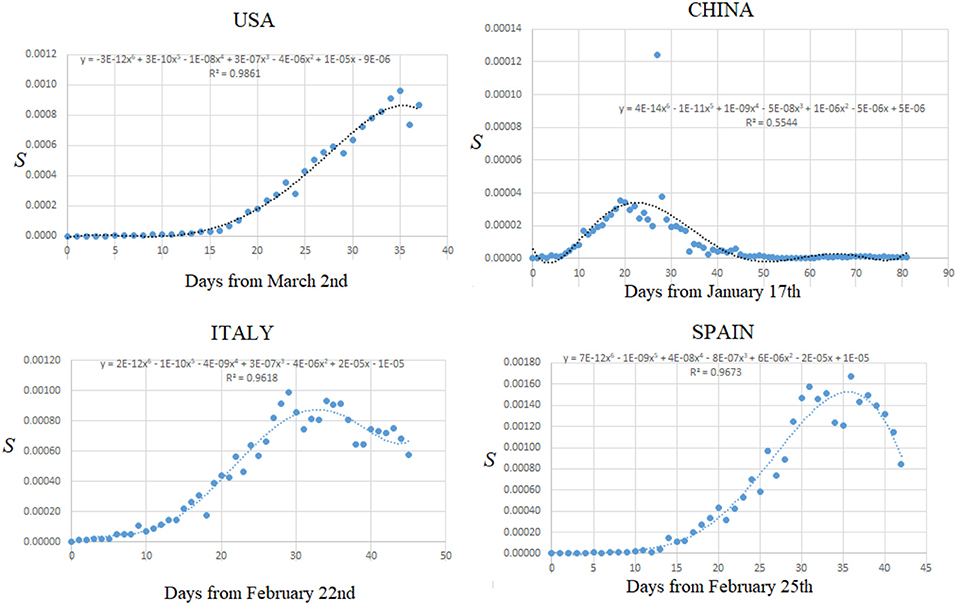
Figure 2. Entropy shape for newly SARS-Cov-2 infected people in relation to the total number of citizens. The best fit allows evaluating the data for maximum infection probability. For the USA this yields new infections to peak on or close to April 28th, for China it results around February 11th; for Italy it yields March 27th; for Spain it results in April 1st. Data recoiled on https://www.ecdc.europa.eu/sites/default/files/documents/COVID-19-geographic-disbtribution-worldwide.xlsx (April 8th, 2020).
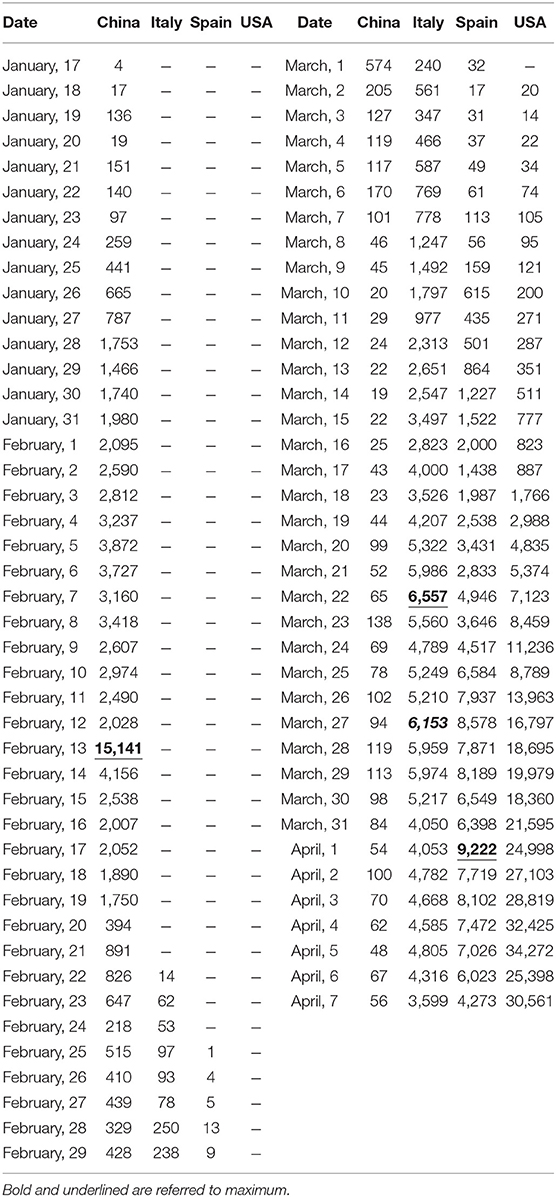
Table 1. Data of SARS-Cov-2 infections for the USA, China, Italy, and Spain, in 2020, recoiled on https://www.ecdc.europa.eu/sites/default/files/documents/COVID-19-geographic-disbtribution-worldwide.xlsx (April 8th, 2020).
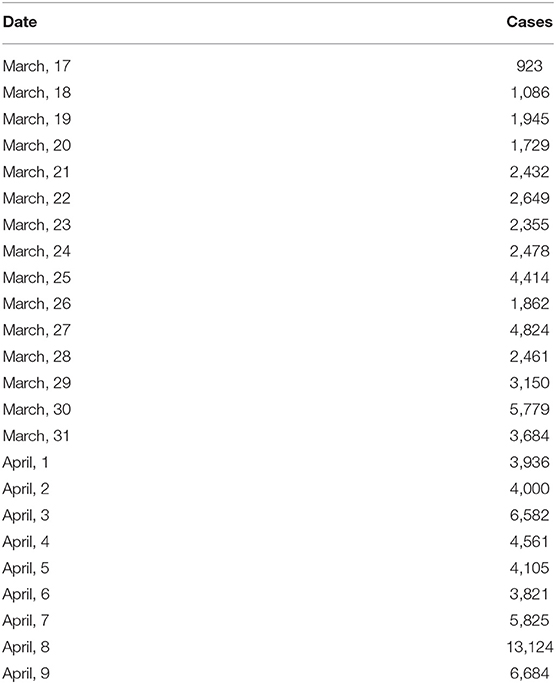
Table 2. Data of SARS-Cov-2 infections for New York City, recoiled on https://www1.nyc.gov/site/doh/covid/covid-19-data-archive.page (April 10th, 2020).
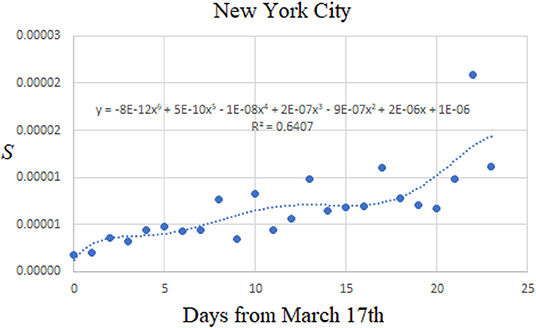
Figure 3. Depicted is the entropy shape for newly SARS-Cov-2 infected people in New York City, in relation to the total number of citizens. From the curve's best fit, one can evaluate the data of maximum infection probability. For New York City the maximum spread of coronavirus infection is forecasted to occur on the 38th day after March 27th, i.e., on April 25th Data recoiled on https://www1.nyc.gov/site/doh/covid/covid-19-data-archive.page (April 11th, 2020).
4. Discussion
The method suggested here is a novel thermodynamic approach for forecasting large-scale infectious disease outbreaks based on the maximum entropy variation, obtained by using an occurrence frequency approach for a finite size statistical population.
There are some thermodynamic applications to epidemiology, but, in comparison to the approach introduced here, these previously reported concepts are based on the SIS dynamic model and on maximum entropy [38]. While generally intriguing from a mathematics perspective, these models are strongly dependent on the statistics used because the basic reproduction number introduced is a valid predictor in structured populations only when size is infinite [39], which represents the usual constraint of a great number of statistics.
We have therefore developed an approach based on fitting of the entropy in order to obtain its empirical-like approximation of the spontaneous occurrence of epidemics/pandemics. In this way, we analytically describe the expansion of an infectious disease without introducing any a priori statistics. In relation to other non-statistical-based thermodynamic models [39, 40], we refrain from introducing any variables or rate evaluation, and we only fit the Gibbs entropy shape; as such, we obtain the real empirical behavior, as it unfolds, without any restriction related to a mathematical model, as introduced in the other approaches [39]. We note that our approach, much like any other, depends on the availability of reliable diagnostic testing which has been heterogeneously deployed across countries and regions with regards to test modality, availability and accuracy; still, while better test performance and the forthcoming availability of longitudinal data through ongoing population studies in the EU and the US would be desirable, based on currently available data, regardless of their limitations, our model already accurately predicted the date of maximum expansion of coronavirus infections in countries such as Italy and Spain.
In conclusion, we have obtained a novel, useful tool to aid much needed projections in large-scale infectious disease outbreaks, based only on an applied physical approach. Most importantly, the utility of the model has been confirmed in the context of the current COVID-19 pandemic caused by SARS-Cov2.
4.1. Resource Identification Initiative
To take part in the Resource Identification Initiative, please use the corresponding catalog number and RRID in your current manuscript. For more information about the project and for steps on how to search for an RRID, please click http://www.frontiersin.org/files/pdf/letter_to_author.pdf.
4.2. Life Science Identifiers
Life Science Identifiers (LSIDs) for ZOOBANK registered names or nomenclatural acts should be listed in the manuscript before the keywords. For more information on LSIDs please see Inclusion of Zoological Nomenclature section of the guidelines.
Data Availability Statement
The datasets analyzed for this study can be found, for USA, China, Italy, and Spain, in the European Center for Disease Prevention and Control, https://www.ecdc.europa.eu/sites/default/files/documents/COVID19-geographic-disbtribution-worldwide.xlsx, while for New York City in NYC Health, COVID-19: Data Archive, https://www1.nyc.gov/site/doh/covid/covid-19-data-archive.page.
Author Contributions
UL: conceptualization, methodology, formal analysis, investigation, writing - original draft, writing - review & editing, supervision, project administration and funding acquisition. GG: resources, writing - review & editing, visualization, data curation and validation. TD: conceptualization, methodology, investigation, writing - original draft, supervision, and writing - review & editing. All authors contributed to the article and approved the submitted version.
Conflict of Interest
The authors declare that the research was conducted in the absence of any commercial or financial relationships that could be construed as a potential conflict of interest.
References
2. Madhav N, Oppenheim B, Gallivan M, Mulembakani P, Rubin E, Wolfe N. Chapter 17: Pandemics: Risks, Impacts, and Mitigation. In: Jamison DT, Gelband H, Horton S, Jha P, Laxminarayan R, Nugent CNMR, editors. Disease Control Priorities: Improving Health and Reducing Poverty. 3rd ed. Washington, DC: The World Bank (2017) 315–42.
4. Sands P, Mundaca-Shah C, Dzau VJ. The neglected dimension of global security A framework for countering infectious-disease crises. N Engl J Med. (2016) 374:1281–7. doi: 10.1056/NEJMsr1600236
5. Woolhouse MEJ, Gowtage-Sequeria S. Host range and emerging and reemerging pathogens. Emerg Infect Dis. (2005) 11:1842–7. doi: 10.3201/eid1112.050997
6. Newman MEJ. Power Laws, Pareto distributions and Zipf's law. Contemp Phys. (2005) 46:323–51. doi: 10.1080/00107510500052444
7. Benguigui L, Blumenfeld-Lieberthal E. The end of a paradigm: is Zipf's Law Universal? J Geogr Syst. (2011) 13:87–100. doi: 10.1007/s10109-010-0132-6
8. Toda AA. The double power law in income distribution: explanations and evidence. J Econ Behav Organ. (2012) 84:364–81. doi: 10.1016/j.jebo.2012.04.012
9. Nordhaus WD. Economic policy in the face of severe tail events. J Public Econ Theor. (2012) 14:197–219. doi: 10.1111/j.1467-9779.2011.01544
10. Kaizoji T. Scaling behavior in land markets. Phys A. (2003) 326:256–64. doi: 10.1016/S0378-4371(03)00145-6
11. Chaney T. Distorted gravity: the intensive and extensive margins of international trade. Am Econ Rev. (2008) 98:1707–21. doi: 10.1257/aer.98.4.1707
12. Gabaix X, Gopikrishnan P, Plerou V, Stanley HE. A theory of power-law distributions in financial market fluctuations. Nature. (2003) 423:267. doi: 10.1038/nature01624
13. Soo KT. Zipf's law for cities: a cross-country investigation. Region Sci Urban Econ. (2005) 35:239–63. doi: 10.1016/j.regsciurbeco.2004.04.004
14. Seekell DA, Pace ML. Does the Pareto distribution adequately describe the size-distribution of lakes? Limnol Oceanogr. (2011) 56:350–6. doi: 10.4319/lo.2011.56.1.0350
15. Agterberg F. Multifractal modeling of the sizes and grades of giant and supergiant deposits. Int Geol Rev. (1995) 37:1–8. doi: 10.1080/00206819509465388
16. Ferriere R, Cazelles B. Universal power laws govern intermittent rarity in communities of interacting species. Ecology. (1999) 80:1505–21.
18. Jaynes ET. The Gibbs paradox. In: Smith CR, Erickson GJ, Neudorfer PO, editors. Maximum Entropy and Bayesian Methods. Dordrecht: Kluwer Academic Publishers (1992). p. 1–19.
19. Lucia U. Thermodynamic paths and stochastic order in open systems. Phys A. (2013) 392:3912–19. doi: 10.1016/j.physa.2013.04.053
20. Lucia U. Stationary open systems: a brief review on contemporary theories on irreversibility. Phys A. (2013) 392:1051–62. doi: 10.1016/j.physa.2012.11.027
21. Lucia U. Irreversibility entropy variation and the problem of the trend to equilibrium. Phys A. (2007) 376:289–92. doi: 10.1016/j.physa.2006.10.059
22. Lucia U. Statistical approach of the irreversible entropy variation. Phys A. (2008) 387:3454–60. doi: 10.1016/j.physa.2008.02.002
23. Lucia U. Irreversibility, entropy and incomplete information. Phys A. (2009) 388:4025–33. doi: 10.1016/j.physa.2009.06.027
24. Lucia U. Maximum entropy generation and κ-exponential model. Phys A. (2010) 389:4558–63. doi: 10.1016/j.physa.2010.06.047
25. Jones BA, Lessler J, Bianco S, Kaufman JH. Statistical mechanics and thermodynamics of viral evolution. PLoS ONE. (2015) 10:e0137482. doi: 10.1371/journal.pone.0137482
26. Lucia U, Grisolia G, Astori MR. Constructal law analysis of Cl− transport in eyes aqueous humor. Sci Rep. (2017) 7:6856. doi: 10.1038/s41598-017-07357-8
27. Lucia U, Grisolia G, Dolcino D, Astori MR, Massa E, Ponzetto A. Constructal approach to bio-engineering: the ocular anterior chamber temperature. Sci Rep. (2016) 6:1–6. doi: 10.1038/srep31099
28. Lucia U, Grisolia G, Francia F, Astori MR. Theoretical biophysical approach to cross-linking effects on eyes pressure. Phys A. (2019) 534:122163. doi: 10.1016/j.physa.2019.122163
29. Lucia U, Grisolia G. Second law efficiency for living cells. Front Biosci. (2018) 9:270–5. doi: 10.2741/s487
30. Lucia U, Grisolia G. Constructal law and ion transfer in normal and cancer cells. Proc Roman Acad Ser A. (2018) 19:213–8.
31. Lucia U. Bioengineering thermodynamics: an engineering science for thermodynamics of biosystems. IJoT. (2015) 18:254–65. doi: 10.5541/ijot.5000131605
32. Lucia U. Bioengineering thermodynamics of biological cells. Theor Biol Med Model. (2015) 12:29–44. doi: 10.1186/s12976-015-0024-z
33. Loum MA, Poursat MA, Sow A, Sall AA, Loucoubar C, Gassiat E. Multinomial logistic model for coinfection diagnosis between arbovirus and malaria in Kedougou. Int J Biostat. (2019) 115:20170015. doi: 10.1515/ijb-2017-0015
38. Harding N, Nigmatullin R, Prokopenko M. Thermodynamic efficiency of contagions: a statistical mechanical analysis of the SIS epidemic model. Interface Focus. (2018) 8:20180036. doi: 10.1098/rsfs.2018.0036
39. Rhodes CJ, Demetrius L. Evolutionary entropy determines invasion success in emergent epidemics. PLoS ONE. (2010) 5:e12951. doi: 10.1371/journal.pone.0012951
40. Scarpino SV, Petri G. On the predictability of infectious disease outbreaks. Nat Commun. (2019) 10:898. doi: 10.1038/s41467-019-08616-0
5. Nomenclature
Latin symbols
f frequency of occurrence
n number of infected
P infection probability
S adimensional entropy
t time
Greek symbols
α Constant
β Constant
Subscript
tot population
Keywords: SARS-Cov-2, Covid-19, coronavirus, epidemics-pandemics, non-equilibrium statistical thermodynamics, epidemiology
Citation: Lucia U, Deisboeck TS and Grisolia G (2020) Entropy-Based Pandemics Forecasting. Front. Phys. 8:274. doi: 10.3389/fphy.2020.00274
Received: 14 April 2020; Accepted: 19 June 2020;
Published: 25 June 2020.
Edited by:
Matja Perc, University of Maribor, SloveniaReviewed by:
Satyam Mukherjee, Indian Institute of Management Udaipur, IndiaMarco Alberto Javarone, University College London, United Kingdom
Copyright © 2020 Lucia, Deisboeck and Grisolia. This is an open-access article distributed under the terms of the Creative Commons Attribution License (CC BY). The use, distribution or reproduction in other forums is permitted, provided the original author(s) and the copyright owner(s) are credited and that the original publication in this journal is cited, in accordance with accepted academic practice. No use, distribution or reproduction is permitted which does not comply with these terms.
*Correspondence: Umberto Lucia, umberto.lucia@polito.it