

Abstract
Southwestern China (SWC) has suffered from increasing frequency of heat wave (HW) in recent summers. While the local drought-HW connection is one obvious mechanism for this change, remote controls remain to be explored. Based on ERA-5 reanalysis, it is found that the SWC summer HWs are significantly correlated with sea-ice losses in the Barents Sea, Kara Sea and the Arctic pole. The reduction of Arctic sea ice can cause low pressure anomalies over the polar region due to increased heat-flux exchanges at the sea-air interface, which subsequently triggers southeastward Rossby wave trains propagating from northern Europe to East Asia that induce anomalous anticyclone over SWC. As a result, the North Pacific subtropical high extends westward, accompanied by divergent winds, decreased cloud cover and increased insolation in SWC, which leads to above-normal air temperatures there. In addition, the East Asian westerly jet stream is shifted northward, which enhances (reduces) the moisture convergence in North China (SWC), resulting in prominently drier soil in SWC. Therefore, the sea ice—forced changes in atmospheric circulation and surface conditions favor the occurrences of SWC summer HWs.
Export citation and abstract BibTeX RIS

Original content from this work may be used under the terms of the Creative Commons Attribution 4.0 license. Any further distribution of this work must maintain attribution to the author(s) and the title of the work, journal citation and DOI.
1. Introduction
Heat wave (HW), defined as excessively hot air temperatures, is one of the most impactful weather events in a warming world (Fouillet et al 2006, Shaposhnikov et al 2014). In recent years, southwestern China (SWC) has experienced more frequent HW events, which have caused huge environmental and socio-economic consequences. For example, in summer 2006, an exceptionally strong HW, together with long-lasting drought, occurred in SWC, leading to large crop failure and direct economic losses of about 1.8 billion US dollars (Zou and Gao 2007, Li et al 2011, Wang et al 2015). Moreover, in July 2017, eastern SWC was hit by unprecedented HWs, which profoundly increased the mortality of cardiovascular disease (Luan et al 2019, Wu et al 2019). Furthermore, it is suggested that the probability of SWC HW would be elevated dramatically in future warming scenarios (Wang et al 2014, Huang et al 2016), which triggers increasing interest in climate community to explore the physical causes behind the changes in SWC HW.
The potential factors for SWC summer HWs may include the severe and sustained droughts (Zou and Gao 2007), the rapid urbanization (Jones et al 2008), and the abnormal blocking highs (Wang and Zhang 2008). One common feature of these factors is their ability to increase near surface air temperatures by modulating the local land-atmosphere interaction. While the physical processes behind the local control represented by the first two factors are well understood, remote control mechanisms via changed atmospheric circulation such as the last mentioned factor remain to be explored.
Recently, the rapid declining of Arctic sea ice and its connection with lower-latitude weather extremes have attracted tremendous attention (Francis and Vavrus 2012, Coumou et al 2013, Cohen et al 2014). One proposed mechanism and heavily debated question is if the Arctic warming, owing to the melting of Arctic sea ice (Screen and Simmonds 2010), could lead to a weakened and wavier mid-latitude westerly jet stream and provide a favorable circulation background for atmospheric blockings and HWs. Although the connections among Arctic sea ice losses, mid-latitude atmosphere circulation changes, and northern hemisphere HWs have been studied extensively (Francis 2017, Coumou et al 2018, Cohen and Coauthors 2020), the consensuses are still divergent especially in terms of regional scales, which need to be further studied. Therefore, it is of interest to investigate whether the recent increases in SWC summer HWs are remotely affected by the Arctic sea ice.
In this paper, we first illustrate the spatiotemporal features of SWC HWs during summer. Then, we examine the relationship between SWC summer HWs and Arctic sea ice, focusing on the teleconnection mechanisms. The rest of this paper is organized as follows. Section 2 describes datasets and methods used. Sections 3 presents and elaborates the results obtained, followed by conclusions in section 4.
2. Data and methods
The daily 2 m air temperature (T2 m) and monthly mean meteorological variables, including precipitation rate, total cloud cover, sea surface temperature, sea ice cover and vertical integrals of horizontal water vapor at single level, and geopotential heights and 3-dimentional winds at multiple pressure levels, are obtained from the ERA-5 reanalysis, which has a horizontal resolution of 0.25° × 0.25° for the period of 1979–present (Hersbach and Coauthors 2018). Compared to the previous ERA-Interim, ERA-5 reanalysis exhibits higher spatial and temporal resolutions, better soil moisture, and more consistent sea surface temperature and sea ice (Albergel et al 2018, Wang et al 2019). The severity of drought is evaluated using the Dai Palmer Drought Severity Index (PDSI) (Dai et al 2004), which is provided by the NOAA/OAR/ESRL PSD, Boulder, Colorado, USA, from their Web site at www.esrl.noaa.gov/psd/.
To explore the causality between Arctic sea ice and SWC summer HW, we also analyze the model simulations from the Polar Amplification Model Inter-comparison Project (PAMIP) (Smith et al 2019). The PAMIP model simulations were forced with different combinations of SST and/or SIC. For example, the pdSST-piArcSIC (pdSST-pdSIC) experiments represent atmosphere-only time slice forced by climatological monthly mean sea surface temperature for the present day and pre-industrial (present day) Arctic sea ice concentration. The past Arctic SIC will be computed from the ensemble of CMIP5 simulations by PAMIP. The time slice simulations begin on 1st April and run for 14 months, where the first two months are ignored to allow for an initial model spin up. Therefore, the time period analyzed in this study is from 2000-06-01 to 2001-06-01. Although there are several models that have participated in this project, we merely analyzes 10 ensample members from Community Earth System Model version 2.
In addition, we define a HW event based on the following condition: there are 3 consecutive days when T2 m exceeds its 90th-percentile thresholds. The 90th-percentile threshold of T2 m on a specific date within summer indicates the 90th percentile of T2 m for a total of 600 d (40 × 15, the 15 d correspond to 7 d on either side of the target date) for the 40 years from 1979 to 2018 (Deng et al 2018a, 2018b, 2019a). By running the 15-day sampling window, we can get the consecutive threshold for every date. Other methods applied in this study include diagnostic analysis using wave activity fluxes (Takaya and Nakamura 2001), composite analysis, and linear regression/correlation. The statistical significances of the composite and correlation results are tested by the Student's t-test.
3. Results
3.1. Spatiotemporal characteristics of SWC summer HW
We first introduce the unique topography of SWC. As seen in figure 1(a), the land surface height of China decreases like a three-step staircase from west to east. The first step mainly includes the Tibetan Plateau, with an average elevation above 4000 meters. The second step is primarily consisted of the Inner Mongolia Plateau and the Yunnan-Guizhou Plateau, with an average elevation of 1500–2500 meters. The third step includes the plains and basins in eastern and southern China, with elevations mostly below 500 meters. Particularly, SWC includes the provinces of Sichuan, Yunnan and Guizhou, the municipality of Chongqing, and the Tibet Autonomous Region of the Sichuan province, which lies across the three steps, with sharp elevation drops from over 4000 m in the Tibetan Plateau to less than 500 m in the Sichuan Basin (Qin et al 2010).

Figure 1. (a) Elevation height (unit: kilometer) (where 1, 3, 4 indicate provinces of Sichuan, Guizhou, Yunnan and 2 and 5 indicate Chongqing Municipality and Tibet autonomous region, respectively). (b) and (c) display the multi-decadal differences of JJA (June-July-August) mean standardized Palmer drought severity index and HW day (HWD, unit: day) between 1999–2018 and 1979–1998, respectively. (d) JJA mean 2 m air temperature (T2 m) (red, unit: °C) and precipitation rate (blue, unit: mm day−1) for the period of 1979–2018, which are averaged over SWC region (26°N–33°N and 102°E–108°E) that is outlined by blue boxes. The least-squares fitting linear trend in T2 m (precipitation) exceeds 99.9% (95%) confidence level.
Download figure:
Standard image High-resolution imageThe complex topography in SWC is accompanied with dramatically varying climate. Figure 1(b) presents the multi-decadal changes in drought severity, where a negative value of PDSI anomaly represents a more severe drought condition, and vice versa. We can see that the multi-decadal strengthening of drought severity has appeared mainly in SWC and northern China, while the drought severity in northwestern China has been mitigated. Correspondingly, China summer HW day (HWD) has also grown considerably in recent decades. As indicated by figure 1(c), the multi-decadal increases in China summer HWD primarily exist in eastern China, northern China, and SWC. We note that, SWC is the only region where the drought severity and HWD have both increased substantially, which could lead to increasing impacts on the ecosystem and human society in SWC.
The long-term changes in drought and HW over SWC are accompanied by significant changes in the local precipitation and surface air temperature. As seen from figure 1(d), the seasonal mean T2 m in SWC experienced a significantly upward trend for the period of 1979–2018, while the mean precipitation over the same period showed a downward trend. The significant opposing correlations between the two variables exist not only in the long-term trends, but also in the interannual time scales. The correlation coefficient between the two variables is −0.43 (−0.32 after removing linear trends), which exceeds the 99% (95%) confidence levels, suggesting that the air temperatures in SWC be intimately linked to the changes in local precipitation. As a typical case, during summer of 2006, the T2 m (precipitation) in SWC reached a record high (low), corresponding to exceptional droughts and HWs during that summer. Nevertheless, the trends in precipitation are apparently less significant than those in the air temperatures. Previous studies (Zhang et al 2017) have identified the importance of large-scale atmospheric circulation on the changes in precipitation, which suggest the critical role of remote control on the drought, and thus on the HWs in the study region.
Figures 2(a)–(b) show the climatology of HWD and the linear trend in HWD for the period of 1979–2018, respectively. As indicated by figure 2(a), the peak values of climatic HWD appear in eastern Sichuan Province and Chongqing City, with an average magnitude of 4 d. The distribution of HWD trend is generally similar to the climatology, but is more concentrated in the Sichuan Basin, with the largest trend exceeding 3 d per decade. Figure 2(c) further shows the year-to-year variations of SWC summer HWD, averaged over 26°N–33°N/102°E–108°E. It is shown that SWC HWD experienced a rapid increase over the past 40 years, especially from mid-1990 s, with the largest HWD occurring in 2006.
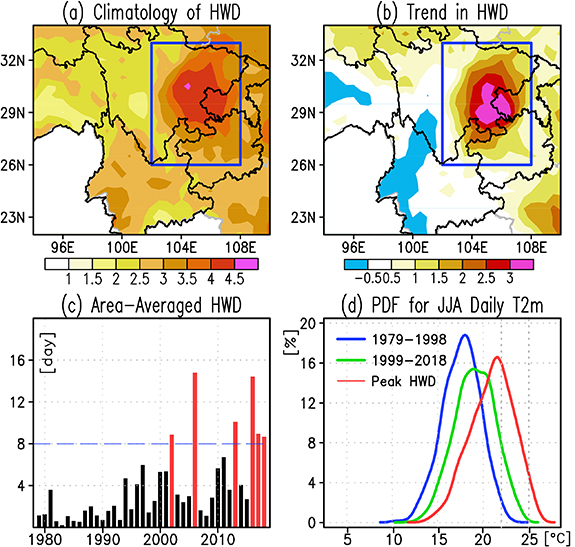
Figure 2. (a) Climatology (unit: day) of HWD and (b) linear trend (unit: day decade−1) in HWD for the period of summer 1979–2018. (c) HWD averaged over the outline area, where red bars indicate the peak HWD summers when HWD exceeds 8 d. (d) Distributions of probability density function (unit: %) for area-averaged daily T2 m within JJA. The curves in blue, green, and red represent the PDFs for 1979–1998, 1999–2018, and peak HWD summers, respectively.
Download figure:
Standard image High-resolution imageFigure 2(d) displays the probability density function (PDF) of summer daily T2 m during different periods. To explore the impacts of global warming on the probability of SWC HWs, we divided the study period into two equal time slices, i.e. 1979–1998 and 1999–2018. Using 1998/1999 as the turning point enables us to obtain the equally long time slices, both of which include 20 years. As shown in figure 2(d), the average of T2 m has increased by about 2 °C from 1979–1998 to 1999–2018, when the probability of T2 m exceeding 22 °C has ascended from about 2% during 1979–1998 to 8% during 1999–2018. Nevertheless, the probability of T2 m exceeding 25 °C is nearly zero for the two periods. In other words, the shift of mean state may lead to 4 times increase of mild temperature extremes, but it alone cannot trigger the more extreme HWs. In contrast, the probability of T2 m exceeding 25 °C during peak HWD years (defined as the years when summer HWD exceeds 8 d, i.e. 2002, 2006, 2013, 2016, 2017, 2018) is more than 4%, suggesting that the occurrences of extreme HWs during specific years be linked to additional physical processes.
3.2. Teleconnection between SWC summer HW and arctic sea ice
Motivated by previous studies that Arctic warming amplification may trigger more HWs in lower latitudes (Francis and Vavrus 2012, Deng et al 2019b, 2020), we explore the possible linkages between SWC summer HWs and the Arctic sea ice. As displayed in figures 3(a) and (c), the SWC summer HWD is significantly correlated with the reduction of sea ice in the Barents Sea and Kara Sea during antecedent winter and spring. During summer, the reductions in sea ice extend northward, and appear in the entire Arctic regions (figure 3(e)). Right panels of figure 3 further show the time series of area-averaged sea ice and SWC summer HWD. The fluctuations of Arctic sea ice were small until mid-1990 s, when the sea ice started to decrease sharply. Meanwhile, SWC summer HWD was small before mid-1990 s, but went up rapidly after late-1990 s. The opposite relationships between SWC summer HW and the Arctic sea ice are observed not only in the trends but also in the year-to-year variations. For example, in 2006, 2013 and 2016, the Arctic sea ice was at extremely low levels, while SWC summer HWD during the same year showed peak magnitudes. Moreover, the opposite correlation between the two variables seemed to be more prominent after late 1990 s. One possible explanation for the lack of such a strong relationship between the two during the initial years could be that the thickness of the sea ice has become critically low after late 1990 s, which led to increased heat fluxes at the sea-air interface, making it easier to trigger atmospheric circulation anomaly in the Arctic regions.
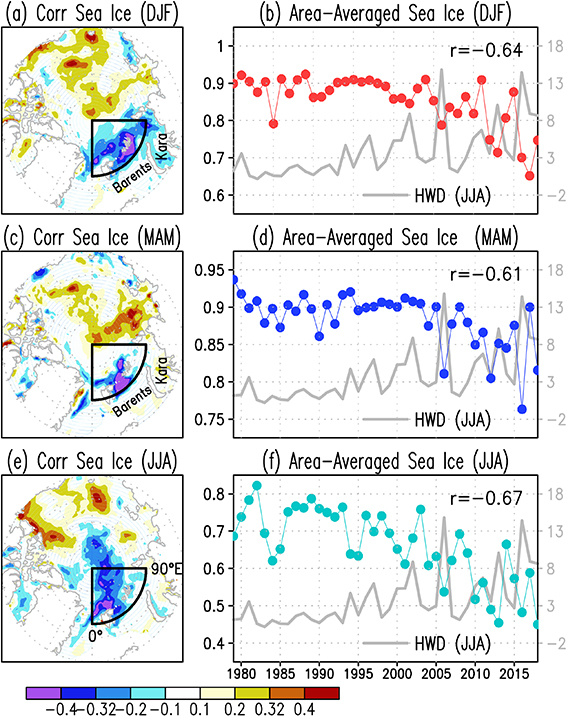
Figure 3. Left panels show correlations between JJA SWC HWD and sea ice cover for (a) preceding winter (December-January-February), (c) preceding spring (March-April-May), and (e) concurrent summer, where the linear trend in HWD has been removed. Right panels depict the variations of sea ice cover averaged over Arctic region (75°N–90°N and 0°–90°E), where the value of 1 (0) indicates the Arctic is fully covered by sea ice (no sea ice). The correlation coefficients between area-averaged sea ice and JJA HWD are plotted in the right panels.
Download figure:
Standard image High-resolution imageThe correlation between SWC HWD and Arctic sea ice during summer is as high as −0.67, which exceeds the 99% confidence level, implying that there could be physical bridges between them. Figure 4 depicts the lag regression maps of 200-hPa geopotential height and wave activity flux onto SWC HWD. As seen from figures 4(a) and (c), the occurrences of SWC summer HWs are significantly correlated with high pressure anomalies over the polar region and low pressure anomalies over the Barents Sea during the preceding winter and spring. In summer, significantly low (high) pressure anomalies appear over the Arctic (subarctic) regions (figure 4(e)). That is, anomalous losses of sea ice in Barents Sea and Kara Sea enables increased heat fluxes released into the atmosphere from the beneath ocean, resulting in higher air temperature and lower surface pressures. The establishment of abnormal low (high) pressures in Arctic (subarctic) is reminiscent of an intensified Arctic Oscillation (AO), whose correlation coefficient with SWC HWD during summer is 0.45 (trends removed), passing the 99% confidence level. (Yang et al 2016) have proposed that the Arctic lower-tropospheric warming due to the sea ice loss could lead to climate anomaly in China via atmospheric teleconnection. As seen from figures 4(b), (d) and (f), the SWC summer HWs are significantly correlated with anomalous wave trains in the troposphere over Eurasia, which propagate from northern Europe to East Asia, leading to anomalous high pressures over SWC.
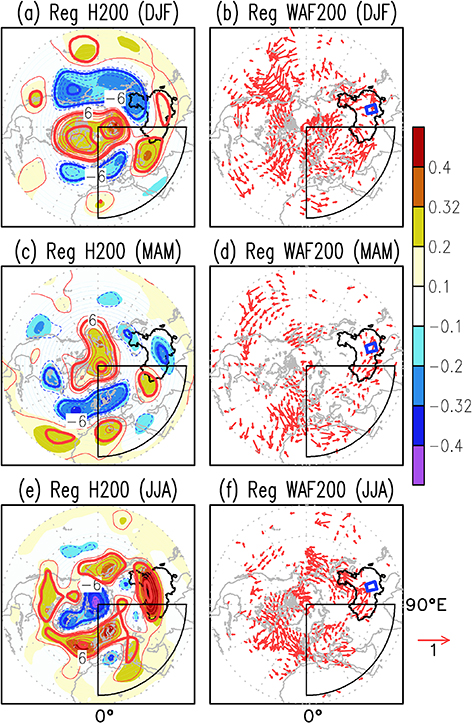
Figure 4. Left panels show the regressions (contour) of 200-hPa geopotential heights (unit: m) for (a) preceding winter, (c) preceding spring, and (e) concurrent summer onto SCW summer HWD, where shadings indicate the corresponding correlation coefficients. Right panels are similar to the left except for 200-hPa wave activity fluxes (unit: m2 s−2). The linear trends in the SWC summer HWD index and the field variables have been removed.
Download figure:
Standard image High-resolution imageTo substantiate the teleconnection mechanisms proposed, we further examine the model simulations forced by the present-day and pre-industrial sea ice. As seen from figure S1 (stacks.iop.org/ERL/15/074011/mmedia), compared to the pre-industrial period, the sea ice in the present-day period has reduced considerably in winter, spring, and summer. The reductions in sea ice mainly concentrate in the Barents Sea and Kara Sea during the winter and spring, which extend to the entire Artic regions during summer. As a result, due to the declining of Arctic sea ice, the atmospheric circulation has experienced remarkable changes. Under the forcing of decreased Arctic sea ice, anomalous Rossby wave trains were triggered during spring and summer, which seem to originate from the polar region and propagate toward East Asia, leading to anomalous high pressures over SWC. The model simulations further demonstrate that the SWC summer HWs are likely to be affected by the changes in Arctic sea ice.
3.3. Local physical processes for SWC summer HW
Finally, we investigate local physical processes responsible for SWC summer HWs. As seen from figure 5(a), correlated with SWC summer HWD, significantly high pressure anomalies appear over northern China, which is believed to be forced by the Arctic sea ice reductions, as mentioned above. The abnormally high pressures over northern China lead to the westward extension of the western North Pacific subtropical high, which significantly reduces the total cloud cover in SWC (figure 5(b)). Due to the decrease in total cloud cover, there would be more solar short-wave radiation reaching surface, leading to anomalous high T2 m (figure 5(c)). In addition, under the control of the western North Pacific subtropical high, anomalously descending air and divergent winds tend to exist over SWC, which suppress the local precipitation (figure 5(d)), leading to reduced soil water, weakened evaporative cooling effect, and increased sensible heat, which are conducive to the occurrence of HWs.

Figure 5. Regression maps of (a) 500-hPa geopotential height (shading, H500, unit: m), (b) Total cloud cover (unit: %), (c) T2 m (unit: °C), (d) precipitation rate (unit: mm/day), (e) 200-hPa zonal wind (shading, U200, unit: m s−1), and (f) Vertical integrals of water vapor flux (unit: kg m−1 s−1) onto the detrended SWC summer HWD. Contours in (a) and (e) respectively indicate the climatological locations of western North Pacific subtropical high and East Asian westerly jet stream. Shadings in (f) denote the divergences of vertical integrals of water vapor fluxes (unit: 10–6 kg m−2 s−1). Regions stippled and vectors thickened indicate the anomalies exceeding 95% confidence levels. The linear trends in the SWC summer HWD index and the field variables have been removed.
Download figure:
Standard image High-resolution image
Moreover, as shown in figure 5(e), the atmospheric circulation anomalies over northern China also cause a northward shift of the East Asian summer westerly jet stream, which is consistent with previous studies (e.g. Lin and Lu 2008). Lin (2013) has further noted that the northward jumps of the East Asian upper-tropospheric jet stream could lead to increased precipitation in North China and decreased precipitation in lower latitudes, which is due to the enhanced (reduced) moisture convergence in North China (lower latitudes). Indeed, as shown in figure 5(f), the poleward shift of the East Asian westerly jet stream is featured by the significant reductions of rainfall in SWC. The decreased precipitation as well as the longer insolation could ultimately increase the probability of SWC HWs.
4. Conclusion
This study has investigated the climatology, linear trends, and year-to-year variability of SWC summer HW day (HWD). It is found that SWC has experienced more frequent HWs in recent summers, which is suggested to be linked to the recent declining of Arctic sea ice. The losses of Artic sea ice can induce southeastward propagating Rossby wave trains over Eurasia and result in a significant anticyclonic circulation anomaly over SWC. As a result, on the one hand, the western North Pacific subtropical high moves westward, which is accompanied by divergent winds in lower troposphere, decreased total cloud cover, and increased insolation, leading to above-normal air temperatures in SWC. On the other hand, the East Asian summer westerly jet stream jumps northward, which causes increased (decreased) moisture convergence in North China (lower latitudes) and leads to drier surface in SWC. Ultimately, the favorable atmospheric circulation and surface conditions result in the increases in the probability of SWC summer HW.
Acknowledgments
K Q Deng and X W Jiang were supported by the Sichuan Science and Technology Program (Grant No. 2018JY0030). C D Hu was supported by the National Natural Science Foundation of China (Grant No. 41975077). D Chen was supported by the Swedish SNIC/NSC, MERGE and STINT.
Data availability statement
The datasets analyzed during the current study are openly available in the ERA-5 repository of European Centre for Medium-Range Weather Forecasts (https://doi.org/10.24381/cds.6860a573).