Pollen Production of Quercus in the North-Western Iberian Peninsula and Airborne Pollen Concentration Trends during the Last 27 Years

 , ,
, ,
Abstract
:1. Introduction
1.1. Background
1.2. Quercus Ecology
1.3. Impact on Human Health
1.4. Goal of the Study
2. Materials and Methods
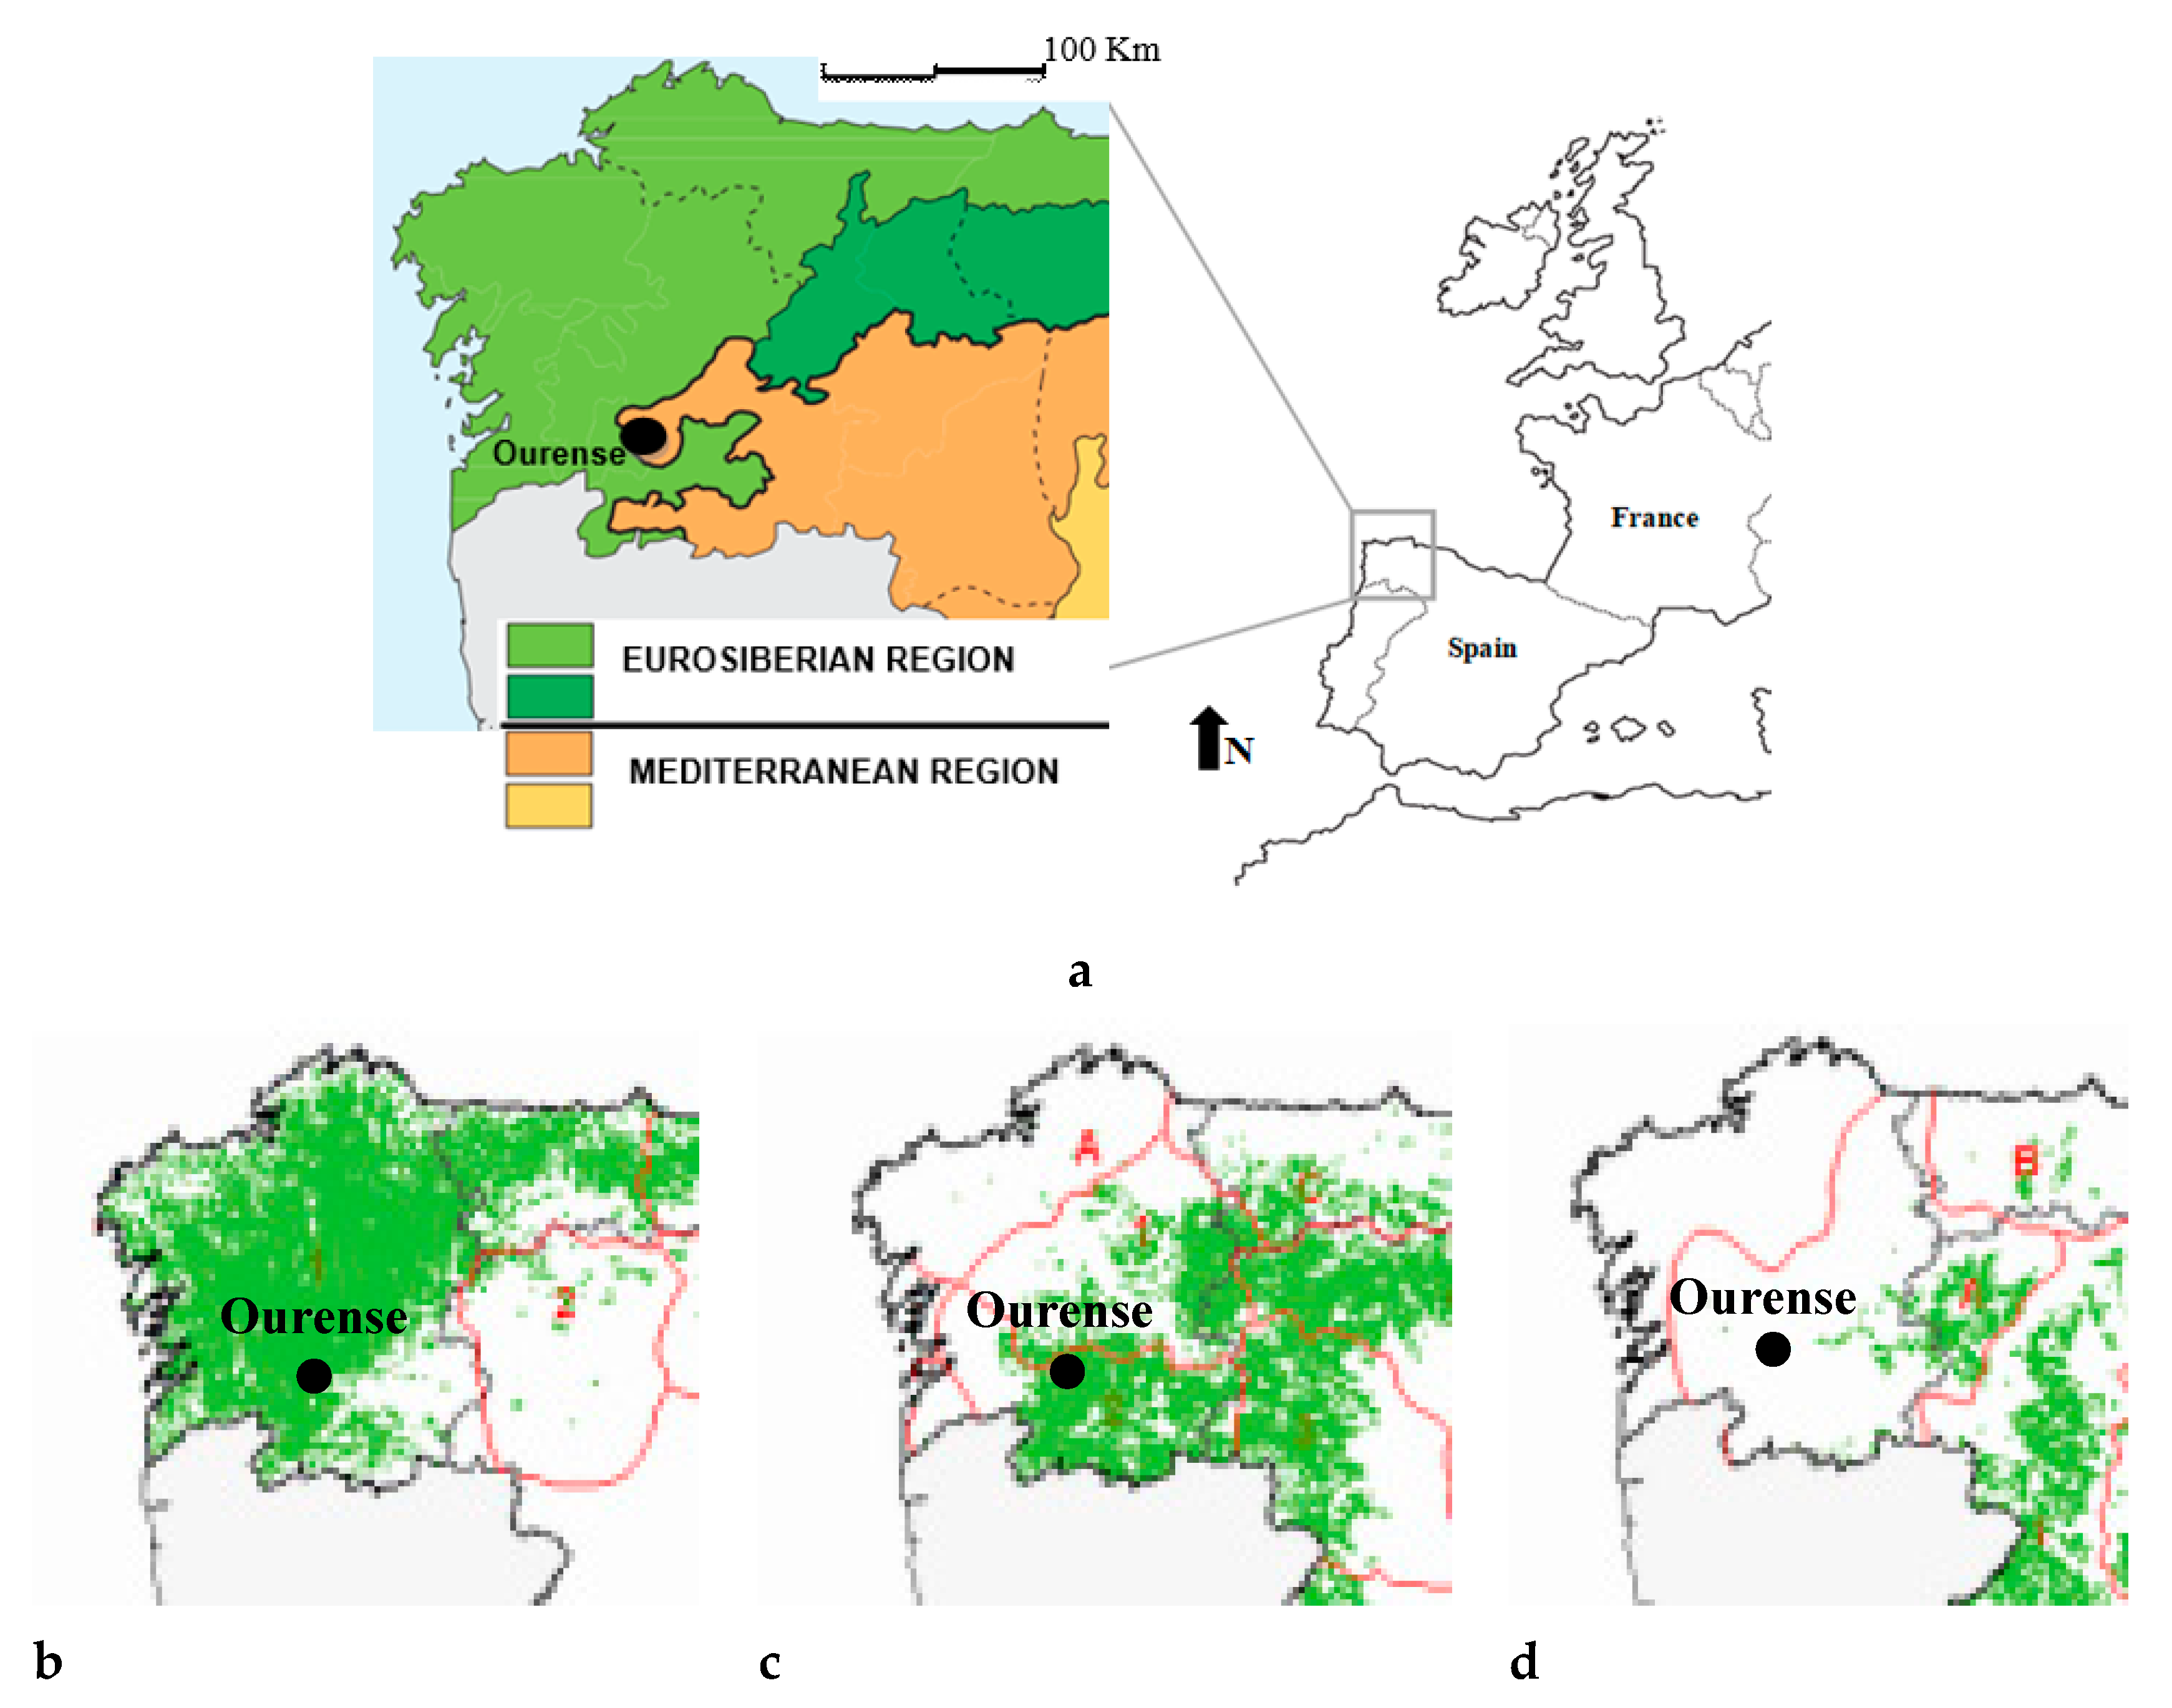
2.1. Location and Classification of the Study Area
2.2. Pollen Production Study
2.3. Airborne Pollen Study
2.4. Meteorological Data and Statistical Analysis
3. Results
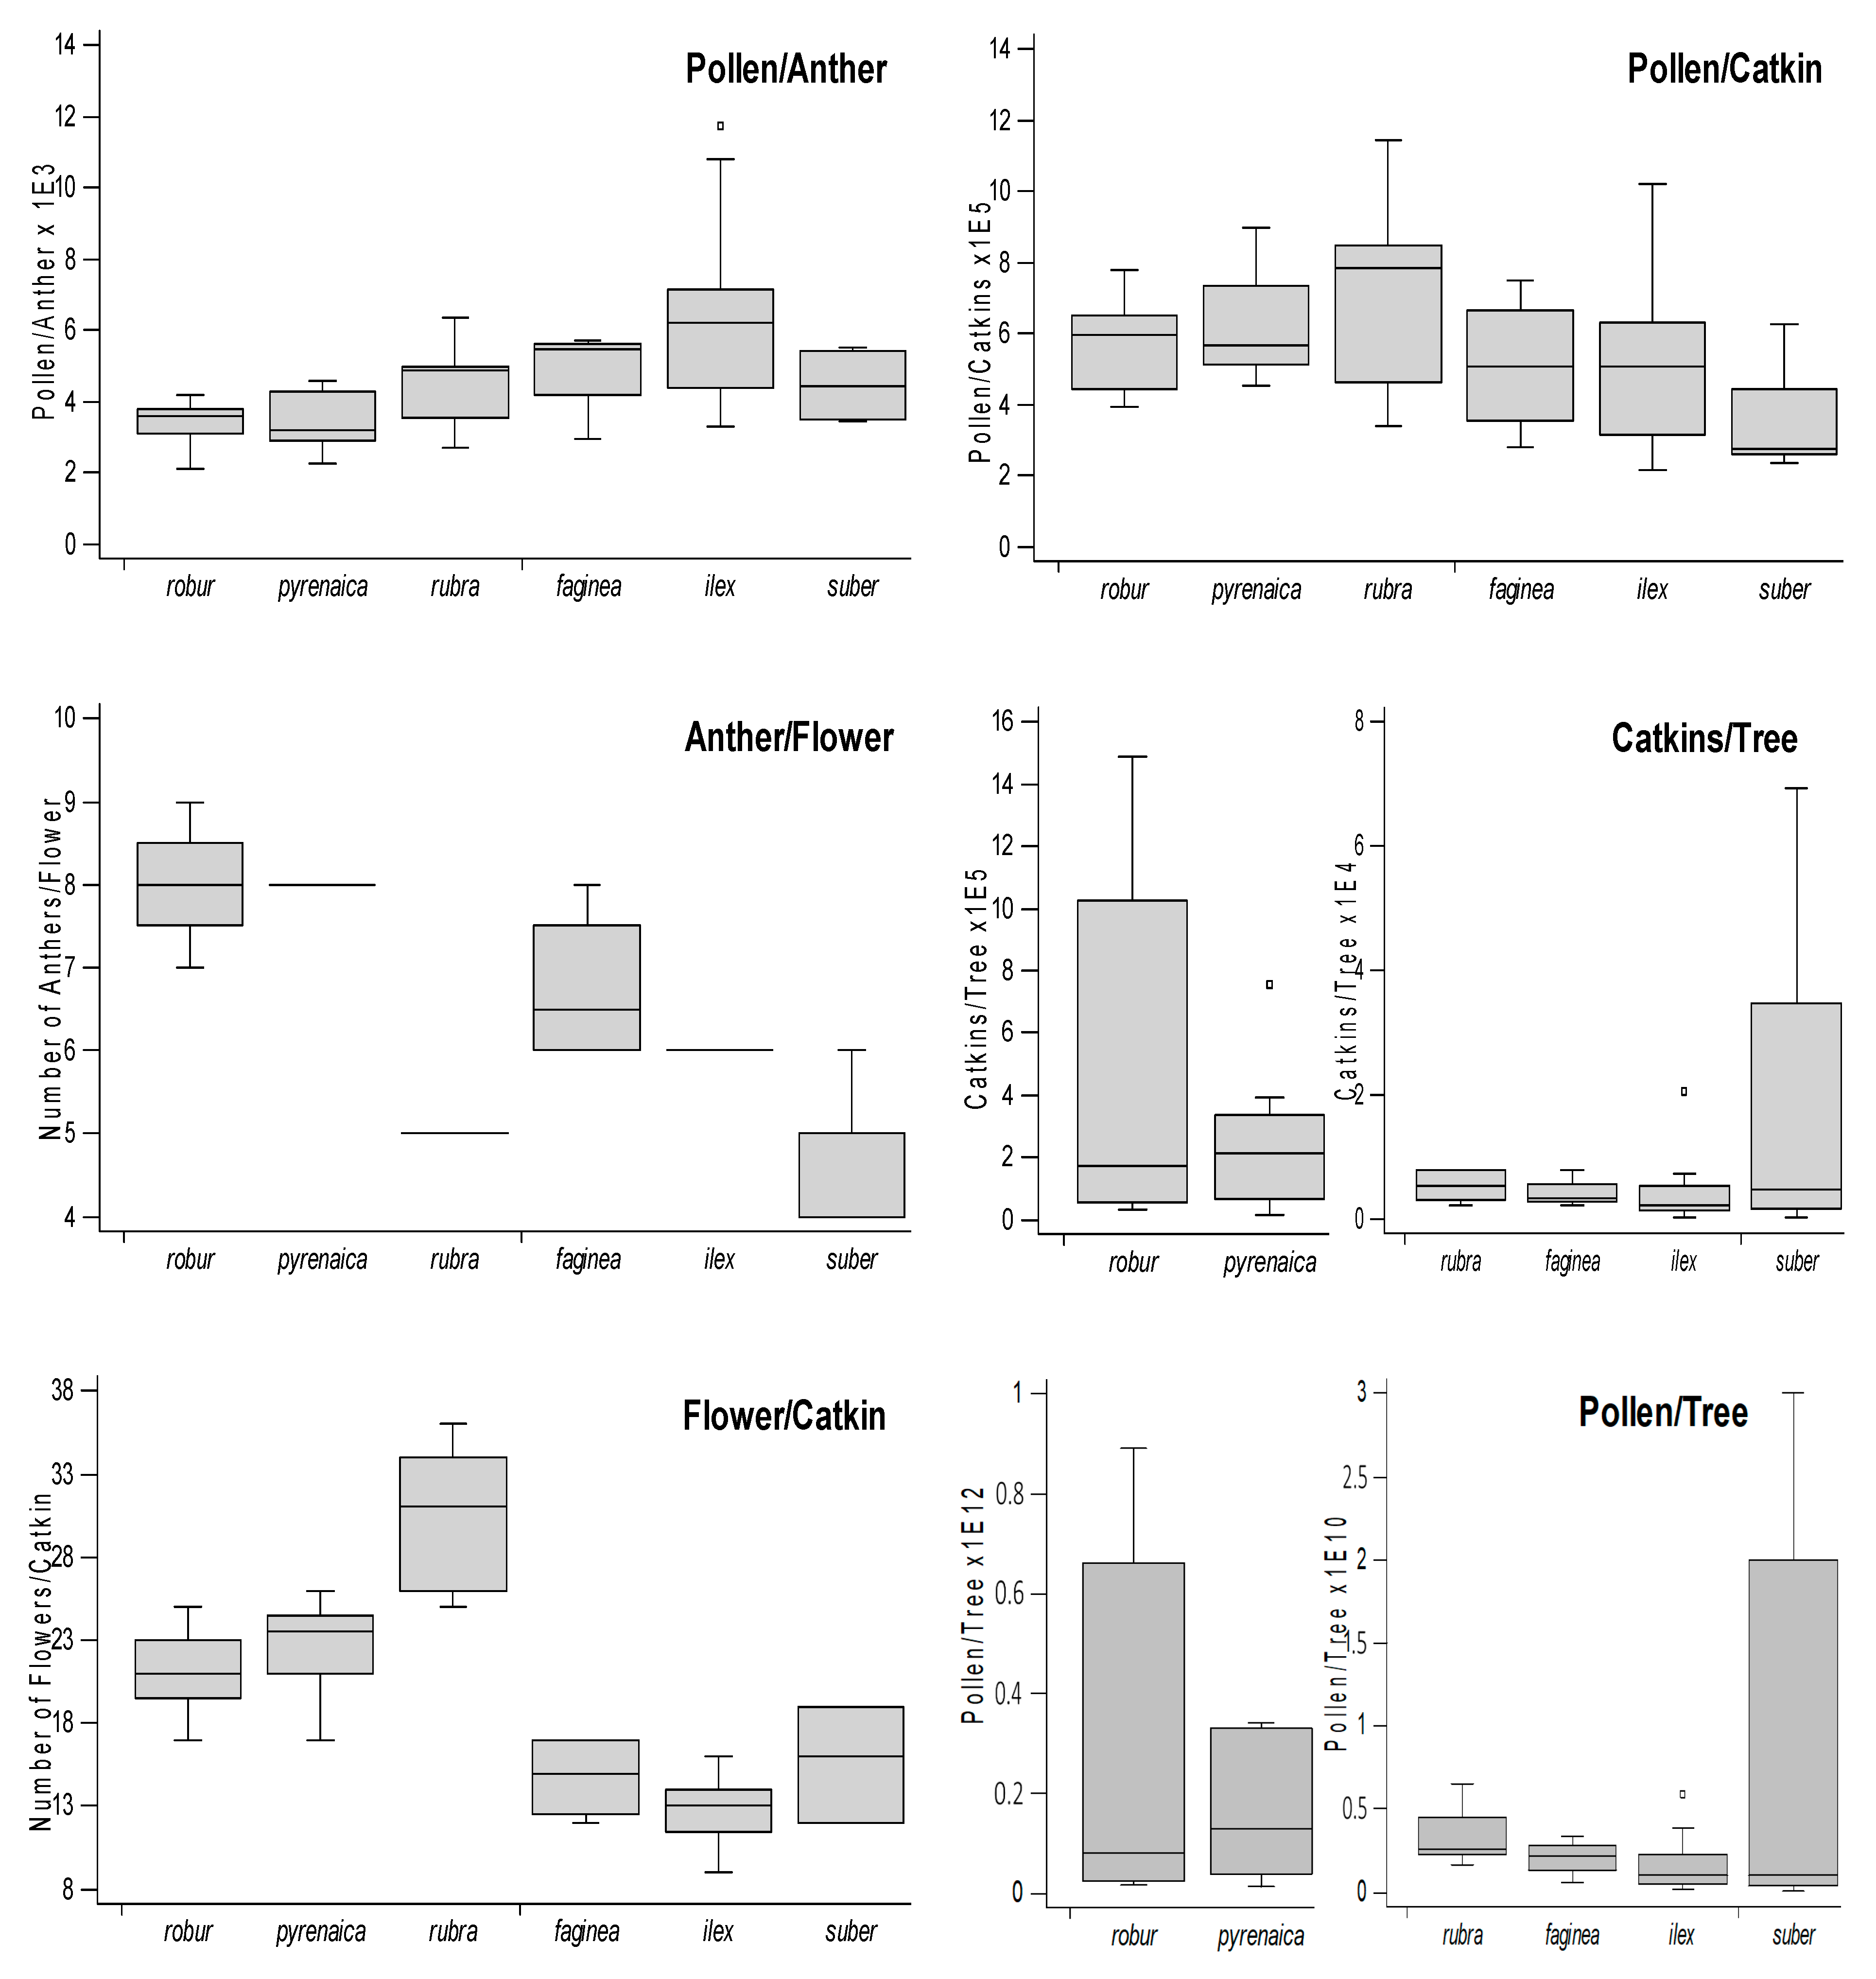
3.1. Pollen Production Study
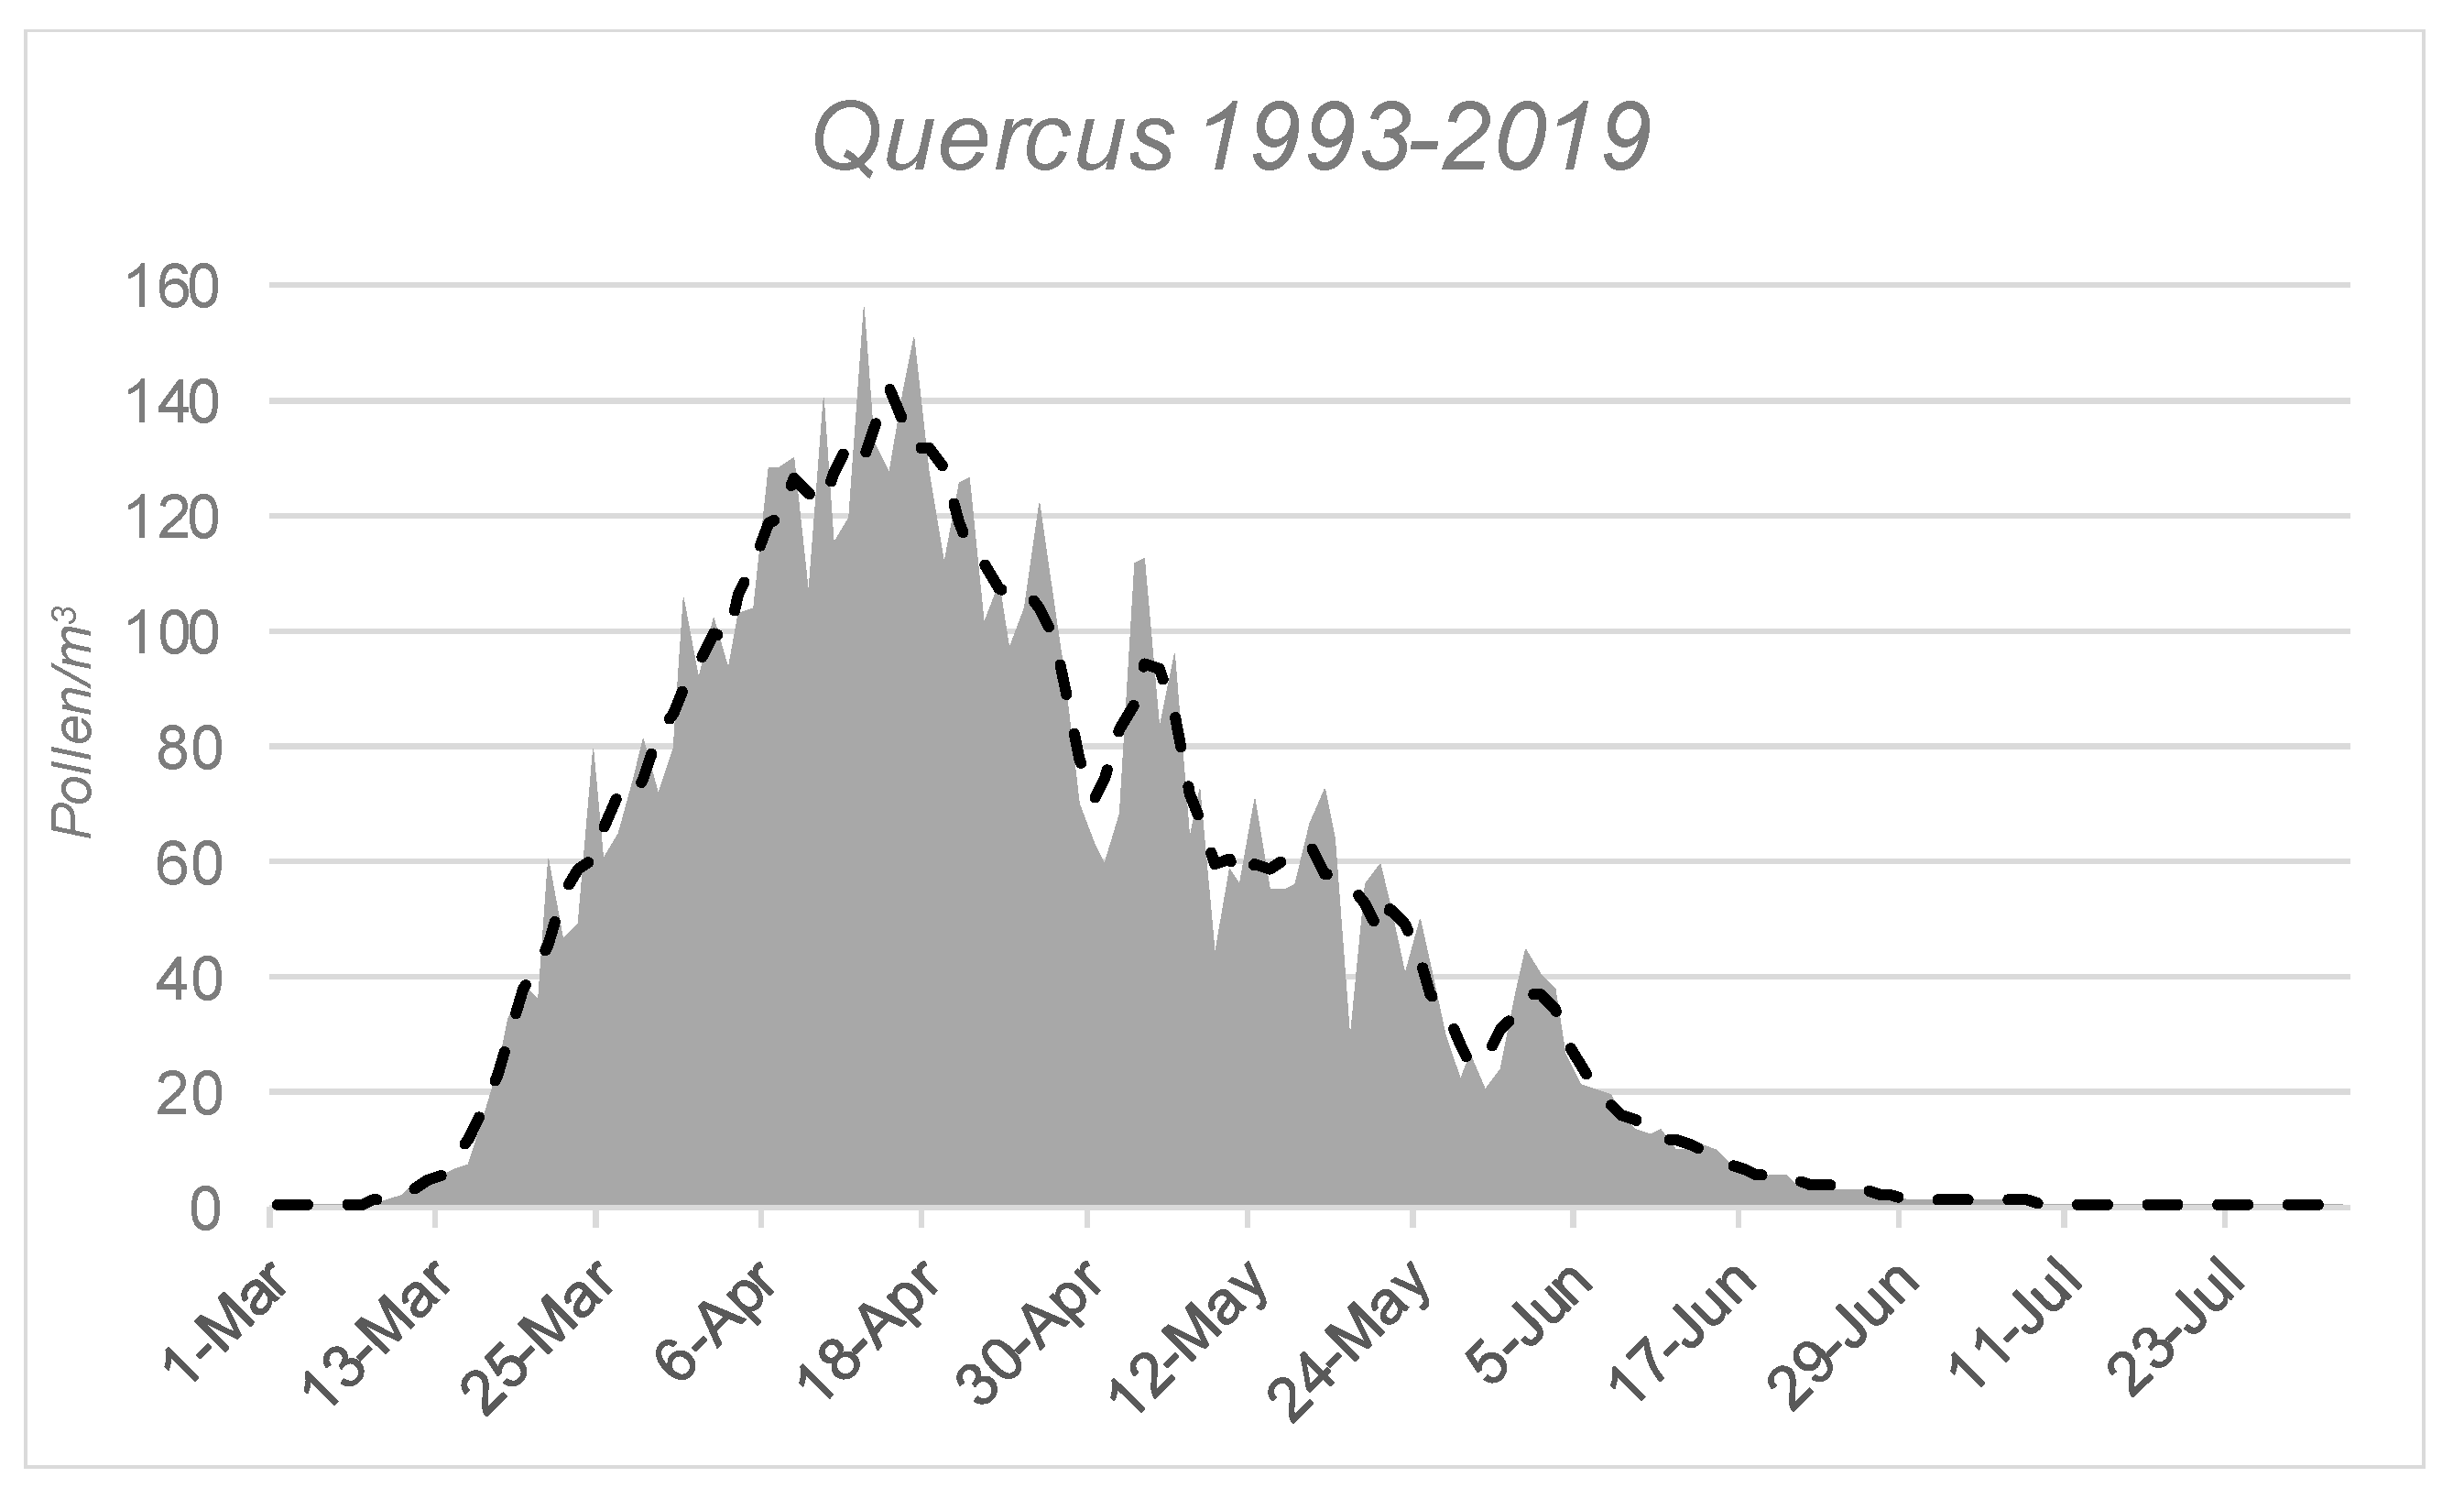
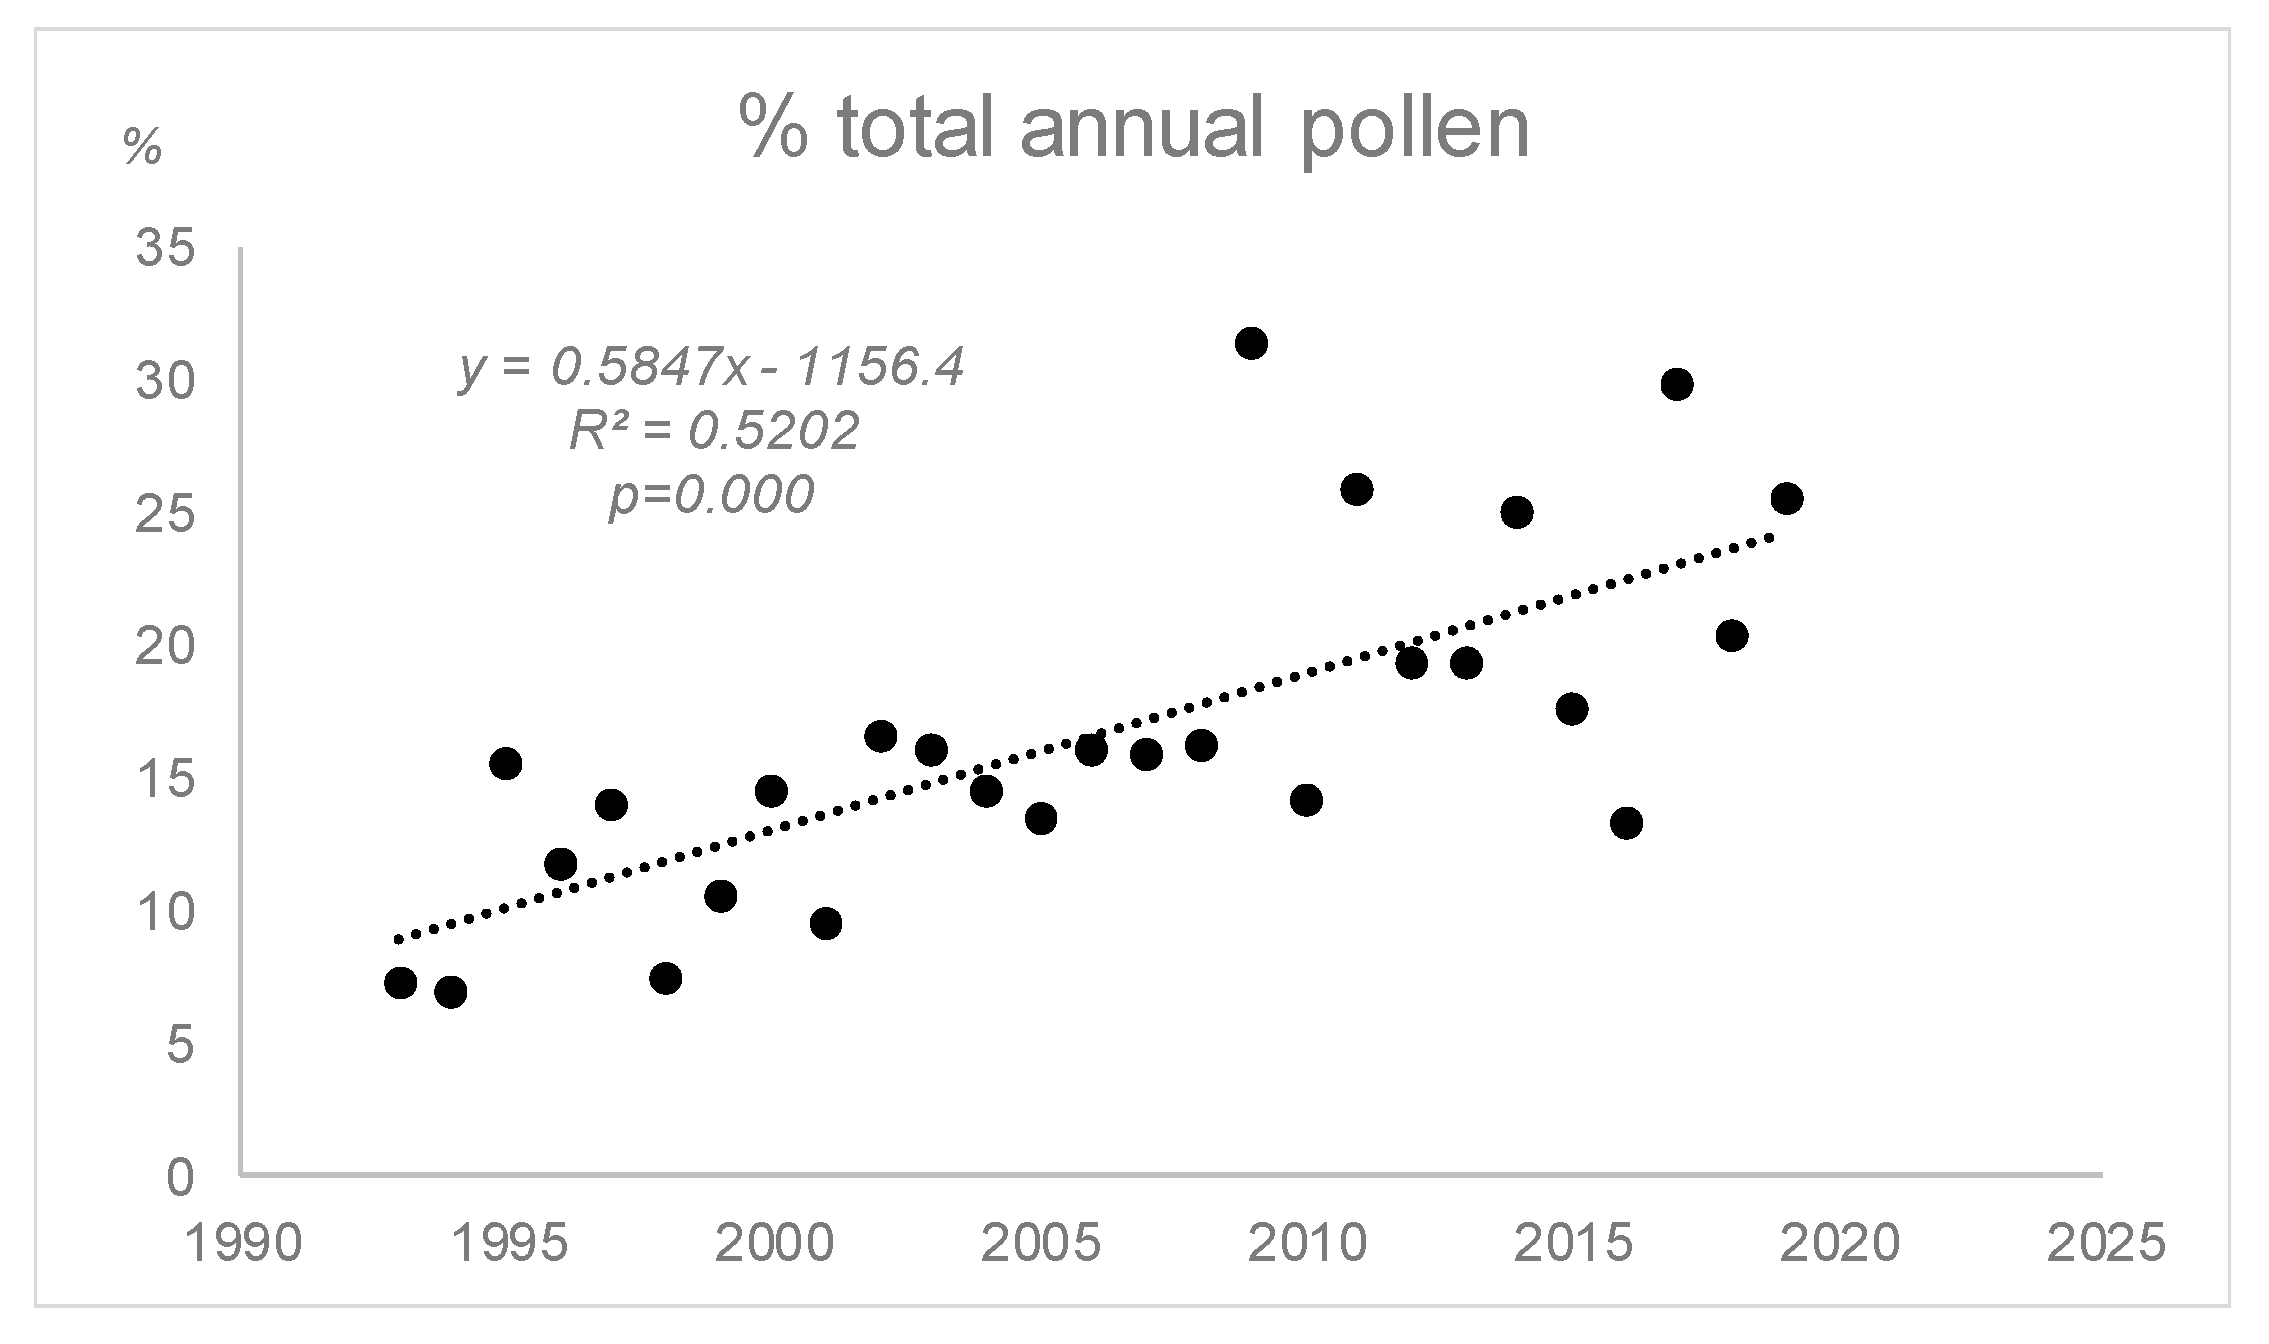
3.2. Airborne Pollen Study
4. Discussion
5. Conclusions
Author Contributions
Funding
Acknowledgments
Conflicts of Interest
References
- Garcia-Mozo, H.; Galán, C.; Jato, V.; Belmonte, J.; Díaz de la Guardia, C.; Fernández-González, D.; Gutiérrez-Bustillo, A.M.; Aira, M.J.; Roure, J.; Ruiz, L.; et al. Quercus pollen season dynamics in the Iberian Peninsula: Response to meteorological parameters and possible consequences of climate change. Ann. Agric. Environ. Med. 2006, 3, 209–224. [Google Scholar]
- Rodríguez-Rajo, F.J.; Méndez, J.; Jato, V. Factors affecting pollination ecology of Quercus anemophilous species in north-west Spain. Bot. J. Linn. Soc. 2005, 149, 283–297. [Google Scholar] [CrossRef]
- Jato, V.; Rodríguez-Rajo, F.J.; Aira, M.V. Use of Quercus ilex subsp: Ballota phen ological and pollen-production data for interpreting Quercus pollen curves. Aerobiologia 2007, 23, 91–105. [Google Scholar] [CrossRef]
- Recio, M.; Picornell, A.; Trigo, M.M.; Gharbia, D.; García-Sánchez, J.; Cabezudo, B. Intensity and temporality of airborne Quercus pollen in the southwest Mediterranean area: Correlation with meteorological and phenoclimatic variables, trends and possible adaptation to climate change. Agric. Forest Meteorol. 2018, 250, 308–318. [Google Scholar] [CrossRef]
- Wang, W.; Chen, X.; Zeng, W.; Wang, J.; Meng, J. Development of a mixed-effects individual-tree basal area increment model for oaks (Quercus spp.) considering forest structural diversity. Forests 2019, 10, 474. [Google Scholar] [CrossRef] [Green Version]
- Cecich, R.A.; Sullivan, N.H. Influence of Weather at Time of Pollination on Acorn Production of Quercus alba and Quercus velutina. Can. J. For. Res. 1999, 29, 1817–1823. [Google Scholar] [CrossRef]
- Garcia-Mozo, H.; Galán, C.; Aira, M.J.; Belmonte, J.; Díaz de la Guardia, C.; Fernández-González, D.; Gutiérrez-Bustillo, A.M.; Rodríguez-Rajo, F.J.; Trigo, M.M.; Domínguez-Vilches, E. Modelling start oak pollen season in different climatic zones in Spain. Agric. For. Meteorol. 2002, 110, 247–257. [Google Scholar] [CrossRef]
- Anić, M.; Ostrogović Sever, M.Z.; Alberti, G.; Balenović, I.; Paladinić, E.; Peressotti, A.; Tijan, G.; Večenaj, Ž.; Vuletić, D.; Marjanović, H. Eddy Covariance vs. Biometric Based Estimates of Net Primary Productivity of Pedunculate Oak (Quercus robur L.) Forest in Croatia during Ten Years. Forests 2018, 9, 764. [Google Scholar] [CrossRef] [Green Version]
- IPPC. AR6 Climate Change 2021: Impacts, Adaptation and Vulnerability. 2020. Available online: https://www.ipcc.ch/report/sixth-assessment-report-working-group-ii/ (accessed on 10 May 2020).
- Galán, C.; Alcázar, P.; Oteros, J.; García-Mozo, H.; Aira, M.J.; Belmonte, J.; Díaz de la Guardia, C.; Fernández-González, D.; Gutiérrez-Bustillo, A.M.; Moreno-Grau, S.; et al. Airborne pollen trends in the Iberian Peninsula. Sci. Total Environ. 2016, 550, 53–59. [Google Scholar] [CrossRef]
- Gómez-Casero, M.T.; Hidalgo, P.J.; García-Mozo, H.; Domínguez, E.; Galán, C. Pollen biology in four Mediterranean Quercus species. Grana 2004, 43, 22–30. [Google Scholar] [CrossRef] [Green Version]
- Ruiz-Valenzuela, L.; Aguilera, F. Trends in airborne pollen and pollen-season-related features of anemophilous species in Jaen (south Spain): A 23-year perspective. Atmos. Environ. 2018, 80, 234–243. [Google Scholar] [CrossRef]
- Greenfield, L. Plant pollen production in selected tree species. Canterb. Bot. Soc. J. 1996, 31, 10–13. [Google Scholar]
- Shumilovskikh, L.S.; Schlütz, F.; Achterberg, I.; Kvitkina, A.; Bauerochse, A.; Leuschner, H.H. Pollen as nutrient source in Holocene ombrotrophic bogs. Rev. Palaeobot. Palynol. 2015, 221, 171–178. [Google Scholar] [CrossRef]
- Masclaux, H.; Perga, M.E.; Kagami, M.; Desvilettes, C.; Bourdier, G.; Bec, A. How pollen organic matter enters fresh water food webs. Limnol. Oceanogr. 2013, 58, 1185–1195. [Google Scholar] [CrossRef]
- Filipiak, M. Pollen Stoichiometry May Influence Detrital Terrestrial and Aquatic Food Webs. Front. Ecol. Evol. 2016, 4, 138. [Google Scholar] [CrossRef] [Green Version]
- Rösel, S.; Rychła, A.; Wurzbacher, C.; Grossart, H. Effects of pollen leaching and microbial degradation on organic carbon and nutrient availability in lake water. Aquat. Sci. 2012, 74, 87–99. [Google Scholar] [CrossRef]
- Pérez-Badia, R.; Bouso, V.; Rojo, J.; Vaquero, C.; Sabariego, S. Dynamics and behaviour of airborne Quercus pollen in central Iberian Peninsula. Aerobiologia 2013, 29, 419–428. [Google Scholar] [CrossRef]
- Rivas Martínez, S. Memoria del Mapa de Series de Vegetación de España; ICONA Serie Técnica; Ministerio Agricultura, Pesca y Alimentación: Madrid, Spain, 1983.
- Costa, M.; Morla, C.; Sainz, H. Los Bosques Ibéricos; Planeta: Barcelona, Spain, 1998; pp. 1–597. [Google Scholar]
- Butland, B.K.; Strachan, S.; Bynner, J.; Butler, N.; Britton, J. Investigation into the increase of hay fever and eczema at age 16 observed between the 1958 and 1970 British birth cohorts. Br. Med. J. 1997, 315, 717–721. [Google Scholar] [CrossRef] [Green Version]
- Ianovici, N.; Juhasz, N.; Kofol-Seliger, A.; Sikoparija, B. Comparative Analysis of some Vernal Pollen Concentrations in Timisoara (Romania), Szeged (Hungary), Novi Sad (Serbia) and Ljubljana (Slovenia). Not. Bot. Hort. Agrobot. Cluj 2009, 37, 49–56. [Google Scholar]
- Moore, P.P.; Webb, J.A. An Illustrated Guide to Pollen Analysis, 2nd ed.; Blackwell Science Publications: Oxford, UK, 1983. [Google Scholar]
- Tormo, R.; Muñóz, A.; Silva, I.; Gallardo, F. Pollen production in anemophilous trees. Grana 1996, 35, 38–46. [Google Scholar]
- Ickovic, M.; Thibaudon, M. Allergenic significance of Fagaceae pollen. In Allergenic Pollen and Pollinosis in Europe; D’Amato, G., Spieksma, F.T.H., Bonini, S., Eds.; Blackwell Scientific Publications: Oxford, UK, 1991. [Google Scholar]
- Vara, A.; Fernández-González, M.; Aira, M.J.; Rodríguez-Rajo, F.J. Oleaceae cross reactions as potential pollinosis cause in urban areas. Sci. Total Environ. 2016, 542, 435–440. [Google Scholar] [CrossRef] [PubMed]
- Belmonte, J.; Roure, J.M.; March, X. Aerobiology of Vigo, North-Western Spain: Atmospheric pollen spectrum and annual dynamics of the most important taxa, and their clinical importance for allergy. Aerobiologia 1998, 14, 155–163. [Google Scholar] [CrossRef]
- Ferreiro, M.; Dopazo, A.; Aira, M.J. Incidence of pollinosis in the city of A Coruña: Correlation with aerobiological data. J. Investig. Allergol. Clin. Immunol. 2002, 12, 124–129. [Google Scholar] [PubMed]
- Kim, I.; Kwak, M.J.; Lee, J.K.; Lim, Y.; Park, S.; Kim, H.; Lee, K.; Woo, S.Y. Flowering Phenology and Characteristics of Pollen Aeroparticles of Quercus Species in Korea. Forests 2020, 11, 232. [Google Scholar] [CrossRef] [Green Version]
- Martínez-Cortizas, A.; Pérez Alberti, A. Atlas Climático de Galicia; Xunta de Galicia: A Coruña, Spain, 1999; pp. 1–207. [Google Scholar]
- Xunta Galicia. Primera Revisión del plan Forestal de Galicia: Documento de Diagnóstico del Monte y el Sector Forestal Gallego. Xunta de Galicia, 2018. Available online: https://distritoforestal.es/images/DIAGNOSTICO_PFG_CAST_1.pdf (accessed on 12 May 2020).
- Cruden, R.W. Pollen-ovule ratios: A conservative indicator of breeding systems in flowering plants. Evolution 1977, 31, 32–46. [Google Scholar] [CrossRef]
- Hidalgo, P.J.; Galán, C.; Domínguez, E. Pollen production of the genus Cupressus. Grana 1999, 38, 1–5. [Google Scholar] [CrossRef] [Green Version]
- Hirst, J.M. An automatic volumetric spore trap. Ann. Appl. Biol. 1952, 39, 257–265. [Google Scholar] [CrossRef]
- Galán, C.; Cariñanos, P.; Alcázar, P.; Domínguez-Vilches, E. Spanish Aerobiology Network (REA): Management and Quality Manual; Servicio de Publicaciones de la Universidad de Córdoba: Córdoba, Spain, 2007. [Google Scholar]
- Andersen, T.B. A model to predict the beginning of the pollen season. Grana 1991, 30, 269–275. [Google Scholar] [CrossRef] [Green Version]
- Subba Reddi, C.; Reddi, N.S. Pollen Production in some anemophilous angiosperms. Grana 1986, 25, 55–61. [Google Scholar] [CrossRef] [Green Version]
- Jato, V.; Rodríguez-Rajo, F.J.; Aira, M.V. Use of phenological and pollen-production data for interpreting atmospheric birch pollen curves. Ann. Agric. Environ. Med. 2007, 2, 271–280. [Google Scholar]
- Batos, B.; Miljković, D. Pollen viability in Quercus robur L. Arch. Biol. Sci. 2017, 69, 111–117. [Google Scholar] [CrossRef]
- Walther, G.R.; Post, E.; Convey, P.; Menzel, A.; Parmesan, C.; BeeBee, T.J.C.; Fromentin, J.M.; Hoegh-Guldberg, O.; Bairlein, F. Ecological responses to recent climate change. Nature 2002, 416, 389–395. [Google Scholar] [CrossRef] [PubMed]
- Scheifinger, H.; Belmonte, J.; Buters, J.; Celenk, S.; Damialis, A.; Dechamp, C.; deWeger, A. Monitoring, Modelling and Forecasting of the Pollen Season. Allergenic Pollen; Springer: Dordrecht, The Netherlands, 2013; pp. 71–126. [Google Scholar]
- Garcia-Mozo, H.; Oteros, J.; Galán, C. Impact of land cover changes and climate on the main airborne pollen types in Southern Spain. Sci. Total Environ. 2016, 548–549, 221–228. [Google Scholar] [CrossRef] [PubMed]
- Hidalgo, P.; Galán, P.; Domínguez, E. Male phenology of three species of Cupressus: Correlation with airborne pollen. Trees 2003, 17, 336–344. [Google Scholar] [CrossRef]
- Jato, V.; Rodríguez-Rajo, F.J.; Méndez, J.; Aira, M.J. Phenological behaviour of Quercus in Ourense (NW Spain) and its relationship with the atmospheric pollen season. Int. J. Biometeorol. 2002, 46, 176–184. [Google Scholar]
- Foley, J.A.; DeFries, R.; Asner, G.P.; Barford, C.; Bonan, G.; Carpenter, S.R.; Snyder, P.K. Global consequences of land use. Science 2005, 309, 570–574. [Google Scholar] [CrossRef] [Green Version]
- Rojo, J.; Rapp, A.; Lara, B.; Fernández-González, F.; Pérez-Badia, R. Effect of land uses and wind direction on the contribution of local sources to airborne pollen. Sci. Total Environ. 2015, 538, 672–682. [Google Scholar] [CrossRef]
- Campbell, I.D.; McDonald, K.; Flannigan, M.D.; Kringayark, J. Long-distance transport of pollen into the Arctic. Nature 1999, 399, 29–30. [Google Scholar] [CrossRef]
- Kasuya, N.; Hayashi, R.; Saito, H. Pollen Production of Mature Quercus gilva in Southern Kyoto. Jpn. J. Palynol. 2002, 48, 71–83. [Google Scholar]
- Donkersley, P. Trees for bees. Agric. Ecosyst. Environ. 2019, 270–271, 79–83. [Google Scholar] [CrossRef]
- Filipiak, M. Key pollen host plants provide balanced diets for wild bee larvae: A lesson for planting flower strips and hedgerows. J. Appl. Ecol. 2019, 56, 1410–1418. [Google Scholar] [CrossRef]
- Filipiak, M. A Better Understanding of Bee Nutritional Ecology Is Needed to Optimize Conservation Strategies for Wild Bees—The Application of Ecological Stoichiometry. Insects 2018, 9, 85. [Google Scholar] [CrossRef] [PubMed] [Green Version]
- Majeed, H.T.; Periago, C.; Alarcón, M.; Belmonte, J. Airborne pollen parameters and their relationship with meteorological variables in NE Iberian Peninsula. Aerobiologia 2018, 34, 375–388. [Google Scholar] [CrossRef] [Green Version]
- Tavira, J.; Tormo, R.; Silva, I.; Muñoz, A. Aerobiología en Extremadura: Estación de Cáceres (1996). Rea 1998, 3, 69–72. [Google Scholar]
- Martínez-Bracero, M.; Alcázar, P.; Velasco-Jiménez, M.J.; Galán, C. Effect of the Mediterranean crops in the airborne pollen spectrum. Aerobiologia 2019, 35, 647–657. [Google Scholar] [CrossRef]
- Andersen, S.T. Influence of climatic variation on pollen season severity in wind-pollinated trees and herbs. Grana 1980, 19, 47–52. [Google Scholar] [CrossRef]
- García-Mozo, H.; Galán, C.; Cariñanos, P.; Alcazar, P.; Mémdez, J.; Vendrell, M.; Alba, F.; Sáenz, C.; Fernández, D.; Cabezudo, B.; et al. Variations in the Quercus sp. Pollen season at selected sites in Spain. Polen 1999, 10, 59–69. [Google Scholar]
- De Frutos, M. Tumores Vegetales de España; Consejo Superior de Investigaciones Científicas: Madrid, Spain, 1986. [Google Scholar]
- De Linares, C.; Delgado, R.; Aira, M.J.; Alcázar, P.; Alonso-Pérez, S.; Boi, M.; Cariñanos, P.; Cuevas, E.; Díaz de la Guardia, C.; Elvira-Rendueles, B.; et al. Changes in the Mediterranean pine forest: Pollination patterns and annual trends of airborne pollen. Aerobiologia 2017, 33, 375–391. [Google Scholar] [CrossRef]
- Orlandi, F.; García-Mozo, H.; Galán, C.; Romano, B.; Díaz de la Guardia, C.; Ruiz, L. Olive flowering trends in a large Mediterranean area (Italy and Spain). Int. J. Biometeorol. 2010, 54, 151–163. [Google Scholar] [CrossRef]
- Bertin, R.I. Plant phenology and distribution in relation to recent climate change. J. Torrey Bot. Soc. 2008, 135, 126–146. [Google Scholar] [CrossRef] [Green Version]
- Sparks, T.H.; Jeffree, E.P.; Jeffree, C.E. An examination of the relationship between fowering times and temperature at the national scale using long-term phenological records from the UK. Int. J. Biometeorol. 2000, 44, 82–87. [Google Scholar] [CrossRef] [PubMed]
- Makra, L.; Matyasovszky, I.; Deák, A.J. Trends in the characteristics of allergenic pollen circulation in central Europe based on the example of Szeged, Hungary. Atmos. Environ. 2011, 45, 6010–6018. [Google Scholar] [CrossRef]
- Damialis, A.; Halley, J.M.; Gioulekas, D.; Vokou, D. Long-term trends in atmospheric pollen levels in the city of Thessaloniki, Greece. Atmos. Environ. 2007, 41, 7011–7021. [Google Scholar] [CrossRef]
- Ziello, C.; Sparks, T.H.; Estella, N.; Belmonte, J.; Bergmann, K.; Bucher, E.; Brighetti, M.; Damialis, A.; Detandt, M.; Galán, C.; et al. Changes to airborne pollen counts across Europe. PLoS ONE 2012, 7, e34076. [Google Scholar] [CrossRef] [PubMed]
- Frei, T.; Gassner, E. Climate change and its impact on birch pollen quantities and the start of the pollen season an example from Switzerland for the period 1969–2006. Int. J. Biometeorol. 2008, 52, 667–674. [Google Scholar] [CrossRef] [PubMed]
- Jato, V.; Rodríguez-Rajo, F.J.; Fernández-González, M.; Aira, M.V. Assessment of Quercus flowering trends in NW Spain. Int. J. Biometeorol. 2014, 59, 517–531. [Google Scholar] [CrossRef] [PubMed]
- Rogers, C.A.; Wayne, P.M.; Macklin, E.A.; Muilenberg, M.L.; Wagner, C.J.; Epstein, P.R.; Bazzaz, F.A. Interaction of the onset of spring and elevated atmospheric CO2 on ragweed (Ambrosia artemisiifolia L.) pollen production. Environ. Health Perspect. 2006, 114, 865–869. [Google Scholar] [CrossRef] [Green Version]


| Pollen/ Anther | Anther/ Flower | Flowers/ Catkin | Pollen/ Catkin | Catkins/ Tree | Pollen/ Tree ×109 | |
|---|---|---|---|---|---|---|
| Q. robur | 3400 | 8 | 21 | 569,803 | 667,231 | 435 |
| Min | 2093 | 7 | 17 | 394,396 | 29,250 | 16 |
| Max | 4192 | 9 | 25 | 777,555 | 2,808,000 | 1937 |
| SD | 651 | 1 | 2 | 132,992 | 995,721 | 679 |
| RSD% | 19.1 | 9.6 | 11.7 | 23.3 | 149.2 | 155.9 |
| Q. pyrenaica | 3457 | 8 | 23 | 623,494 | 249,716 | 142 |
| Min | 2280 | 8 | 17 | 451,656 | 13,905 | 12 |
| Max | 4596 | 8 | 26 | 897,539 | 752,123 | 339 |
| SD | 847 | 0 | 3 | 159,916 | 241,522 | 127 |
| RSD% | 24.5 | 0.0 | 12.4 | 25.6 | 96.7 | 89.4 |
| Q. rubra | 4515 | 5 | 31 | 716,385 | 5021 | 3 |
| Min | 2707 | 5 | 25 | 339,036 | 2160 | 1 |
| Max | 6333 | 5 | 36 | 1,144,272 | 7700 | 6 |
| SD | 1169 | 0 | 4 | 264,479 | 2195 | 1 |
| RSD% | 25.9 | 0.0 | 13.1 | 36.9 | 43.7 | 49.5 |
| Q. faginea | 4891 | 7 | 15 | 511,301 | 4128 | 2 |
| Min | 2943 | 6 | 12 | 279,173 | 2160 | 0.603 |
| Max | 5703 | 8 | 17 | 749,139 | 7700 | 3 |
| SD | 1304 | 1 | 3 | 201,767 | 2448 | 1 |
| RSD% | 26.7 | 15.5 | 17.5 | 39.5 | 59.3 | 54.1 |
| Q. ilex | 6282 | 6 | 13 | 512,987 | 3770 | 1 |
| Min | 3280 | 6 | 9 | 215,253 | 288 | 0.175 |
| Max | 11,733 | 6 | 16 | 1,020,513 | 20,400 | 5 |
| SD | 2414 | 0 | 2 | 216,750 | 4914 | 1 |
| RSD% | 38.4 | 0.0 | 14.1 | 42.3 | 130.3 | 100.2 |
| Q. suber | 4536 | 5 | 16 | 355,237 | 16,879 | 7 |
| Min | 3454 | 4 | 12 | 234,885 | 160 | 0.040 |
| Max | 5521 | 6 | 19 | 625,753 | 69,433 | 30 |
| SD | 847 | 1 | 3 | 141,804 | 26,104 | 12 |
| RSD% | 18.7 | 13.0 | 17.9 | 39.9 | 154.6 | 154.2 |
| Pollen/Anther | Anther/Flower | Flowers/Catkins | Pollen/Catkin | Catkins/Tree | ||||||
|---|---|---|---|---|---|---|---|---|---|---|
| Spearman | p Value | Spearman | p Value | Spearman | p Value | Spearman | p Value | Spearman | p Value | |
| Anther/Flower | −0.250 | 0.080 | ||||||||
| Flowers/Catkins | −0.315 | 0.026 | ||||||||
| Pollen/Catkin | 0.493 | 0.000 | 0.540 | 0.000 | ||||||
| Catkins/Tree | 0.502 | 0.000 | ||||||||
| Pollen/Tree | 0.491 | 0.000 | 0.994 | 0.000 | ||||||
| Q. robur | ||||||||||
| Catkins/Tree | 0.772 | 0.041 | ||||||||
| Pollen/Tree | 0.976 | 0.010 | ||||||||
| Q. pyrenaica | ||||||||||
| Pollen/Catkin | 0.738 | 0.051 | ||||||||
| Q. rubra | ||||||||||
| Flowers/Catkins | 0.815 | 0.046 | ||||||||
| Pollen/Catkin | 0.857 | 0.036 | 0.964 | 0.018 | ||||||
| Q. ilex | ||||||||||
| Pollen/Catkin | 0.900 | 0.001 | 0.576 | 0.026 | ||||||
| Pollen/Tree | 0.900 | 0.001 | ||||||||
| Q. suber | ||||||||||
| Pollen/Catkin | 0.810 | 0.047 | ||||||||
| Catkins/Tree | 0.857 | 0.036 | ||||||||
| Pollen/Tree | 0.857 | 0.036 | ||||||||
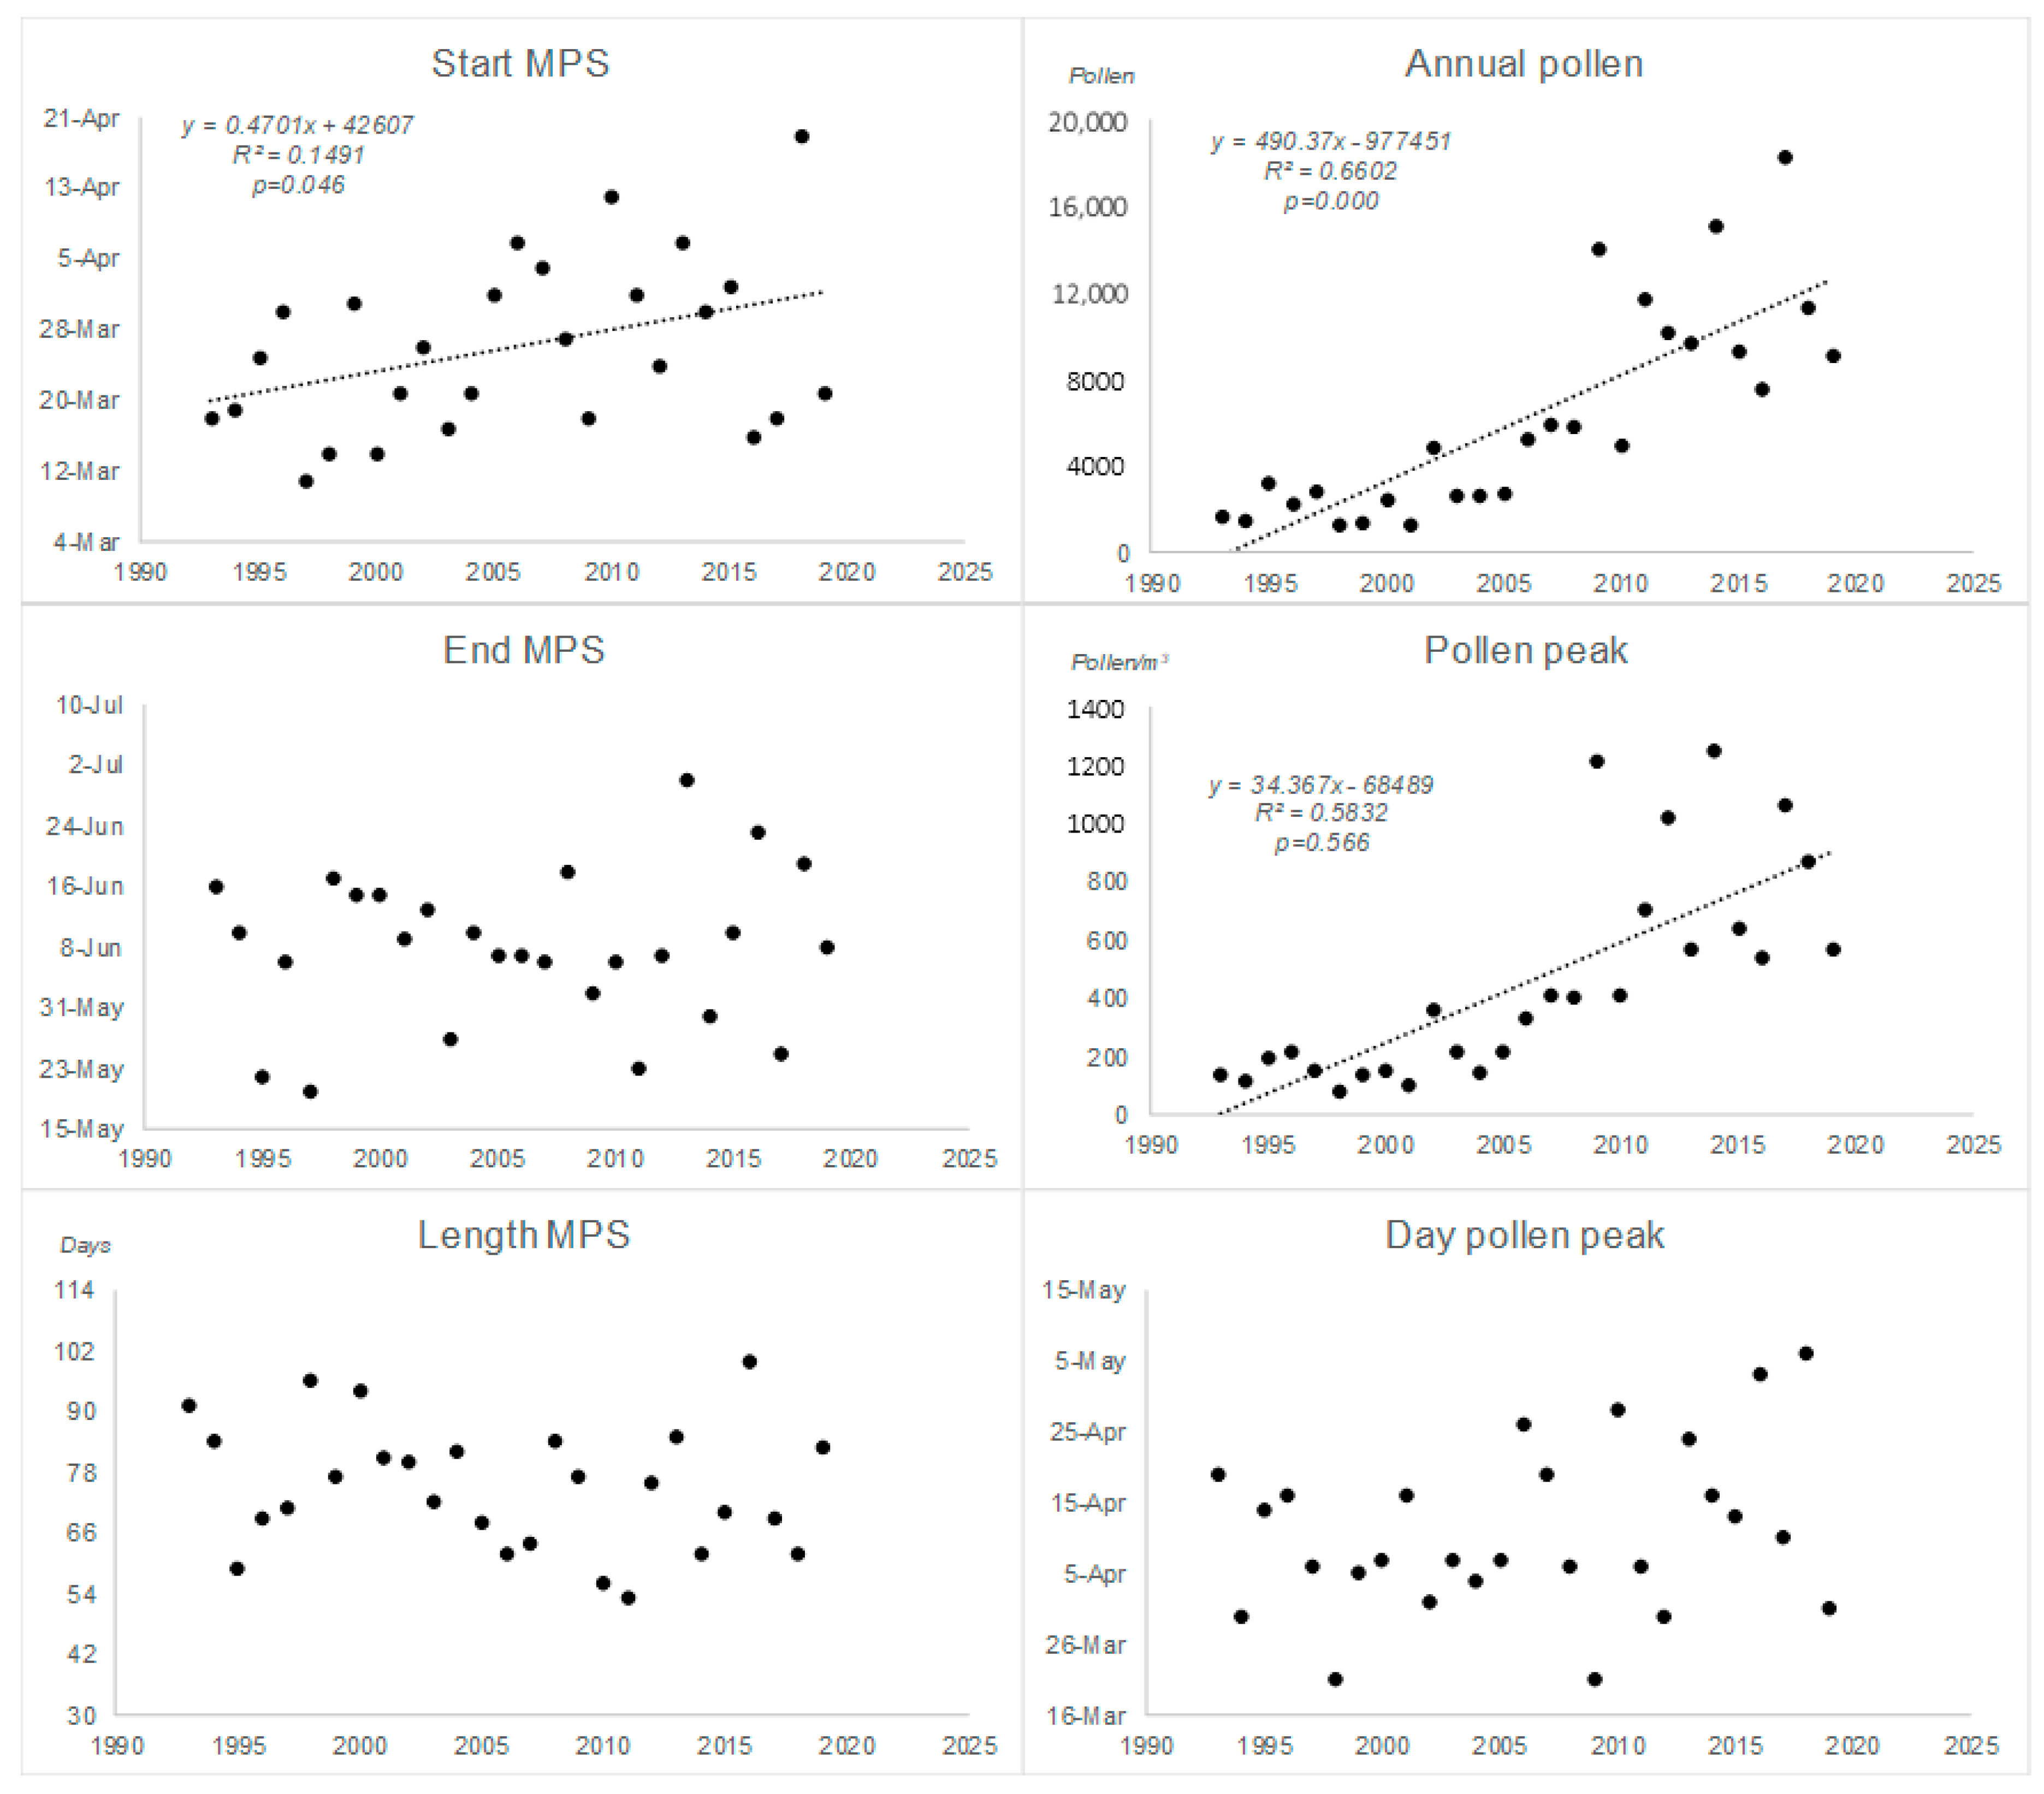
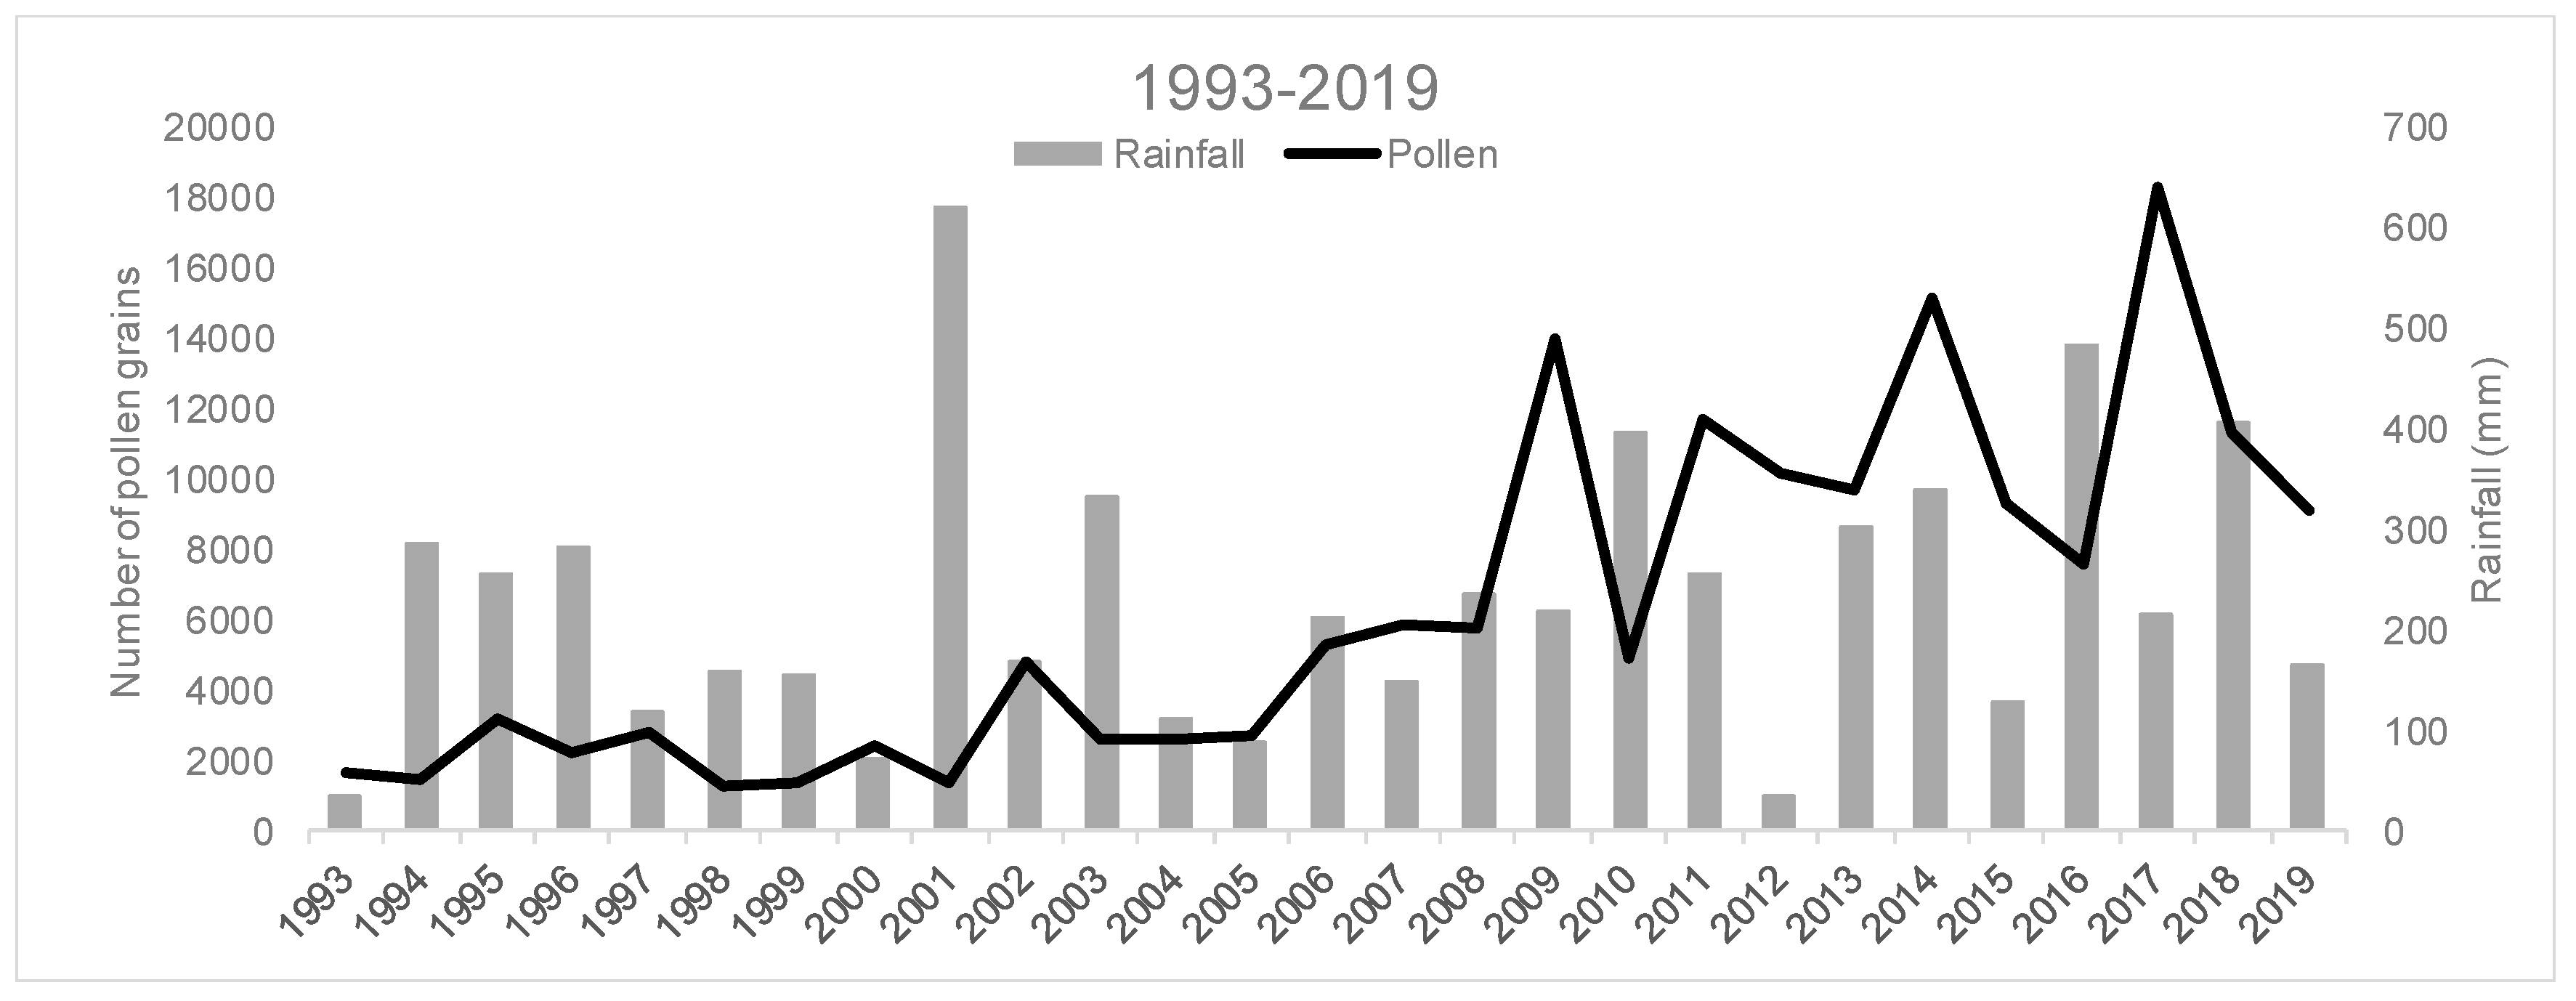
| Date Start MPS | Date End MPS | Length MPS | Annual Pollen | Pollen Peak | Date Pollen Peak | |
|---|---|---|---|---|---|---|
| 1993 | 18-Mar | 16-Jun | 91 | 1625 | 135 | 19-Apr |
| 1994 | 19-Mar | 10-Jun | 84 | 1468 | 115 | 30-Mar |
| 1995 | 25-Mar | 22-May | 59 | 3180 | 194 | 14-Apr |
| 1996 | 30-Mar | 6-Jun | 69 | 2266 | 215 | 16-Apr |
| 1997 | 11-Mar | 20-May | 71 | 2816 | 151 | 6-Apr |
| 1998 | 14-Mar | 17-Jun | 96 | 1296 | 77 | 21-Mar |
| 1999 | 31-Mar | 15-Jun | 77 | 1396 | 138 | 5-Apr |
| 2000 | 14-Mar | 15-Jun | 94 | 2392 | 154 | 7-Apr |
| 2001 | 21-Mar | 9-Jun | 81 | 1323 | 104 | 16-Apr |
| 2002 | 26-Mar | 13-Jun | 80 | 4824 | 361 | 1-Apr |
| 2003 | 17-Mar | 27-May | 72 | 2598 | 218 | 7-Apr |
| 2004 | 21-Mar | 10-Jun | 82 | 2617 | 147 | 4-Apr |
| 2005 | 1-Apr | 7-Jun | 68 | 2716 | 220 | 7-Apr |
| 2006 | 7-Apr | 7-Jun | 62 | 5271 | 330 | 26-Apr |
| 2007 | 4-Apr | 6-Jun | 64 | 5862 | 407 | 19-Apr |
| 2008 | 27-Mar | 18-Jun | 84 | 5772 | 402 | 6-Apr |
| 2009 | 18-Mar | 2-Jun | 77 | 13982 | 1212 | 21-Mar |
| 2010 | 12-Apr | 6-Jun | 56 | 4924 | 410 | 28-Apr |
| 2011 | 1-Apr | 23-May | 53 | 11675 | 703 | 6-Apr |
| 2012 | 24-Mar | 7-Jun | 76 | 10138 | 1017 | 30-Mar |
| 2013 | 7-Apr | 30-Jun | 85 | 9649 | 568 | 24-Apr |
| 2014 | 30-Mar | 30-May | 62 | 15115 | 1250 | 16-Apr |
| 2015 | 2-Apr | 10-Jun | 70 | 9290 | 642 | 13-Apr |
| 2016 | 16-Mar | 23-Jun | 100 | 7560 | 541 | 3-May |
| 2017 | 18-Mar | 25-May | 69 | 18269 | 1061 | 10-Apr |
| 2018 | 19-Apr | 19-Jun | 62 | 11343 | 866 | 6-May |
| 2019 | 21-Mar | 8-Jun | 83 | 9085 | 567 | 31-Mar |
| Mean | 26-Mar | 7-Jun | 75 | 6239 | 452 | 11-Apr |
| Max | 19-Apr | 30-Jun | 100 | 18269 | 1250 | 6-May |
| Min | 11-Mar | 20-May | 53 | 1296 | 77 | 21-Mar |
| SD | 10.90 | 10.87 | 13.22 | 5182.23 | 379.67 | 13.09 |
| RSD% | 0.03 | 0.02 | 17.61 | 83.06 | 83.99 | 0.03 |
| Pollen | 1993–2019 | 1993–2004 | 2005–2019 | ||||||
|---|---|---|---|---|---|---|---|---|---|
| Slope | R2 | p | Slope | R2 | p | Slope | R2 | p | |
| Start MPS | 0.471 | 0.149 | 0.046 | 0.011 | 0.001 | 0.985 | 0.389 | 0.031 | 0.529 |
| End MPS | 0.139 | 0.012 | 0.581 | 0.185 | 0.004 | 0.832 | 0.311 | 0.018 | 0.635 |
| Length MPS | −0.306 | 0.038 | 0.328 | 0.178 | 0.003 | 0.854 | 0.775 | 0.074 | 0.326 |
| Annual Pollen | 490.37 | 0.661 | 0.000 | 93.367 | 0.108 | 0.297 | 551.721 | 0.337 | 0.023 |
| Pollen peak | 34.37 | 0.583 | 0.000 | 6.112 | 0.088 | 0.349 | 33.235 | 0.205 | 0.089 |
| Peak day | 0.3492 | 0.0509 | 0.257 | −0.581 | 0.065 | 0.429 | 0.239 | 0.005 | 0.791 |
| Year | Slope | R2 | p | Slope | R2 | p | Slope | R2 | p |
| Tmax | 0.029 | 0.108 | 0.093 | 0.046 | 0.078 | 0.378 | 0.022 | 0.017 | 0.642 |
| Tmed | −0.008 | 0.018 | 0.506 | 0.034 | 0.042 | 0.519 | 0.033 | 0.102 | 0.244 |
| Tmin | 0.0129 | 0.0301 | 0.385 | 0.041 | 0.074 | 0.393 | 0.034 | 0.067 | 0.348 |
| Rainfall | −7.626 | 0.094 | 0.127 | −17.609 | 0.105 | 0.304 | 10.396 | 0.061 | 0.374 |
| Humidity | −0.0978 | 0.056 | 0.194 | −0.304 | 0.073 | 0.394 | 0.079 | 0.037 | 0.489 |
| SunHours | 0.0247 | 0.124 | 0.071 | −0.097 | 0.306 | 0.062 | 0.018 | 0.057 | 0.388 |
| Jan-Feb-Mar | Slope | R2 | p | Slope | R2 | p | Slope | R2 | p |
| Tmax-JFM | −0.058 | 0.1627 | 0.037 | 0.015 | 0.003 | 0.863 | −0.037 | 0.022 | 0.596 |
| Tmed-JFM | −0.071 | 0.319 | 0.002 | 0.038 | 0.027 | 0.606 | −0.096 | 0.249 | 0.057 |
| Tmin-JFM | −0.014 | 0.008 | 0.651 | 0.057 | 0.027 | 0.608 | 0.003 | 0.001 | 0.963 |
| Rainfall-JFM | 3.748 | 0.047 | 0.278 | 7.727 | 0.031 | 0.581 | 9.666 | 0.121 | 0.204 |
| Humidity-JFM | −0.012 | 0.001 | 0.712 | −0.112 | 0.005 | 0.823 | 0.163 | 0.044 | 0.451 |
| Sun Hours-JFM | −0.021 | 0.032 | 0.375 | −0.089 | 0.155 | 0.231 | −0.021 | 0.008 | 0.751 |
© 2020 by the authors. Licensee MDPI, Basel, Switzerland. This article is an open access article distributed under the terms and conditions of the Creative Commons Attribution (CC BY) license (http://creativecommons.org/licenses/by/4.0/).
Share and Cite
Fernández-González, M.; González-Fernández, E.; Ribeiro, H.; Abreu, I.; Rodríguez-Rajo, F.J. Pollen Production of Quercus in the North-Western Iberian Peninsula and Airborne Pollen Concentration Trends during the Last 27 Years. Forests 2020, 11, 702. https://doi.org/10.3390/f11060702
Fernández-González M, González-Fernández E, Ribeiro H, Abreu I, Rodríguez-Rajo FJ. Pollen Production of Quercus in the North-Western Iberian Peninsula and Airborne Pollen Concentration Trends during the Last 27 Years. Forests. 2020; 11(6):702. https://doi.org/10.3390/f11060702
Chicago/Turabian StyleFernández-González, María, Estefanía González-Fernández, Helena Ribeiro, Ilda Abreu, and F. Javier Rodríguez-Rajo. 2020. "Pollen Production of Quercus in the North-Western Iberian Peninsula and Airborne Pollen Concentration Trends during the Last 27 Years" Forests 11, no. 6: 702. https://doi.org/10.3390/f11060702