
Abstract
The ventral scales of most snakes feature micron-sized fibril structures with nanoscale steps oriented towards the snake's tail. We examined these structures by microtribometry as well as atomic force microscopy (AFM) and observed that the nanoscale steps of the micro-fibrils cause a frictional anisotropy, which varies along the snake's body in dependence of the height of the nanoscale steps. A significant frictional behavior is detected when a sharp AFM tip scans the nanoscale steps up or down. Larger friction peaks appear during upward scans (tail to head direction), while considerably lower peaks are observed for downward scans (head to tail direction). This effect causes a frictional anisotropy on the nanoscale, i.e. friction along the head to tail direction is lower than in the opposite direction. The overall effect increases linearly with the step height of the micro-fibrils. Although the step heights are different for each snake, the general step height distribution along the body of the examined snakes follows a common pattern. The frictional anisotropy, induced by the step height distribution, is largest close to the tail, intermediate in the middle, and lower close to the head. This common distribution of frictional anisotropy suggests that snakes even optimized nanoscale features like the height of micro-fibrils through evolution in order to achieve optimal friction performance for locomotion. Finally, ventral snake scales are replicated by imprinting their micro-fibril structures into a polymer. As the natural prototype, the artificial surface exhibits frictional anisotropy in dependence of the respective step height. This feature is of high interest for the design of tribological surfaces with artificial frictional anisotropy.
Export citation and abstract BibTeX RIS

Original content from this work may be used under the terms of the Creative Commons Attribution 4.0 licence. Any further distribution of this work must maintain attribution to the author(s) and the title of the work, journal citation and DOI.
1. Introduction
Snakes (Squamata: Serpentes) have no extremities and move forward (or generate traction) by waving their body [1–5]. Due to this special limbless locomotion style, their ventral scales are in direct, permanent contact with the ground. Consequently, the snake's skin not only acts as a protection against the environment, but serves as a tribological element that is beneficial for locomotion and has to withstand friction and wear frequently [3, 6]. For this and other reasons, snakes shed their skin (ecdysis) after time spans ranging from 20 d to one year [7–9].
The tribological properties of snake scales have attracted significant attention in recent decades [3, 10–19]. The analysis of the topography of ventral scales often reveals micron-sized fibril structures oriented from head to tail [20–22]. Figure 1 shows examples of three snakes living on different continents. These micro-fibrils are commonly considered as an important component for the control of friction and wear during snake sliding [11, 16, 23, 24]. Some studies reported anisotropic friction performance of the snake skin [11, 16, 25], while only a few studies acknowledged the correlation between the microstructure of the scales and the respective frictional properties [3, 20, 24, 26]. Investigations on the geometrical patterns and dimensions of snake scales [20, 26–28] revealed that the frictional anisotropy on ventral snake scales is caused by the asymmetric geometry of the micro-fibril ends. In addition, snakes wave their long and soft bodies during locomotion, and in their natural habitat, they will traverse various terrains such as forests, rocks and grasslands. They might even experience different friction properties along their body when travelling on sophisticated terrain. Abdel-Aal et al [20] reported that the micro-fibril density on the middle section of the Python regius is higher than in the other areas, which implies larger friction anisotropy in the middle. This finding suggests that the micron-sized fibril structures on the ventral scales of snakes, for example, the shape of a single fibril or the distribution of micro-fibrils along the body seem to be highly optimized to achieve sophisticated frictional performance during locomotion. Nonetheless, how the microstructure of snake scales is adapted to obtain optimal frictional properties needs further clarification. Insight into this puzzle promises inspiration for advanced engineered surfaces with favorable frictional properties.
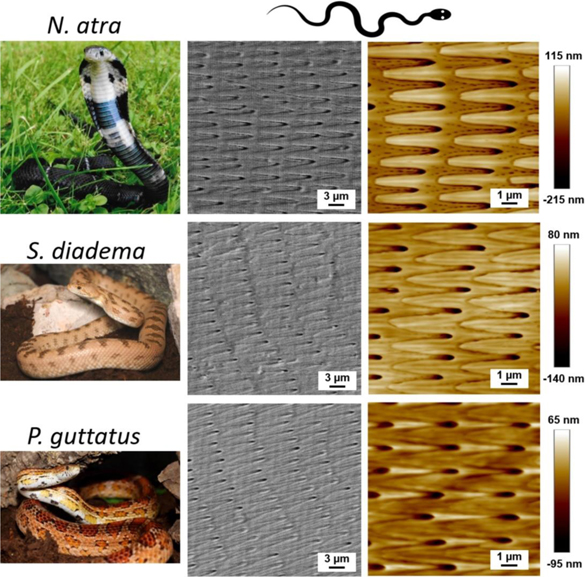
Figure 1. Three snakes and the micro-fibril structure of their ventral scales. First column on the left displays photos of the three examined snake species (N. atra, S. diadema and P. guttatus). Second and third columns compare the corresponding scanning electron microscopy (SEM) and atomic force microscopy (AFM) images of the ventral scales of these snakes. Arrays of micron-sized fibril structures on these scales are oriented along the snake's body from head to tail (right to left) as indicated by the schematic snake drawn at the top. (All snake photos by Guillaume Gomard, used with permission.)
Download figure:
Standard image High-resolution imageFor that, we characterized the frictional properties of ventral snake scales by microtribometry and AFM. We observed different frictional forces when scanning single scales in the head or tail direction. By the application of AFM, we analyzed the origin of this anisotropy at the nanoscale and examined the frictional properties of micro-fibrils found on ventral snake scales by the example of three terrestrial snake species (Naja atra, Spalerosophis diadema cliffordii and Pantherophis guttatus). Our experiments confirm that there is an additional frictional force component acting on an AFM tip, while scanning a micro-fibril step with nanoscale height up or down [24]. The overall effect increases with normal load and is strongly direction dependent. Scanning down a micro-fibril step in the head to tail direction (downwards) causes lower forces compared to the opposite direction (upwards). This effect leads to a frictional anisotropy caused by a nanoscale step. Analyzing the magnitude of the frictional anisotropy, we observe that it increases with the height of the nano-steps. It is also interesting to note that all three snakes feature the same distribution of frictional anisotropy along their body, i.e. friction anisotropy is largest at the snake's tail, lowest at the head, and intermediate in the middle. Finally, inspired by this, we fabricate a polymeric replica of the ventral scales of N. atra, resulting in an artificial surface with frictional anisotropy. The respective magnitude of this effect is controlled by the height of the nano-steps.
2. Methods
2.1. Sample preparation and imaging
Samples of molted skin from seven snake species (Aspidites ramsayi, Vipera aspis, Sistrurus miliarius barbouri, Bitis arietans, N. atra, S. diadema cliffordii and P. guttatus, provided by G. Gomard) were cut into small pieces (about 1 × 1 cm) and glued on a glass substrate with double-sided adhesive tape (Fotostrip, Tesa® AG, Germany). To investigate the step height distribution along snakes' bodies, each molted snake skin was divided along the body into eleven evenly distributed segments, and the averaged step height in these eleven sections was determined by AFM. For that, five pieces of scales were picked from each segment, and ten different positions on each of these samples were characterized by AFM to calculate the averaged step height, i.e. a total of 5 × 10 = 50 values obtained for each section. The corresponding frictional coefficient for scanning up and down a step in each segment was determined as well. Scales were blown and cleaned by pressurized air before AFM imaging without any additional treatment. All samples were stored at controlled temperature (21 °C–23 °C) and humidity (50%–70%). The AFM experiments were conducted in the same environment.
The topography of the ventral snake scales was imaged by SEM (SUPRA 60 VP, Zeiss, Germany). Before SEM characterization, the scales were sputtered with a thin layer of silver. The working distance between the samples and SEM detector was kept constantly low (5–7 mm) and the acceleration voltage was set between 1–3 kV for the SEM investigation.
2.2. Fabrication of polymeric replica
The replica of an N. atra scale was fabricated with a UV-curing polymer layer via a polydimethylsiloxane (PDMS) mold [29]. A schematic diagram of the replication process is displayed in the supplementary information in figure S1 (http://stacks.iop.org/BB/15/056014/mmedia). First, a ventral scale of N. atra was cut into small pieces and fixed with double-sided tape on a silicon wafer placed in an aluminum container. Sylgard Silicone Elastomer 184 and Sylgard Curing Agent 184 (Dow Corning) were mixed in a weight ratio of 10:1 and put into an evacuated desiccator for 20 min in order to remove possible air bubbles. After that, the mixture was slowly poured over the snake scale in the aluminum container. Subsequently, the whole setup was placed on a hotplate with a constant temperature of 45 °C for 10 h without applying any pressure during the curing process. The comparable low temperature was chosen to avoid damage to the snake scales. After hardening, the PDMS mold was separated from the scale and cleaned in an ultrasonic bath with isopropanol to remove possible scale remnants. For replication, a drop of about 50 μl of UV-curing adhesive, Norland Optical Adhesive 88 (NOA 88), was dripped on a glass slide, into which the hardened PDMS mold was carefully pressed to avoid air bubbles in the replica. After 20 min of UV exposure at 1.5 mW cm−2 UV radiation power, the cured positive replica of the N. atra scale was obtained by separating it from the PDMS stamp. Finally, the replication quality of the NOA 88 surface was confirmed by AFM characterization.
2.3. Characterization of frictional properties
Microscale friction measurements were performed with a home-built reciprocating ball-on-plate microtribometer [30]. A polished sapphire sphere with a diameter of 2 mm (Saphirwerk AG, Bruegg, Switzerland) was rubbed against the samples, which included ventral scales of seven snake species, an NOA 88 replica of an N. atra ventral scale, and a flat NOA 88 reference without any structure. Normal load and sliding speed were set to 0.5 N and 0.5 mm s−1, respectively. Single pieces of snake scales were fixed with double-sided adhesive tape on a silicon wafer. An N. atra ventral scale was replicated with the imprinting method described above. The bare NOA reference was imprinted with a flat PDMS mold obtained via a flat silicon wafer. To eliminate the friction deviation of the microtribometer's reciprocating movement in the trace and retrace direction, each sample was measured in two orientations, i.e. before and after turning it 180°. Three reciprocating lines on different positions were measured for each sample orientation. Five reciprocating cycles in both the trace and retrace direction were conducted along each line. The friction coefficients along the same sample/microtribometer moving direction were averaged. The temperature and relative humidity during the test were controlled to (22 °C ± 1) °C and (45% ± 5)%, respectively.
Friction measurements by AFM (Dimension Icon, Bruker, USA) were carried out in contact mode. We used a virgin cantilever (All-in-One-Al, BudgetSensors) from the same batch for each new measurement. The deflection sensitivity of each cantilever was determined with the ramp modus integrated in the software of the AFM. The force calibration procedure for normal load and lateral force measurements was conducted according to the method proposed by Schwarz et al [31], adopting the cantilever dimensions from the manufacture [32]. The scanning size for all friction measurements was set to 10 × 10 μm. The sample orientation was gradually adjusted to ensure that the cantilever scanned vertically across the fibril ends. Frictional forces were tracked during the scanning of the cantilever tip across the sample surface in forward (trace) and backward (retrace) direction with a defined load (friction loop). The frictional forces were recorded while increasing normal load on the surface. On atomically flat surfaces this procedure increases the contact area of spherical tips in such a way that friction increases with a power law (Ffriction ∼ Fload2/3) [33, 34]. In our case, however, the samples are not atomically flat and the tips are not perfect spheres and we observe a conventional linear increase of friction with load (Ffriction = const. + μ × Fload). Therefore, the classical friction coefficient μ was determined by a linear fit to the respective data points.
3. Results and discussion
3.1. Microscale friction anisotropy on ventral snake scales
In order to quantify the frictional anisotropy of single ventral snake scales, we conducted microscale friction measurements with a reciprocating linear microtribometer for the seven snake species listed in the Methods section. The averaged friction coefficients of all ventral snake scales measured in the forward and backward direction are compared in table 1. The frictional anisotropy is given as the ratio and difference between the friction coefficients for the forward and backward motion. Since the friction coefficients in the forward direction are always smaller than in the backward direction the frictional anisotropy is always positive (or larger as one). For the investigated seven species, the average friction coefficient in the backward direction is typically about 10% larger than in the forward direction. On N. atra, frictional anisotropy even reaches 20%. This means that the examined snakes can slide more easily in the forward direction through the frictional anisotropy of the ventral scales alone. For living snakes, the frictional anisotropy might be even larger because of the macroscopic arrangement of their scales, i.e. some snakes are known to utilize the edges of their scales for interlocking [3, 12].
Table 1. Summary of dimensionless averaged (n = 6) friction coefficients of seven snakes' ventral scales as well as for the NOA polymer measured by a reciprocating linear microtribometer. The first two columns contain the friction coefficients in the forward and backward direction. The last three columns show the respective ratio, absolute and percentage difference.
| Samples | Moving forwards | Moving backwards | Ratio | Difference (abs.) | Difference (%) |
|---|---|---|---|---|---|
| Aspidites ramsayi | 0.163 | 0.183 | 1,123 | 0.020 | 12.3 |
| Vipera aspis | 0.195 | 0.211 | 1,082 | 0.016 | 8.2 |
| Sistrurus miliarius barbouri | 0.162 | 0.181 | 1,117 | 0.019 | 11.7 |
| Bitis arietans | 0.177 | 0.194 | 1,096 | 0.017 | 9.6 |
| Pantherophis guttatus | 0.158 | 0.175 | 1,108 | 0.017 | 10.8 |
| Spalerosophis diadema | 0.175 | 0.200 | 1,143 | 0.025 | 14.3 |
| Naja atra | 0.187 | 0.227 | 1,214 | 0.040 | 21.4 |
| NOA replica of Naja atra | 0.402 | 0.435 | 1,082 | 0.033 | 8.2 |
| Flat NOA reference | 0.401 | 0.400 | 0,9975 | −0.001 | 0.25 |
In addition, we examined the frictional properties of a polymeric replica of N. atra ventral scale imprinted into the polymer NOA 88 and a flat reference sample. Analyzing these two samples with a microtribometer, we observed anisotropic friction of about 8% on the replica of the snake's scale, but isotropic friction on the flat reference sample. This outcome strongly suggests that the frictional anisotropy of snake scales is mainly caused by the surface structure, while chemical properties are less important for this effect.
It is interesting to note that the overall friction coefficient for forward motion on the replicated polymeric surface is close to that of the flat reference of the same material. This indicates that the micro-fibrils on ventral scales of snakes do not reduce friction in forward motion, but increase friction for backward motion. It is also interesting to mention that the friction coefficients on the natural N. atra scales are considerably smaller than those of the polymeric replica. This effect will be only partly caused by properties such as surface chemistry. We attribute the difference between the two samples mainly to the different elastic moduli of the two materials. The elastic modulus of keratin is considerably higher than that of the polymer (Ekeratin = 4.5 GPa > 0.9 GPa = ENOA88) [23, 35]. A smaller elastic modulus causes a larger actual contact area between the probe and sample surfaces, ultimately resulting in a larger friction coefficient [34].
3.2. Nanoscale friction anisotropy on step structures of ventral snake scales
With the aim to reveal the physical origin of the frictional anisotropy in more detail, we choose three snake species (N. atra, S. diadema and P. guttatus) to examine the frictional properties of their ventral scales at the nanoscale. For that, a series of topographical and frictional analyses were carried out applying the same procedures conducted on the micro-fibrils of the three snake species by AFM. To explore the connection between friction performance and topography at the fibril end (step edge), we intentionally adjusted the sample orientation so that the AFM tip scanned exactly along the fibril axis, which forces the tip to move up and down the step edge when scanning across the fibril ends. Each AFM data set includes simultaneously recorded topography and friction signals.
Figure 2 shows the results of this topographical and frictional analysis on the nanoscale steps of the ventral scales of N. atra. The top image in figure 2(a) represents the topography. A topographical line section taken from the position indicated by a red arrow in the top panel in figure 2(a) across the fibril end was extracted and plotted in the middle panel, revealing that the step edge at the three plotted fibril ends is about 50–60 nm high. The shape of the fibril steps is asymmetric with a steep step and a gentle ramp in the opposite direction, which suggests frictional anisotropy along the fibril's direction. The bottom panel in figure 2(a) shows the simultaneous recorded frictional force acting during scanning of the AFM tip in the forward (trace) and backward (retrace) direction under fixed normal load. In such a friction loop, the frictional force remains constant when scanning on a fibril terrace (area without steps), but it exhibits significant peaks at the step edges in the trace and retrace direction. The frictional peak in the trace direction (upward the step) is much larger than for retrace (downward the step). This frictional behavior recalls the frictional effects observed in studies of atomic-scale step edges of crystal surfaces [36–38]. Thus, we applied the analysis procedure used in such studies also for the present case. Frictional increase at step edges is defined as the difference between the peak of the frictional force at a step edge and the friction on a terrace. Friction on flat terraces is calculated as the half of the mean difference of the friction values between trace and retrace on the terrace. These friction values are exemplary, indicated by black arrows in the bottom panel in figure 2(a).
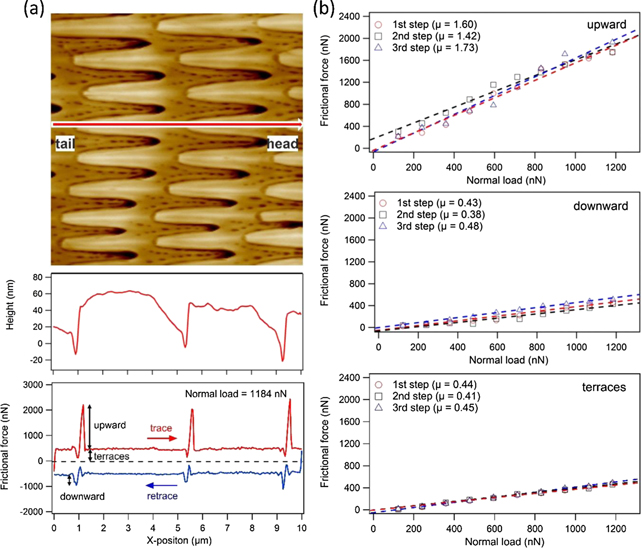
Figure 2. Topography and friction measurements of ventral N. atra scales at step edges of micro-fibrils recorded by AFM. (a) Top graph shows a topography image of a ventral scale of N. atra imaged by AFM (scan size: 10 × 10 μm) showing the fibril structures. Red arrow points towards the snake's head, which means that the fibrils are oriented towards the tail. Middle panel is the topography across the fibril end along this arrow. A step height of 50–60 nm is observed at the fibril ends. Bottom shows the corresponding friction loop under a normal load of 1184 nN along the marked line in the top panel. Left-right scan (upward the step) is shown in red (trace) and the right-left scan (downward the step) is displayed in blue (retrace). An obvious higher friction response is observed at the step edges for scanning upward and downward a step. The frictional increase indicated by black arrows is much larger for upward than for downward scans. (b) Frictional increase at three different fibril ends (step edges) is plotted as a function of normal load. Frictional force increases linearly with normal load, but the respective slope differs, resulting in different friction coefficients (see legends) for the three cases.
Download figure:
Standard image High-resolution imageIncreasing the normal load, the frictional increase at step edges ('upward' and 'downward' in the following) and the friction on terraces were systematically recorded as a function of applied load. The resulting analysis is plotted in figure 2(b) and reveals that the frictional forces increase linearly with normal load. Therefore, a linear fit was conducted to the data points and the resulting frictional coefficients for upward and downward scans as well as for terraces were determined. In figure 2(b), one can observe that the frictional coefficient for downward scans is much smaller than that for upward scans. More specifically, the averaged frictional coefficient for upward scans is about 3.7 times higher than that for downward scans. This outcome confirms that the micro-fibrils are the origin of the frictional anisotropy on the ventral scales of N. atra [24]. Here, it is important to note that the values measured with an AFM tip correspond to nanoscopic friction effects, which cannot be compared directly with macroscopic values. The macroscopic frictional anisotropy will be considerably smaller because the contact area is larger, and the anisotropic effect is partially evened out. This is also the reason the frictional anisotropy previously measured with the microtribometer is smaller. Here, the friction coefficient in the backward direction is about 20% larger than in the forward direction. Nevertheless, both results show that the snake N. atra slides more easily forwards than backwards, although the effect is more noticeable at the nanoscale.
The same topographical and frictional analysis was also conducted on the ventral scales of S. diadema and P. guttatus. The results are summarized in the supplementary material in figures S2 and S3 and reveal the same effect leading to frictional anisotropy. The relation between the averaged frictional coefficients for upward and downward scans are 5.2 and 3.8 for S. diadema and P. guttatus, respectively. As mentioned before, these values describe a nanoscopic friction effect at a step-edge and cannot be compared to macroscopic friction coefficients. Nonetheless, it is interesting to note that the step heights differ significantly among the investigated snake species. The fibril heights of S. diadema and P. guttatus are about 15–30 nm and 10–20 nm, respectively. Despite these height differences, the overall outcome is the same. The fibril nano-steps cause frictional anisotropy with their magnitude depending on their actual height.
Several reasons can account for the height differences between the snake species, such as their different habitats, age or size. It is also possible that the endured abrasion causes a reduction of the fibril height on different species. However, as we do not observe significant scratches or any other signs of abrasion on the ventral scales, we assume that wear is limited for our examined samples.
3.3. Correlation between step height and frictional properties at the nanoscale
Figure 3(a) summarizes all frictional coefficients as a function of step height for the ventral scales of P. guttatus, S. diadema and N. atra. Friction coefficients for upward steps increase linearly with step height, but for downward steps and terraces there is no clear trend, at least no significant increase. All three cases can be fitted with one straight line, although the data is recorded on three different snake species. Furthermore, each data point in this graph was obtained with a new AFM tip, i.e. the overall outcome is quite general and independent of the exact tip shape. The friction anisotropy is defined as the frictional coefficient for scanning upward a step divided by that for downward scans. Figure 3(b) shows the friction anisotropy, which exhibits the same trend as the upward frictional coefficient. We, therefore, conclude that the step height of the micro-fibrils on ventral scales is the main parameter controlling friction anisotropy.

Figure 3. (a) Frictional coefficient as a function of step height on the ventral scale of the three investigated snake species. 'Upward step' and 'Downward step' in the legend represent the corresponding friction coefficient for the AFM tip scanning up and down the nano-steps at fibril ends. Friction coefficients on terraces were also plotted. Frictional coefficient for upward steps is observed to increase with the step height, while the friction coefficients for downward steps and on terraces scatter around a low value. (b) Friction anisotropy shows a similar trend as the upward friction coefficient. It increases with step height.
Download figure:
Standard image High-resolution imageThis reveals that all three snakes exploit the same type of friction anisotropy originating from nano-steps, i.e. upward friction increases with the step height of the fibrils leading to larger frictional coefficients, but downward friction is nearly independent of the step height. It is also interesting to note that for the snakes studied here, the frictional coefficient for downward scans is very close to that on the flat terraces without steps. Since there are no structures on the terraces, their frictional properties are mainly caused by the material properties of the ventral scales. Consequently, friction in the downward direction depends mainly on the material properties of snake scales. Therefore, the nano-steps are responsible for the increase of friction when the locomotion direction is upward the step edge (corresponding to the backward motion of snakes), but they cannot reduce sliding friction when the snake moves forward (downward the step motion).
3.4. Distribution of step height along snake bodies
Recent studies conducted with euthanized snakes have already reported frictional anisotropy [3, 4, 39, 40] from measurements conducted with the whole snake body sliding down a slope. Such measurements, however, determine the averaged snake's friction of the whole ventral side, but cannot reveal a possible variation of frictional anisotropy along the snakes' bodies. In order to analyze such a possible distribution of frictional properties, we evenly divided molted snakes' scales into 11 segments in the longitudinal body direction. Subsequently, we analyzed the samples again by AFM. Figure 4 shows the resulting step height distribution together with the friction coefficients along the bodies of N. atra, S. diadema and P. guttatus. The relative positions '0' and '1' span the complete length of the shed snake skins and correspond to the head and tail end, respectively. According to our observation, the snake's vents were located in the tenth section, which means that the first nine sections (and a part of the tenth section) roughly comprise the snout-to-vent length.
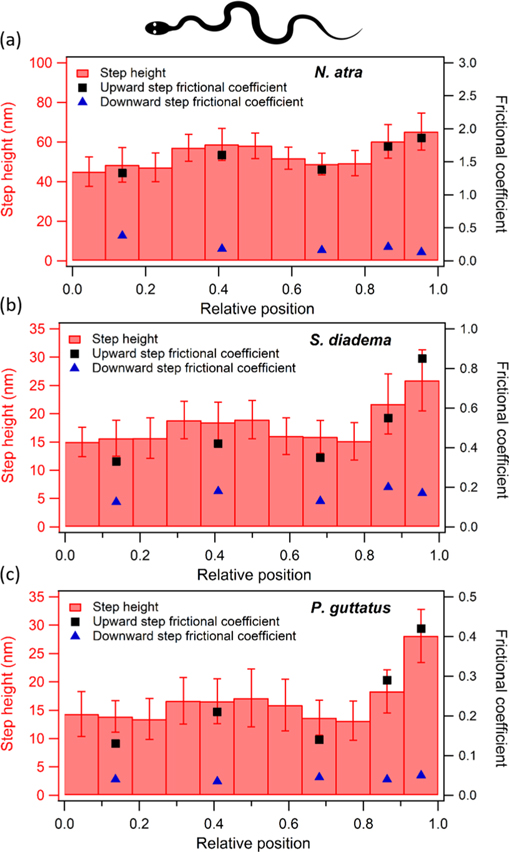
Figure 4. Distribution of the averaged step height (red bars) as well as the corresponding frictional coefficients on the ventral scale along the body of (a) N. atra, (b) S. diadema and (c) P. guttatus. Solid square markers correspond to upward scans (tail to head direction) and the solid triangles to downward scans (head to tail direction). Relative positions span the complete length of the shed skins. '0' and '1' represent the snout and tail end, respectively. Averaged step height was calculated from 50 different positions in the same section, and the error bars are the statistical error. Outcome indicates that larger step heights in the middle section of the body induce larger frictional coefficients for upward scans. However, the largest step heights on all three snakes are found close to the tail.
Download figure:
Standard image High-resolution imageThe middle sections of the snakes' bodies exhibit larger step heights, while the largest values are located in the section closest to the tail. The step heights in the anterior section (first three sections) are almost the same as in the posterior section before the tail (last two sections). The frictional coefficients for scanning a fibril step up and down are plotted in figure 4 as data points for a subset of sections. We observe again that the frictional coefficients for upward scans correlate with step height. Therefore, the frictional coefficients are larger in the middle and largest at the tail. However, the friction coefficients for downward scans are considerably lower and nearly independent of the step height.
For all three examined snakes, the averaged step height on the trailing half is significantly larger than the leading half, resulting in higher friction anisotropy. This confirms the results of Abdel-Aal et al [26], who measured the distribution of frictional coefficient values and friction anisotropy on a P. regius with a 40 mm diameter probe biotribometer. The distribution of step heights along snake bodies reflects the frictional properties of each segment, which will be an important factor for locomotion. For all three snakes, we observed the largest step heights in the tail section and intermediate values in the middle of the body. Since the middle section of snakes is considered to generate most of the traction force [20], this distribution seems to be favorable for snakes. The relatively high steps in the middle area might be needed to provide a higher traction force through higher friction anisotropy. The large step heights in the tail would induce significant friction coefficients for snakes moving in the backward direction. However, this section is also reported to serve as an anchor and not for locomotion [41]. The first nine sections (snout-to-vent length) in figure 4 should reveal the main frictional performance during locomotion.
Here, the question arises as to why the step heights are not larger to achieve even higher frictional anisotropy? Most likely, that would cause other implications. When the step height would increase from some 10 to some 100 nm, there would also be some optical interference effects in the visible range. Here, we can only speculate that this might be an unwanted effect prevented by evolution. An additional point to consider is the mass distribution along the snake's body, which will be an important factor for locomotion. However, our study based on molted snake skin cannot provide this information. Snakes might utilize this inhomogeneous distribution of step heights along their body to achieve optimized friction performance during locomotion, for example, enhancing traction forces in the middle. The detailed implication of frictional anisotropy on the snake's body will be important for the simulation of snake locomotion and the development of snake-inspired applications including snake-shaped robots [42–44].
3.5. Replication of N. atra scale surface into a polymeric surface and friction measurement on the replica
In order to prove whether the observed friction anisotropy is caused by the structural property of the micro-fibrils or by the material properties of snake scales, we fabricated a replica of a ventral scale of N. atra from NOA 88. Figure 5 shows photographs of the original N. atra scale, the PDMS mold and the resulting replica. On this sample, we characterized friction by AFM and conducted the same type of analysis already presented in figure 2.

Figure 5. Side-by-side comparison of the original rectangular-cut N. atra ventral scale, the negative PDMS mold and a positive NOA 88 replica.
Download figure:
Standard image High-resolution imageThe resulting nanoscale topography and friction loop are shown in figure 6(a). The step height on the replica ranges between 30–45 nm, which is a little smaller than that on the original scale of N. atra (50–60 nm). Nonetheless, the same type of friction loop was obtained on the replica as on the original scale. A friction peak at the step edges is observed when the AFM tip scans upward or downward a step and a more or less constant friction signal is recorded on the terraces. The frictional increase for upward and downward scans at the step edges (marked by a red arrow in figure 6(a)) and the friction on the terraces was recorded as a function of normal load. Figure 6(b) summarizes the obtained data and shows the linear fits used for the determination of the friction coefficients. The friction coefficients for upward scans are smaller, as on the original N. atra scale (see figure 2). These reduced friction values are most likely caused by the lower steps on the replica. Nonetheless, the overall behavior did not change. As discussed before, the frictional coefficient for downward scans is close to that on terraces, which is mostly determined by the material properties. Both frictional coefficients are a little higher on the replica than on the original scales. As already mentioned for the experiments with the microtribometer, this outcome is probably caused by the material differences between the NOA 88 replica and snake scales (i.e. the difference of the Young's modulus and/or the surface chemistry). Our recent study already showed that snake scales feature lower friction than most technical materials [19]. Calculating the averaged frictional anisotropy as the ratio between upward and downward scans, we obtain a value of 2.5, which is smaller than that on the N. atra scale (3.7). This result shows that the frictional anisotropy can be artificially obtained through proper structuring with nano-scale steps. This construction principle can also be applied to other technical surfaces such as metals or ceramics.
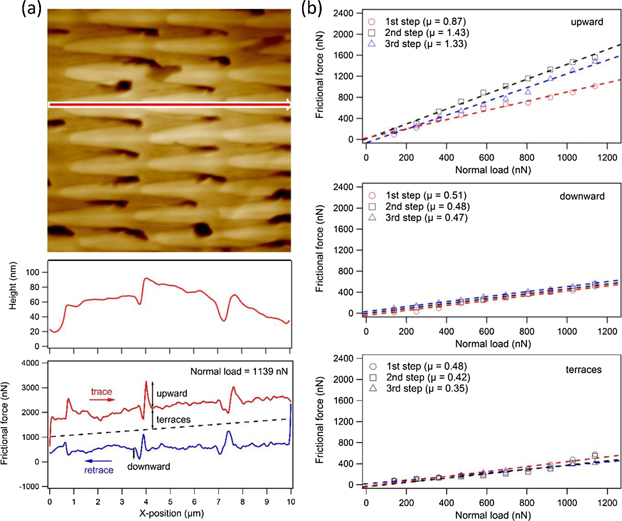
Figure 6. Same measurement on the replica of the N. atra scale, as presented in figure 2. (a) Topography image shows similar directional micro-fibril structures as N. atra, indicating a good replication quality (scan size: 10 × 10 μm). Topographical line section reveals smaller step heights (30–45 nm) on the replica than on the original scales of N. atra (50–60 nm). Nonetheless, the same type of friction loop with prominent peaks at the step edges was observed. (b) Friction force as a function of normal load for upward scan and downward scan together with that on the terrace are displayed. Since the step height investigated here is smaller than that of the N. atra scale, a smaller frictional coefficient for upward the step was calculated, but the values for downward the step and on the terrace were larger than that on the original snake scale.
Download figure:
Standard image High-resolution imageFinally, inspired by the frictional anisotropy observed on snakes, we fabricated an artificial polymeric surface with variable frictional anisotropy in different areas using the previously applied imprinting method. For that, six pieces of scales from different areas of N. atra skin were stitched together and replicated to NOA 88. This procedure led to a polymeric surface with micro-fibrils exhibiting different step heights, resulting in diverse friction anisotropy. Figure 7 shows a photo of the artificial polymeric surface as well as the distribution of the step height and friction anisotropy on the surface. Six sections are shown from left to right (marked by '1'–'6', respectively), which correspond to the original six pieces of snake scales. The first two sections on the left ('1' and '2') are replicated from scales near the snake's head, sections marked by '3' and '4' are from the snake's middle section and the last two sections are from the snake's tail ('5' and '6'). The step height and friction anisotropy on each section were characterized by AFM and are summarized in the bottom panels. From section '1' to '6', both the step height and friction anisotropy increase linearly, demonstrating that the frictional anisotropy can be controlled on an artificial surface via step height, too. Furthermore, one can observe that the artificial surface is transparent in the visible range because the step heights are well below the shortest wavelength of visible light.

Figure 7. Artificial polymeric surface (NOA 88), which is replicated by stitching together six snake scales, has variable step height and friction anisotropy at the nano-steps in different areas. Schematic snake on the top represents the direction of the scale stitching and the second panel shows a photo of the resultant polymeric surface. Six pieces of snake scales were stitched and replicated in NOA 88. They are numbered from left to right by '1'–'6' in the photo. Sections marked by '1' and '2' are replicated from snake head scales, '3' and '4' are from middle sections, and '5' and '6' are from the snake tail. Two panels at the bottom show the averaged step height as well as the friction anisotropy characterized by AFM in each section. Each data point was calculated from five different positions in the same section, and the error bars correspond to the statistical error. Step height and friction anisotropy increase from section '1' to section '6', which is indicated by the dashed lines.
Download figure:
Standard image High-resolution image
With the presented design, the direction and magnitude of friction anisotropy could be controlled on artificial surfaces via the height of the nano-steps. However, the current fabrication approach is based on the replication of snake scales with a polymer. This material exhibits comparable large friction coefficients (typically more than 0.4, see figure 6 (b)) and only low frictional anisotropy (see figure 7). Therefore, more advanced lithography processes might be applied in the future to allow for the fabrication of metal or ceramic surfaces with dedicated frictional anisotropy for advanced tribological surfaces.
4. Conclusion
In summary, the frictional performance of snakes is determined by both material and structural properties of their ventral scales. The material properties are important for reducing resistance with low friction coefficients, while the nanoscale step structure contributes mostly to the generation of friction anisotropy. The nano-steps cause a larger friction coefficient in the snake's backward motion, but produces no impact for forward direction, which depends mainly on the material properties. Friction measurements on a polymeric replica of the N. atra scale confirms this result. Higher nano-steps induce larger friction anisotropy. Interestingly, snakes even exhibit diverse sections of frictional anisotropy through a step height distribution, which seems to be optimized for frictional performance. Inspired by this, a polymeric surface with different step heights leading to diverse friction anisotropy in different areas was fabricated. Desirable friction anisotropy could be achieved by embedding nano-steps on metals or ceramics, promising advanced tribological surfaces.
Acknowledgments
We thank Richard Thelen for his kind support during AFM measurements, Alban Muslija for the introduction to SEM, and Sanaz Rastjoo for micromanipulation experiments in SEM. We thank Georg Gassner and Felix Hulbert for the samples of molted skin of sandfish and Philippe Wolf for helping with the supply of shed snake skins. We gratefully acknowledge financial support through the 'Ideenwettbewerb Biotechnologie-Von der Natur lernen' of the 'Ministerium für Wissenschaft, Forschung und Kunst Baden-Württemberg' (7533-7-11.10-22). WW and SY gratefully acknowledge a scholarship from the China Scholarship Council (CSC). GG gratefully acknowledges support from the Helmholtz Postdoc Program and from the Karlsruhe School of Optics and Photonics. This work was carried out with the partial support of the Karlsruhe Nano Micro Facility (KNMF, www.kit.edu/knmf), a Helmholtz Research Infrastructure at Karlsruhe Institute of Technology (KIT, www.kit.edu).