A Newly Emerging Thermal Area in Yellowstone
 R. Greg Vaughan
 Jefferson D. G. Hungerford2
 - 1U.S. Geological Survey, Astrogeology Science Center, Flagstaff, AZ, United States
- 2National Park Service, Yellowstone Center for Resources, Mammoth, WY, United States
Yellowstone is a large restless caldera that contains many dynamic thermal areas that are the surface expression of the deeper magmatic system. In 2018, using a Landsat 8 nighttime thermal infrared image, we discovered the emergence of a new thermal area located near Tern Lake on the northeast margin of the Sour Creek dome. A high-spatial-resolution airborne visible image from August 2017 revealed a large (~33,300 m2) area of recently fallen trees, mostly devoid of vegetation, with bright soil, similar to other nearby thermal areas. Field observations in August 2019 confirmed that this was a steam-heated, acid-sulfate thermal area, with an arc-shaped zone of hydrothermally altered soil and heated ground, with surface temperatures of 60–80°C, several steaming fumaroles, and boiling temperatures (93°C) just beneath the surface. Fallen trees in contact with warm ground were being carbonized, yet new trees were growing in some cooler areas. Observations of stressed or dying vegetation from archived satellite and airborne remote sensing data going back to 1994 indicated that this thermal area started emerging around 2000. It increased in size slowly until around 2005, when the radiative heat output started measurably increasing. From 2005 to 2012, it grew more rapidly; and from 2012 through 2019, the growth rate slowed and the heat output stabilized. We predict that this stabilizing trend will continue in the coming years. The initial formation of this new thermal area was not clearly linked to any distinct seismic or geodetic events, although the period of rapid growth partly coincided with a period of rapid local uplift, possibly suggesting a causative relationship. The identification of this emerging thermal area illustrates the importance of satellite thermal infrared imaging combined with high-spatial-resolution remote sensing data and field observations for mapping, measuring, and monitoring Yellowstone's thermal areas. It is also an example of the dynamics we expect to observe within large caldera systems like Yellowstone, where changes in the size and distribution of thermal areas are normal and do not indicate an impending eruption nor any significant changes in the broader magmatic system.
Introduction
Large caldera-forming eruptions are some of the most devastating volcanic eruptions that can occur. Although they are rare, and because they are rare, understanding the implications of various modes of unrest that are common at dormant, yet restless caldera systems is important (Newhall and Dzurisin, 1988; Branney and Acocella, 2015). Most volcanic eruptions are preceded by some form of unrest, like anomalous seismic activity, ground deformation, gas emissions, and thermal emissions. One of the great challenges of volcano monitoring is that such unrest is not always followed by an eruption, particularly at large restless caldera systems (Newhall and Dzurisin, 1988; Branney and Acocella, 2015). Yet volcanic unrest alone can also pose hazards (Yellowstone Volcano Observatory, 2019).
Yellowstone is one of Earth's largest caldera systems. Three cataclysmic caldera-forming eruptions occurred there in the last 2.1 million years, the youngest of which resulted in the formation of the Yellowstone Caldera about 631,000 years ago (Figure 1A) (Christiansen, 2001; Matthews et al., 2015). Since then, dozens of rhyolite lava flows have mostly infilled the caldera, the most recent of which was about 70,000 years ago (Christiansen, 2001). Hydrothermal activity is presumed to have been present throughout its history, before and after major eruptive cycles (Morgan et al., 2017). Yellowstone regularly displays active geologic processes typical of restless calderas, such as frequent earthquakes, cycles of ground deformation, and magmatic heat and gas emissions (Newhall and Dzurisin, 1988; Lowenstern et al., 2006). These processes are sometimes interconnected, and when changes are observed, we strive to understand their relationship to each other and to the broader system, as well as the hazards they may pose.
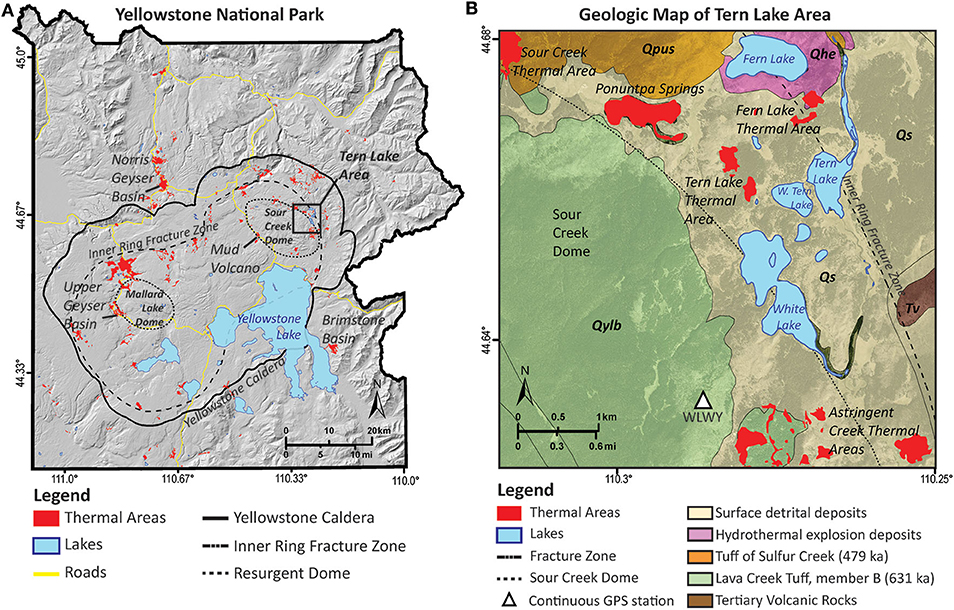
Figure 1. (A) Map of Yellowstone National Park. Most of Yellowstone's more than 10,000 thermal features are clustered into about 120 distinct thermal areas (shown in red). (B) Geologic units and thermal areas in the Tern Lake region (modified from Christiansen, 2001).
Yellowstone currently contains the world's largest and most active hydrothermal system, with thousands of dynamic thermal features that are the surface expression of the deeper magmatic system, a partially molten magma reservoir that warms the overlying rock and groundwater reservoirs (Fournier, 1989; Husen et al., 2004; Lowenstern and Hurwitz, 2008; Morgan et al., 2009). The presence of so many thermal features in the region is the main reason for its designation as the world's first national park in 1872 (Jaworowski et al., 2010; Heasler and Jaworowski, 2018). There are many different types of thermal features, including hot springs, geysers, fumaroles, and mud pots (Werner and Brantley, 2003; Hurwitz and Lowenstern, 2014; Vaughan et al., 2014). These features range in size from a few centimeters to tens of meters across; and they range from just a few degrees above ambient temperatures up to boiling, which ranges from 92 to 94°C (around 200°F) at typical elevations in Yellowstone (Hurwitz et al., 2012; Vaughan et al., 2014). On rare occasions, superheated fumaroles with above-boiling temperatures have been measured, for example at Phantom Fumarole in the southwest region of the park, S. Hurwitz (written communication, 2020) reported a fumarole with a temperature of 137°C (279°F).
To clarify, a thermal feature is a vent, or small cluster of related vents, emitting gases or hot water, or both. A thermal area is a contiguous geologic unit that includes one or more thermal features that is bounded by the spatial extent of hydrothermally altered ground, hydrothermal mineral deposits, geothermal gas and steam emissions, heated ground, and/or an associated lack of vegetation (Evans et al., 2010; Jaworowski et al., 2010; Vaughan et al., 2014).
Yellowstone's thermal features are distributed widely throughout the park, though they tend to be clustered into distinct thermal areas, mostly concentrated along preexisting structures such as the ring-fracture system of the 0.631 Ma Yellowstone Caldera, along edges of resurgent domes, or along edges of intra-caldera rhyolite flows (Figure 1A) (Christiansen, 2001; Morgan et al., 2009; Hurwitz and Lowenstern, 2014; Matthews et al., 2015). Many of the thermal areas are deep in the backcountry and not easily accessible. Therefore, satellite and airborne remote sensing tools are used to augment field-based observations and measurements of thermal areas (Vaughan et al., 2014).
The focus of this study, the Tern Lake thermal area, is located on the northeast margin of the Sour Creek resurgent dome about 18 km (11 mi) from the nearest trailhead around a group of lakes (Figure 1B). Geologically, it is located within Quaternary surface sedimentary deposits sandwiched between the inner ring fracture zone of the Yellowstone Caldera and the northeast edge of the Sour Creek resurgent dome, which formed soon after the collapse of the caldera and is marked here by the exposure of Lava Creek tuff (Christiansen, 2001). Several other thermal areas are also located along this NW-SE trending zone (Figure 1B).
Mapping and characterizing thermal areas in Yellowstone is important for establishing an understanding of baseline thermal activity so that we are better equipped to detect future changes that may occur—changes that may be related to human activities (such as the development of geothermal resources outside the park or infrastructure development inside the park), natural seasonal hydrologic cycles, or geothermal changes that may reflect the dynamics of the magmatic-hydrothermal system (Pitt and Hutchinson, 1982; Yellowstone Volcano Observatory, 2006, 2019; Friedman, 2007; Hurwitz and Lowenstern, 2014). Thermal monitoring in Yellowstone is part of a broader monitoring system developed and implemented by the Yellowstone Volcano Observatory that also includes the monitoring of earthquakes, ground deformation, gas emissions, and water chemistry (Yellowstone Volcano Observatory, 2006). The goal of this monitoring network is to (1) provide high-quality data for the scientific study and interpretation of a large but currently dormant volcanic system; (2) provide timely information in the event of a seismic, volcanic, or hydrothermal crisis; and (3) try to anticipate potentially hazardous events before they occur (Yellowstone Volcano Observatory, 2006). Thermal monitoring is also important for supporting decisions regarding Yellowstone National Park's infrastructure development, resource protection, and visitor safety.
A History of Change
There are many examples of localized changes in Yellowstone's thermal areas. Sometimes they occur coincident with local seismic or geodetic activity, and sometimes they do not. In August 1972, a change in numerous thermal features occurred just north of the Yellowstone Caldera at Norris Geyser Basin (Figure 1A), including increased turbidity in thermal waters, appearance of new thermal features, temperature increase in some springs, and a change in the eruptive behavior of some geysers. These thermal area changes were followed 2 days later by a local earthquake swarm of hundreds of small earthquakes from August through September 1972 (Trimble and Smith, 1975; Pitt and Hutchinson, 1982). In May 1978, a 7-month-long seismic swarm of hundreds of earthquakes occurred with hypocenters located 1 to 5 km below the southwest end of the Mud Volcano thermal area (Figure 1A) on the southwest margin of Sour Creek dome (Pitt and Hutchinson, 1982; Evans et al., 2010; Hurwitz et al., 2012). Following the seismic swarm, from December 1978 through July 1979, clear signs of increased heat output were detected at the surface, including increased soil temperatures, temperature-induced tree mortality, increased CO2 emissions, increased activity in existing thermal features, and the formation of new mud pots and fumaroles in the Mud Volcano thermal area (Pitt and Hutchinson, 1982; Evans et al., 2010; Hurwitz et al., 2012). By the winter of 1979-1980 the increased thermal activity began to decline and return to pre-1978 levels (Evans et al., 2010; Hurwitz et al., 2012).
In 2003, a significant thermal disturbance occurred in and around Norris Geyser Basin (Yellowstone Volcano Observatory, 2003). Steamboat Geyser erupted three times in 2003 (in March, April, and October)—after having erupted only three times in the previous 12 years, once in 2000 and twice in 2002 (Lowenstern et al., 2003). Also in March 2003, a new thermal area was found west of Nymph Lake, just north of Norris Geyser Basin. The new thermal area consisted of a 75-m-long line of boiling fumaroles that formed on a forested hillside about 200 m from the northwest shore of Nymph Lake (Lowenstern et al., 2003). Issuing from the fumaroles, fine mineral fragments coated nearby vegetation; and trees within about 4 m of the lineament died from increased ground temperatures and gases (Lowenstern et al., 2003). Several changes also occurred in the southern end of Norris Geyser Basin. The water temperature in the Porkchop Geyser vent increased significantly from early April to early July and it erupted on July 16, 2003, for the first time in many years. An east-west trending line of new thermal features developed about 40 m east of Porkchop Geyser (Jaworowski et al., 2006). The water from many active geysers either drained away or was boiled off, leaving hissing steam vents; and other active geysers started erupting more frequently. Increased ground temperatures were also noted in the southern end of Norris Geyser Basin. Temperatures up to 93°C (200°F) just beneath the ground surface were measured in areas that were previously cool; vegetation in the area died and began to break down due to the high temperatures and a new mud pot formed along a hiking trail, which prompted the National Park Service to temporarily close the trail (Lowenstern et al., 2003; Yellowstone Volcano Observatory, 2003). Eventually, the boardwalks and trails were reconfigured to accommodate the changes to the thermal area. Basin-wide thermal disturbances are common at Norris Geyser Basin, occurring approximately annually, and are likely related to seasonal fluctuations in groundwater pressure and how the water table interacts with the hydrothermal system (White et al., 1988; Fournier et al., 2002). The 2003 thermal disturbance was an exceptional one in terms of its magnitude (Lowenstern et al., 2003), yet these changes happened with local seismicity remaining at or below background levels. Uplift in the Norris area from 1996 through 2001, measured with Interferometric Synthetic Aperture Radar (InSAR) techniques, could have been causally related to these changes, as dilatation of the upper crust increases permeability in the hydrothermal plumbing system (Wicks et al., 2006, 2020).
September 2018 provided another example of Yellowstone's typical thermal area dynamics, with some spectacular changes along the west margin of Mallard Lake dome in Upper Geyser Basin (Figure 1A), home of the famous Old Faithful Geyser (Yellowstone Volcano Observatory, 2018). Geyser Hill, located across the Firehole River from Old Faithful, hosts dozens of hot springs, geysers, and fumaroles. In early September 2018, some visitors observed that a few normally calm hot pools were expelling more water than usual, while others were boiling. On September 15, Ear Spring erupted water 6 to 9 m (20 to 30 ft) high. Eruptions of Ear Spring are rare; the last large one occurred in 1957 (Bryan, 2008). In addition to water, the eruption ejected some rocks and several decade's worth of human-derived debris, including coins, soda cans, a cinder block, and a baby's pacifier (https://www.livescience.com/63768-yellowstone-geyser-garbage-eruption.html). Following the eruption, hot water continued to overflow from the spring, occasionally spouting up to 0.6 m (2 ft) high and killing the spring's surrounding orange-to-yellow bacterial mats with hot-water overflows. Also on Geyser Hill, (1) a new thermal feature formed directly beneath the boardwalk, splashing hot water between the wooden slats of the boardwalk and a new feature on the Solitary Geyser/Observation Point trail started splashing boiling water onto the trail, prompting the National Park Service to temporarily close the trail; (2) Doublet Pool started exhibiting boiling surges up to 0.6 m (2 ft) high, resulting in overflow that killed some of its surrounding bacterial mats; (3) an unnamed geyser on the Observation Point side of the boardwalk that had never been known to erupt, began erupting water to 3 to 4.5 m (10 to 15 ft) high; (4) Lion Geyser, which typically erupts many times per day, went quiet for 3 days; (5) North Goggles geyser erupted for the first time since August 2018 and began erupting on 12- to 20-min intervals; and (6) Pump Geyser started drying out to the point that its bacterial mats went dry (Yellowstone Volcano Observatory, 2018). These thermal feature changes in Upper Geyser Basin occurred in the absence of anomalous seismic and geodetic activity.
Brimstone Basin, which lies outside the southeast margin of Yellowstone Caldera near the southeast arm of Yellowstone Lake (Figure 1A), is an example of a thermal area that was once warm but is no longer thermally emissive. Bergfeld et al. (2012) described it as an active acid-sulfate thermal area located near the Southeast Arm of Yellowstone Lake. The evidence of its past hydrothermal activity is (1) heavily acid-sulfate-altered ground that is mostly barren of vegetation and (2) hydrothermal mineral deposits, including sulfur and sulfur-bearing minerals. Brimstone Basin currently exhibits substantial CO2 and H2S emissions that are comparable in magnitude to those in warm acid-sulfate areas, but it does not have fumaroles nor mudpots and shows no discernible surface thermal anomaly from either satellite thermal infrared data or field-based observations (Bergfeld et al., 2012; Vaughan et al., 2014). Also, numerous other, either cold degassing or inactive, thermal areas in Yellowstone were once warmer but have yet to be characterized in the field (Vaughan et al., 2014).
The purpose of this work is to communicate the characterization of a newly emerging thermal area that was recently discovered on the northeast margin of the Sour Creek resurgent dome in Yellowstone National Park (Figure 1A). Evidence for the newly emerging thermal area was initially derived from the analysis of Landsat 8 nighttime thermal infrared images. Additional remote sensing data sets were used to characterize the area in more detail and archived data were used to estimate when the area started appearing and how it evolved over time. A combination of several satellite and airborne remote sensing data sets were used, including thermal infrared data from the Landsat 8 Thermal Infrared Sensor (TIRS) and NASA's Advanced Spaceborne Thermal Emission and Reflection Radiometer (ASTER); visible-near infrared data from Landsat 7; the French commercial satellite system, Satellite Pour l'Observation de la Terre (SPOT); high spatial resolution commercial satellite data from QuickBird-2 and WorldView-2; and high spatial resolution airborne data acquired by the National Agriculture Imagery Program (NAIP) and its predecessor, the National Aerial Photography Program (NAPP). The evolution of the new thermal area was also compared to archived seismic and ground deformation data. Observations and measurements from the first geologic field excursion to this area, conducted in August 2019, are also reported.
Data and Methods
GIS Data
The Geology Department and Spatial Analysis Center at the Yellowstone Center for Resources in Yellowstone National Park maintains an ArcGIS geodatabase of thermal features (points) and thermal areas (polygons) in Yellowstone. Information on many of these thermal features is also hosted by the Montana State University, Yellowstone National Park Research Coordination Network (http://www.rcn.montana.edu). Thermal feature and thermal area locations have been characterized and mapped based on a combination of many years of field mapping and digital mapping on high spatial resolution (1 m per pixel) color digital orthophotos, including those available from the NAIP. Field-based validation of the thermal area boundaries mapped from high-resolution remote sensing data has shown remarkable spatial accuracy of the thermal area polygon geodatabase. The mapping of thermal area polygons is also augmented by using moderate spatial resolution (90 to 100 m per pixel), satellite-based thermal infrared data from Landsat 8 TIRS and ASTER (Vaughan et al., 2014). While these data are not of sufficient spatial resolution to map the thermal area boundaries with high accuracy, they provide quantitative information on thermal activity and are used to assess changes over time.
Thermal Infrared Data
Landsat 8 was launched in February 2013 and has two instruments onboard: the Operational Land Imager (OLI) and the Thermal Infrared Sensor (TIRS) (Roy et al., 2014). The ASTER instrument was launched on NASA's Terra spacecraft in December 1999 and started acquiring data around March 2000 (Yamaguchi et al., 1998). The relevant measurement specifications of each instrument are listed in Table 1.
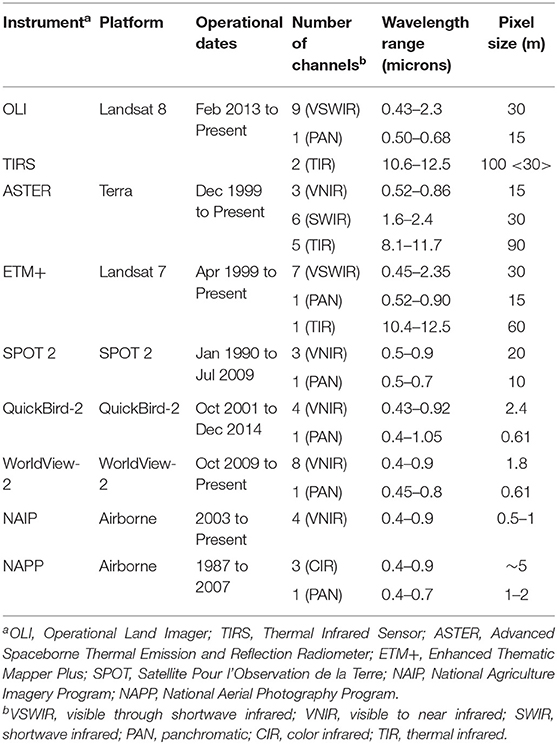
Table 1. Remote Sensing data used in this study.
Both Landsat 8 and ASTER are in a sun-synchronous orbit inclined about 8 degrees from geographic north, which results in a nadir revisit time of 16 days. ASTER has the ability to point off-nadir and acquire data over selected targets more frequently (e.g., every 4 days) if needed (Duda et al., 2009). Both satellite platforms can acquire daytime data during the descending (north-to-south) orbit on the sunlit side of the planet and can acquire nighttime data on the ascending (south-to-north) orbit on the nighttime side of the planet. ASTER data have a swath of 60 km and thus cannot image all of Yellowstone's thermal areas in a single scene or in a single orbit. Landsat 8 scenes have a 185-km swath that does completely cover Yellowstone with a single scene (daytime path 38 row 29; nighttime path 132 row 215). To characterize thermal areas that are subtle (i.e., small in area with sub-boiling temperatures) nighttime data are preferred because this minimizes the effects of solar radiance on surface thermal emission. Thermal areas are more distinct in thermal infrared data acquired during winter months, so we used only thermal infrared data from November through May.
As Landsat 8 is a global mapping mission, it routinely acquires daytime data and covers the entire Earth every 16 days. Landsat 8 nighttime data are not acquired routinely but can be requested over selected targets (https://landsat.usgs.gov/landsat-data-acquisition-request). In a given year, Landsat 8 will acquire at most ~44 scenes over Yellowstone—half daytime and half nighttime. Due to occasional cloud cover (assessed by visual inspection) and occasional periods where no nighttime data were collected, Landsat 8 acquired from 1 to 4 clear nighttime scenes each winter since 2014. A total of 13 Landsat 8 thermal infrared scenes were analyzed in this study (Table 2).
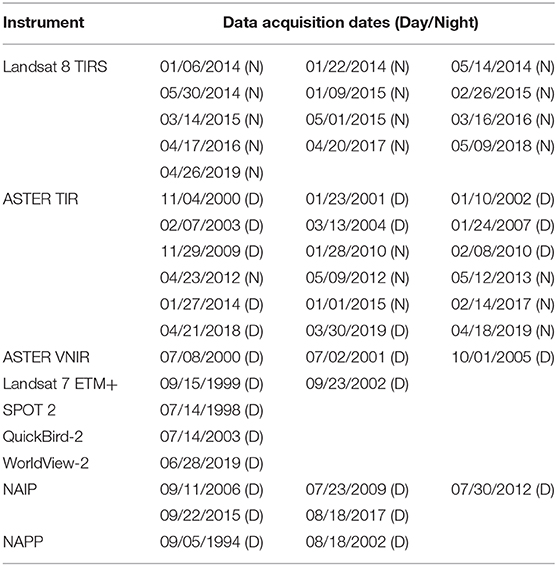
Table 2. Acquisition dates for remote sensing data used in this study.
The goal of the ASTER mission is to acquire data over targeted areas of the Earth's surface. Thus, the ASTER instrument is not always collecting data, either day or night. ASTER data have been acquired over Yellowstone on an irregular basis. The instrument may be tasked to acquire data over certain targets using an online data acquisition request tool (lpdaac.usgs.gov/tools/dar-tool). To maximize temporal thermal information about the newly emerging thermal area at Tern Lake, we used both daytime and nighttime data with ASTER. Considering occasional cloud cover (assessed by visual inspection), ASTER acquired from 0 to 2 clear scenes each winter since 2000. A total of 18 ASTER thermal infrared scenes were analyzed in this study (Table 2).
Radiance at thermal infrared wavelengths is dominated by thermal emission from Earth's surface. Emitted radiance in the thermal infrared is primarily a function of surface temperature and secondarily a function of surface emissivity (Kealy and Hook, 1993; Gillespie et al., 1998). To detect the presence or absence of a thermal area and map its location and spatial extent, level 1B data (i.e., radiance measured at the sensor) were used for both Landsat 8 TIRS and ASTER. To calculate surface temperatures, at-sensor radiance data were converted to radiometric temperatures for Landsat 8 TIRS channel 10 (10.88 microns) and ASTER channel 13 (10.66 microns) using an emissivity normalization method (Kealy and Hook, 1993). An emissivity of 0.960 was used for rock and soil surfaces and an emissivity of 0.985 was used for water (Baldridge et al., 2009). The background removal method of Vaughan et al. (2014) was used for estimating other thermal area characteristics such as geothermal radiant emittance (in W/m2) and geothermal radiative power output (in MW).
Visible and Near Infrared Data
Archived visible-near infrared images from satellite and airborne remote sensing platforms dating back to the mid-1990s and early 2000s were needed to assess when the new thermal area started appearing. Also, high spatial resolution images allowed detailed mapping of the spatial extent of the thermal area. These data included moderate spatial resolution satellite data from Landsat 7 Enhanced Thematic Mapper Plus (ETM+), ASTER, and SPOT; high spatial resolution commercial satellite imagery from QuickBird-2 and WorldView-2; and air photos from the NAIP and its predecessor the NAPP. The relevant measurement specifications of each of these instruments are listed in Table 1 and the acquisition dates of the data used are listed in Table 2.
The French space agency, Center National D'Etudes Spatiales, launched the first of its commercial satellites, SPOT, in February 1986. To date, there have been seven SPOT satellites, with SPOT 6 (launched in September 2012) and SPOT 7 (launched in June 2014) still operating. Data from the SPOT 2 satellite, which operated from January 1990 to July 2009, were used here. Landsat 7, launched in April 1999, carries the ETM+ instrument and is still operational today (Thome, 2001). QuickBird-2 and WorldView-2 are high-resolution satellite sensors owned and operated by DigitalGlobe, Inc., a commercial vendor of satellite imagery; their copyrighted image data are available to Federal Government users under the NextView Imagery End User License Agreement.
The NAIP, administered by the U.S. Department of Agriculture Farm Service Agency through the Aerial Photography Field Office, began in 2003 with the goal of acquiring high spatial resolution aerial imagery over the entire continental U.S. every few years (Hulet et al., 2014). Images were acquired during the agricultural growing seasons from August through October (https://www.fsa.usda.gov/programs-and-services/aerial-photography/imagery-programs/naip-imagery). In the earlier years, color film was used to collect data, but by 2009 all the data were acquired using digital sensor technology. The most recent NAIP images over Yellowstone were from 2017. The predecessor program, NAPP, operated from 1987 to 2007. This program was an interagency collaborative project coordinated by the U.S. Geological Survey (USGS) to acquire cloud-free aerial photographs over the continental U.S. on a 5- to 7-year cycle. The NAPP photo collection includes black-and-white panchromatic and color infrared images, which used film sensitive to green, red, and near-infrared wavelengths. The spatial resolution of the NAPP images varied depending on the camera used and the flight altitude but was generally around 2–5 m per pixel (see Table 1).
These visible and near infrared remote sensing data were evaluated for evidence of when the new thermal area started showing signs of changes in vegetation cover and used to make maps of the spatial extent of the thermal area and how it changed with time. The data used included NAPP airborne images from 1994 to 2002, NAIP images from 2006 to 2017, SPOT 2 images from 1998, Landsat 7 ETM+ images from 1999 to 2002, a QuickBird-2 image from 2003, a WorldView-2 image from 2019, ASTER images from 2000-present, and Landsat 8 images from 2013-present. These remote sensing data sets were ordered and downloaded from the USGS Earth Resources Observation and Science (EROS) Center archive (earthexplorer.usgs.gov).
Field Data
On 19-21 August 2019, we conducted a field excursion to the newly emerging thermal area. Helicopter-based oblique visible images were acquired from 100 to 200 m above ground level using a Nikon D90 12-megapixel digital SLR camera and a Nikon D800 36-megapixel digital SLR camera; geotagged thermal infrared images were acquired using a FLIR T650sc thermal infrared camera with a 25° field of view lens. The T650sc camera measured radiance in the 7.5- to 13.0-micron wavelength range with a 640 x 480-pixel uncooled microbolometer, had a measurable temperature range from −40 to 650°C, and a temperature accuracy of ± 1°C. Field-based thermal infrared images were acquired using a FLIR E8 camera, which measured radiance in the 7.5- to 13.0-micron wavelength range with a 320 x 240-pixel uncooled microbolometer, had a measurable temperature range from −20 to 250°C, and a temperature accuracy of ± 2°C. Ground temperatures were also measured with a Digi-Sense type-k thermocouple probe. The perimeter of the new thermal area was mapped on foot using a sub-meter accuracy Eos Arrow Global Navigation Satellite System (GNSS) receiver.
Geophysical Data
Thermal area changes can sometimes coincide with seismic and geodetic (ground deformation) processes, therefore data from seismic and geodetic measurement networks in Yellowstone were analyzed and compared to the timing of observed changes in the new thermal area. One of the ways ground deformation in Yellowstone is measured and monitored is through a network of continuous global positioning system (GPS) stations positioned on monuments throughout the park (Yellowstone Volcano Observatory, 2006, 2019). This instrument network is operated by UNAVCO and can detect millimeter-scale movements of the ground surface. Currently, 15 permanent GPS stations operate within Yellowstone, with several more located in the region around the park (Yellowstone Volcano Observatory, 2019). The GPS station that is closest to the new thermal area, 2.7 km (1.7 mi) to the southwest on the Sour Creek dome, is the White Lake station (WLWY; see Figure 1B). Ground deformation can also be measured using InSAR techniques (Wicks et al., 1998; Dzurisin et al., 2012). With respect to seismic activity, the Yellowstone region experiences from 1,000 to 3,000 earthquakes annually, making it one of the most seismically active areas in the United States (Farrell et al., 2014; Yellowstone Volcano Observatory, 2019). Seismic activity has been measured in the Yellowstone area since the 1970s, and the Yellowstone Seismic Network, maintained and operated by the University of Utah Seismograph Stations, continuously records seismic data from 46 stations in the Yellowstone region (Yellowstone Volcano Observatory, 2019).
Results
Remote Sensing Observations and Measurements
Preliminary analysis of a Landsat 8 nighttime thermal infrared (channel 10; 10.83 microns) image from April 20, 2017 revealed a bright patch of pixels, interpreted as elevated surface temperatures, located between West Tern Lake and a previously mapped thermal area called the Tern Lake thermal area (Figure 2A). In nighttime thermal infrared images, lakes usually appear bright because they are warmer than the surrounding land, but in the winter most of Yellowstone's lakes are frozen, often covered in ice and snow from January through May, and so appear dark. In April, some of Yellowstone's frozen lakes, particularly lakes receiving thermal input from nearby warm springs or vents, start to thaw (e.g., West Tern Lake and Fern Lake in Figures 2A,B). A daytime Landsat 8 visible-near infrared image from April 1, 2017 corroborated this interpretation (Figure 2B). This image is a Landsat 8 daytime visible-near infrared image displayed in false color (channels 4-5-3 as RGB) and pan-sharpened with the 15-m-per-pixel panchromatic channel (channel 8). In this image, forested areas are dark green, and snow-covered ground and frozen lakes are white to gray, except where starting to thaw. This image also showed that the location of the mysterious patch of warm pixels was not a thawing lake. It was a patch of ground, free of snow, though not conspicuously different from other forested areas. High spatial resolution (1 m per pixel) NAIP imagery from August 18, 2017 (Figures 2C,D) showed that the mysterious warm area was indeed a patch of land, about 0.03 km2 in size, and with hundreds of recently fallen trees and bright patches of soil, visually similar to other nearby thermal areas.
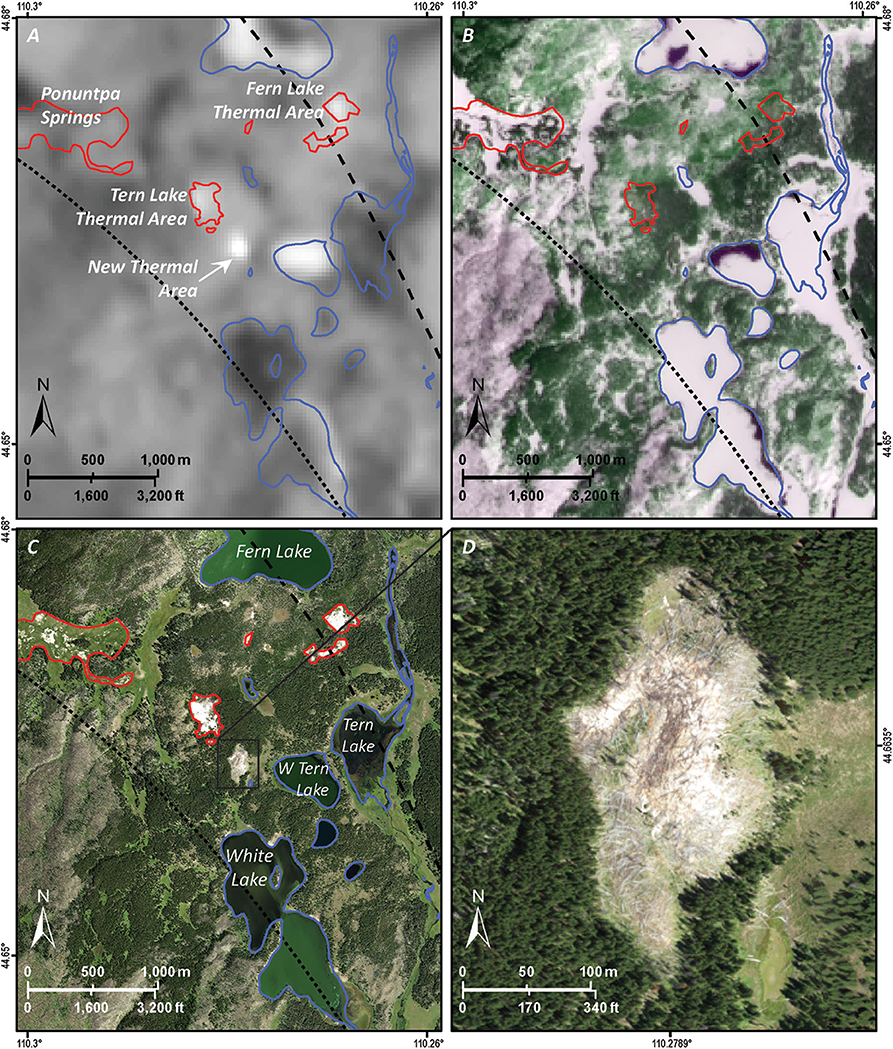
Figure 2. Tern Lake thermal area and proximal surroundings. (A) Landsat 8 nighttime thermal infrared image from April 20, 2017, with thermal areas annotated; (B) Landsat 8 daytime visible-near infrared image from April 1, 2017; (C) NAIP visible imagery from August 18, 2017, with lakes annotated; (D) detailed closeup view of the new Tern Lake thermal area (2017 NAIP imagery). Mapped thermal areas before the discovery of the new area are outlined in red. Lakes are outlined in blue. The margin of the Sour Creek dome is a dotted black line, and the margin of the inner ring fracture zone of the Yellowstone Caldera is a dashed black line.
Archived visible and near infrared remote sensing data were used to estimate when the area started showing signs of vegetation loss. A high spatial resolution black and white airborne image from September 1994 showed that the new thermal area used to be forested (Figure 3A). SPOT imagery from 1998 showed that the area was still covered in healthy forest (Figure 3B). In the SPOT and ASTER imagery in Figures 3B,C,E,H, false color images are shown using the red channel, near infrared channel, and green channel as RGB, respectively. Using this color combination results in healthy vegetation appearing bright green; areas of dead, stressed, or no vegetation appear brown to pink to magenta; areas of bright soil are white in all channels; and water bodies are dark. The first hint of evidence of vegetation stress or loss, a small patch of ground amidst the healthy trees, appears as a pinkish brown spot in the ASTER image from July 2000 (Figure 3C). While other barren areas appear similar in color in this image, these areas were also barren in previous images. What makes the newly barren area conspicuous is its location and that it was previously healthy forest. The patch of land that appears to be newly free of vegetation is clearer in the higher spatial resolution NAPP image from August 2002 (Figure 3D). This is an airborne image acquired with color infrared film; thus, the colors are a bit different from the others. Healthy vegetation from the forest is green to brown, and the patch of land in the middle of the emerging new thermal area is gray in color. By 2005 and 2006, the area of dead and dying trees was larger, as evidenced in the ASTER false color image from 2005 (Figure 3E) and in the NAIP natural color image from September 2006 (Figure 3F). Figures 3G,H,I show the progressive growth of this new thermal area as defined by bright white soils and dead or dying trees. Also notable in the high spatial resolution airborne visible data is an increase in the size of the previously mapped Tern Lake thermal area—on the north side there has been an increase in the area of tree mortality from 2009 to 2017 (compare Figure 3G to Figure 3I).
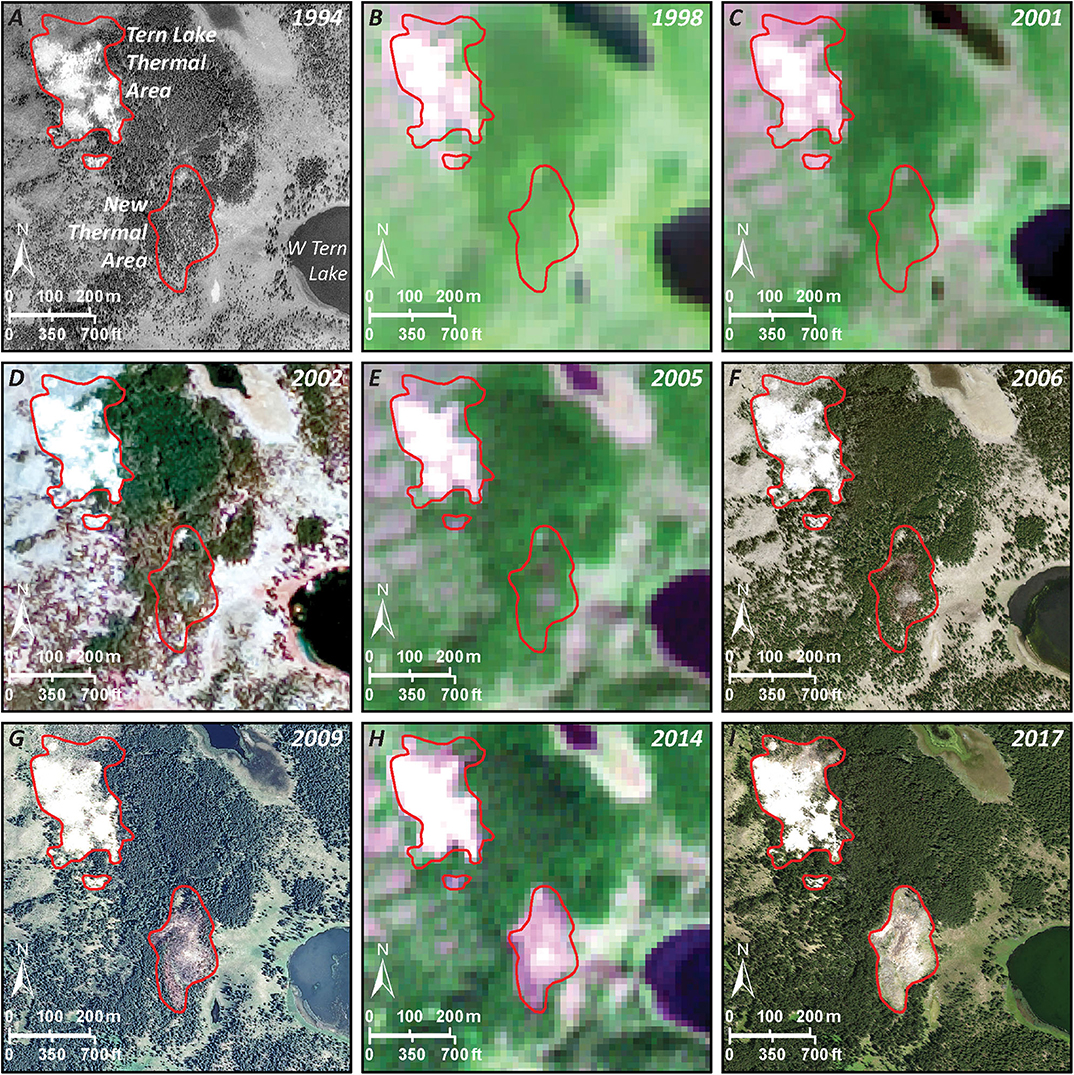
Figure 3. Images of the Tern Lake thermal area showing changes over time. Thermal areas, as currently mapped, are outlined in red. In all images, the northwest corner is located at 44.6686°N, 110.2846°W, and the southeast corner is located at 44.6607°N, 110.2735°W. (A) Black and white air photo from September 1994 with lake and thermal areas annotated; (B) SPOT false color, visible-near infrared image from July 1998; (C) ASTER false color, visible-near infrared image from July 2001; (D) NAPP color infrared film image from August 2002; (E) ASTER false color, visible-near infrared image from October 2005; (F) NAIP natural color visible image from September 2006; (G) NAIP natural color visible image from July 2009; (H) ASTER false color, visible-near infrared image from September 2014; (I) NAIP natural color visible image from August 18, 2017, with lake and thermal areas annotated.
Quantitative estimates of the exposed surface area of the Tern Lake thermal area were based on analyses of archived imagery (Figure 4). ArcGIS polygons were digitized over each image to estimate area. This measurement was repeated multiple times for each image to get an estimate of area measurement uncertainty. For the high-resolution data, area estimates were within 1%; for the moderate resolution data (SPOT, Landsat 7, and ASTER), area estimates, constrained by the high-resolution data estimates, were within 5%. In all cases, the error bars for the data plotted in Figure 4 are smaller than the symbols. The aerial extent of the previously mapped Tern Lake thermal area (northwest of the new area) was about 45,000 m2 in 1994 and remained about the same size until around 2009. From 2009 to 2019, the area of barren vegetation on the north side increased slightly, and slowly, bringing the surface area to about 52,000 m2. The new extension of the Tern Lake thermal area initially appeared as a small area (<225 m2) of barren vegetation around July 2000, which grew slowly until about 2005. From 2005 to 2012, it increased in size more rapidly—from about 3,500 m2 to about 31,000 m2–but has only increased moderately in area since about 2012, to about 33,300 m2. The total surface area of the Tern Lake thermal area and its new extension was about 85,000 m2 as of August 2019.
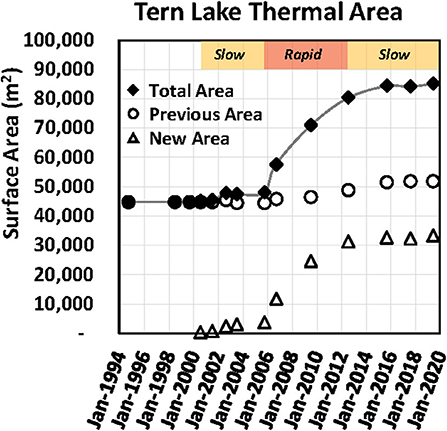
Figure 4. Plot showing the surface area of the Tern Lake thermal area vs. time. Diamonds represent the total area; circles represent the previously mapped thermal area; triangles represent the new thermal area. Error bars are smaller than the symbols and thus not shown. Periods of relatively slow and rapid growth of the new thermal area are highlighted in the boxes above.
Moderate spatial resolution ASTER thermal infrared images of this area date back to the year 2000. Although having a series of images that were acquired regularly under the same conditions would be ideal, this was not available. A clear daytime thermal infrared ASTER image from November 2000 showed the previously known Tern Lake thermal area as a group of bright (warm) pixels but no anomalously warm pixels were visible in the new area (Figure 5A). ASTER daytime thermal infrared images from the winters of 2001, 2002, and 2003 also showed no evidence of increasing warmth in the new thermal area (Figures 5B–D), even though higher spatial resolution visible-near infrared data showed evidence of vegetation stress during this time (Figure 3). The first thermal infrared image that showed a hint of increased radiant heat from the new thermal area was an ASTER image acquired on March 13, 2004 (Figure 5E). An image from January 24, 2007 showed the first unequivocal evidence of increased radiant heat in the new area (Figure 5F). Subsequent ASTER thermal infrared data showed an increasingly obvious larger and warmer spot in this new area (Figures 5G–I). Landsat 8 thermal infrared observations, which began in 2014, were consistent with the most recent ASTER observations.
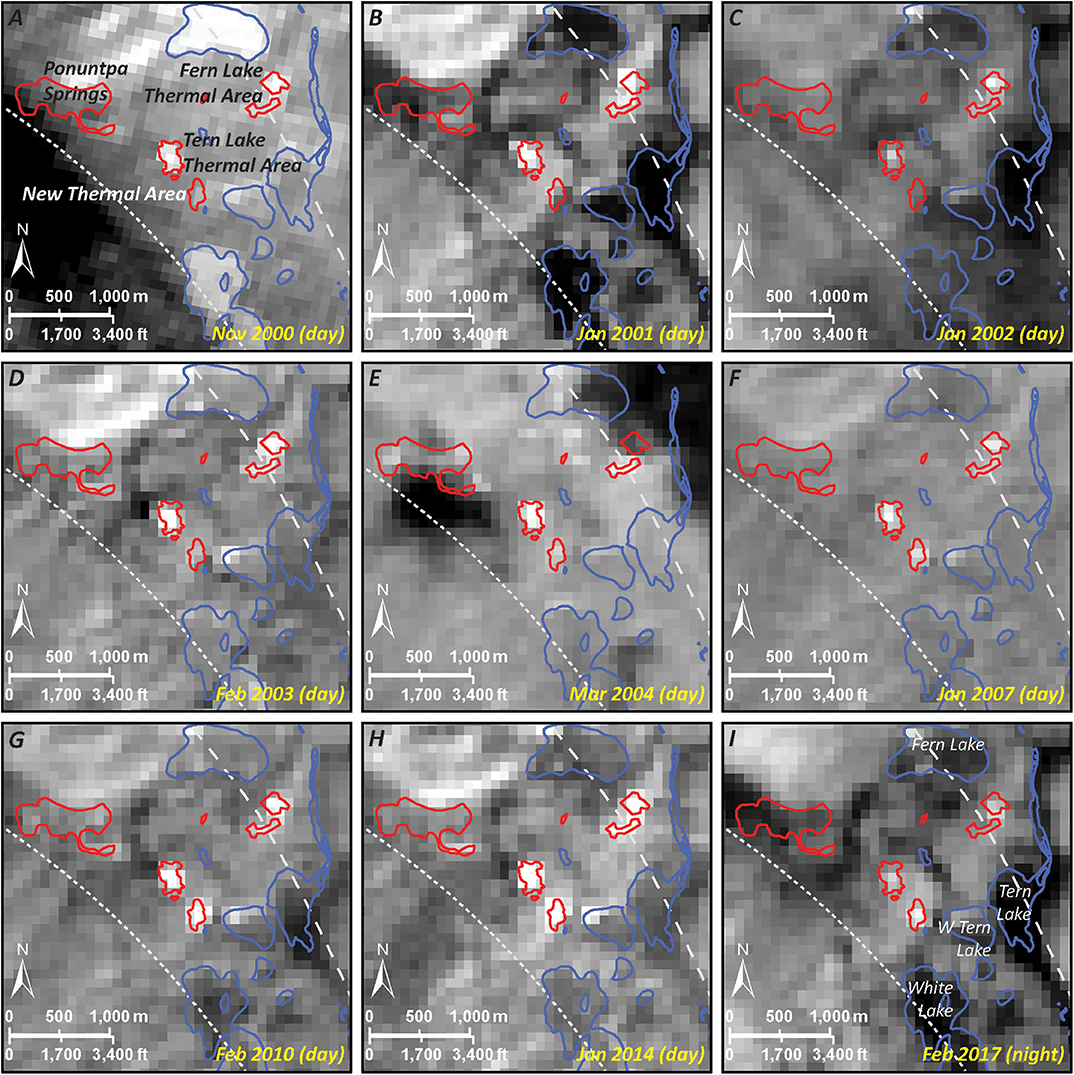
Figure 5. ASTER thermal infrared images of the Tern Lake thermal area showing changes over time. Thermal areas, as currently mapped, are outlined in red. In all images, the northwest corner is located at 44.6807°N, 110.303°W, and the southeast corner is located at 44.649°N, 110.2597°W. (A) daytime thermal infrared image from Nov 4, 2000, with thermal areas annotated; (B) daytime thermal infrared image from Jan 23, 2001; (C) daytime thermal infrared image from Jan 10, 2002; (D) daytime thermal infrared image from Feb 7, 2003; (E) daytime thermal infrared image from Mar 13, 2004; (F) daytime thermal infrared image from Jan 24, 2007; (G) daytime thermal infrared image from Feb 8, 2010; (H) daytime thermal infrared image from Jan 27, 2014; (I) nighttime thermal infrared image from Feb 14, 2017, with lakes annotated. Lakes are outlined in blue. The margin of the Sour Creek dome is a dotted white line, and the margin of the inner ring fracture zone of the Yellowstone caldera is a dashed white line.
In addition to the Tern Lake thermal area and its newly emerging extension, warm spots were detected within some of the lakes in this area. In the winter when these lakes are frozen, they are cold, represented by darker pixels in thermal infrared images. However, in several of these thermal infrared images, warms spots were detected on the northwest side of West Tern Lake and on the west side of Fern Lake (Figure 5). These were hypothesized to be caused by thermal input from nearby hot springs or underwater vents. This hypothesis was confirmed during field work in August 2019 (described below).
Thermal infrared data from both ASTER and Landsat 8 were used to estimate surface temperature (in °C), geothermal radiant emittance (in W/m2), and geothermal radiative power output (in MW) (Vaughan et al., 2014). For each thermal area and each proximal background area, radiometric pixel temperature maps were made. Pixels within each thermal area that had a radiometric pixel temperature greater than 0, 1, 2, 3, and 4 standard deviations (σ) above the mean background temperature were classified. This incrementally highlights the spatial extent of the warmest parts of each thermal area. For each of these classified regions, radiant emittance was calculated from the Stefan-Boltzmann law on a pixel-by-pixel basis. The geothermal component of the radiant emittance was calculated by subtracting the average radiant emittance of the background area. The geothermal radiant power output was calculated by multiplying by the corresponding pixel area and summed for all the classified pixels in the thermal area. ASTER thermal infrared data with 90-m pixels were resampled to 30-m pixels using a cubic convolution resampling. This was done to mimic, as closely as possible, the Landsat 8 thermal infrared data, which have 100-m pixels that are resampled to 30-m pixels in a similar way. The results of ASTER and Landsat 8 thermal infrared data analyses are not perfectly comparable for reasons that will be discussed below. However, plotting the results of their respective data values is useful for assessing any trends.
A plot of the estimated geothermal radiative power output values was derived from all available ASTER thermal infrared data (from 2000 to 2019) and Landsat 8 thermal infrared nighttime data (from 2014 to 2019), for all pixels in the Tern Lake thermal area that were >2σ above background (Figure 6). Based on the radiometric temperature accuracy of Landsat 8 channel 10 (0.87°C; Barsi et al., 2014) and ASTER channel 13 (0.4°C; Tonooka et al., 2005), the resultant estimates for geothermal radiative power output varied by less than 1% and this uncertainty propagates through the data processing. There are other sources of uncertainty in calculating geothermal radiative power output values from thermal infrared radiance measured at the satellite sensor, such as atmospheric compensation, emissivity assumption, and background area selection. But the purpose here is just to show a trend, so all of these factors were held internally consistent. All of the Landsat 8 data are nighttime data; they vary in acquisition month from January through May. The ASTER data are a mixture of daytime and nighttime data and vary from November through May. This is important because geothermal radiative power output estimates may exhibit variations of up to 2.5 MW due to day vs. night data acquisition times or due to seasonal variations (Figure 6). Also, Landsat 8 data tend to have lower geothermal radiative power output estimates than ASTER from the same time period. This is due to differences in the way the data are acquired and processed (see discussion section). The overall trend in geothermal radiative power output values for the entire area (diamonds) is relatively low and stable from 2000 to 2004, a notable increase after 2004 until about 2012, and a general flattening or possibly slight decrease since 2012. The values for just the newly identified thermal area (triangles) show the same trend. This trend is also similar to the trend in thermal area size increase shown in Figure 4.
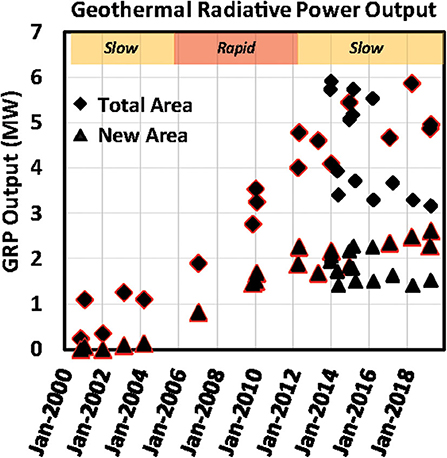
Figure 6. Plot showing geothermal radiative power output of the Tern Lake thermal area vs. time. Diamonds represent the total area (i.e., the previously mapped Tern Lake thermal area plus the newly mapped area); triangles represent only the newly mapped area. The difference between these values for any given date is the geothermal radiative power output value for just the previously mapped thermal area. Black symbols are from Landsat 8; black symbols outlined in red are from ASTER. Error bars are smaller than the symbols and thus not shown. Periods of relatively slow and rapid growth of the new thermal area are highlighted in the boxes above.
Field Observations and Measurements
A field visit to the Tern Lake thermal area was conducted on 19-21 August 2019. To our knowledge, this was the first geologic field visit to the new extension of the Tern Lake thermal area. We mapped the perimeter of the new area with GPS, made visual observations of the tree kill zone and photographed the area, measured shallow subsurface ground temperatures with a thermocouple, and measured surface temperatures with a handheld thermal infrared camera. We also collected thermal infrared images and photos of the area from a helicopter.
The newly emerging thermal area was delineated by a large tree kill zone about 33,300 m2 in area (Figure 7A). A northeast-trending, arc-shaped zone of bright, hydrothermally altered soil was coincident with a distinct zone of warm ground, 60–80°C (140–176°F) at the surface, with boiling temperatures (93°C, or 200°F) a few centimeters beneath the surface (Figure 7B). Several steaming fumaroles had boiling temperatures at the surface. The warm arc was conspicuous and well-delineated; there were places where ground temperatures were ambient, with boiling temperatures just a few meters away. Downed trees within the warm arc showed carbonization on their surfaces that were in contact with the warm ground, and where they were exposed to fumaroles, sulfur crystals covered the carbonized wood. No water was effusing from the area—it was a dry, steam-heated acid sulfate thermal area. In some of the cooler areas, young (less than 5 years old) trees were growing amidst previously fallen trees.
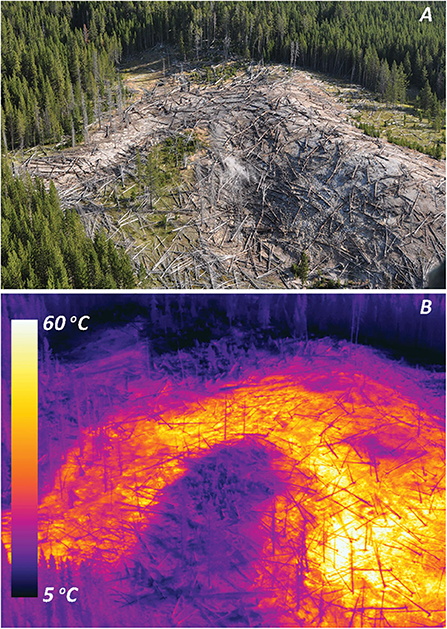
Figure 7. Photos of the new thermal area from August 2019. (A) Oblique aerial photo from helicopter looking northeast (photo credit: M. Poland); (B) Oblique aerial thermal infrared image from approximately the same position (photo credit: G. Vaughan). The width of each image is about 120 m.
Field observations of West Tern Lake also revealed multiple warm springs along the shoreline and small bubbling underwater vents on the north and northwest side of the lake. One of the shoreline springs had 56°C (133°F) water flowing into the lake out of a small, mature-looking sinter cone. Helicopter-based observations also revealed a large bubbling zone within the southwest and southeast sections of Fern Lake. These observations explain the thawed sections of these frozen lakes that can be seen in Figure 2B as well as the warm spots in many of the thermal infrared images in Figure 5.
Geophysical Observations and Measurements
Ground deformation data near the new thermal area were recorded by the WLWY GPS station (Figure 1B) starting in mid-2001 (www.unavco.org/instrumentation/networks/status/pbo/overview/WLWY). A time series was plotted, from mid-2001 through 2019, of the vertical height component (detrended data product) from this station (Figure 8). Information about ground deformation in the Sour Creek dome area from prior years is available from InSAR data analyses (Wicks et al., 1998, 2006) and ground-leveling surveys (Dzurisin et al., 1990, 1994, 2012). InSAR data from Wicks et al. (2006) show subsidence in this area from 1996 to 2002. In January 2005, WLWY began a relatively rapid inflation period, rising about 200 mm from January 2005 to July 2009. This was followed by a period of subsidence of about 100 mm until April 2014. Then a short inflation period of about 50 mm resumed until August 2015, and the area has been subsiding ever since (through December 2019).
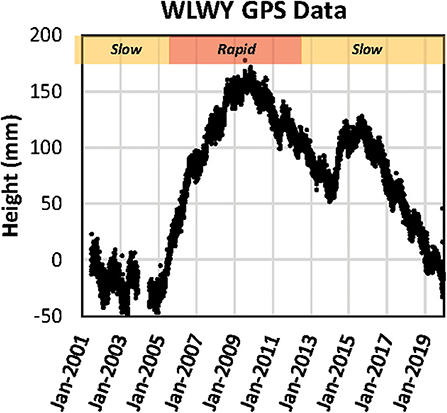
Figure 8. Ground surface height data from the White Lake (WLWY) continuous GPS station from July 2001 to December 2019. Periods of relatively slow and rapid growth of the new thermal area are highlighted in the boxes above.
Earthquake data from the University of Utah Seismograph Stations archive (J. Farrell, written communication, 2019) and from the USGS Advanced National Seismic System Comprehensive Earthquake Catalog (https://earthquake.usgs.gov/earthquakes/search) show more than 40,000 earthquakes in the Yellowstone area from 1994 through 2019, with magnitudes ranging from M0.0 to M4.8. There was a spike (more than 3,000 events) in park-wide seismic activity in 1999 (Figure 9A, black bars). Most of these earthquakes were small (less than M3) and located in swarms in the northwest region of the park. Annual park-wide earthquakes also spiked in 2010 and 2017. Locally, the Tern Lake area has been relatively seismically quiet, except for the year 2009 (Figure 9A, blue bars). From 9 to 11 January 2009, 34 earthquakes (largest M3.3) had epicenters located within 5 km (2.5 mi) of the Tern Lake thermal area and depths ranging from 1 to 9 km (0.6 to 5.6 mi) (Figure 9B). This is more earthquakes than had occurred in this area in the prior 25 years. These earthquakes may be an extension of the swarm of earthquakes that occurred in the north part of Yellowstone Lake from December 2008 to January 2009 (Farrell et al., 2010).
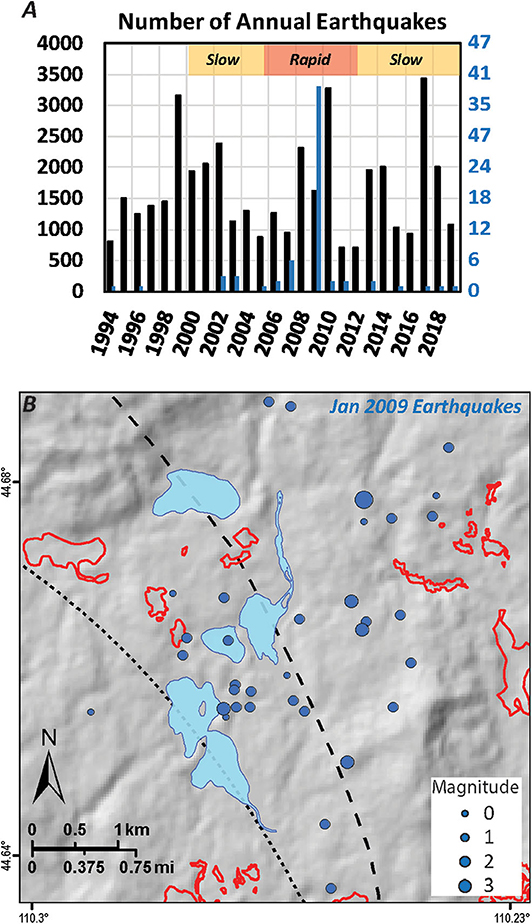
Figure 9. (A) The number of annual earthquakes from 1994 through 2019. Black bars are for the entire park (left axis); blue bars are for epicenters within 5 km of the Tern Lake thermal area (right axis). There were 39 in 2009, 34 of which occurred on 9-11 January 2009. Periods of relatively slow and rapid growth of the new thermal area are highlighted in the boxes above. (B) Map of Tern Lake area showing epicenters of the 34 earthquakes that occurred on 9-11 January 2009.
Discussion
Remote Sensing
All of the visible-near infrared remote sensing data available for this area after September 1994 and before August 2002 were from satellite sensors (e.g., SPOT, Landsat 7, and ASTER) that have 15- to 30-m pixels. Thus, it is possible that the area started emerging earlier than July 2000 but was not resolvable with these data. The first hint of vegetation stress located at the newly emerging extension of the Tern Lake thermal area was from a July 2000 ASTER visible-near infrared image. Measurable ground heating from a pulse of hydrothermal fluids should theoretically precede measurable changes to vegetation because it should take time for vegetation to respond to these stresses. Yet, vegetation stress was the first measurable signal in the remote sensing data. The first hint of increased ground heating in this area was from a March 2004 ASTER thermal infrared image, with the first clear evidence of ground heating found in a January 2007 ASTER thermal infrared image. Although the remote sensing evidence of vegetation stress precedes evidence of increased ground heating by a few years, it is likely that increased ground heating was responsible for the vegetation stress and eventual mortality (Evans et al., 2010). No data are available about geothermal gas emissions from this area, but it can be assumed that gas and steam emissions accompany thermal emissions. ASTER visible-near infrared data have 15-meter pixels, and ASTER thermal infrared data have 90-m pixels. Thus, the visual evidence of increasing vegetation stress (e.g., the browning of trees) is likely to be detected sooner than anomalous increases in thermal emission.
All remotely derived geothermal radiative power output values are underestimates. This is primarily due to sub-pixel thermal mixing and occasional steam interference from venting thermal features. The ideal measurement parameters that result in the least underestimated data values are clear, nighttime, wintertime, ASTER data acquisitions. The scene needs to be free of clouds to provide a clear view of the surface. Clouds are colder than the surface, so any thermal infrared measurements that have intervening thin clouds underestimate surface temperatures. Steam interference masks radiometric surface temperatures in the same way that clouds do. Nighttime and wintertime images exhibit the highest thermal contrast between thermal targets and non-thermal background areas; also, background areas are the coldest at night in the winter. Nighttime data will result in higher geothermal radiative power output estimates than daytime data because the subtracted background is lower. For the same reason, wintertime data will result in slightly higher geothermal radiative power output estimates than fall or springtime data, which will in turn be slightly higher than summertime data. ASTER data have slightly higher geothermal radiative power output estimate than Landsat 8 data because of the way Landsat 8 data are collected and processed. For example, Landsat 8 thermal infrared data are acquired with 100-m pixels but resampled to 30-m pixels to match the spatial resolution of other spectral channels. This results in pixel integrated radiance values that correspond to 100-m pixels but are displayed as 30-m pixels. The effect of this is radiometric temperature and geothermal radiative emittance values that are not proportionate to the pixel area used to calculate the geothermal radiant power output (Vaughan, 2016). Resampling ASTER to 30-m pixels minimized but did not completely remove this effect. Acquiring native resolution (100-m) Landsat 8 thermal infrared data prior to the resampling was not an option. Nevertheless, despite the nature of the calculated geothermal radiant power output values and the various biases that result from different image acquisition parameters, the temporal trend that shows rapid warming between 2004 and 2012 is consistent with the other observations of change in this thermal area.
Geology
Yellowstone's surface thermal features are manifestations of the deeper hydrothermal system, which is driven by an even deeper magmatic system (Fournier, 1989; Husen et al., 2004; Lowenstern and Hurwitz, 2008; Morgan et al., 2009). The location of thermal areas is primarily controlled by preexisting subsurface structures or along edges of intra-caldera rhyolite flows (Christiansen, 2001; Morgan et al., 2009; Hurwitz and Lowenstern, 2014). Structurally, the Tern Lake thermal area is located along a NW-SE trending zone subparallel to the Sour Creek dome margin and the inner ring fracture zone (Figure 1B). Whereas, no faults or structures are mapped within this zone in the Tern Lake region, the location of several thermal areas, including the newly emerging extension of the Tern Lake thermal area, along the same trend suggests that these structures are the primary control on fluid migration from depth to the surface in this region (Figure 1B). Zooming in to the new extension of the Tern Lake thermal area (Figure 2D), however, a conspicuous northeast-trending arc shape delineates the area of highest temperatures, the area of most intensely altered soils, and the shape of the initial vegetation stress zone (Figures 3F,G, 7). This arc has arms with NE-SW trends, which may represent shallower, more localized structures or zones of increased permeability that control fluid flow in the shallow subsurface.
Geophysics
Thermal areas in Yellowstone are dynamic over a range of spatial (individual thermal features to entire thermal areas) and temporal (days to decades) scales (Pitt and Hutchinson, 1982; Thompson and DeMonge, 1996; Friedman, 2007; Hurwitz and Lowenstern, 2014). Seismicity, ground deformation, the pressurized escape of magmatic fluids, and surface changes in thermal areas are processes that can sometimes be causally linked (Pitt and Hutchinson, 1982; Waite and Smith, 2002; Lowenstern et al., 2006; Wicks et al., 2006; Evans et al., 2010). For example, an earthquake swarm was spatially and temporally associated with increased hydrothermal activity at Mud Volcano in 1978-79 (Pitt and Hutchinson, 1982; Evans et al., 2010). While 1978 predates annual ground deformation surveys (Evans et al., 2010), Pelton and Smith (1979) reported evidence from leveling surveys in 1975-77 that this part of the caldera (around Sour Creek dome) had uplifted 700 mm compared to leveling surveys in 1923. Dzurisin et al. (2012) review data from numerous other leveling surveys, which indicate that the Mud Volcano area in 1978-79 was in the midst of an uplift phase that lasted until about 1985. It is possible that pressurized migration of magmatic gases from depth could trigger geophysical processes such as earthquake swarms and ground deformation (Lowenstern et al., 2006; Evans et al., 2010). Annual thermal disturbances at Norris Geyser Basin sometimes occur with no correlation to unusual seismic or geodetic events. However, the exceptional thermal disturbance in 2003 occurred after a period of local uplift from 1996 to 2001, albeit without anomalous contemporaneous seismic activity (Wicks et al., 2006, 2020). The 2018 changes at Upper Geyser Basin (Yellowstone Volcano Observatory, 2018) happened with no apparent relationship to seismic or geodetic activity. Therefore, it is logical to ask whether or not changes in the surface expression of the Tern Lake thermal areas were coincident with, and possibly causally linked to, geophysical processes such as ground deformation or seismic activity.
The GPS data from the nearby WLWY station only go back to mid-2001, so it was not possible to use these data to infer the state of ground deformation in the prior few years when the new thermal area was hypothesized to have begun forming. Based on analysis of InSAR data, Wicks et al. (2006) reported evidence that the caldera floor, including the Sour Creek dome, was subsiding from 1996 to 2002. So, there does not appear to be any change in the local inflation/deflation status associated with the onset of the new thermal area, which began sometime around 2000. The period of rapid growth of the new thermal area from 2005 to 2012 (highlighted with a red box in Figures 4, 6, 8, 9A) does partly coincide with the period of rapid inflation in the area (about 20 cm of uplift in 4.5 years). Thus, it is tempting to suggest a causative relationship. Does a long lag time cast doubt on this causative hypothesis? The beginning of rapid uplift started around January 2005, maybe in mid to late 2004 (Chang et al., 2007). The beginning of the rapid growth phase of the new Tern Lake thermal area started at least 10 months after this (after October 2005; see Figure 4). If a causative relationship existed between the ground deformation and changes in the surface expression of hydrothermal fluid emissions, there would have to be an explanation for the lag time between the onset of inflation and resultant dilatation and the onset of rapid growth of the thermal area at the surface. One explanation could be that rising hydrothermal fluids may take time to reach the surface and kill trees. Precedents for this include, (1) the 2003 thermal disturbance at Norris Geyser Basin that occurred 1 to 1.5 years after the period of local uplift paused (Wicks et al., 2006, 2020), and (2) the increased surface thermal activity at Mud Volcano that occurred several months to a year after the beginning of the 1978 earthquake swarm (Evans et al., 2010). Also, at the Campi Flegrei caldera, there is a 200-day lag time between geochemical changes to surface thermal features and uplift cycles (Chiodini et al., 2015). Another significant lag time in the apparent temporal correlation is that the new Tern Lake thermal area continued to grow rapidly for 2 to 3 years after the inflation peaked and turned into deflation in July 2009. However, if deflation does not necessarily result in contraction of the hydrothermal plumbing system feeding the thermal area, fluid pathways may remain open for a long time.
Some reports of thermal area changes closely coincide with significant seismic activity in the park. A thermal disturbance at Norris Geyser Basin in 1972 was linked to a local contemporaneous earthquake swarm, and similar coinciding events have been observed at Norris several times since the 1940s (Trimble and Smith, 1975; Pitt and Hutchinson, 1982). An earthquake swarm in 1978 was linked to changes in the Mud Volcano thermal area (Pitt and Hutchinson, 1982; Evans et al., 2010; Hurwitz et al., 2012). Evans et al. (2010) suggested that pressure from a pulse of rising magmatic gas (e.g., CO2) triggered the seismic swarm, increasing subsurface permeability, and manifested at the surface several months to a year after the swarm as increased heat, CO2 emissions, and tree kills. Occurrences of increased hydrothermal activity in the form of hydrothermal explosions at the surface in 1985 and 1986, surrounding a large earthquake swarm in October 1985, also marked the end of a long period of caldera uplift. Around July 1985, a hydrothermal explosion in the Mushpots thermal area (about 5 km southeast of Tern Lake) killed a number of trees and formed a crater with a new superheated fumarole (Dzurisin et al., 1994; Waite and Smith, 2002). In January 1986, a hydrothermal explosion in a forested area about 3 km west of Norris Geyser Basin killed trees and formed a large crater about 5 m deep (Dzurisin et al., 1994; Waite and Smith, 2002). Also, instances of distant, very large earthquakes have been reported to trigger changes in the hydrothermal system. The M7.5 Hebgen Lake earthquake just outside the park in August 1959 caused numerous springs to erupt as geysers, turbidity and temperature changes in some hot springs, a change in the eruption interval at Old Faithful Geyser, and previously cold ground to heat up (Rinehart, 1972; Marler and White, 1975; Lowenstern et al., 2006). The M7.3 Borah Peak, Idaho earthquake in October 1983 (about 150 km southwest of Yellowstone) and the M6.1 Yellowstone Park earthquake in June 1975 both caused measurable changes in the eruption characteristics of dozens of geysers (Hutchinson, 1985). Also, surface waves from the M7.9 earthquake that occurred in Denali, Alaska, in November 2002, triggered changes in the eruption periodicity of several geysers, the clarity of water in some hot springs, as well as hundreds of small earthquakes in Yellowstone (Husen et al., 2004; Lowenstern et al., 2006). Thus, dynamic strain associated with surface waves feasibly could affect the underground plumbing system by causing changes in the permeability of the subsurface, opening new hydrothermal fluid pathways to the surface. However, seismic triggering of significant changes in surface thermal areas seems to be rare. While Yellowstone's frequent seismic activity is partly responsible for maintaining permeable subsurface fluid pathways that would self-seal with mineralization without occasional ground shaking (Keith et al., 1978; Waite and Smith, 2002; Shelly et al., 2013), Yellowstone's thermal areas only rarely exhibit significant changes at the surface (e.g., a new thermal area) despite very frequent seismic activity in close proximity to thermal areas. Thus, the 1999 spike in park-wide seismic activity (Figure 9A) around the same time when we hypothesize the beginning of surface changes at the new Tern Lake thermal area (2000) appears coincidental. The vast majority of earthquakes in 1999 were in swarms in northwest region of the park—too far away to cause any significant ground shaking in the Tern Lake area. And there was no significant seismic activity near the Tern Lake area at this time. From 1997 to 2000, no earthquakes >M0.0 occurred within 5 km of Tern Lake. While one well-placed small to moderate earthquake could theoretically create new hydrothermal fluid pathways to the surface and trigger the development of a new thermal area, given that there were no such earthquakes near Tern Lake during this time, and given the large number of earthquakes that occur every year near thermal areas all over Yellowstone that do not result in major thermal area changes, it is unlikely that initiation of new permeable pathways in the Tern Lake area resulted from any earthquakes. In 2010 and 2017, spikes in park-wide seismic activity similar to 1999 had no temporal correlation to changes in the growth of this new thermal area nor any other of which we know.
What about hydrothermal fluid migration triggering earthquakes, similar to the 1978 swarm near Mud Volcano (Pitt and Hutchinson, 1982; Evans et al., 2010)? In January 2009 there was a spike in seismic activity near Tern Lake (Figure 9). There were 34 earthquakes (M0.0–3.3) within 5 km of Tern Lake that corresponded closely in time (about 6 months prior) to the apex of the vertical ground deformation in this area, when the situation changed from inflation to deflation (Figure 8). Many earthquake swarms in Yellowstone occur coincident with transitions between inflation and deflation periods (Smith et al., 2009; Hurwitz and Lowenstern, 2014). While the 2009 earthquakes here were not spatially clustered like many earthquake swarms, they were temporally clustered (all occurred within 2 days) and they were close to the Tern Lake area (Figure 9B). The timing of these earthquakes was right in the middle of the rapid growth phase of the new Tern Lake thermal area (Figure 9A). This timing indicated that they were not related to the beginning of the rapid growth phase, but it is feasible that they were a result of pressurized hydrothermal fluid migration that was occurring during this period of rapid uplift. Also, as noted before, an increase in the tree kill area on the north side of the previously mapped Tern Lake thermal area began around 2009. The temporal correlation of this thermal area change with local seismicity in this case could suggest a causative link.
In summary, the primary similarity between the Tern Lake event described here, the 2003 event at Norris, and the 1978 event at Mud Volcano is that in each case a new area of thermal ground emerged, with increased surface heat flow and tree kills. At first glance, it seems logical to categorize them together and look for relationships between hydrothermal processes at the surface and geophysical processes at depth. But each event is unique with respect to these processes. At Mud Volcano in 1978, thermal area changes lasted for many months and were preceded by earthquake swarms by many months. This happened during a period of local uplift—not at an apex of uplift. At Norris in 2003, thermal area changes lasted for many months and happened during a long peak in local uplift, a year or more after uplift paused. This happened with no anomalous local seismic activity. At Tern Lake, thermal area changes lasted more than a decade, with different phases of slow and rapid growth. The initiation happened during a period of local subsidence with no anomalous local seismic activity. The rapid growth phase happened partly coincident with a period of rapid uplift and continued for 2–3 years after subsidence resumed. A short period of anomalous local seismic activity coincided with the apex of the ground deformation cycle. This happened amidst a multi-year rapid growth phase of the new thermal area and coincident with growth of a previously mapped thermal area. There are certainly important cause and effect relationships between seismic and geodetic processes and hydrothermal fluid flow, though the characteristics of resultant changes in the surface expression of thermal areas are variable.
Caldera Systems and Hazards
Large caldera systems like Yellowstone are capable of immense, far-reaching volcanism, though the largest possible events are the rarest (Newhall and Dzurisin, 1988; Lowenstern et al., 2005). They more frequently exhibit various modes of minor volcanic unrest, such as earthquake swarms, ground deformation, and hydrothermal activity (Lowenstern et al., 2005). In other words, earthquake swarms, ground deformation, and thermal area changes that would raise alarms at smaller, dormant stratovolcanoes elsewhere constitute normal background activity for Yellowstone. Thus, it is important to emphasize that changes in the surface expression of hydrothermal systems, like those reported here, are common at large caldera systems and do not signify an imminent eruption, nor any significant changes to the deeper magmatic system (Newhall and Dzurisin, 1988). This is consistent with historical observations of other large caldera systems that have exhibited periods of unrest that were not followed by an eruption. At Campi Flegrei (the Phlegrean Fields), a large active caldera structure near Naples, Italy, historical records show many examples of seismic activity and ground deformation cycles that are followed by changes in the composition of hydrothermal fluids discharged in the Solfatara fumarole field (Todesco et al., 2004; Lowenstern et al., 2006). Also, Chiodini et al. (2017) reported that Pisciarelli fumarole has been exhibiting geochemical changes and increasing in activity for the last several years (since 2013), similar to the time frame of the rapid growth phase of the Tern Lake thermal area. At Mammoth Mountain, a lava dome complex that lies in the southwestern corner of the Long Valley caldera, a swarm of earthquakes in 1989 led to an increase in magmatic CO2 flux to the surface and new areas of tree kills (Sorey et al., 2000; Farrar et al., 2007). In 2006, the Hot Creek thermal area within Long Valley caldera started exhibiting geyser activity within a popular swimming area that had previously consisted of warm pools (Farrar et al., 2007). To date, these events have caused more human unrest than volcanic unrest.
However, we do not want to minimize hazards that exist in large geothermally active caldera systems like Yellowstone. While the most catastrophic events are the least likely to occur, there are less severe short-term hazards that do occur more frequently: moderate to large earthquakes (M5.5–7.5) and small hydrothermal explosions (Dzurisin et al., 1994), as well as the ever-present hazards associated with thermal areas (e.g., unstable ground, boiling water, and noxious gases). Although most earthquakes in Yellowstone are small (M < 3.0) and not felt, large damaging earthquakes may occur several times per century (Dzurisin et al., 1994; Lowenstern et al., 2005; Christiansen et al., 2007). A hydrothermal explosion is a non-volcanic explosive ejection of steam, water, and rock (Christiansen et al., 2007; Morgan et al., 2009). These occur where pockets of hot subsurface waters violently flash to steam, breaking overlying rocks, ejecting debris, and forming a crater. Hydrothermal explosions occur along a continuum of magnitudes from (1) forceful geyser eruptions that are powerful enough to eject some debris along with hot water and steam but not excavate a crater or increase the size of the vent, to (2) small explosions that excavate a crater a few meters across and eject debris tens of meters away, to (3) large explosions powerful enough to form craters >1 km in diameter and eject large blocks of debris >3 km away (Christiansen et al., 2007; Morgan et al., 2009; Jaworowski et al., 2010). As with other hazards, there is an inverse relationship between the frequency of an event and its magnitude (Lowenstern et al., 2005; Christiansen et al., 2007). The last large hydrothermal explosion, which formed the 500-m diameter Indian Pond adjacent to the north side of Yellowstone Lake, occurred an estimated 3,000 years ago. Small hydrothermal explosions are estimated to occur once every 2 years (Christiansen et al., 2007).
Few people have witnessed hydrothermal explosions in Yellowstone, and to date, no one has ever been injured by one. In general, hydrothermal explosions do not have predictive precursory signals. Although the 1989 explosion at Porkchop Geyser in Norris Geyser Basin was preceded by anomalous changes in its behavior and water temperature (Christiansen et al., 2007), the explosion was not predictable. Germane to this study, it is possible that during periods of uplift, earthquake swarms, or increased hydrothermal activity like newly emerging thermal areas, there is a heightened likelihood of hydrothermal explosions in that area. For example, since January 2016 Norris Geyser Basin has been uplifting rapidly. There is evidence of an accumulation of magmatic fluids in the shallow subsurface and since March 2018 Steamboat Geyser has been erupting more frequently than normal, suggesting an increased risk of hydrothermal explosions in this area (Wicks et al., 2020). However, hydrothermal explosions are less likely in vapor-dominated thermal areas like Tern Lake (Christiansen et al., 2007).
Conclusions and Future Directions
Based on the analysis of multiple airborne and spaceborne remote sensing data sets from 1994 through 2019, we conclude that around the summer of 2000 a new thermal area started emerging along the northeast side of the Sour Creek resurgent dome in Yellowstone National Park. This area, initially covered by healthy forest, was characterized by an increasing area of vegetation stress and mortality, and an increase in radiant heat output. Vegetation stress was the first remotely detectable sign that the area was changing, even though surface heating probably preceded or accompanied this process. Higher spatial resolution thermal infrared images would detect ground heating sooner. During field work in August 2019, we observed it to be a dry, steam-heated acid-sulfate thermal area with a northeast-trending arc shaped zone of bright hydrothermally altered soil and heated ground with surface temperatures from 60 to 80°C (140–176°F), boiling temperatures (93°C; 200°F) just beneath the surface, several steaming fumaroles, and a large tree kill zone about 33,300 m2 in area, with fallen trees that were carbonizing where they were in contact with the warmest ground. This new thermal area is the largest one that has ever been observed from its onset through 20 years of evolution. We also observed young (less than 5-year-old) trees re-growing in cooler zones within the area of fallen trees, which may indicate that the area is entering a period of repose. To our knowledge, no report about gas emissions from this new area has been documented, other than smelling H2S gas from the area during field work—so, measuring gas emissions will be a next step in characterizing this newly emerging thermal area. Also, 14C isotope and dendrochronology studies of the trees may help to understand the history of tree kills in the area.
The new thermal area appears to be an extension of the previously mapped Tern Lake thermal area, having emerged about 500 m to the southeast, along a structural trend subparallel to the margin of the Sour Creek dome, the inner ring fracture zone, and along trend with numerous other thermal areas in that region of the park (Figure 1B). The new thermal area went through a period of slow growth in both surface area and thermal output from 2000 to 2005, a period of more rapid growth from 2005 to 2012, and a period of slower growth and stabilization from 2012 through 2019. Evidence of this evolution was derived from mutually consistent remote sensing observations of visible changes in the characteristics of vegetation cover and thermal changes in geothermal radiative heat output. Higher temporal resolution observations would better constrain the timing of thermal area changes. We predict that the new thermal area will continue to look much the same in the coming years, with the arc-shaped area of steaming fumaroles amidst warm altered ground carbonizing fallen trees. The previously mapped Tern Lake thermal area also exhibited an increase in surface area from 2009 to 2017, marked by an increase in the tree kill zone on the north side. This relatively small change would likely not have been detected without high spatial resolution images.
This work highlights the utility of multiplatform multisensor remote sensing data sets and the use of myriad archived geophysical data sets to characterize the formation and evolution of a new thermal area. The fact that a new thermal area emerged and grew to a significant size before it was detected and mapped is a testament to how large and spread out Yellowstone's thermal areas are, and thus how challenging it is to keep track of all the changes within this large hydrothermal system. The discovery and initial characterization of this newly emerging thermal area were enabled by the combination of moderate spatial resolution nighttime thermal infrared imagery (Landsat 8 and ASTER), moderate spatial resolution visible and near infrared imagery (Landsat 8 OLI, Landsat 7 ETM+, ASTER, and SPOT), high spatial resolution visible and near infrared commercial satellite imagery (QuickBird-2 and WorldView-2), and high spatial resolution visible and near infrared airborne imagery (NAPP and NAIP). Future discoveries of this type will be enabled by similar technologies, but for more timely detection of such changes, higher temporal and spatial resolution data would be required.
The initial appearance of the new thermal area around 2000 occurred with no clear spatial or temporal relationship to local seismic activity or ground deformation and thus does not appear to be causally related to such geophysical processes. The evolution of the new thermal area, particularly the period of rapid growth from 2005 to 2012, does partly coincide with a period of rapid uplift of the Sour Creek dome. This could suggest a causative link, but this idea is arguable. Growth of the previously mapped Tern Lake thermal area in 2009 coincided (spatially and temporally) with a spike in local seismic activity and with the apex of inflation of the Sour Creek dome, after which it began to subside. A causative link in this case seems more plausible.
The cause and effect relationships between seismic and geodetic process, hydrothermal fluid flow, and changes in the surface expression of thermal areas are complicated. It is logical, and there is supporting evidence, that ground shaking from earthquakes can affect the permeability of hydrothermal plumbing systems and result in thermal area changes at the surface (Lowenstern et al., 2006). Indeed, occasional earthquakes are required to keep the hydrothermal system active, as mineral-laden hydrothermal fluid conduits would self-seal if they were not occasionally reopened with ground shaking (Waite and Smith, 2002). There is also evidence that earthquakes can be caused by the movement of pressurized hydrothermal fluids in the subsurface (Evans et al., 2010). It is also logical, and there is supporting evidence, that ground inflation can increase the permeability of hydrothermal plumbing systems and could result in changes in thermal areas at the surface (Wicks et al., 2006). Yet, it is also important to remember all the significant surface changes that do not happen in Yellowstone's thermal areas in the wake of plentiful occurrences of earthquakes and ground deformation cycles. Future multidisciplinary investigations of correlations between hydrothermal and geophysical processes will improve our understanding of their relationships.
As far as implications for the status of the Yellowstone magmatic-hydrothermal system, this study illustrates that Yellowstone is behaving just as we would expect. Thermal areas in Yellowstone are known to be dynamic, as evidenced by this study and other previously mentioned examples. They heat up; they cool down; and they sometimes migrate as new fluid pathways to the surface become available. The newly emerging thermal area described here does not signify an impending eruption nor any significant changes to the deeper magmatic system. There are, however, hazards associated with thermal areas throughout Yellowstone. Minor unrest like a newly emerging thermal area, while not leading to a magmatic eruption, can still create potentially hazardous conditions. Such conditions include increased area of hot, unstable ground, increased potential for hydrothermal explosions, and/or increased concentration of magmatic gases at the surface, all of which could pose hazards. This highlights the importance of routine, detailed thermal area monitoring. There are almost certainly more examples of thermal area changes in Yellowstone that we have yet to discover. So, as we continue to monitor the evolution of the Tern Lake thermal area, we will employ multiplatform multisensor remote sensing tools, geophysical measurements, and field-based observations to map, measure, and monitor other dynamic thermal areas throughout Yellowstone National Park.
Data Availability Statement
The remote sensing data used in this study are available for free from the U.S. Geological Survey Earth Resources Observation and Science (EROS) Data Center archive (https://earthexplorer.usgs.gov), or upon request to the corresponding author. Commercial satellite data are available only to Federal Government employees under the NextView Imagery End User License Agreement.
Author Contributions
RV took the lead in data acquisition, processing, analysis, and interpretation, and in writing the manuscript, making figures, and responding to reviews (85%). JH contributed to field work and field data acquisition, processing, and analysis, and to the field sections of the text (10%). WK contributed to the GIS data and to the background section of the text (5%). All authors contributed to the article and approved the submitted version.
Funding
This research was supported in part by the U.S. Geological Survey Volcano Hazards Program and Volcano Science Center through the Yellowstone Volcano Observatory. RV was supported by the Yellowstone Volcano Observatory. JH and WK were supported by the Yellowstone Center for Resources, National Park Service.
Disclaimer
Any use of trade, firm, or product names is for descriptive purposes only and does not imply endorsement by the U.S. Government.
Conflict of Interest
The authors declare that the research was conducted in the absence of any commercial or financial relationships that could be construed as a potential conflict of interest.
Acknowledgments
The research described here was carried out at the U.S. Geological Survey (USGS) Astrogeology Science Center in Flagstaff, Arizona, with support from the Yellowstone Volcano Observatory and the Yellowstone Center for Resources. Field-based research was conducted under the National Park Service Geology Programs Milestones Permit 2016-9. Many thanks to Mike Poland, Pat Kenny, Matt Patrick, Rick Wessels, David Mayer, Claire Pringle, Jen Lewicki, Jonathan Glen, Wendy Stovall, Jamie Farrell, Angie van Patten, Brent Fleming, and Phil Carpenter. Thanks also to the external reviewers and editors. And thanks to the DigitalGlobe NextView End User License Agreement for the use of QuickBird-2 and WorldView-2 data.
References
Baldridge, A. M., Hook, S. J., Grove, C. I., and Rivera, G. (2009). The ASTER spectral library version 2.0. Remote Sens. Environ. 113, 711–715. doi: 10.1016/j.rse.2008.11.007
Barsi, J. A., Schott, J. R., Hook, S. J., Raqueno, N. G., Markham, B. L., and Radocinski, R. G. (2014). Landsat-8 thermal infrared sensor (TIRS) vicarious radiometric calibration. Remote Sens. 6, 11607–11626. doi: 10.3390/rs61111607
Bergfeld, D., Evans, W. C., Lowenstern, J. B., and Hurwitz, S. (2012). Carbon dioxide and hydrogen sulfide degassing and cryptic thermal input to brimstone basin. Yellowstone National Park, Wyoming. Chem. Geol. 33, 233–243. doi: 10.1016/j.chemgeo.2012.09.001
Branney, M., and Acocella, V. (2015). “Chapter 16: Calderas,” in The Encyclopedia of Volcanoes, eds H. Sigurdsson, B. Houghton, S. R. McNutt, H. Rymer, and J. Stix (Cambridge, MA: Academic Press), 299–315.
Chang, W. L., Smith, R. B., Wicks, C., Farrell, J. M., and Puskas, C. M. (2007). Accelerated uplift and magmatic intrusion of the yellowstone caldera, 2004 to 2006. Science 318, 952–956. doi: 10.1126/science.1146842
Chiodini, G., Giudicepietro, F., Vandemeulebrouck, J., Aiuppa, A., Caliro, S., De Cesare, W., et al. (2017). Fumarolic tremor and geochemical signals during a volcanic unrest. Geology 45, 1131–1134. doi: 10.1130/g39447.1
Chiodini, G., Vandemeulebrouck, J., Caliro, S., D'Auria, L., De Martino, P., Mangiacapra, A., et al. (2015). Evidence of thermal-driven processes triggering the 2005–2014 unrest at Campi Flegrei caldera. Earth Planet. Sci. Lett. 414, 58–67. doi: 10.1016/j.epsl.2015.01.012
Christiansen, R. L. (2001). The Quaternary and Pliocene Yellowstone Plateau Volcanic Field of Wyoming, Idaho, and Montana. U.S. Geological Survey Professional Paper 729–G, 145. Reston, VA: USGS, 3.
Christiansen, R. L., Lowenstern, J. B., Smith, R. B., Heasler, H., Morgan, L. A., Nathenson, M., et al. (2007). Preliminary Assessment of Volcanic and Hydrothermal Hazards in Yellowstone National Park and Vicinity. U.S. Geological Survey Open-File Report 2007-1071, 94.
Duda, K. A., Ramsey, M., Wessels, R., and Dehn, J. (2009). “Optical satellite volcano monitoring: a multi-sensor rapid response system,” in Geoscience and Remote Sensing, ed P. G. Peter Ho (Shanghai: IntechOpen) 473–496.
Dzurisin, D., Savage, J. C., and Fournier, R. O. (1990). Recent crustal subsidence at Yellowstone Caldera, Wyoming. Bull. Volcanol. 52, 247–270. doi: 10.1007/bf00304098
Dzurisin, D., Wicks, C. W., and Poland, M. P. (2012). History of Surface Displacements at the Yellowstone Caldera, Wyoming, from Leveling Surveys and InSAR Observations, 1923–2008. U.S. Geological Survey Professional Paper 1788. Reston, VA: USGS, 68.
Dzurisin, D., Yamashita, K. M., and Kleinman, J. W. (1994). Mechanisms of crustal uplift and subsidence at the Yellowstone Caldera, Wyoming. Bull. Volcanol. 56, 261–270. doi: 10.1007/bf00302079
Evans, W. C., Bergfeld, E., McGeehin, J. P., King, J. C., and Heasler, H. (2010). Tree-ring 14C links seismic swarm to CO2 spike at Yellowstone, USA. Geology 38, 1075–1078. doi: 10.1130/g31345.1
Farrar, C. D., Evans, W. C., Venezky, D. Y., Hurwitz, S., and Oliver, L. K. (2007). Boiling Water at Hot Creek—The Dangerous and Dynamic Thermal Springs in California's Long Valley Caldera. USGS Fact Sheet 2007-3045. Reston, VA: USGS, 4.
Farrell, J., Smith, R. B., Husen, S., and Diehl, T. (2014). Tomography from 26 years of seismicity revealing that the spatial extent of the Yellowstone crustal magma reservoir extends well beyond the Yellowstone caldera. Geophys. Res. Lett. 41, 3068–3073. doi: 10.1002/2014gl059588
Farrell, J., Smith, R. B., Taira, T. A., Chang, W. L., and Puskas, C. M. (2010). Dynamics and rapid migration of the energetic 2008–2009 Yellowstone Lake earthquake swarm. Geophys. Res. Lett. 37:L19305. doi: 10.1029/2010GL044605
Fournier, R. O. (1989). Geochemistry and dynamics of the Yellowstone National Park hydrothermal system. Annu. Rev. Earth Planet. Sci. 17, 13–53. doi: 10.1146/annurev.ea.17.050189.000305
Fournier, R. O., Weltman, U., Counce, D., White, L. D., and Janik, C. J. (2002). Results of Weekly Chemical and Isotopic Monitoring of Selected Springs in Norris Geyser Basin, Yellowstone National Park During June-September, 1995. Open File Report 02-344. Reston, VA: USGS.
Friedman, I. (2007). Monitoring Changes in Geothermal Activity at Norris Geyser Basin by Satellite Telemetry. National Park, WY: Yellowstone National Park.
Gillespie, A., Rokugawa, S., Matsunaga, T., Cothern, J. S., Hook, S., and Kahle, A. B. (1998). A temperature and emissivity separation algorithm for advanced spaceborne thermal emission and reflection radiometer (ASTER) images. IEEE Trans. Geosci. Remote Sens. 36, 1113–1126. doi: 10.1109/36.700995
Heasler, H., and Jaworowski, C. (2018). Hydrothermal monitoring of Norris Geyser Basin, Yellowstone National Park, USA, using airborne thermal infrared imagery. Geothermics 72, 24–46. doi: 10.1016/j.geothermics.2017.10.016
Hulet, A., Roundy, B. A., Petersen, S. L., Bunting, S. C., Jensen, R. R., and Roundy, D. B. (2014). Utilizing national agriculture imagery program data to estimate tree cover and biomass of pinon and juniper woodlands. Rangel. Ecol. Manage. 67, 563–572. doi: 10.2111/rem-d-13-00044.1
Hurwitz, S., and Lowenstern, J. B. (2014). Dynamics of the Yellowstone hydrothermal system. Rev. Geophys. 51, 375–411. doi: 10.1002/2014RG000452
Hurwitz, S., Harris, R. N., Werner, C. A., and Murphy, F. (2012). Heat flow in vapor dominated areas of the Yellowstone Plateau volcanic field—implications for the thermal budget of the Yellowstone Caldera. J. Geophys. Res. 117:B10207. doi: 10.1029/2012JB009463
Husen, S., Taylor, R., Smith, R. B., and Heasler, H. (2004). Changes in geyser behavior and remotely triggered seismicity in Yellowstone National Park produced by the 2002 M 7.9 Denali fault earthquake, Alaska. Geology 32, 537–540. doi: 10.1130/G20381.1
Hutchinson, R. A. (1985). “Hydrothermal changes in the upper Geyser Basin, Yellowstone National Park, after the 1983 Borah Peak, Idaho, earthquake,” in Proceedings of Workshop XXVIII on the Borah Peak, Idaho, Earthquake: U.S. Geological Survey Open-file Report OF85-290, eds R. S. Stein and R. C. Bucknam (Reston, VA: USGS), 612–624.
Jaworowski, C., Heasler, H. P., Neale, C. M. U., and Sivarajan, S. (2010). Using thermal infrared imagery and LiDAR in Yellowstone geyser basins. Yellowstone Sci. 18, 8–19.
Jaworowski, C., Heasler, H. P., Hardy, C. C., and Queen, L. P. (2006). Control of hydrothermal fluids by natural fractures at Norris Geyser Basin. Yellowstone Sci. 14, 13–23.
Kealy, P. S., and Hook, S. J. (1993). Separating temperature and emissivity in thermal infrared multispectral scanner data: implications for recovering land surface temperatures. IEEE Trans. Geosci. Remote Sens. 31, 1155–1164. doi: 10.1109/36.317447
Keith, T. E. C., White, D. E., and Beeson, M. H. (1978). Hydrothermal Alteration and Self-Sealing in Y-7 and Y-8 Drill Holes in Northern Part of Upper Geyser Basin, Yellowstone National Park, Wyoming. USGS Professional Paper 1054-A. Reston, VA: USGS, 31.
Lowenstern, J. B., Christiansen, R. L., Smith, R. B., Morgan, L. A., and Heasler, H. (2005). Steam Explosions, Earthquakes, and Volcanic Eruptions–What's in Yellowstone's Future? USGS Fact Sheet 2005-3024. Reston, VA: USGS, 6.
Lowenstern, J. B., and Hurwitz, S. (2008). Monitoring a supervolcano in repose: heat and volatile flux at the Yellowstone Caldera. Elements 4, 35–40. doi: 10.2113/gselements.4.1.35
Lowenstern, J. B., Smith, R. B., and Hill, D. P. (2006). Monitoring super-volcanoes: geophysical and geochemical signals at Yellowstone and other large caldera systems. Philos. Trans. R. Soc. A Math. Phys. Eng. Sci. 364, 2055–2072. doi: 10.1098/rsta.2006.1813
Lowenstern, J. B., Heasler, H., and Smith, R. B. (2003). Hydrothermal disturbances at the Norris Geyser Basin, Yellowstone National Park (USA) in 2003. Eos Trans. AGU 84, 31B−35B.
Marler, G. D., and White, D. E. (1975). Seismic geyser and its bearing on the origin and evolution of geysers and hot springs of Yellowstone National Park. Geol. Soc. Am. Bull. 86, 749–759.
Matthews, N. E., Vazquez, J. A., and Calvert, A. T. (2015). Age of the Lava Creek supereruption and magma chamber assembly at Yellowstone based on 40Ar/39Ar and U-Pb dating of sanidine and zircon crystals. Geochem. Geophys. Geosyst. 16, 2508–2528. doi: 10.1002/2015gc005881
Morgan, L. A., Shanks, W. C. I. I. I., and Pierce, K. L. (2009). Hydrothermal Processes Above the Yellowstone Magma Chamber: Large Hydrothermal Systems and Large Hydrothermal Explosions. Geological Society of America Special Paper 459. Reston, VA: USGS, 1–95. doi: 10.1130/2009.2459
Morgan, L. A., Shanks, W. C. P., Lowenstern, J. B., Farrell, J. M., and Robinson, J. E. (2017). Geologic Field-Trip Guide to the Volcanic and Hydrothermal Landscape of the Yellowstone Plateau. U.S. Geological Survey Scientific Investigations Report 2017–5022–P. Reston, VA: USGS, 100.
Newhall, C. G., and Dzurisin, D. (1988). Historical unrest at large calderas of the world. U.S. Geol. Surv. Bull. 1855:1108.
Pelton, J. R., and Smith, R. B. (1979). Recent crustal uplift in Yellowstone National Park. Science, 206, 1179–1182. doi: 10.1126/science.206.4423.1179
Pitt, A. M., and Hutchinson, R. A. (1982). Hydrothermal changes related to earthquake activity at Mud volcano, Yellowstone National Park, Wyoming. J. Geophys. Res. 87, 2762–2766.
Rinehart, J. S. (1972). Fluctuations in geyser activity caused by variations in Earth tidal forces, barometric pressure, and tectonic stresses. J. Geophys. Res. 77, 342–350. doi: 10.1029/jb077i002p00342
Roy, D. P., Wulder, M. A., Loveland, T. R., Woodcock, C. E., Allen, R. G., Anderson, M. C., et al. (2014). Landsat-8: science and product vision for terrestrial global change research. Remote Sens. Environ. 145, 154–172. doi: 10.1016/j.rse.2014.02.001
Shelly, D. R., Hill, D. P., Massin, F., Farrell, J., Smith, R. B., and Taira, T. A. (2013). A fluid-driven earthquake swarm on the margin of the Yellowstone caldera. J. Geophys. Res. Solid Earth 118, 4872–4886. doi: 10.1002/jgrb.50362
Smith, R. B., Jordan, M., Steinberger, B., Puskas, C. M., Farrell, J., Waite, G. P., et al. (2009). Geodynamics of the Yellowstone hotspot and mantle plume: seismic and GPS imaging, kinematics, and mantle flow. J. Volcanol. Geotherm. Res. 188, 26–56. doi: 10.1016/j.jvolgeores.2009.08.020
Sorey, M. L., Farrar, C. D., Gerlach, T. M., McGee, K. A., Evans, W. C., Colvard, E. M., et al. (2000). Invisible CO2 Gas Killing Trees at Mammoth Mountain, California. [USGS Fact Sheet 172–96]. Reston, VA: USGS, 2.
Thome, K. J. (2001). Absolute radiometric calibration of Landsat 7 ETM+ using the reflectance-based method. Remote Sens. Environ. 78, 27–38. doi: 10.1016/s0034-4257(01)00247-4
Thompson, J. M., and DeMonge, J. M. (1996). Chemical Analyses of hot Springs, Pools, and Geysers from Yellowstone National Park, Wyoming, and Vicinity, 1980-1993. Reston, VA: USGS.
Todesco, M., Rutqvist, J., Chiodini, G., Pruess, K., and Oldenburg, C. M. (2004). Modeling of recent volcanic episodes at phlegrean Fields (Italy); geochemical variations and ground deformation. Geothermics 33, 531–547. doi: 10.1016/j.geothermics.2003.08.014
Tonooka, H., Palluconi, F. D., Hook, S. J., and Matsunaga, T. (2005). Vicarious calibration of ASTER thermal infrared bands. IEEE Trans. Geosci. Remote Sens. 43, 2733–2746. doi: 10.1109/tgrs.2005.857885
Trimble, A. B., and Smith, R. B. (1975). Seismicity and contemporary tectonics of the Hebgen Lake-Yellowstone Park region. J. Geophys. Res. 80, 733–741. doi: 10.1029/jb080i005p00733
Vaughan, R. G. (2016). “Satellite and airborne measurements of thermal emission at Yellowstone,” in Abstract Volume for the 2016 Biennial Meeting of the Yellowstone Volcano Observatory, U.S. Geological Survey Open-File Report 2016–1104, ed. J. B. Lowenstern (Reston, VA: USGS), 52.
Vaughan, R. G., Heasler, H., Jaworowski, C., Lowenstern, J. B., and Keszthelyi, L. P. (2014). Provisional Maps of Thermal Areas in Yellowstone National Park, Based on Satellite Thermal Infrared Imaging and Field Observations. US Geological Survey, Scientific Investigations Report, 2014. Reston, VA: USGS.
Waite, G. P., and Smith, R. B. (2002). Seismic evidence for fluid migration accompanying subsidence of the Yellowstone caldera. J. Geophys. Res. Solid Earth 107:ESE−1. doi: 10.1029/2001JB000586
Werner, C., and Brantley, S. (2003). CO2 emissions from the Yellowstone volcanic system. Geochem. Geophys. Geosyst. 4:1061. doi: 10.1029/2002GC000473
White, D. E., Hutchinson, R. A., and Keith, T. E. (1988). The Geology and Remarkable Thermal Activity of Norris Geyser Basin, Yellowstone National Park, Wyoming. USGS Professional Paper 1456. Reston, VA: USGS.
Wicks, C., Thatcher, W., and Dzurisin, D. (1998). Migration of fluids beneath Yellowstone Caldera inferred from satellite radar interferometry. Science 282, 458–462. doi: 10.1126/science.282.5388.458
Wicks, C. W., Dzurisin, D., Lowenstern, J. B., and Svarc, J. (2020). Magma intrusion and volatile ascent beneath Norris Geyser Basin, Yellowstone National Park. J. Geophys. Res. Solid Earth 125:e2019JB018208. doi: 10.1029/2019JB018208
Wicks, C. W., Thatcher, W., Dzurisin, D., and Svarc, J. (2006). Uplift, thermal unrest and magma intrusion at Yellowstone Caldera. Nature 440:72. doi: 10.1038/nature04507
Yamaguchi, Y., Kahle, A. B., Tsu, H., Kawakami, T., and Pniel, M. (1998). Overview of advanced spaceborne thermal emission and reflection radiometer (ASTER). IEEE Trans. Geosci. Remote Sens. 36, 1062–1071. doi: 10.1109/36.700991
Yellowstone Volcano Observatory (2003). Thermal Activity at Norris Geyser Basin Provide Opportunity to Study Hydrothermal System, Yellowstone Caldera Chronicles. Available online at: https://volcanoes.usgs.gov/volcanoes/yellowstone/article_home.html
Yellowstone Volcano Observatory (2006). Volcano and Earthquake Monitoring Plan for the Yellowstone Volcano Observatory, 2006-2015. USGS Scientific Investigation Report 2006-5276. Reston, VA: USGS, 17.
Yellowstone Volcano Observatory (2018). Changes Are Afoot in Yellowstone's Upper Geyser Basin!, Yellowstone Caldera Chronicles. Available online at: https://volcanoes.usgs.gov/volcanoes/yellowstone/article_home.html.
Keywords: Yellowstone, Sour Creek dome, geothermal areas, thermal infrared remote sensing, Landsat 8, ASTER
Citation: Vaughan RG, Hungerford JDG and Keller W (2020) A Newly Emerging Thermal Area in Yellowstone. Front. Earth Sci. 8:204. doi: 10.3389/feart.2020.00204
Received: 28 January 2020; Accepted: 18 May 2020;
Published: 23 June 2020.
Edited by:
Shanaka L. de Silva, Oregon State University, United StatesReviewed by:
Jacob B. Lowenstern, Cascades Volcano Observatory, Volcano Disaster Assistance Program (USGS), United StatesAlan Whittington, University of Texas at San Antonio, United States
Társilo Girona, NASA Jet Propulsion Laboratory (JPL), United States
Copyright © 2020 Vaughan, Hungerford and Keller. This is an open-access article distributed under the terms of the Creative Commons Attribution License (CC BY). The use, distribution or reproduction in other forums is permitted, provided the original author(s) and the copyright owner(s) are credited and that the original publication in this journal is cited, in accordance with accepted academic practice. No use, distribution or reproduction is permitted which does not comply with these terms.
*Correspondence: R. Greg Vaughan, gvaughan@usgs.gov