Article

Effects of Non-Industrial Wood Ash (NIWA) Applications on Soil Chemistry and Sugar Maple (Acer saccharum, Marsh.) Seedling Growth in an Acidic Sugar Bush in Central Ontario

by
Holly D. Deighton
1,* and
Shaun A. Watmough
2
1
Environmental and Life Sciences Graduate Program, Trent University, Peterborough, ON K9J 7B8, Canada
2
School of the Environment, Trent University, Peterborough, ON K9J 7B8, Canada
*
Author to whom correspondence should be addressed.
Forests 2020, 11(6), 693; https://doi.org/10.3390/f11060693
Submission received: 19 May 2020 / Revised: 17 June 2020 / Accepted: 17 June 2020 / Published: 19 June 2020
(This article belongs to the Special Issue Soil Management and Forest Productivity)

Abstract

:
Research Highlights: In central Ontario, large quantities of non-industrial wood ash (NIWA) are generated and could be used as a forest soil amendment to counteract soil acidification and base cation depletion caused by decades of acid deposition. Background and Objectives: The properties and biogeochemical responses of NIWA have not been thoroughly explored, and field experiments must be conducted before NIWA can be regulated as a forest soil amendment in Ontario. Materials and Methods: In this study, soil chemistry and sugar maple (Acer saccharum, Marsh.) seedling growth and chemistry were measured in an acidic sugar bush over twelve months following a NIWA field experiment. Plots (2 m by 2 m) were established with sugar maple, white pine (Pinus strobus L.), and yellow birch (Betula alleghaniensis Britt.) NIWA treatments applied at rates of 6 Mg ha−1 along with untreated control plots. Results: Ash chemistry varied significantly among species and yellow birch ash generally had much higher metal concentrations compared with other species. Following ash application, significant increases in soil pH and calcium and magnesium concentrations were observed, however the level of response varied by treatment. Foliar concentrations of base cations in sugar maple seedlings significantly increased in ash treatments and there was no significant treatment effect on foliar metal concentrations or seedling growth. In roots and shoots, concentrations of several metals (manganese, aluminum, iron, boron, arsenic, cadmium, zinc, copper, lead, chromium, and nickel) increased after ash application, however response was most pronounced in yellow birch ash. Conclusions: These results suggest that application of NIWA can counteract the lasting effects of acid rain by increasing soil pH and base cation concentrations, as well as increasing sugar maple seedling foliar nutrient concentrations, but ashes from species with high metal contents may also increase metal availability to vegetation, at least in the short-term.

1. Introduction

Acid rain has resulted in surface water acidification [1,2] and accelerated nutrient leaching from forest soils [3,4] across North America. Chemical changes in soil associated with acid deposition, particularly calcium (Ca) depletion, have been linked to declines in sugar maple (Acer saccharum, Marsh.) in Quebec [5], Ontario [6], and several regions of the eastern United States [7,8]. While some studies have suggested that signs of soil recovery from acidification are emerging [9], full chemical recovery will be slow, perhaps taking centuries because of low base cation weathering rates [10]. Increased forest harvest intensity may also slow recovery by removing additional base cations from the site and increasing soil acidity [11,12]. Chemical recovery of soils may be accelerated with additions of lime [13,14] or wood ash [15]. Increased production of wood ash from biomass combustion, as well as high costs of landfilling [16], has sparked interest in using wood ash as a forest soil amendment [17].
Wood ash is best used on acidic, nutrient-deficient forest soils, because wood ash has high alkalinity, pH values ranging from 8.9–13.5, and high concentrations of Ca, magnesium (Mg), potassium (K), and phosphorus (P) in ash [15,18]. In Scandinavia, wood ash has been used for decades to alleviate forest nutritional deficiencies and decreases in pH caused by whole tree harvesting or acid deposition [19,20,21]. In Canada, wood ash may also have potential as a commercial-scale forest soil amendment [22,23], especially in areas such as Ontario where large amounts of wood ash are generated [24,25] and where about 63% of the forest area is at risk of soil acidification [26].
A variety of factors must be recognized before using wood ash to improve soil fertility. Wood ash composition can vary considerably depending upon tree species, combustion conditions, tissue types, and climate and soil conditions [17,27,28]. For example, bark and foliage may contain five to ten times more nutrients than stemwood [29], but large variations in nutrient concentrations have been shown to occur within the same tree species on calcareous versus acidic soils [30]. Metal concentrations in ash are also variable and there is concern that wood ash application may increase the concentration of heavy metals in forest ecosystems [18]. For example, willow (Salix spp.) is known to hyperaccumulate cadmium (Cd) [31] and poplar (Populus spp.) is known to accumulate zinc (Zn) [32]. Tree species and tissues used for woody biomass combustion that are accumulators of toxic metals, with resultant increased metal levels, have the potential to translate into wood ash with higher metal concentrations.
There is growing interest in using wood ash to improve forest soil fertility, and wood ash field trials are currently being conducted in British Columbia, Saskatchewan, Manitoba, Ontario, and Quebec to examine the effects of wood ash on forest ecosystems [33]. Recent publications from research conducted at these sites have provided evidence in support of wood ash as a nutrient additive and soil pH neutralizer [34,35,36], however none have observed the impact of non-industrial wood ash (NIWA) (ash produced in wood stoves) on forest ecosystems. The amount of wood ash used for land application has increased since the mid-1990s, but a significant portion is still landfilled (from 84% in 1995 to 63% in 2013) [37], which pose waste disposal issues. In Ontario, almost 20,000 tonnes of NIWA are produced each year, 83% coming from maple (Acer spp.), birch (Betula spp.), oak (Quercus spp.), beech (Fagus spp.), ash (Fraxinus spp.), or cherry (Prunus spp.) trees [24]. Non-industrial wood ash may be useful in combating acidification and nutrient losses in central Ontario forests and lakes; however, its’ composition is relatively unknown. Non-industrial wood ash may vary in composition more so than industrial wood ash due to the greater variety of tree species and tissue types burned, and differences in combustion conditions [38]. Therefore, field studies must be conducted to assess both the benefits to soils and plants and the potential toxicity of NIWA before it can be evaluated as a commercial-scale forest soil amendment.
Soils in the Muskoka–Parry Sound area of Ontario are generally acidic, with low base saturation [39,40] and are particularly vulnerable to acid deposition [41]. Lasting effects of acid deposition have been documented in this area, including losses of Ca from the exchangeable pool [42] and declines in central Ontario lake Ca levels by almost 50% [41]. Recently, liming studies conducted regionally [43] and in other regions of North America [44,45] have shown positive ecosystem responses. Therefore, applying wood ash to central Ontario forests could counteract the effects of acidification and tree harvesting, potentially improving overall forest health [22,46], especially as wood ash contains other nutrients (Mg, K, P) that may be beneficial to forest ecosystems [17]. The objective of this study was to investigate the short-term (<one-year) response to the application of three NIWA types to an acidic forest in central Ontario. Non-industrial wood ashes from sugar maple, white pine (Pinus strobus L.), and yellow birch (Betula alleghaniensis Britt.) trees were applied to 2 m by 2 m plots at a rate of 6 Mg ha−1 (based on liming recommendations for the site) in Bracebridge, Ontario. Soil and sugar maple seedling chemical and biological properties were assessed. These species were chosen to reflect two common non-industrial hardwood ashes produced in Ontario (maple, 29% and birch, 14%) and the most common non-industrial softwood ash produced in Ontario (pine, 2%) [24].
It was hypothesized that the application of the different ash types would alter soil and sugar maple seedling chemistry, but that the response would differ among ashes. It was predicted that wood ash addition would increase soil pH and base cation concentrations. It was also predicted that there would be an increase in plant nutrients in seedling tissues and a positive effect on seedling growth. We also hypothesized that there would be an increase in metal concentrations in soil, and that sugar maple seedling metal concentrations would increase following application of all ashes.

2. Materials and Methods

2.1. Study Site

The study site was located at an acidic (approximately 4.4 pH units in the top 0–15 cm of soil) [47] sugar bush near Bracebridge, Ontario (45′08°N, 79′46°W), approximately 215 km north of Toronto. The site was level to gently sloping, with an elevation of approximately 308 m above sea level. Average precipitation in the area was 1198 mm and the average annual daily temperature was 4.8 °C, ranging from −10.7 °C in January to 18.2 °C in July [48]. The study site was in an area of granitic gneiss Precambrian Shield bedrock overlain by shallow, coarse textured sandy loam soils that belong to the great group Sombric Brunisol based on the Canadian System of Soil Classification [49]. The site was dominated by sugar maple, but also had a mix of red oak (Quercus rubra L.), eastern hemlock (Tsuga canadensis Carr.), and white birch (Betula papyrifera Marsh.). Canopy closure ranged from 70% to 97% (mean, 83%; median, 90.5%). In 2016, sugar maple leaf tissue at the site was reported to contain medium levels of K and P and deficient levels of Ca and Mg [47]. The report recommended that this sugar bush receive a 5.5 Mg ha−1 lime application.

2.2. Plot Setup and Experimental Design

In early May 2018, twenty 2 m by 2 m plots (including a 1 m buffer) were randomly established at the study site. The plots were chosen based on the following characteristics: Dominated by sugar maple seedlings, far from roads and major urban locations to eliminate any road salt effects, and relatively flat slope to avoid runoff of ash immediately after application, given there is a precipitation event. The plots were assessed for canopy closure and elevation. Sugar maple, white pine, and yellow birch ashes were applied at a rate of 6 Mg ha−1 with one control treatment (0 Mg ha−1 ash) on 28 May 2018. The sugar maple and white pine wood ash treatments were replicated five times, with the control and yellow birch ash treatment treatments replicated seven and three times, respectively. We were unable to replicate the yellow birch ash treatment five times due to an insufficient amount collected, so the final two plots were left as controls. The amount of ash needed for each plot was weighed, carried to the plot using sealed plastic bags and hand distributed as evenly as possible by hand. Non-industrial wood ash samples (sugar maple, white pine, and yellow birch) were generated over the 2017 winter heating season and obtained from three independent residents of Muskoka County. Ash samples were sealed in large, polyethylene containers and stored in a cool, dark environment prior to analysis. Before application, ash was sieved to <2 mm to remove any large debris (charcoal).
To evaluate how representative ash from these three species were relative to other species in other locations a survey was conducted to measure ash chemistry of bark and wood tissue from on (n = 16) and off (n = 11) the Canadian Shield to investigate the range in wood and bark ash chemistry. Mineral soil underneath the base of each tree was also collected. Tree and mineral soil samples were sealed in plastic bags and stored at 4 °C prior to analysis.

2.3. Field and Laboratory Sampling and Analysis

Tree samples were separated into bark and stem tissues, left to air dry for two weeks, then ashed using a muffle furnace (550 °C for 16 h). Non-industrial wood ash chemistry was measured in oven-dried ash prior to application to soils. Carbon (C), nitrogen (N), and sulfur (S) were determined using a CNS combustion analyzer (Elementar vario MACRO cube CNS) and Ca, Mg, K, sodium (Na), manganese (Mn), aluminum (Al), iron (Fe), boron (B), molybdenum (Mo), arsenic (As), Cd, Zn, copper (Cu), Pb, chromium (Cr), cobalt (Co), nickel (Ni), selenium (Se), beryllium (Be), vanadium (V), strontium (Sr), and barium (Ba) were measured using inductively coupled plasma optical emission spectrometry (ICP-OES) following nitric acid digestion (Aristar® Plus, CAS 7697-37-2). Samples for ICP-OES were weighed (~0.2 g each) and placed in a 50 mL DigiTUBEs (SCP Science, Quebec, CA, USA), where 2.5 mL of 100% (v/v) nitric acid was added. Precision of CNS analysis was confirmed using standard soil samples (EnviroMAT SS-2). Samples for ICP-OES were weighed (~0.2 g each) and placed in a 50 mL DigiTUBEs (SCP Science, Quebec, CA, USA), where 2.5 mL of 100% (v/v) nitric acid was added. Caps were loosely placed on the tubes to allow air exchange. The samples were cold digested at room temperature for 8 h, then left to digest on hot plate at 100 °C for 8 h, or until all the sample had dissolved. The samples were then rinsed with deionized water three times while being transferred to a 25 mL volumetric flask through P8 Fast Flow Filter Paper. Then, the solution was adjusted to 25 mL using deionized water. Lastly, the sample were transferred to a 50 mL Falcon tube and stored in a refrigerator until analysis. Glassware was soaked in 5% (v/v) nitric acid overnight, rinsed with deionized water, and left to air dry prior to use. Precision of analysis was confirmed using blanks and NIST-1515-SRM apple leaves every 25 samples.
Nine soil grab samples (three per horizon) were taken from each experimental plot immediately prior to application, and 3 and 12 months after ash application. Additionally, soil cores were taken from each horizon using a soil corer, mallet, and wooden block to estimate bulk density. Horizons were classified as organic (LFH), upper mineral (Ah), and lower mineral (Bm), based on the Canadian System of Soil Classification for Sombric Brunisols [49]. Soil horizon thicknesses averaged 8 cm, 15 cm, and 10+ cm and bulk densities averaged 0.38 g cm−3, 0.59 g cm−3, and 0.98 g cm−3 for LFH, Ah, and Bm horizons, respectively. Sugar maple seedlings (n = 5) were harvested from each treatment and control plot one year after wood ash additions. Soil and seedling samples were sealed in plastic bags with soil maintained around the roots for the seedlings to maximize water retention [50] and stored at 4 °C prior to analysis.
LFH and mineral soil samples were air dried for two weeks. Dried LFH soil samples were ground using a Wiley Mill and dried mineral soil samples were sieved (<2 mm). Five grams of soil was transferred to a muffle furnace at 450 °C for 16 h to determine percent organic matter using loss-on-ignition. A 1:5 soil to 0.01M CaCl2 slurry and a 1:5 soil to reverse osmosis water slurry was used to measure pH and electrical conductivity (EC), respectively, by allowing the slurries to be stirred every 2 min for 10 min and left to rest for 10 min before taking readings using an OAKTON pH 510 series multimeter (Oakton Instruments, Vernon Hills, IL, USA). The probe was calibrated every 15 samples. Harvested sugar maple seedlings were carefully rinsed with deionized water to remove soil particles from roots and then oven-dried at 60 °C for one week. The roots, stems, and foliage were separated, then weighed to the nearest 0.0001 g to calculate root:shoot (R:S) and photosynthetic:non-photosynthetic (P:nP) ratios. The roots, stems, and foliage of dried sugar maple seedlings were ground using a ball-mill, then replicates from each treatment plot were pooled for analysis. Soil and seedlings were analyzed for total element concentrations (C, N, S, Ca, Mg, K, Na, Mn, Al, Fe, B, As, Cd, Zn, Cu, Pb, Cr, and Ni) using the same methods described above.

2.4. Statistical Analysis

On and off-Shield bark and stemwood ash nutrient and metal concentrations were compared using a paired t-test. To test the null hypothesis that ash has no effect on soil or sugar maple seedling nutrient and metal concentrations, as well as soil pH, EC, and organic matter content, comparisons were made between treated and control plots. Dunnett’s post hoc test was used to compare treatment plots with control plots, and Tukey’s HSD test was used for pairwise comparisons. The post hoc tests were completed only on those variables where a significant treatment effect was determined by one-way analysis of variance (ANOVA). Effects of treatment on seedling below-ground and above-ground biomass as well as R:S and P:nP ratios were also tested by one-way ANOVA. The R:S ratio was calculated as:
R:S = root biomass/(shoot + foliage biomass),
And the P:nP ratio was calculated as:
P:nP ratio = leaf biomass/(stem + root biomass).
When assumptions of normality and homogeneity of variance (according to Levene’s Test) were not met, a Kruskal–Wallis rank sum test was used. Significance at p = 0.05 unless otherwise stated. Significance at p = 0.1 was sometimes used to decrease probability of type II error due to small sample sizes. Statistical analyses were performed with RStudio Version 1.1.383 [51].

3. Results

3.1. Wood Ash Chemistry

3.1.1. Bark and Wood Ash Chemistry from Common Ontario Tree Species

The chemical composition of ash from the three tree species used in this study is generally representative of a broad range of tree species found in eastern North America. In general, the chemistry of ash from bark was similar to ash from stemwood in both on-Shield and off-Shield trees (Table 1). Nutrient (Ca, Mg, and K) concentrations in tree tissues were similar between on- and off-Shield trees, however there were large variations in metal concentrations, both among species and between locations (Table 1). Concentrations of most metals were higher in tissues from trees growing on-Shield (mineral soil pH averaged 4.1 units) compared with trees growing off-Shield (mineral soil pH averaged 5.2 units) and these differences were species dependent (Figure S1).

3.1.2. Non-Industrial Wood Ash Chemistry; Sugar Maple, White Pine, and Yellow Birch

Sugar maple ash had a higher pH and EC than white pine and yellow birch ash (Table 2). Nutrient (base cation, C, N, and S) concentrations were generally similar among ash types and as expected mineral concentrations (Ca, Mg, and K) were much higher than concentrations of N and S in all ashes (Table 2). In contrast to nutrients, metal chemistry varied considerably among ashes and yellow birch ash generally had much higher concentrations of several metals. For example, yellow birch ash contained 12 times more Zn, 9 times more As, 6 times more Cd and Pb, and 2–3 times more Cu and Co than ash from the other two species. However, sugar maple ash had higher concentrations of Fe, Cr and V.
Sugar maple and white pine ash concentrations were well within unrestricted (CM1) and restricted (CM2) non-agricultural source material (NASM) limits for land application of wood ash [52], with the exception of Se which had mean concentrations just above the unrestricted target (Table 1). Yellow birch ash had Cu, Cd, Zn, and Se concentrations just above the unrestricted target, but all metals fell well below limits for restricted use.

3.2. Effects of Wood Ash on Soil Chemical and Physical Properties

Prior to ash application, soils were acidic, ranging from a pH of 4.2 in the LFH horizon, to 3.7 and 3.8 in the upper (Ah) and lower (Bm) mineral horizons, respectively (Tables S1–S3). Three months following ash application, there were many changes to soil physical and chemical properties in the ash treatments, with the most pronounced changes occurring in the LFH horizon (Table S4). For example, soil pH was significantly higher (0.4–0.7 pH units) in sugar maple and white pine ash treatment plots compared with control plots in the LFH horizon.
Similar changes to soil physical and chemical properties were observed twelve months following ash application (Table 3). The pH of the LFH and Ah horizons were significantly higher in all ash treatments compared with control plots. Sugar maple ash treatment plots had the largest increases in soil pH in both horizons (1.1–1.4 pH units) compared with control plots. Soil EC was higher in treatment plots compared with control plots in LFH and Bm horizons, however no significant treatment effect was found in any horizon. There was also no significant treatment effect on soil organic matter one year after ash application in any horizon.

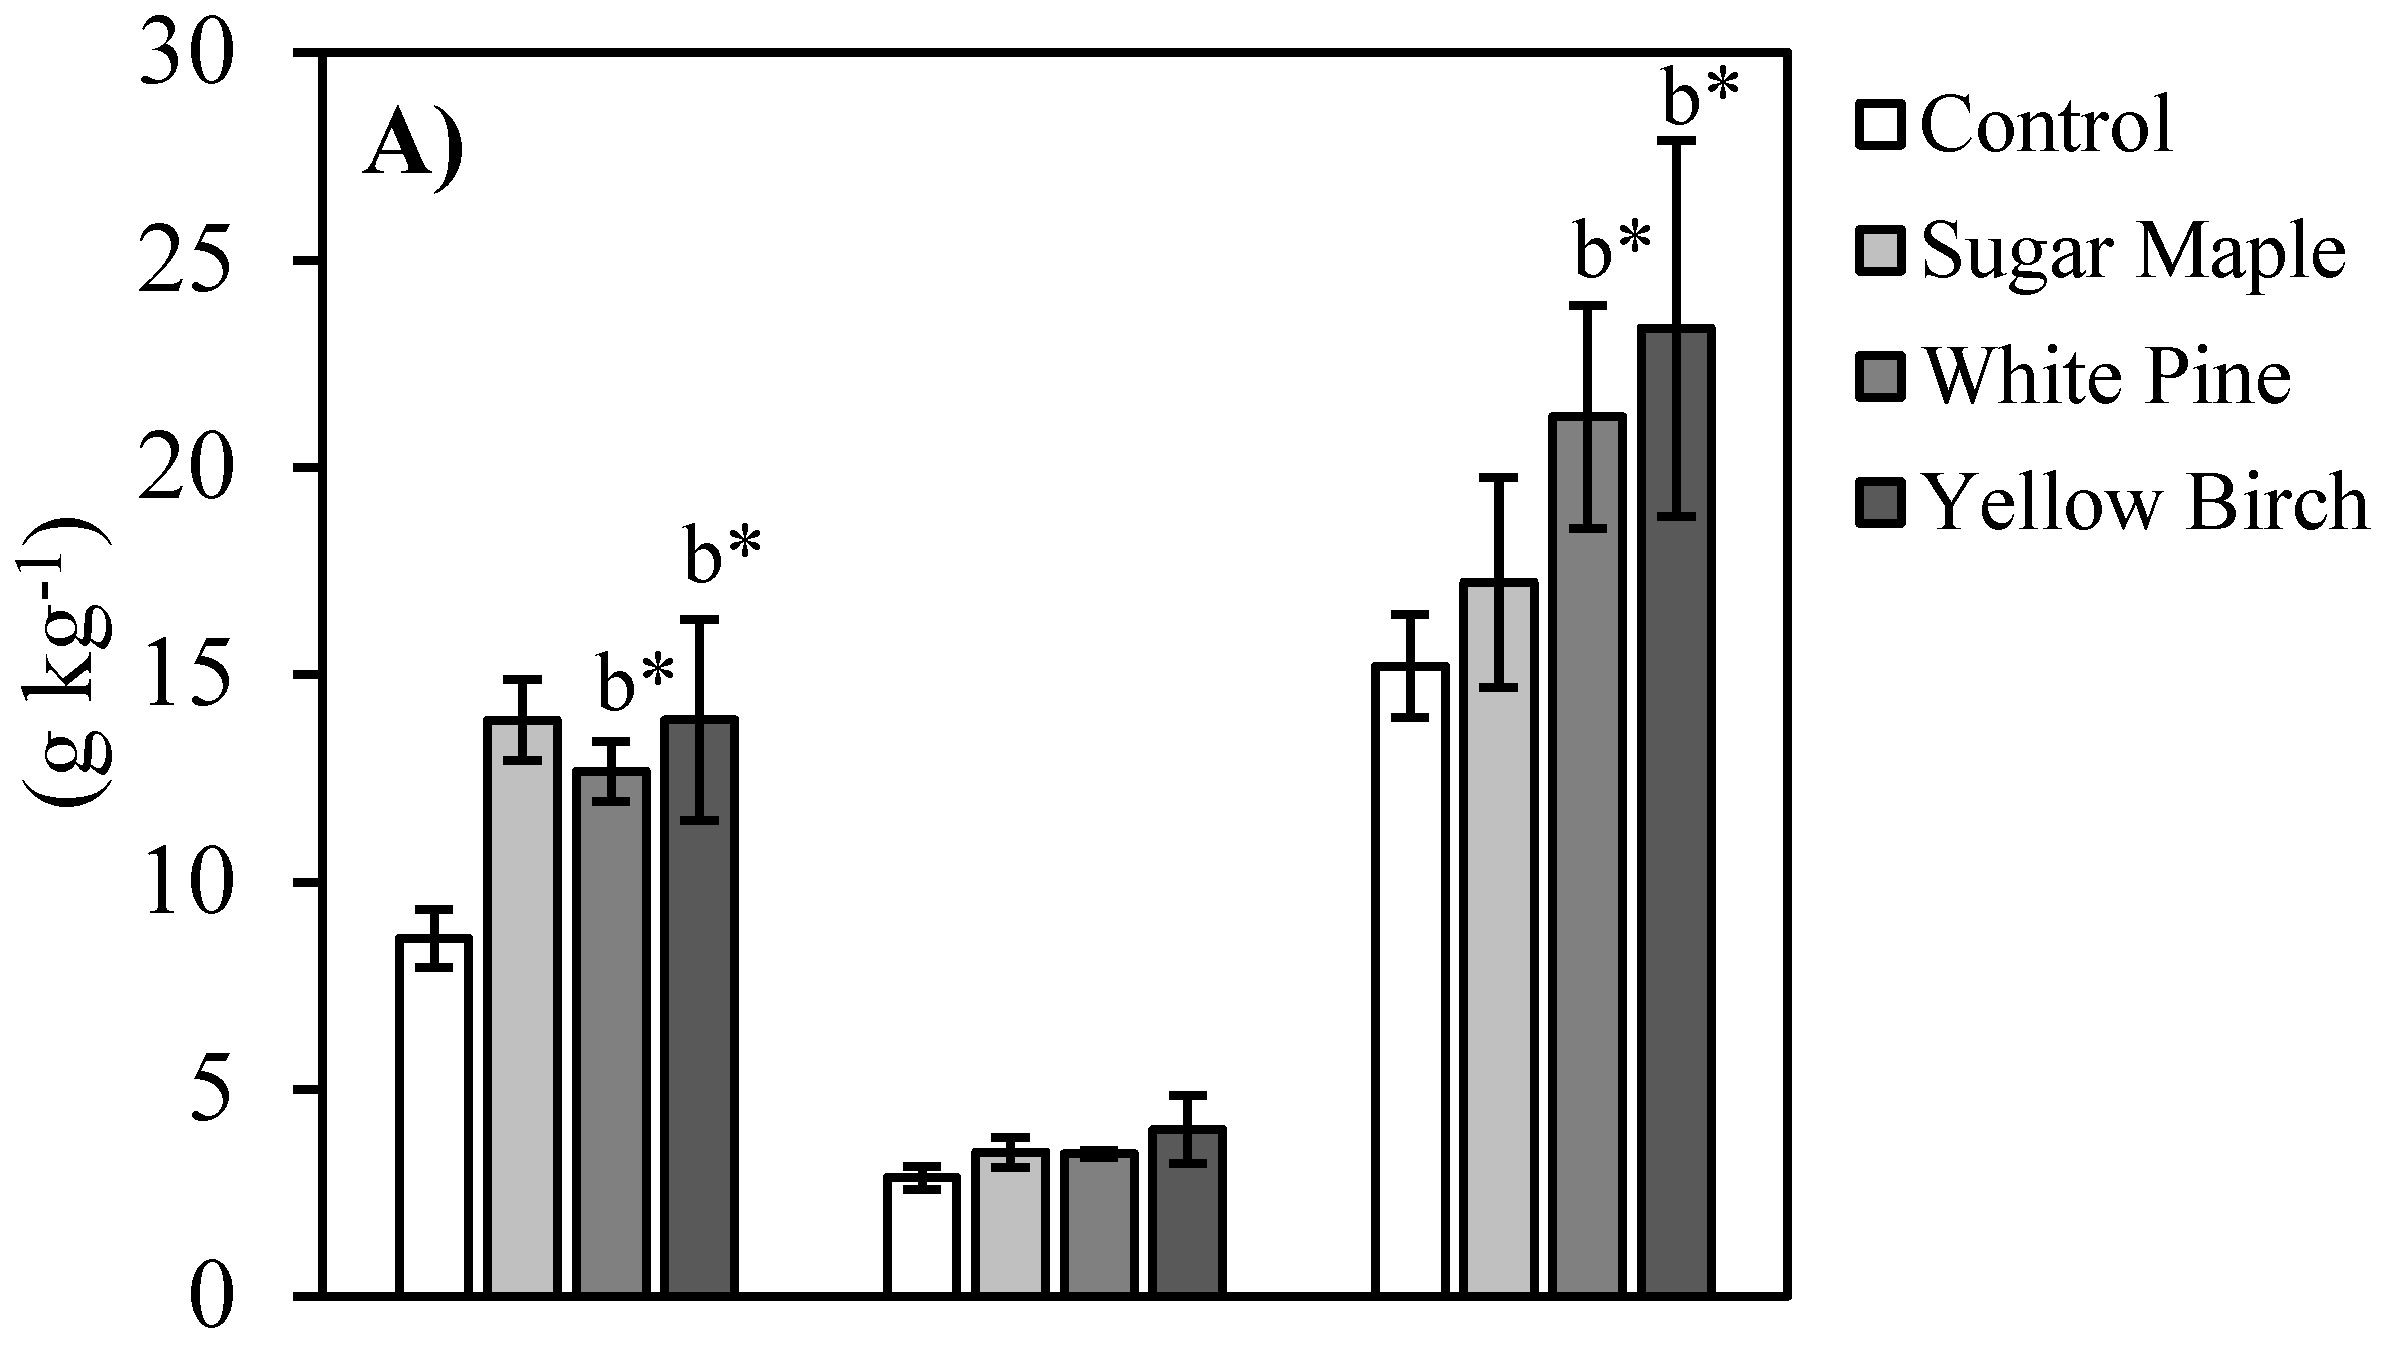
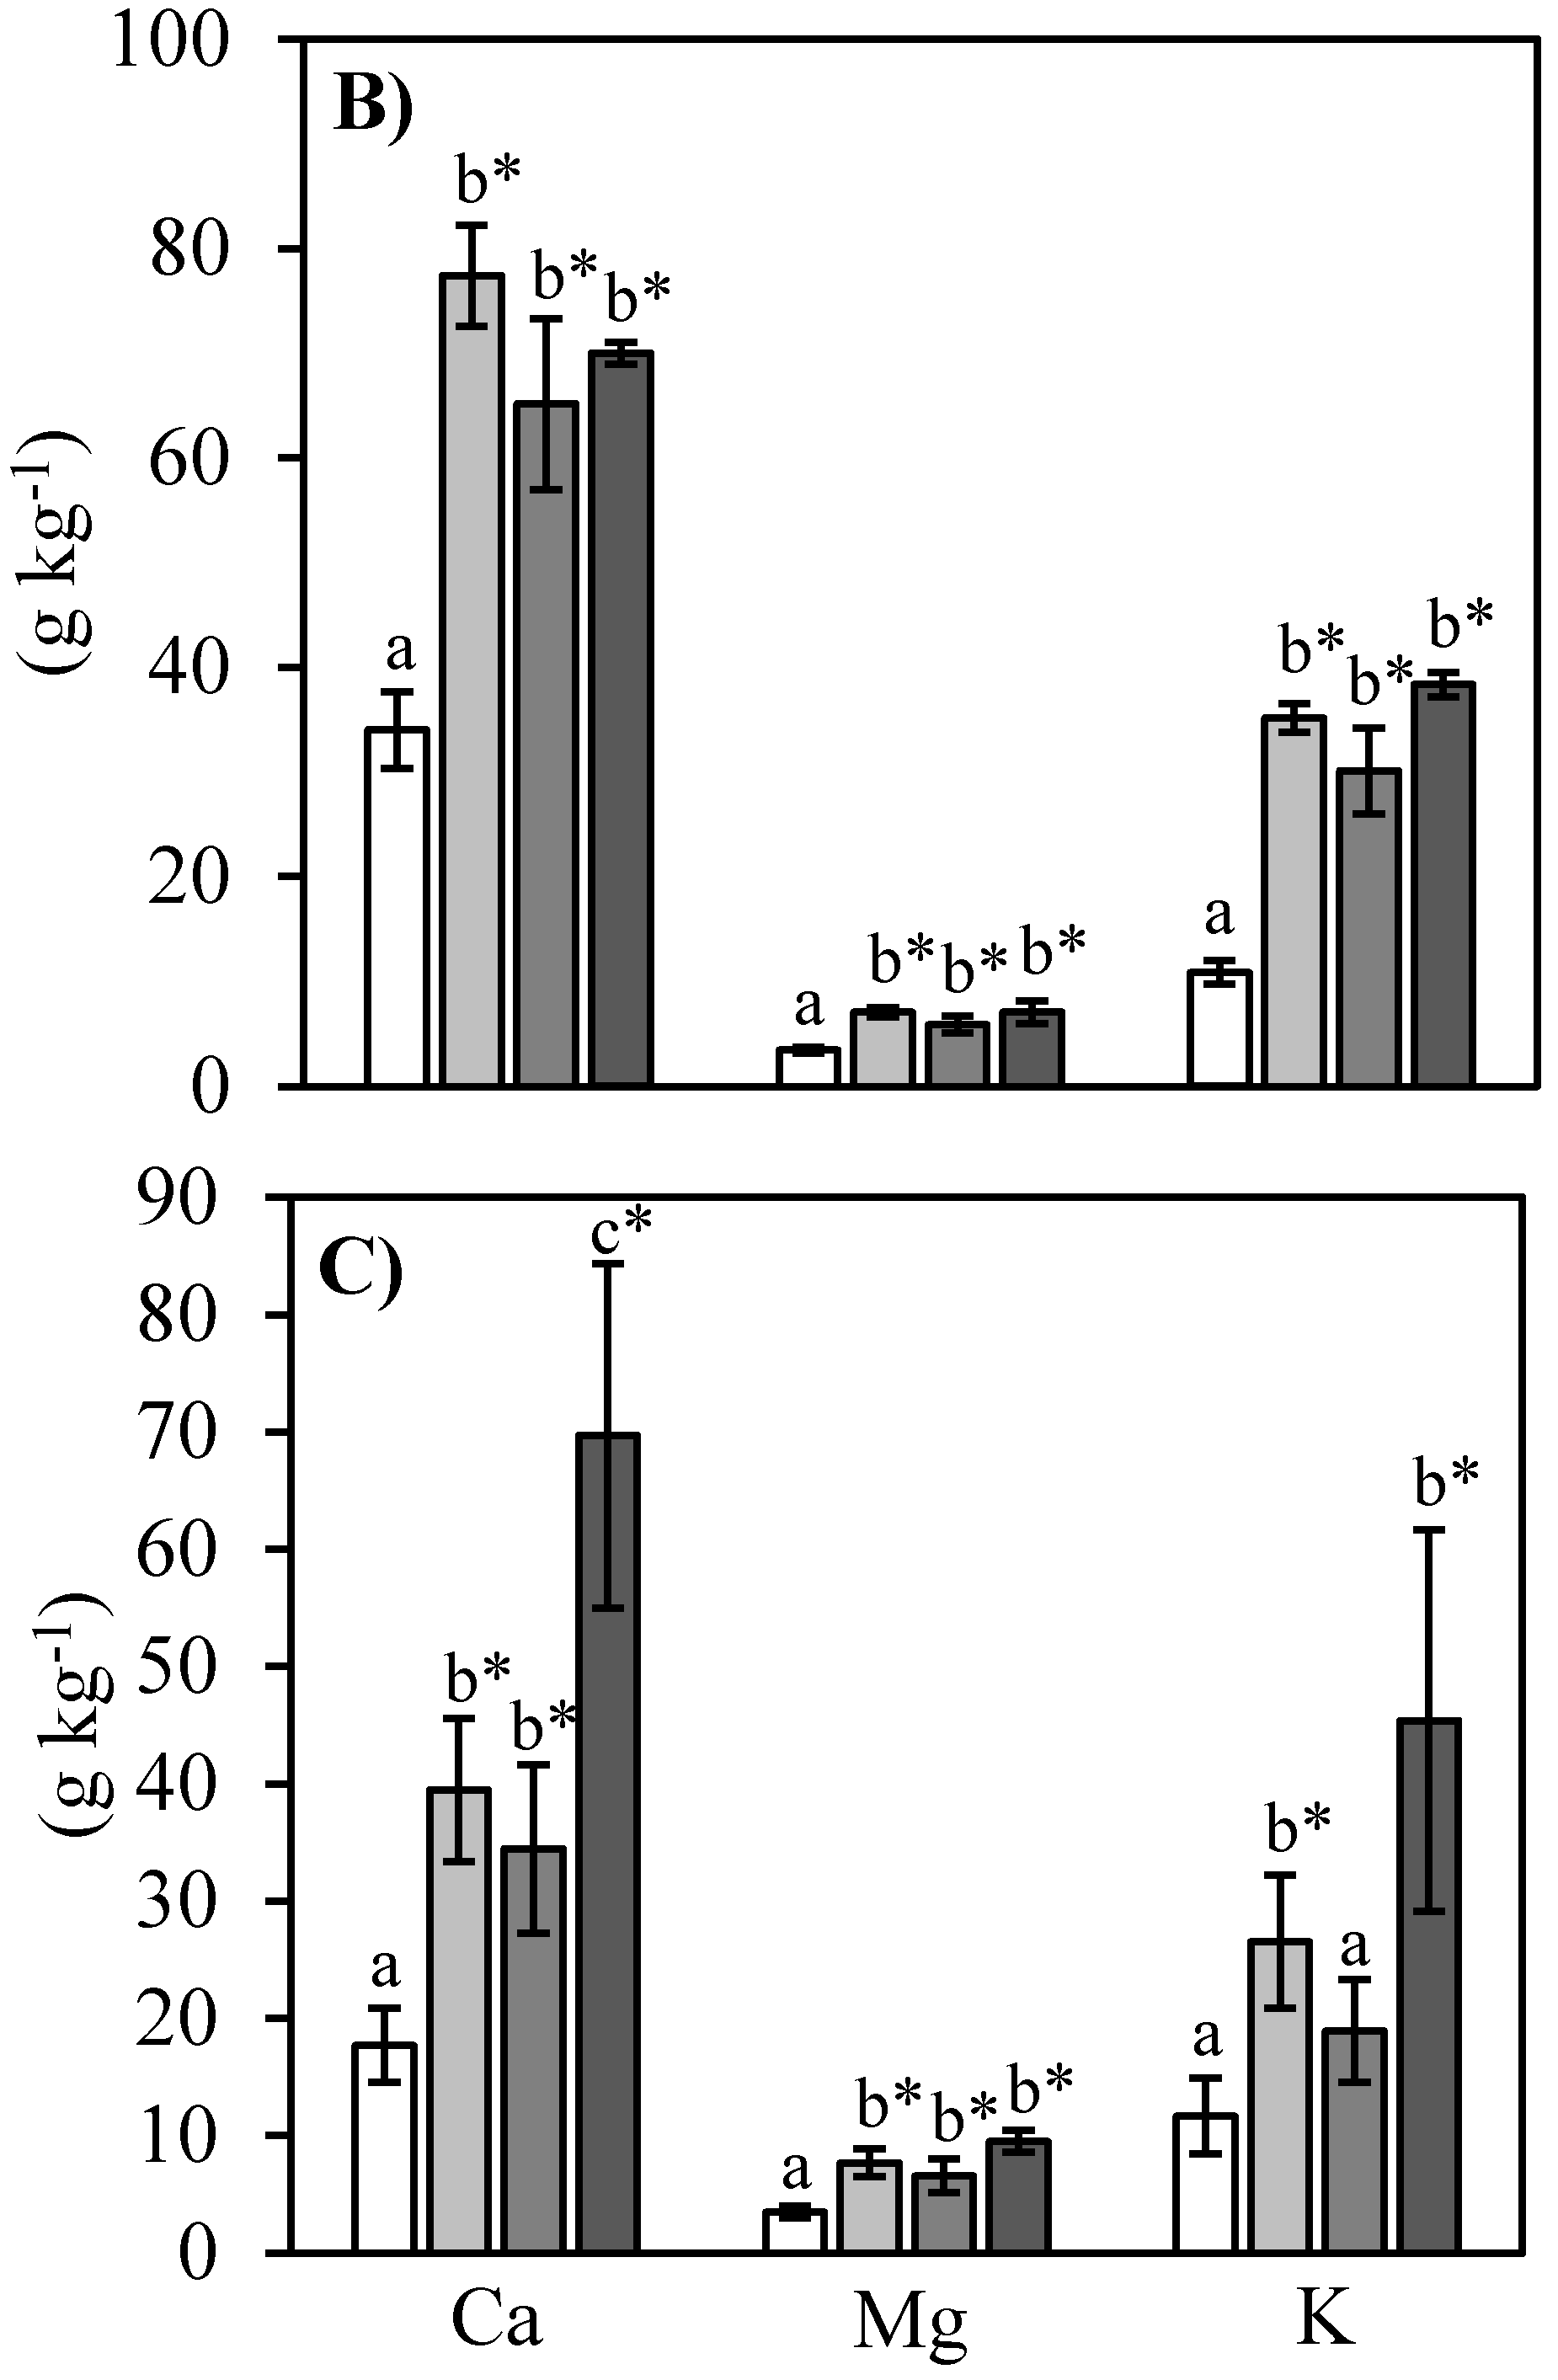
3.2.1. Soil Base Cation Concentrations

In general, exchangeable concentrations of base cations in upper soil horizons in the ash treatments were higher than, or similar to, values measured in control plots in all three horizons after 3 months and after one year (Table S4 and Table 3). Three months after ash application exchangeable base cation concentrations (Ca, Mg, and K) in upper soil horizons increased in all treatment plots compared with the control, although a significant treatment effect was found only for Ca concentrations in white pine plots (Table S4). One year following ash application, concentrations of Ca in the LFH and Ah horizons were significantly higher (approximately twice as high) in sugar maple and white pine treatment plots compared with control plots (Table 3). Concentrations of Mg were also significantly higher in sugar maple ash plots compared with control plots, but there were no significant differences in soil K or soil Na concentrations among treatments (Table 3).

3.2.2. Soil Metal Concentrations

Concentrations of metals in soils following ash application varied among treatments, however there were few significant differences among ash treatments and generally soil metal concentrations were low. There were also some instances where the ash treated soils in some horizons had lower metal concentrations than the control (Tables S5–S7). In general, concentrations of Mn, Zn, Ba, Se, and Sr were highest in the LFH horizon and decreased with depth, concentrations of Pb and Ni were highest in the Ah horizon, and concentrations of Al and Fe were highest in the Bm horizon.
Twelve months following ash application, plots treated with yellow birch ash, which generally had the highest metal content, had the highest metal concentrations in the organic horizon, however a significant treatment effect was only found for Zn (Table 4). For example, Zn concentrations were about two times higher in yellow birch plots (122 mg kg−1) compared with other treatment (73.8 mg kg−1 in sugar maple and 62.7 mg kg−1 in white pine) and control (60.7 mg kg−1) plots in the organic horizon. In contrast, metal concentrations in Ah and Bm horizons measured after 12 months showed no consistent response to wood ash treatments with concentrations of some metals in wood ash plots being lower than those measured in control plots, most likely as a result of inherent variability in natural soil properties (Tables S8 and S9).

3.3. Effects of Ash on Sugar Maple Seedlings

3.3.1. Seedling Growth

There was no treatment effect on sugar maple growth metrics assessed in this study after one year (Table 5). There was no difference in R:S ratio (Chi square = 0.842, p = 0.84, df = 3) or P:nP ratio (Chi square = 3.646, p = 0.30, df = 3), although sugar maple seedlings treated with wood ash had a higher R:S ratio compared with seedlings from control plots. Belowground (root) and aboveground (shoot and foliage) biomass were not significantly different among treatment and control plots, and all plots, including control, allocated 70%–72% dry weight (DWT) of their total mass to aboveground tissues.

3.3.2. Seedling Nutrient Concentrations

There were large differences in sugar maple seedling foliar, stem, and root nutrient concentrations among treatments after one year of ash application (Figure 1). Foliar Ca concentrations were significantly higher than control plots in all ash treatments (F3,16 = 6.92, p = 0.003) and foliar K concentrations were significantly higher than controls in white pine and yellow birch treatments (F3,16 = 2.07, p = 0.014; Figure 1a). Foliar Ca, Mg, and K in all ash treatments including the control were also well above critical threshold values (5 g kg−1 Ca, 1.1 g kg−1 Mg, and 5.5 g kg−1 K) for healthy trees [53] (Figure 1a–c). Seedling stem and root Ca, Mg, and K concentrations were also significantly higher (p < 0.05) than controls in all treatment plots, except for root K concentrations in white pine treatment plots (Figure 1b,c).

3.3.3. Seedling Metal Concentrations

One year after ash addition, there were no significant differences in foliar metal concentrations among treatments (Table 6). In contrast, concentrations of most metals were higher in seedling stems and/or roots in the ash treatments compared with control plots. Significant treatment effects were mainly observed in sugar maple and yellow birch ash treatment plots, however significantly higher stem B and Pb concentrations and root Zn concentrations relative to controls were also observed in white pine ash treatment plots. Generally, the largest differences in stem and root metal concentrations were observed in yellow birch ash treatment plots, which was the ash with the highest metal content (Table 2). In yellow birch treated seedlings, root Mn concentrations were three times higher than control seedlings, root B, As, Cd, and Pb concentrations were two times higher than control seedlings, and root Zn concentrations were four times higher than control seedlings. In stem tissues, seedlings treated with yellow birch ash had concentrations of Al, As, B, Cd, Ni, Pb, and Zn that were two to four times higher than control seedlings (Table 6).

4. Discussion

A substantial amount of non-industrial wood ash is produced in Ontario, enough to treat approximately 4500 ha of acidified forests in Muskoka per year [24]. Currently, a non-industrial wood ash recycling program is underway in Muskoka [54] that targets sensitive areas on an ongoing basis. The recycling program hopes to expand their initiative beyond that of a local scale in areas where wood burning is common, however the properties and biogeochemical responses of non-industrial wood ash have not been thoroughly explored. Our study indicates that non-industrial wood ash application may have a positive effect on forest soil base cation status and a neutral effect on short-term (1-year) sugar maple seedling growth. However, we also found some metal enrichment in soils following ash application, especially in ashes with higher metal concentrations, as well as elevated metal concentrations in sugar maple seedling roots and stems. This research indicates that there is considerable variability in chemical properties among residential ash samples and analysis of these ashes before use as a soil amendment is recommended.
Non-industrial wood ash is burned under different conditions than industrial ash and its composition is likely much more variable than ash from industrial sources. Therefore, it is important to understand the chemical composition of NIWA before it may be used as a forest soil amendment. In a regional survey of ash generated from bark and wood tissues, we found differences in metal concentrations between common tree species found in central Ontario. Generally, on-Shield bark and stem samples had higher metal concentrations than off-Shield tree samples indicating that metal accumulation is generally higher on acidic soils, which translates into higher ash metal concentrations. A dendrochemical survey of sugar maple on 22 sites in central Ontario reported the pH of northern soils overlying the Precambrian Shield to range from 3.9–4.9 pH units, whereas off-Shield soils ranged from 5.5–7.0 pH units [55], and it is widely accepted that decreases in soil pH increases availability of many metals [18,56].
The pH and nutrient concentrations of all three NIWA types used in the field study were within the ranges reported previously for wood-fired boiler ashes [57], and industrial fly ashes [58]. However, concentrations of Ca and Mg were below non-industrial (ash from wood stoves or wood-fired pizza ovens) ranges reported by [38] who analyzed nine non-industrial ashes and found the range of Ca concentrations in ash to be 268–319 g kg−1 and Mg concentrations in ash to be 15–24 g kg−1. The ash used in this study had Ca concentrations ranging from 156–209 g kg−1 and Mg concentrations ranging from 9.6–10.1 g kg−1.
Concentrations of all metals in the three residential ashes fell below CM2 Non-Agricultural Source Material guidelines for restricted use of wood ash, however some metals (Cu, Cd, Zn, and Se) were above CM1 Non-Agricultural Source Material guidelines for unrestricted land use in yellow birch (Cu, Cd, Zn, and Se) and sugar maple (Se) ashes [52]. There are currently no guidelines in Ontario for concentrations of V, Be, and Sr, however concentrations of these elements could be regulated in certain provinces eventually and the values reported in this study may be beneficial for future wood ash producers and appliers. There is very little published data on ranges of metal concentrations for NIWA. Compared with the NIWA samples of [38], which were reported to most likely be a mixture of combusted maple, beech, oak, birch, ash, and cherry trees, two of the ashes used in this study had similar metal concentrations for As, molybdenum (Mo), Cd, Co, Ni, and Se. However, yellow birch ash used in our study had 3.5 times the upper limit for Zn concentrations (2389 mg kg−1 versus 676 mg kg−1), 2 times the upper limit for Pb concentrations (29.7 mg kg−1 versus 14.1 mg kg−1), and 1.4 times the upper limit for Cu concentrations (29.7 mg kg−1 versus 14.1 mg kg−1) reported by [38]. Sugar maple ash Cr concentrations were 6.6 times the upper limit for NIWA reported by [38]. Variations in metal concentrations among NIWA types could also be due to site specific conditions such as soil acidity.
Concentrations of all metals (except for Cr and Zn) in the NIWA used in this study were within the ranges or lower for wood-fired boiler ashes [16,28,59]. Chromium concentrations in wood-fired boiler ashes range from 9–16 mg kg−1 and Zn concentrations range from 35–1250 mg kg−1 [57]. In this study, sugar maple ash had a Cr concentration of 49 mg kg−1 and yellow birch ash had a Zn concentration of 2389 mg kg−1. Compared with industrial fly and bottom ashes, all three NIWA types had metal concentrations well within ranges, with the exception of yellow birch ash, which had Cu concentrations slightly above reported average upper ranges for fly ash, and Cd and Zn concentrations slightly above reported average upper ranges for bottom ash [58]. The on- and off-Shield tree species survey highlights yellow birch as a potential outlier, having high concentrations of Mn, Cd, and Cr compared with other tree species. Concern for ashes of tree species that are accumulators of certain metals must be addressed before their use as a forest soil amendment.
The strong neutralizing effect of wood ash is widely recognized in literature [20,21,60]. Dissolution of oxides, hydroxides, and carbonates in ash result in hydroxyl and bicarbonate ions, which neutralize protons in the soil solution and on soil exchange sites [61,62,63]. An ash-induced LFH soil horizon pH increase of 0.4–1.1 units was observed in treatment plots after one year, similar to that reported in several short-term studies that applied ash in moderate doses (5–6 Mg ha−1 wood ash) to acidic forest soils [64,65,66]. Increases in mineral soil pH after one year were proportional to the initial pH of the ash treatments and were higher than those observed in literature, which generally reported slight increases [66,67] to no change [60] in mineral soil pH up to six years following ash application. The relatively large increase in mineral soil pH could be due to the high initial pH of the residential wood ash used in this study (12.1–13.1) compared with averages reported for wood ashes from industrial sources [17,18,57]. Reference [22] found a that a higher wood ash pH generally resulted in higher organic soil horizon pH increases following an eight-week incubation experiment. The large increase in mineral soil pH could also be due distinguishing the upper mineral soil from deeper mineral layers where effects take longer to develop [68,69], and we did not observe an increase in pH in the Bm soil horizon. Although only one sugar bush is evaluated, the study site was a good representation of soils typically found in central Ontario [70] and the results are likely transferrable across large parts of the region.
Increases in soil EC following ash addition are consistent with current literature [46]. Wood ash releases large amounts of soluble salts, increasing soil EC [56]. High EC could cause excess salinity in forest soils [22], However our values were well under 400 ms m−1, which is considered detrimental to forest soils [71].
Exchangeable base cation concentrations in soil at our site were similar to values reported in nearby sugar maple tree stands [72,73]. Reference [72] found surface soil under healthy trees had 2.7 g kg−1 Ca and 1.2 g kg−1 Mg, whereas soil under unhealthy trees had 1.3 g kg−1 Ca and 0.5 g kg−1 Mg. Surface mineral soils (Ah) at our site one year after application had 1.5–3.6 g kg−1 Ca and 0.6–0.9 g kg−1 Mg, which may indicate low Mg levels in soil even after ash treatment.
In this study, the addition of sugar maple and white pine ashes generally increased Ca, Mg, and K concentrations and decreased Mn, Al, and Fe concentrations in the organic horizon three months after application. Following an ash-induced increase in soil pH, H+ ions bound to proton exchange sites are replaced by base cations [74] or strongly binding metal cations such as Cd, Cu, Pb, and Zn that are present in ash [75], which may lead to higher concentrations of base cations and some metals in soil. Initial decreases in concentrations of Al, Fe, and Mn in soil are thought to be due to an ash induced soil pH increase resulting in these elements being displaced from cation exchange sites [21,67,76]. In yellow birch plots, Al concentrations remained close to control values and were even higher in the Bm horizon during the second soil sampling period, which could be due to the high Al concentrations in the ash compared with the other treatments. Overall, with the exception of the yellow birch ash our results are similar to those reported in literature, where an increase in exchangeable Ca, Mg, and K [22,60,67] and decrease in Al, Fe, and Mn [21,66,77] have been reported in the upper 0–20 cm organic soil follow 5–6 Mg ha−1 ash addition.
The effects of wood ash on upper mineral soil layers could be seen 12 months after application. This is consistent with the results of [66] and [77] who reported moderate changes in the B horizon 12–25 months following application of 6 Mg ha−1 and 8 Mg ha−1 wood ash, respectively. In this study, increased concentrations of Ca were seen in the organic and upper mineral soil horizons after 12 months, however in the upper mineral soil only Ca and Mg were still found in higher concentrations. Potassium and Na are easily released from wood ash [78] and could have been mobilized in the soil solution by the second soil sampling period [62]. Increased concentrations of soil Ca, Mg, and K are prominent findings as they suggest wood ash addition as a strategy to return nutrients and base cations to a forest system that has lost large amounts of base cations over the past 50 years.
Concern over use of wood ash as a soil amendment is largely regulated by the presence of heavy metals and their fate following application [79,80], as the application of ashes high in metal content could result in the accumulation of toxic metals in the upper soil horizons [20]. Generally, even though metal levels in the ashes varied, especially in yellow birch, soil responses were generally low. This is likely due to natural metal pools in the soil being large relative to the amount added in the ash and the inherent variability in soil metal concentrations. For example, the maximum amount of Al added to the soil (10 g kg−1 from yellow birch ash) represented approximately 1.5% of the Al content in the Ah horizon, and the relative amount of all other metals added was less than <1% of the natural soil metal pool. It is possible that ash may alter the natural distribution of metals in soil leading to some differences among treatments. For example, Pb concentrations were higher in organic horizons with yellow birch ash applied after three months but were lower in the Ah horizon after 12 months. This pattern is similar to that reported by [77], who found an increase in Pb concentrations after one month and decreased Pb concentrations after six months in the upper 0–9 cm of soil. This is thought to be due to increased soil pH initially immobilizing the metal [22] and subsequent re-mobilization of organically bound Pb in the organic layer [77]. Overall however, there were few significant differences in metal concentrations in both mineral soil horizons and in some cases, metal concentrations were lower in ash treated plots. In yellow birch ash treated plots, concentrations of Al, Zn, Cu, and Sr significantly increased in the lower mineral soil, and in sugar maple ash treated plots, a similar pattern was observed for Cr and Sr 12 months after ash addition. These differences are generally small and most likely reflect site to site variability rather than treatment effects from ash application.
One year after ash application, there was a significant treatment effect on sugar maple seedling foliar nutrient concentrations. Previous research conducted at the study site reported sugar maple leaves to be deficient in Ca and Mg [47] and it has been suggested that tree growth responses to wood ash addition will not occur if nutrients other than Ca are also limiting [68]. In this study, control seedlings had lower foliar Ca (8.6 g kg−1) and Mg (2.8 g kg−1) concentrations compared with treatment plots, but they were still within reported typical healthy ranges for sugar maple trees of 5.0–21.9 g kg−1 Ca and 1.1–4 g kg−1 Mg reported by [53]. Foliar K in control (15.2 g kg−1) and treatment (17.2 to 23.4 g kg−1) plots were above typical ranges for healthy sugar maples (5.5–10.4 g kg−1) reported by Kolb and McCormick (1993) [53]. Relatively high concentrations of foliar Ca, Mg, and K in seedings at all plots, including the control, may explain a lack of growth response to ash additions compared with similar studies which found positive growth responses of sugar maples following Ca addition [79,80,81,82]. For example, [82] reported that foliar Ca concentrations in seedlings approximately doubled relative to controls one- and two-years following addition of 0.85 Mg ha−1 Ca (as wollastonite). In their study, seedlings in control and treatment plots appeared deficient in foliar Ca before application (5.0 g kg−1 Ca) and seedlings in this study were within healthy ranges for foliar Ca concentrations before ash addition. Similarly, improvements in basal area growth, canopy health, and foliar nutrition have been shown in sugar maple trees deficient in foliar Ca (4.0 to 5.5 g kg−1) following applications of wollastonite, calcium chloride, and dolomitic lime to base poor northern hardwood forests [81,83,84].
Nutrient deficiencies, other than base cations could also contribute to the lack of positive seedling growth responses following ash addition. Phosphorus was not analyzed in this study and P deficiency in sugar maple has been indicated regionally [43,85] and in other regions of eastern North America [86]. Furthermore, positive plant growth responses may have not been seen because of the short time between ash application and our measurements [87]. Reference [82] noted that seedling growth responses were much greater two years after the addition of wollastonite to Hubbard Brook Experimental Forest compared with one year. Furthermore, longer studies on seedling growth may be required to see any positive growth effects, as growth responses in some field studies have not observed until four [88] or six [84] years after lime application.
A potential risk of applying wood ash is the increase in heavy metals input directly from wood ash or resulting from soil exchange and mineralization processes [89]. Accumulation of metals following ash addition can inhibit plant growth [44,90], and translocation from roots to other plant components has been reported for Pb [91], Zn [92], and Cd [60]. In this study, increased concentrations of many metals were found in seedling roots following ash addition. Roots act as exchange sites similar to soil organic matter [93], and some root metal concentrations are highly correlated to the exchangeable soil fraction [89]. For example, Cr concentrations in both the root tissues of seedlings and lower mineral soil from sugar maple ash plots were 1.6 times higher compared with values of seedlings and soil in control plots. Increased root metal levels could be a direct consequence of inputs from ash. However, it has also been suggested that the mobility of non-essential plant metals such as Cd, Ni, and Pb originates from the soil and not the ash [94]. High levels of base cations in ash may stimulate desorption of non-essential plant metals already present in the soil, through cation exchange reactions mobilizing metals or through cation displacement of hydrogen (H+), ions which lowers solution pH, and increasing metal availability [94]. However, no increases in foliar metal concentrations were observed, and it is possible that the roots acted as a detox system and restricted translocation to foliage [95].
There was no change in R:S or P:nP ratios of sugar maple seedlings following ash addition, suggesting that elevated levels of metals in roots and stems of sugar maple seedlings did not have an adverse effect on sugar maple seedling growth. There was also no difference in root or shoot growth following ash application, further suggesting no signs toxicity in sugar maple seedlings. These findings suggest that in the short-term at least, the increase in metal availability that occurs following ash addition (especially in yellow birch ash that has the highest metal content) is not harmful to sugar maple seedlings, but potential impacts on other ecosystem components (e.g., other tree species, microbial, and invertebrates) or in the longer term (>1 year) require careful evaluation.

5. Conclusions

Metal concentrations in the three NIWA were lower than recommended limits for unrestricted land application in Ontario with the exception of Cu, Cd, and Zn concentrations, but these metals were under limits for restricted land use. Non-industrial wood ash increased soil pH, soil base cation concentrations, and sugar maple seedling foliar base cation concentrations. Soil metal responses were muted, and few consistent differences among treatments were found; likely reflecting the relatively low amount of metal added relative to natural metal pools and high variability. Metal concentrations were higher in root and shoot tissues, however no negative effects on seedling growth were observed and there was no treatment effect on sugar maple seedling foliar metal concentrations. These results indicate that NIWA, applied at moderate doses, could be a viable forest soil amendment in acidic soils. However, pre-leaching [96], acidifying, and/or stabilizing [60] NIWA may improve its benefits as a soil amendment. There is considerable variability in physical and chemical properties among NIWA samples and analysis of these ashes before use as a soil amendment is recommended. Future research should focus on long-term effects of NIWA on acidic forest soils; specifically, looking at metals that have accumulated in the upper mineral soil and their potential to become mobilized once the effects of ash on increased soil pH subside.

Supplementary Materials

The following are available online at https://www.mdpi.com/1999-4907/11/6/693/s1, Figure S1: Nutrient and metal bark concentrations from eleven common tree species found on and off of the Canadian Shield in central Ontario. Each circle represents a different tree species, Table S1: Bracebridge LFH horizon soil physical and chemical properties (means ± S.E) prior to ash application, Table S2: Bracebridge Ah horizon soil physical and chemical properties (means ± S.E) prior to ash application, Table S3: Bracebridge Bm horizon soil physical and chemical properties (means ± S.E) prior to ash application, Table S4: Soil chemical and physical properties (mean ± S.E.) three months after application. Significant differences from pairwise comparisons (Tukey) indicated with different letters. Significant differences (*) to control were determined by Dunnett’s post hoc test. The post hoc test was completed only on those variables where a significant treatment effect (p < 0.1) was determined by one-way ANOVA. All values represent total concentrations, Table S5: LFH horizon soil total elemental concentrations (means ± S.E.) 3 months after ash application. Significant differences (p < 0.1) from pairwise comparisons (Tukey) indicated with different letters. Significant differences to control (Dunnett) indicated by an asterisk (*). The post hoc tests were completed only on those variables where a significant treatment effect was determined by one-way ANOVA, Table S6: Ah horizon soil total elemental concentrations (means ± S.E.) 3 months after ash application. Significant differences (p < 0.1) from pairwise comparisons (Tukey) indicated with different letters. Significant differences to control (Dunnett) indicated by an asterisk (*). The post hoc tests were completed only on those variables where a significant treatment effect was determined by one-way ANOVA, Table S7: Bm horizon soil total elemental concentrations (means ± S.E.) 3 months after ash application. Significant differences (p < 0.1) from pairwise comparisons (Tukey) indicated with different letters. Significant differences to control (Dunnett) indicated by an asterisk (*). The post hoc tests were completed only on those variables where a significant treatment effect was determined by one-way ANOVA, Table S8: Ah horizon soil total elemental concentrations (means ± S.E.) 12 months after ash application. Significant differences (p < 0.1) from pairwise comparisons (Tukey) indicated with different letters. Significant differences to control (Dunnett) indicated by an asterisk (*). The post hoc tests were completed only on those variables where a significant treatment effect was determined by one-way ANOVA, Table S9: Bm horizon soil total elemental concentrations (means ± S.E.) 12 months after ash application. Significant differences (p < 0.1) from pairwise comparisons (Tukey) indicated with different letters. Significant differences to control (Dunnett) indicated by an asterisk (*). The post hoc tests were completed only on those variables where a significant treatment effect was determined by one-way ANOVA.

Author Contributions

Conceptualization, H.D.D. and S.A.W.; methodology, H.D.D.; formal analysis, H.D.D.; investigation, H.D.D.; resources, S.A.W.; writing—original draft preparation, H.D.D.; writing—review and editing, S.A.W.; visualization, H.D.D.; supervision, S.A.W.; funding acquisition, S.A.W. All authors have read and agreed to the published version of the manuscript.

Funding

This research was funded by NATURAL RESOURCES CANADA, grant number 311790-2011, to Shaun Watmough.

Acknowledgments

The authors would like to thank ASHMuskoka, namely Shakira Azan and Norman Yan, for their assistance in locating the non-industrial wood ash used in this project. The authors would also like to thank Ken and Katia Riley for providing the study location and numerous field assistants who setup and maintained field plots.

Conflicts of Interest

The authors declare no conflict of interest. The funders had no role in the design of the study; in the collection, analyses, or interpretation of data; in the writing of the manuscript, or in the decision to publish the results.

References

  1. Beamish, R.J.; Harvey, H.H. Acidification of the La Cloche Mountains Lakes, Ontario, and Resulting Fish Mortalities. Fish. Res. Board Can. 1972, 29, 1131–1143. [Google Scholar] [CrossRef]
  2. Scheider, W.A.; Jeffries, D.S.; Dillon, P.J. Effects of acidic precipitation on Precambrian freshwaters in southern Ontario. J. Great Lakes Res. 1979, 5, 45–51. [Google Scholar] [CrossRef]
  3. Johnson, D.W.; Richter, D.D.; Lovett, G.M.; Lindberg, S.E. The effects of atmospheric deposition on potassium, calcium, and magnesium cycling in two deciduous forests. Can. J. For. Res. 1989, 15, 773–782. [Google Scholar] [CrossRef]
  4. Likens, G.E.; Driscoll, C.T.; Buso, D.C. Long-term effects of acid rain: Response and recovery of a forest ecosystem. Science 1996, 272, 244–246. [Google Scholar] [CrossRef]
  5. Duchesne, L.; Ouimet, R.; Houle, D. Basal area growth of sugar maple in relation to acid deposition, stand health, and soil nutrients. J. Environ. Qual. 2002, 31, 1676–1683. [Google Scholar] [CrossRef]
  6. McLaughlin, D.L.; Linzon, S.N.; Dimma, D.E.; McIlveen, W.D. Sugar maple decline in Ontario. In Effects of Atmospheric Pollutants in Forests, Wetlands, and Agricultural Ecosystems; Hutchinson, T.C., Meema, K.M., Eds.; Springer: New York, NY, USA, 1987; pp. 101–116. [Google Scholar]
  7. Horsley, S.B.; Long, R.P.; Bailey, S.W.; Hallett, R.A.; Hall, T.J. Factors associated with the decline-disease of sugar maple on the Allegheny Plateau. Can. J. For. Res. 2000, 30, 1365–1378. [Google Scholar] [CrossRef]
  8. Drohan, P.J.; Stout, S.L.; Petersen, G.W. Sugar maple (Acer saccharum Marsh.) decline during 1979–1989 in northern Pennsylvania. For. Ecol. Manag. 2002, 170, 1–17. [Google Scholar] [CrossRef]
  9. Lawrence, G.B.; Hazlett, P.W.; Fernandez, I.J.; Ouimet, R.; Bailey, S.W.; Shortle, W.C.; Smith, K.T.; Antidormi, M.R. Declining acidic deposition begins reversal of forest-soil acidification in the northeastern U.S. and eastern Canada. Environ. Sci. Technol. 2015, 49, 13103–13111. [Google Scholar] [CrossRef] [PubMed]
  10. Huntington, T.G.; Hooper, R.P.; Johnson, C.E.; Aulenbach, B.T.; Cappellato, R.; Blum, A.E. Calcium depletion in a Southeastern United States forest ecosystem. Soil Sci. Soc. Am. J. 2000, 64, 1845–1858. [Google Scholar] [CrossRef]
  11. Olsson, B.A.; Bengtsson, J.; Lundkvist, H. Effects of different forest harvest intensities on the pools of exchangeable cations in coniferous forest soils. For. Ecol. Manag. 1996, 84, 135–147. [Google Scholar] [CrossRef]
  12. Rosenberg, O.; Jacobson, S. Effects of repeated slash removal in thinned stands on soil chemistry and understorey vegetation. Silva Fennica 2004, 38, 133–142. [Google Scholar] [CrossRef] [Green Version]
  13. Driscoll, C.T.; Poster, K.M.; Krester, W.; Raynal, D.J. Long-term trends in the chemistry of precipitation and lake water in the Adirondack Region of New York, USA. Water Air Soil Pollut. 1995, 85, 583–588. [Google Scholar] [CrossRef]
  14. Driscoll, C.T.; Lawrence, G.B.; Bulger, A.J.; Butler, T.J.; Cronon, C.S.; Eagar, C.; Lambert, K.F.; Likens, G.E.; Stoddard, J.L.; Weathers, K.C. Acid deposition in the northeastern United States: Sources and inputs, ecosystem effects, and management strategies: The effects of acid deposition in the northeastern United States include the acidification of soil and water, which stresses terrestrial and aquatic biota. Bioscience 2001, 51, 180–198. [Google Scholar] [CrossRef]
  15. Reid, C.; Watmough, S.A. Evaluating the effects of liming and wood-ash treatment on forest ecosystems through systematic meta-analysis. Can. J. For. Res. 2014, 44, 867–885. [Google Scholar] [CrossRef]
  16. Campbell, A.G. Recycling and disposing of wood ash. Tappi J. 1990, 73, 141–146. [Google Scholar]
  17. Pitman, R.M. Wood ash use in forestry—A review of environmental impacts. J. For. 2006, 79, 563–588. [Google Scholar] [CrossRef] [Green Version]
  18. Demeyer, A.; Nkana, J.C.V.; Verloo, M.G. Characteristics of wood ash and influence on soil properties and nutrient uptake: An overview. Bioresour. Technol. 2001, 77, 287–295. [Google Scholar] [CrossRef]
  19. Clarholm, M. Granulated wood ash and a ‘N-free’ fertilizer to a forest soil–effects on P availability. For. Ecol. Manag. 1994, 66, 127–136. [Google Scholar] [CrossRef]
  20. Bramryd, T.; Fransman, B. Silviculture use of wood ashes–Effects on the nutrient and heavy metal balance in a pine (Pinus sylvestris, L) forest soil. Water Air Soil Pollut. 1995, 85, 1039–1044. [Google Scholar] [CrossRef]
  21. Saarsalmi, A.; Mälkönen, E.; Piirainen, S. Effects of wood ash fertilization on forest soil chemical properties. Silva Fennica 2001, 35, 355–368. [Google Scholar] [CrossRef] [Green Version]
  22. Pugliese, S.; Jones, T.; Preston, M.D.; Hazlett, P.; Tran, H.; Basiliko, N. Wood ash as a forest soil amendment: The role of boiler and soil type on soil property response. Can. J. Soil Sci. 2014, 94, 621–634. [Google Scholar] [CrossRef]
  23. Hannam, K.D.; Fleming, R.L.; Venier, L.; Hazlett, P.W. Can bioenergy ash applications emulate the effects of wildfire on upland forest soil chemical properties? Soil Sci. Soc. Am. J. 2019, 83, S201–S217. [Google Scholar] [CrossRef]
  24. Azan, S.S.E. Could a residential wood ash recycling programme help solve the calcium decline problem: Insights from a Muskoka wood burner’s questionnaire. In Technical Report No. 1. Friends of the Muskoka Watershed; Muskoka Watershed Council: Bracebridge, ON, Canada, 2017. [Google Scholar]
  25. Lamers, F.; Cremers, M.; Matschegg, D.; Schmidl, C.; Hannam, K.; Hazlett, P.; Madrail, S.; Dam, B.P.; Roberto, R.; Mager, R.; et al. Options for Increased Use of Ash from Biomass Combustion and Co-Firing. Available online: https://www.ieabioenergy.com/wp-content/uploads/2019/02/IEA-Bioenergy-Ash-management-report-revision-5-november.pdf (accessed on 1 October 2019).
  26. Ouimet, R.; Arp, P.; Watmough, S.; Aherne, J.; DeMerchant, I. Determination and mapping of critical loads and exceedances for upland forest soils in Eastern Canada. Water Air Soil Pollut. 2006, 172, 57–66. [Google Scholar] [CrossRef]
  27. Pettersen, R.C. The chemical composition of wood. In The Chemistry of Solid Wood, No. 207; U.S. Department of Agriculture: Washington, DC, USA, 1984; pp. 57–126. [Google Scholar]
  28. Etiégni, L.; Campbell, A.G.; Mahler, R.L. Evaluation of wood ash disposal on agricultural land. I. Potential as a soil additive and liming agent. Commun. Soil Sci. Plant Anal. 1991, 22, 243–256. [Google Scholar] [CrossRef]
  29. Werkelin, J.; Skrifvars, B.-J.; Hupa, M. Ash-forming elements in four Scandinavian wood species. Part 1: Summer harvest. Biomass Bioenergy 2005, 29, 451–466. [Google Scholar] [CrossRef]
  30. Paré, D.; Lafleur, B.; Titus, B.D.; Thiffault, E.; Maynard, D.G.; Guo, X. Estimating stand-scale biomass, nutrient contents, and associated uncertainties for tree species of Canadian forests. Can. J. For. Res. 2003, 43, 599–608. [Google Scholar] [CrossRef]
  31. Mertens, J.; Vervaeke, P.; Meers, E.; Tack, F.M. Seasonal changes of metals in willow (Salix sp.) stands for phytoremediation on dredged sediment. Environ. Sci. Technol. 2006, 40, 1962–1968. [Google Scholar] [CrossRef]
  32. Laureysens, I.; Blust, R.; Temmerman, L.D.; Lemmens, C.; Ceulemans, R. Clonal variation in heavy metal accumulation and biomass production in a poplar coppice culture: I. Seasonal variation in leaf, wood and bark concentrations. Environ. Pollut. 2004, 131, 485–494. [Google Scholar] [CrossRef]
  33. Hannam, K.D.; Venier, L.; Hope, E.; McKenney, D.; Allen, D.; Hazlett, P.W. AshNet: Facilitating the use of wood ash as a forest soil amendment in Canada. For. Chron. 2017, 93, 17–20. [Google Scholar] [CrossRef] [Green Version]
  34. Brais, S.; Bélanger, N.; Guillemette, T. Wood ash and N fertilization in the Canadian boreal forest: Soil properties and response of jack pine and black spruce. For. Ecol. Manag. 2015, 348, 1–14. [Google Scholar] [CrossRef]
  35. Noyce, G.L.; Fulthorpe, R.; Gorgolewski, A.; Hazlett, P.; Tran, H.; Basiliko, N. Soil microbial responses to wood ash addition and forest fire in managed Ontario forests. Appl. Soil Ecol. 2016, 107, 368–380. [Google Scholar] [CrossRef]
  36. Domes, K.A.; de Zeeuw, T.; Massicotte, H.B.; Elkin, C.; McGill, W.B.; Jull, M.J.; Chisholm, C.E.; Rutherford, P.M. Short-term changes in spruce foliar nutrients and soil properties in response to wood ash application in the sub-boreal climate zone of British Columbia. Can. J. Soil Sci. 2018, 98, 246–263. [Google Scholar] [CrossRef] [Green Version]
  37. Elliot, A.; Mahmood, T. Generation and Management of Solid Residues by Canadian Pulp and Paper Mills in 2013; Confidential Report Prepared for FPInnovations: Pointe-Claire, QC, Canada, 2015. [Google Scholar]
  38. Azan, S.S.E.; Yan, N.D.; Celis-Salgardo, M.P.; Arnott, S.E.; Rusak, J.A.; Sutey, P. Could a residential wood ash recycling programme be part of the solution to calcium decline in lakes and forests in Muskoka (Ontario, Canada)? Facets 2019, 4, 69–90. [Google Scholar] [CrossRef]
  39. Baldwin, D.J.B.; Desloges, J.R.; Band, L.E. Physical geography of Ontario. In Ecology of a Managed Terrestrial Landscape: Patterns and Processes of Forest Landscapes in Ontario; Perera, A.H., Euler, D.E., Thompson, I.D., Eds.; University of British Columbia Press: Vancouver, CB, Canada, 2000; pp. 141–162. [Google Scholar]
  40. McLaughlin, J.W. Forest soil calcium dynamics and water quality: Implications for forest management planning. Soil Sci. Soc. Am. J. 2014, 78, 1003–1020. [Google Scholar] [CrossRef]
  41. Watmough, S.A.; Dillon, P.J. Major element fluxes from a coniferous catchment in central Ontario, 1983–1999. Biogeochemistry 2004, 67, 369–398. [Google Scholar] [CrossRef]
  42. Watmough, S.A.; Dillon, P.J. Base cation losses and nitrogen budgets for seven forested catchments in central Ontario, 1983-1999. Forest Ecol. Manag. 2003, 177, 155–177. [Google Scholar] [CrossRef]
  43. Gradowski, T.; Thomas, S.C. Phosphorus limitation of sugar maple growth in central Ontario. For. Ecol. Manag. 2006, 226, 104–109. [Google Scholar] [CrossRef]
  44. Long, R.P.; Horsley, S.B.; Hall, T.J. Long-term impact of liming on growth and vigor of northern hardwoods. Can. J. For. Res. 2011, 41, 1295–1307. [Google Scholar] [CrossRef]
  45. Moore, J.-D.; Ouimet, R.; Duchesne, L. Soil and sugar maple responses 15 years after dolomitic lime application. For. Ecol. Manag. 2012, 281, 130–139. [Google Scholar] [CrossRef]
  46. Gorgolewski, A.; Caspersen, J.; Hazlett, P.; Jones, T.; Tran, H.; Basiliko, N. Responses of eastern red-backed salamander (Plethodon cinereus) abundance 1 year after application of wood ash in a northern hardwood forest. Can. J. For. Res. 2016, 46, 402–409. [Google Scholar] [CrossRef]
  47. Riley, K. Algonquin sugarbush calcium/lime study 2016. In Proceedings of the Ontario Maple Syrup Producer’s Association, Maple Information Day, Sundridge, ON, Canada, 16 January 2017. [Google Scholar]
  48. Environment Canada. 2019. Canadian Climate Normals 1981–2010 Station Data. Available online: http://climate.weather.gc.ca/climate_normals/results_1981_2010_e.html?searchType=stnProx&txtRadius=50&selCity=43%7C39%7C79%7C23%7CToronto&selPark=&optProxType=custom&txtCentralLatDeg=45&txtCentralLatMin=08&txtCentralLatSec=0&txtCentralLongDeg=79&txtCentralLongMin=46&txtCentralLongSec=0&stnID=4410&dispBack=0 (accessed on 15 January 2020).
  49. Soil Classification Working Group. The Canadian System of Soil Classification, 3rd ed.; NRC Research Press: Boca Raton, FL, USA; Agriculture and Agri-Food Canada Publication: Ottawa, ON, Canada, 1998; pp. 1–187. [Google Scholar]
  50. Gaucher, C.; Gougeon, S.; Mauffette, Y.; Messier, C. Seasonal variation in biomass and carbohydrate partitioning of understory sugar maple (Acer saccharum) and yellow birch (Betula alleghaniensis) seedlings. Tree Physiol. 2005, 25, 93–100. [Google Scholar] [CrossRef] [PubMed] [Green Version]
  51. RStudio Team. RStudio: Integrated Development for R; RStudio, Inc.: Boston, MA, USA, 2016. [Google Scholar]
  52. Nutrient and Management Act. Government of Ontario. O. Reg. 267/03, General under Nutrient and Management Act, 2002, S.O. 2002, c.4. Available online: https://www.ontario.ca/laws/regulation/030267 (accessed on 16 August 2018).
  53. Kolb, T.E.; McCormick, L.H. Etiology of sugar maple decline in four Pennsylvania stands. Can. J. For. Res. 1993, 23, 2395–2402. [Google Scholar] [CrossRef]
  54. ASHMuskoka. Available online: https://ashmuskoka.ca/about-hatsoff/ (accessed on 7 June 2020).
  55. Watmough, S.A. A dendrochemical survey of sugar maple (Acer saccharum Marsh) in South-Central Ontario, Canada. Water Air Soil Pollut. 2002, 136, 165–187. [Google Scholar] [CrossRef]
  56. Chirenje, T.; Ma, L.Q. Impact of high-volume wood-fired boiler ash amendment on soil properties and nutrients. Commun. Soil Sci. Plan. 2002, 33, 1–17. [Google Scholar] [CrossRef]
  57. Vance, E.D. Land application of wood-fired and combination boiler ashes: An overview. J. Environ. Qual. 1996, 25, 937–944. [Google Scholar] [CrossRef]
  58. AshNet. Canadian Wood Ash Chemistry Database. Available online: https://www.nrcan.gc.ca/science-and-data/research-centres-and-labs/forestry-research-centres/great-lakes-forestry-centre/ashnet/canadian-wood-ash-chemistry-database/20288 (accessed on 16 January 2018).
  59. Naylor, L.M.; Schmidt, E.J. Agricultural use of wood ash as a fertilizing and liming material: Field trials. Tappi J. 1996, 69, 114–119. [Google Scholar]
  60. Arvidsson, H.; Lundkvist, H. Effects of crushed wood ash on soil chemistry in young Norway spruce stands. For. Ecol. Manag. 2003, 176, 121–132. [Google Scholar] [CrossRef]
  61. Erich, M.S.; Ohno, T. Phosphorus availability to corn from wood ash-amended soils. Water Air Soil Pollut. 1992, 64, 475–485. [Google Scholar] [CrossRef]
  62. Ulery, A.L.; Graham, R.C.; Amrhein, C. Wood-ash composition and soil pH following intense burning. Soil Sci. 1993, 156, 358–364. [Google Scholar] [CrossRef]
  63. Saarsalmi, A.; Mälkönen, E.; Kukkola, M. Effects of wood ash fertilization on soil chemical properties and stand nutrient status and growth of some coniferous stands in Finland. Scand. J. For. Res. 2004, 19, 217–233. [Google Scholar] [CrossRef]
  64. Martikainen, P.J. Nitrification in two coniferous forest soils after different fertilization treatment. Soil Biol. Biochem. 1984, 16, 577–582. [Google Scholar] [CrossRef]
  65. Levula, T.; Saarsalmi, A.; Rantavaara, A. Effects of ash fertilization and prescribed burning on macronutrient, heavy metal, sulphur and 137Cs concentrations in lingonberries (Vaccinium vitis-idaea). For. Ecol. Manag. 2000, 126, 269–279. [Google Scholar] [CrossRef]
  66. Kahl, J.; Fernandez, R.; Rustad, L.; Peckenham, J. Threshold application rates of wood ash to an acidic forest soil. J. Environ. Qual. 1996, 25, 220–227. [Google Scholar] [CrossRef]
  67. Jacobson, S.; Högbom, L.; Ring, E.; Nohrstedt, H.-O. Effects of wood ash dose and formulation on soil chemistry at two coniferous forest sites. Water Air Soil Pollut. 2005, 158, 113–125. [Google Scholar] [CrossRef]
  68. Augusto, L.; Bakker, M.R.; Meredieu, C. Wood ash applications to temperate forest ecosystems–potential benefits and drawbacks. Plant Soil. 2008, 306, 181–198. [Google Scholar] [CrossRef]
  69. Hansen, M.; Bang-Andreasen, T.; Sørensend, H.; Ingerslev, M. Micro vertical changes in soil pH and base cations over time after application of wood ash on forest soil. For. Ecol. Manag. 2017, 406, 274–280. [Google Scholar] [CrossRef]
  70. Watmough, S.A.; McDonough, A.M.; Raney, S.M. Characterizing the influence of highways on springtime NO2 and NH3 concentrations in regional forest monitoring plots. Environ. Pollut. 2014, 190, 150–158. [Google Scholar] [CrossRef]
  71. Osman, K.T. Physical properties of soil. In Forest Soils: Properties and Management; Springer International Publishing: New Delhi, India, 2013; pp. 49–65. [Google Scholar]
  72. Kinch, J.C. The Relationships between Soil and Foliar Chemistry and the Decline of Acer Saccharum in Ontario. Master’s Thesis, University of Toronto, Toronto, ON, Canada, 1989. [Google Scholar]
  73. Adams, C.M.; Hutchinson, T.C. Fine-root growth and chemical composition in declining Central Ontario sugar maple stands. Can. J. For. Res. 1992, 22, 1489–1503. [Google Scholar] [CrossRef]
  74. Ozolinčius, R. Wood ash and nitrogen influence on ground vegetation cover and chemical composition. Biomass Bioenerg. 2007, 31, 710–716. [Google Scholar] [CrossRef]
  75. Rieuwerts, J.S.; Thornton, I.; Farago, M.E.; Ashmore, M.R. Factors influencing metal bioavailability in soils: Preliminary investigations for the development of a critical loads approach for metals. Chem. Spec. Bioavailab. 1998, 10, 61–75. [Google Scholar] [CrossRef] [Green Version]
  76. Unger, Y.L.; Fernandez, I.J. The short-term effects of wood-ash amendment on forest soils. Water, Air Soil Pollut. 1990, 49, 299–314. [Google Scholar] [CrossRef]
  77. Bundt, M.; Zimmermann, S.; Blaser, P.; Hagedorn, F. Sorption and transport of metals in preferential flow paths and soil matrix after the addition of wood ash. Eur. J. Soil Sci. 2001, 52, 423–431. [Google Scholar] [CrossRef]
  78. Nieminen, M.; Piirainen, S.; Moilanen, M. Release of mineral nutrients and heavy metals from wood and peat ash fertilizers: Field studies in Finnish forest soils. Scand. J. For. Res. 2005, 20, 146–153. [Google Scholar] [CrossRef]
  79. Narodoslawsky, N.; Obernberger, I. From waste to raw material–the route from biomass to wood ash for cadmium and other heavy metals. J. Hazard. Mater. 1996, 50, 157–168. [Google Scholar] [CrossRef]
  80. Hannam, K.D.; Deschamps, C.; Kwiaton, M.; Venier, L.; Hazlett, P.W. Regulations and Guidelines for the Use of Wood Ash as a Soil Amendment in Canadian Forests; Natural Resources Canada; Canadian Forestry Service: Sault Ste. Marie, ON, Canada, 2016.
  81. Long, R.P.; Horsley, S.B.; Lilja, P.R. Impact of forest liming on growth and crown vigor of sugar maple and associated hardwoods. Can. J. For. Res. 1997, 27, 1560–1573. [Google Scholar] [CrossRef]
  82. Juice, S.M.; Fahey, T.J.; Siccama, T.G.; Driscoll, C.T.; Denny, E.G.; Eagar, C.; Cleavitt, N.L.; Minocha, R.; Richardson, A.D. Responses of sugar maple to calcium addition to northern hardwood forest. Ecology 2006, 87, 1267–1280. [Google Scholar] [CrossRef]
  83. Moore, J.-D.; Ouimet, R. Ten year effect of dolomitic lime on the nutrition, crown vigor, and growth of sugar maple. Can. J. For. Res. 2006, 36, 1834–1841. [Google Scholar] [CrossRef]
  84. Huggett, B.A.; Schaberg, P.G.; Hawley, G.J.; Eager, C. Long-term calcium addition increases growth release, wound closure, and health of sugar maple (Acer saccharum) trees at the Hubbard Brook Experimental Forest. Can. J. For. Res. 2007, 37, 1692–1700. [Google Scholar] [CrossRef] [Green Version]
  85. Casson, N.J.; Eimers, M.C.; Watmough, S.A. An assessment of the nutrient status of sugar maple in Ontario: Indications of phosphorus limitation. Environ. Monit. Assess. 2012, 184, 5917–5927. [Google Scholar] [CrossRef]
  86. Moore, J.-D.; Ouimet, R. Effects of two Ca fertilizer types on sugar maple vitality. Can. J. For. Res. 2010, 40, 1985–1992. [Google Scholar] [CrossRef]
  87. Unger, Y.L.; Fernandez, I.J. TB134: A Laboratory Study to Assess Methods for Predicting pH Change of Ash Amended Forest Soils; Maine Agricultural Experimental Station: Orono, ME, USA, 1984. [Google Scholar]
  88. Moore, J.-D.; Camire, C.; Ouimet, R. Effects of liming on the nutrition, vigor and growth of sugar maple at the Lake Clair Watershed, Quebec, Canada. Can. J. For. Res. 2000, 30, 725–732. [Google Scholar] [CrossRef]
  89. Brunner, I.; Zimmermann, S.; Zingg, A.; Blaser, P. Wood-ash recycling affects forest soil and tree fine-root chemistry and reverses soil acidification. Plant Soil. 2004, 267, 61–71. [Google Scholar] [CrossRef]
  90. Jones, D.L.; Quilliam, R.S. Metal contaminated biochar and wood ash negatively affect plant growth and soil quality after land application. J. Hazard Mater. 2014, 276, 362–370. [Google Scholar] [CrossRef]
  91. Ludwig, B.; Rumpf, S.; Mindrup, M.; Meiwes, K.-J.; Khanna, P.K. Effects of lime and wood ash on soil-solution chemistry, soil chemistry and nutritional status of a pine stand in northern Germany. Scand. J. For. Res. 2002, 17, 225–227. [Google Scholar] [CrossRef]
  92. Rumpf, S.; Ludwig, B.; Mindrup, M. Effect of wood ash on soil chemistry of a pine stand in Northern Germany. J. Plant Nutr. Soil Sci. 2001, 164, 569–575. [Google Scholar] [CrossRef]
  93. Heim, A.; Luster, J.; Brunner, I.; Frey, B.; Frossard, E. Effects of aluminum treatment on Norway spruce roots: Aluminum binding forms, element distribution, and release of organic acids. Plant Soil. 1999, 216, 103–116. [Google Scholar] [CrossRef]
  94. Lucchini, P.; Quilliam, R.S.; Deluca, T.H.; Vamerali, T.; Jones, D.L. Increased bioavailability of metals in two contrasting agricultural soils treated with waste wood-derived biochar and ash. Environ. Sci. Pollut. Res. Int. 2014, 21, 3230–3240. [Google Scholar] [CrossRef]
  95. Macnicol, R.D.; Beckett, P.H.T. Critical tissue concentrations of potentially toxic elements. Plant Soil. 1985, 85, 107–129. [Google Scholar] [CrossRef]
  96. Ghodrati, M.; Sims, J.T.; Vasilas, B.L. Evaluation of fly ash as a soil amendment for the Atlantic Coastal Plain: I. Soil hydraulic properties and elemental leaching. Water Air Soil Pollut. 1995, 81, 349–361. [Google Scholar] [CrossRef]
Figure 1. Plant nutrient (Ca, Mg, and K) concentrations (±SE) in (A) foliar, (B) stem, and (C) root and tissues of sugar maple seedlings from treatment plots harvested in June 2019, one year after ash addition. Samples from the same plots were bulked prior to analysis. An asterisk (*) indicated p < 0.05 as determined by Dunnett’s post hoc test, where all treatments are compared against the control. Significant differences from pairwise comparisons (Tukey) indicated with different letters. The post hoc tests were completed only on those variables where a significant treatment effect was determined by two-way ANOVA.
Forests 11 00693 g001aForests 11 00693 g001b
Table 1. Average elemental concentrations of bark and stemwood ashes from common trees found off (n = 11) and on (n = 16) the Canadian Shield. Average mineral soil pH and range (in brackets) are also shown. p value significant at 0.10 as determined by paired t-test.
Tissue TypeOff Shield * (pH 5.2)On Shield (pH 4.1)p Value
Bark
Ca (g·kg−1)210.9 (161–250)216.7 (13–313)0.006
Mg (g·kg−1)11.4 (4.1–22)10.2 (1.9–37)0.412
K (g·kg−1)42.7 (4.8–142)25.7 (1.6–138)0.278
Na (g·kg−1)0.9 (0.3–2.7)--
Mn (g·kg−1)0.5 (0.2–0.9)9.7 (0.1–17.4)0.002
Al (g·kg−1)3.9 (0.8–8.5)5.8 (0.8–15)0.120
Fe (g·kg−1)3.4 (0.8–6.2)3.9 (0.5–7.3)0.408
B (mg·kg−1)284.5 (41–510)211.8 (56–644)0.593
As (mg·kg−1)2.5 (1.1–5.1)--
Cd (mg·kg−1)1.5 (0.5–4.1)38.6 (0–66.9)0.033
Zn (mg·kg−1)355.7 (86–774)1045.8 (139–2428)<0.001
Cu (mg·kg−1)101.8 (31–224)122.0 (0.8–378)0.958
Pb (mg·kg−1)11.8 (1.3–56)42.9 (2.6–176)0.115
Cr (mg·kg−1)5.8 (2.2–13)18.0 (1.3–34.9)0.083
Ni (mg·kg−1)29.1 (5.0–87)60.6 (6.0–140)0.078
Se (mg·kg−1)1.8 (0.3–3.4)10.9 (0–43)0.017
Sr (mg·kg−1)528.4 (217–983)77.9 (0–2594)0.178
Ba (g·kg−1)0.4 (0.1–1.2)2.8 (0.3–8.7)<0.001
Stemwood
Ca (g·kg−1)211.9 (137–266)126.7 (19–313)0.191
Mg (g·kg−1)11.4 (9.8–31)10.2 (3.6–52)0.790
K (g·kg−1)42.7 (9.4–154)25.7 (7.3–174)0.876
Na (g·kg−1)1.8 (0.5–5.4)--
Mn (g·kg−1)0.5 (0.2–1.3)9.7 (0.5–27)<0.001
Al (g·kg−1)2.0 (0.5–6.5)3.2 (0.2–11)0.106
Fe (g·kg−1)3.4 (0.7–7.4)3.9 (0.4–11)0.650
B (mg·kg−1)401.9 (137–705)318.4 (47–844)0.287
As (mg·kg−1)3.6 (1.0–15)--
Cd (mg·kg−1)1.8 (0.5–11)13.9 (1.0–56)0.017
Zn (mg·kg−1)457.8 (62–1172)1097.1 (197–3073)0.024
Cu (mg·kg−1)196.0 (44–554)174.7 (46–864)0.973
Pb (mg·kg−1)11.4 (2.0–65)57.2 (3.3–239)0.019
Cr (mg·kg−1)5.7 (2.5–17)28.2 (5.3–73.4)0.002
Ni (mg·kg−1)56.5 (11–297)316.3 (21–729)0.002
Se (mg·kg−1)3.3 (1.0–7.3)12.9 (3.1–39)<0.001
Sr (mg·kg−1)569.0 (318–1284)908.1 (149–2607)0.053
Ba (g·kg−1)0.4 (0.1–1.4)3.5 (0.2–11)<0.001
* Fagus grandifolia, Tsuga canadensis, Larix Laricina, Betula papyrifera, Populus grandidentata, Pinus resinosa, Acer saccharum, Fraxinus americana, Pinus strobus, Picea glauca, and Betula Alleghaniensis. Off-Shield species, as well as Cornus alternifolia, Castanea dentata, Tilia americana, Carya cordiformis, and Acer pensylvanicum.
Table 2. pH, electrical conductivity (EC), loss-on-ignition (LOI), and nutrient and metal concentrations of residential wood ash (means, ±S.E.) from Muskoka County applied to a sugar bush in Bracebridge in May 2018 (n = 5). Ontario Regulation 267/03 of the Nutrient Management Act limits for unrestricted (CM1) and restricted (CM2) use of wood ash for land application as a non-agricultural non-aqueous source material are also shown.
Sugar Maple AshWhite Pine AshYellow Birch AshNon-Agricultural Source Material Limits
CM1CM2
pH 13.0 (0.1)12.4 (0.1)12.1 (0.1)
EC (mS·m−1)13 400 (34)9 600 (22)7 900 (28)
LOI (g·kg−1)18.9 (021)26.1 (1.2)41.8 (11.4)
C (g·kg−1)42.6 (0.7)102 (2)107 (3)
N (g·kg−1)0.6 (0.0)0.9 (0.2)1.0 (0.1)
S (g·kg−1)0.1 (0.1)0.2 (0.1)0.6 (0.5)
Ca (g·kg−1)156 (39)250 (2)209 (5)
Mg (g·kg−1)9.9 (1.7)9.6 (0.2)10.1 (0.4)
K (g·kg−1)31.1 (7.7)59.2 (1.0)62.5 (1.3)
Na (g·kg−1)2.1 (0.5)0.5 (0)4.6 (0.2)
Mn (g·kg−1)7.1 (1.6)1.1 (0)6.9 (0.2)
Al (g·kg−1)8.1 (1.3)0.6 (0)10.0 (0.3)
Fe (g·kg−1)3.9 (0.1)0.6 (0)1.1 (0)
B (mg·kg−1)128 (29)216 (5)324 (6)
Mo (mg·kg−1)1.4 (0.3)2.8 (0.2)0.6 (0)594
As (mg·kg−1)bdl1.4 (0)9.5 (0.3)13170
Cd (mg·kg−1)1.6 (0.4)1.2 (0)9.4 (0.3)334
Zn (mg·kg−1)211 (51.2)183 (3)2389 (88)5004200
Cu (mg·kg−1)66.1 (14.6)90.5 (1.6)207 (4)1001700
Pb (mg·kg−1)bdl 4.7 (0.1)29.7 (1.0)1501100
Cr (mg·kg−1)49.1 (11.6)4.2 (0.2)7.3 (0.2)2102800
Co (mg·kg−1)2.6 (0.5)0.8 (0.1)4.9 (0.2)34340
Ni (mg·kg−1)5.9 (1.1)4.4 (0.2)6.5 (0.3)62420
Se (mg·kg−1)3.9 (0.8)2.0 (0.2)5.7 (0.2)234
Be (mg·kg−1)0.2 (0.1)0.1 (0.1)0 (0)
V (mg·kg−1)5.7 (1.3)1.1 (0.1)1.5 (0)
Sr (mg·kg−1)606 (150)824 (11)1009 (147)
Ba (mg·kg−1)1197 (285)880 (18)2939 (63)
[52]. bdl, below detection limit.
Table 3. pH, EC, organic matter content (OM), and total base cation concentrations (mean ± S.E.) one year after ash application. Significant differences from pairwise comparisons (Tukey) indicated with different letters. Significant differences (*) to control were determined by Dunnett’s post hoc test. The post hoc test was completed only on those variables where a significant treatment effect (p < 0.1) was determined by one-way ANOVA. All values represent total concentrations.
HorizonControl (n = 7)Sugar Maple (n = 5)White Pine (n = 5)Yellow Birch (n = 3)p Value
LFH
pH (CaCl2)4.1 (0.1)5.2 (0.4) *5.1 (0.2) *4.5 (0.2)0.005
EC (mS·m−1)123.7 (10.4)178.1 (30.4)149.2 (22.2)125.8 (15.4)0.179
OM (%)90.2 (1.0)90.6 (1.5)90.0 (0.6)90.7 (1.8)0.965
Ca (g·kg−1)8.64 (0.72) a13.69 (2.01) b,*13.50 (3.15) b,*10.90 (2.03) a,b0.049
Mg (g·kg−1)0.75 (0.05) a1.18 (0.14) b,*0.85 (0.13) a0.68 (0.04) a0.048
K (g·kg−1)1.08 (0.08)1.41 (0.16)1.00 (0.20)1.14 (0.11)0.354
Na (g·kg−1)0.16 (0.01)0.21 (0.04)0.16 (0.02)0.19 (0.04)0.384
Ah
pH (CaCl2)3.5 (0.1) a4.8 (0.2) c,*4.4 (0.2) b,c,*4.0 (0.2) b,*<0.001
EC (mS·m−1)95.2 (14.6)120.4 (24.1)82.6 (12.1)62.3 (19.3)0.139
OM (%)22.4 (3.0)15.6 (1.0)19.2 (2.1)21.7 (3.2)0.203
Ca (g·kg−1)1.39 (0.15) a2.94 (0.45) b,*3.61 (1.21) b,*1.52 (0.44) a0.077
Mg (g·kg−1)0.76 (0.09)0.79 (0.09)0.95 (0.13)0.68 (0.13)0.476
K (g·kg−1)0.51 (0.03)0.46 (0.02)0.45 (0.04)0.40 (0.04)0.213
Na (g·kg−1)0.27 (0.01)0.24 (0.02)0.25 (0.02)0.27 (0.04)0.732
Bm
pH (CaCl2)3.8 (0.1)3.8 (0.1)3.9 (0.1)3.9 (0.1)0.320
EC (mS·m−1)30.2 (1.6)35.7 (4.3)35.6 (1.7)34.0 (6.3)0.440
OM (%)13.9 (5.2)10.3 (0.4)16.2 (3.5)15.9 (0.6)0.113
Ca (g·kg−1)0.79 (0.08)0.96 (0.10)0.82 (0.07)1.02 (0.18)0.397
Mg (g·kg−1)1.22 (0.19)0.98 (0.25)1.01 (0.12)1.15 (0.15)0.765
K (g·kg−1)0.51 (0.12)0.44 (0.06)0.38 (0.05)0.34 (0.04)0.616
Na (g·kg−1)0.28 (0.03)0.26 (0.01)0.26 (0.02)0.29 (0.02)0.772
Ca (g·kg−1)0.79 (0.08)0.96 (0.10)0.82 (0.07)1.02 (0.18)0.397
Table 4. Organic (LFH) horizon soil total elemental concentrations (means ± S.E.) 12 months after ash application. Significant differences (p < 0.1) from pairwise comparisons (Tukey) indicated with different letters. Significant differences to control (Dunnett) indicated by an asterisk (*). The post hoc tests were completed only on those variables where a significant treatment effect was determined by one-way ANOVA.
TreatmentnMnAlFeBAsCdZnCuPbCrNiSeSrBa
-------- (g·kg−1) ----------------------------------------------------------------------- (mg·kg−1) ---------------------------------------------------------------
Control71.45 (0.23)0.67 (0.16)1.74 (0.55)12.92 (1.31)1.34 (0.17)0.76 (0.17)59.98 a (14.81)11.29 (0.57)4.18 (1.14)36.03 (10.31)3.51 (0.35)2.25 (0.17)48.63 (4.03)122.2 (11.87)
Sugar Maple51.43 (0.21)0.86 (0.17)2.40 (1.35)16.25 (1.17)1.32 (0.08)0.73 (0.12)73.74 a,b (15.58)16.23 (3.20)3.30 (0.51)74.64 (55.92)4.42 (1.52)2.30 (0.23)63.85 (9.24)147.8 (20.06)
White Pine51.02 (0.18)0.63 (0.21)1.34 (0.25)17.14 (3.98)1.19 (0.17)0.61 (0.14)62.69 a (14.81)11.60 (2.08)2.81 (0.19)24.25 (4.35)2.87 (0.30)1.88 (0.30)75.30 (17.0)112.8 (21.95)
Yellow Birch 31.00 (0.10)0.85 (0.43)1.84 (1.22)17.26 (2.42)1.73 (0.40)0.92 (0.37)122.3 b,* (46.29)15.87 (3.47)4.17 (1.15)46.63 (36.61)4.51 (1.31)2.57 (0.48)67.17 (20.3)184.0 (53.02)
p value
Treatment 0.3390.7660.9670.8040.4050.7770.0840.3580.5460.9570.6470.3870.8020.555
Table 5. Belowground (root) biomass (g, dry weight), aboveground (shoot and foliage) biomass (g, dry weight), root:shoot biomass (R:S), and photosynthetic:non-photosynthetic (P:nP) tissue biomass ratios (means ± S.E.) of sugar maple seedlings according to different wood ash treatments. Significant differences at p = 0.05 are given as determined by Kruskal–Wallis rank sum test.
TreatmentnBelowground Biomass (g)Aboveground Biomass (g)R:S RatioP:nP Ratio
Control350.28 ± 0.02 g0.72 ± 0.04 g0.39 ± 0.020.48 ± 0.04
Sugar Maple250.28 ± 0.02 g0.72 ± 0.04 g0.43 ± 0.050.64 ± 0.10
White Pine250.30 ± 0.02 g0.70 ± 0.04 g0.45 ± 0.040.48 ± 0.04
Yellow Birch 150.29 ± 0.07 g0.71 ± 0.11 g0.44 ± 0.090.42 ± 0.07
p value
Treatment 0.9240.7010.8390.302
Table 6. Sugar maple seedling foliar, stem and root elemental concentrations (n = 5) (mean ± S.E.) one year following ash addition. An asterisk (*) indicates significance at p < 0.1 as determined by Dunnett’s post hoc test, where all treatments are compared against the control. Significant differences from pairwise comparisons (Tukey) indicated with different letters. The p values are given by one-way ANOVA.
Tissue TypeAsh Treatment---- Concentration (g·kg−1) -------------------------------------Concentration (mg·kg−1) ---------------------------------
NaMnAlFeBAsCdZnCuPbCrNi
FoliageControl0.83 (0.16)2.05 (0.43)0.47 (0.08)0.69 (0.12)45.98 (4.85)1.79 (0.21)0.92 (0.14)65.76 (8.12)21.18 (2.30)5.66 (1.00)1.71 (0.21)6.46 (0.72)
Sugar Maple0.64 (0.08)1.73 (0.30)0.94 (0.45)1.65 (0.80)49.07 (7.33)1.76 (0.15)1.11 (0.22)68.77 (7.13)20.83 (1.57)7.03 (1.70)2.32 (0.52)5.39 (0.31)
White Pine0.53 (0.07)1.73 (0.37)0.42 (0.05)0.73 (0.11)45.36 (2.75)1.72 (0.18)1.12 (0.10)64.15 (5.76)21.19 (1.35)5.08 (0.71)1.49 (0.10)5.90 (0.39)
Yellow Birch1.15 (0.31)2.02 (0.58)0.62 (0.13)0.76 (0.14)59.61 (10.90)1.96 (0.29)1.41 (0.18)88.86 (10.29)24.18 (2.80)6.34 (0.43)1.82 (0.24)6.97 (0.12)
p value
0.1170.9110.3970.3280.4880.9080.3210.2690.7730.6800.3120.358
StemControl1.52 (0.41)4.32 a,b (0.66)0.84 a (0.20)0.93 a (0.12)66.91 a (5.39)6.96 a (0.66)5.06 a (0.55)180.21 a (19.18)23.31 a (3.16)11.49 a (0.54)1.75 a (0.15)6.50 a (0.95)
Sugar Maple1.84 (0.44)6.95 b,* (0.77)1.13 a (0.28)1.82 a,b (0.43)139.21 b,* (21.89)11.65 b,* (0.29)9.20 b,* (0.19)271.63 a (21.92)44.38 b,* (7.74)22.18 b,* (2.94)4.39 c,* (0.43)7.68 a,b (1.35)
White Pine1.55 (0.14)5.26 a,b (0.65)1.10 a (0.24)1.99 a,b (0.56)119.66 b,* (10.49)9.37 a,b (0.99)7.66 b,* (0.64)264.60 a (66.28)44.58 b,* (4.50)21.70 b,* (3.99)2.67 a,b (0.44)7.56 a,b (0.54)
Yellow Birch1.16 (0.28)6.97 b,* (1.28)3.81 b,* (1.43)2.21 b,* (0.78)131.45 b,* (20.18)11.08 b,* (1.49)9.59 b,* (0.16)422.14 b,* (21.85)41.89 a,b (12.87)38.54 c,* (15.44)2.89 b,* (0.16)14.82 c,* (2.65)
p value
0.6290.0220.0060.0970.0010.001<0.0010.0030.0250.003<0.001<0.001
RootControl1.81 (0.21)2.62 a (0.41)5.48 (1.34)5.96 (1.05)49.81 a (6.83)6.83 a (0.33)5.71 a (0.29)233.46 a (22.57)37.18 a (4.82)64.48 a (16.31)5.09 (0.57)19.20 (2.76)
Sugar Maple2.24 (0.58)3.89 a (0.61)4.08 (0.44)6.16 (1.20)83.76 a,b
(24.40)
11.63 b,*
(2.03)
9.72 b,c,* (1.67)381.99 a (72.50)61.80 a,b (17.32)98.88 a,b (17.09)8.12 (1.46)20.38 (5.07)
White Pine1.75 (0.25)3.88 a (0.52)7.42 (1.86)8.26 (0.95)64.52 a,b
(18.66)
9.26 a,b
(1.11)
7.71 a,b (0.91)419.61 a (122.36)57.41 a,b (11.22)92.77 a,b (31.52)7.16 (1.03)21.48 (5.43)
Yellow Birch2.76 (0.32)7.80 b,* (2.99)5.17 (1.01)5.29 (1.05)111.40 b,* (15.32)14.47 b,* (2.48)12.27 c,* (2.82)920.58 b,* (63.13)89.84 b,* (17.82)128.63 b,* (40.30)7.46 (0.73)34.96 (12.99)
p value
0.1550.0030.4210.2460.0470.0110.017<0.0010.0190.0930.1040.325

