The Potential of Sentinel-2 for Crop Production Estimation in a Smallholder Agroforestry Landscape, Burkina Faso
 Martin Karlson1*
  Madelene Ostwald2,3
  Jules Bayala4
  Hugues Roméo Bazié5
  Abraham Sotongo Ouedraogo5
  Boukary Soro5 Josias Sanou6
  Heather Reese7
- 1Department of Thematic Studies/Environmental Change, Linköping University, Linköping, Sweden
- 2Department of Technology Management and Economics/Environmental Systems Analysis, Chalmers University of Technology, Gothenburg, Sweden
- 3Gothenburg Centre for Sustainable Development, Gothenburg, Sweden
- 4World Agroforestry (ICRAF), ICRAF-WCA/Sahel Node, Bamako, Mali
- 5Laboratoire Biosciences, Unité de Formation et Recherche en Sciences de la Vie et de la Terre, Université Joseph Ki-Zerbo, Ouagadougou, Burkina Faso
- 6Département Environnement et Forêts, Institut de l’Environnement et de Recherches Agricoles, Ouagadougou, Burkina Faso
- 7Department of Earth Sciences, University of Gothenburg, Gothenburg, Sweden
Crop production statistics at the field scale are scarce in African countries, limiting potential research on yield gaps as well as monitoring related to food security. This paper examines the potential of using Sentinel-2 time series data to derive spatially explicit estimates of crop production in an agroforestry parkland in central Burkina Faso. This type of landscape is characterized by agricultural fields where cereals (millet and sorghum) and legumes (cowpea) are intercropped under a relatively dense tree canopy. We measured total above ground biomass (AGB) and grain yield in 22 field plots at the end of two growing seasons (2017 and 2018) that differed in rainfall timing and amount. Linear regression models were developed using the in situ crop production estimates and temporal metrics derived from Sentinel-2 time series. We studied several important aspects of satellite-based crop production estimation, including (i) choice of vegetation indices, (ii) effectiveness of different time periods for image acquisition and temporal metrics, (iii) consistency of the method between years, and (iv) influence of intercropping and trees on accuracy of the estimates. Our results show that Sentinel-2 data were able to explain between 41 and 80% of the variation in the in situ crop production measurements, with relative root mean square error for AGB estimates ranging between 31 and 63% in 2017 and 2018, respectively, depending on temporal metric used as estimator. Neither intercropping of cereals and legumes nor tree canopy cover appeared to influence the relationship between the satellite-derived estimators and crop production. However, inter-annual rainfall variations in 2017 and 2018 resulted in different ratios of AGB to grain yield, and additionally, the most effective temporal metric for estimating crop production differed between years. Overall, this study demonstrates that Sentinel-2 data can be an important resource for upscaling field measurements of crop production in this agroforestry system in Burkina Faso. The results may be applicable in other areas with similar agricultural systems and increase the availability of crop production statistics.
Introduction
Smallholder agricultural systems are the dominant livelihood strategy in most of sub-Saharan Africa (Morton, 2007), with a very high proportion of food and cash crop production coming from farms that are generally smaller than 2 ha (Gollin, 2014; Lowder et al., 2016). The importance of these systems in the light of the projected population growth and subsequent food production requirements on the continent cannot be overstated. At present, low actual crop yields relative to potential yields limit the possibilities to achieve food security and reduce poverty (World Bank, 2008). Such yield gaps and their causes need to be understood in order to design effective measures to increase crop production (Tittonell and Giller, 2013).
A basic requirement for conducting research on yield gaps is the availability of field level crop production estimates. Such data make it possible to understand causes of yield gaps and to evaluate the effectiveness of interventions and changes in land use techniques, as well as impacts resulting from changes in agricultural policy. However, agricultural statistics collected by field surveys in Africa are mainly reported on national level and generally considered to be unreliable (Carletto et al., 2015b; Burke and Lobell, 2017).
Satellite remote sensing represents an alternative method for deriving quantitative estimates of crop production and grain yield with a number of potential benefits, including the ability to cover large areas, repeated observations and low costs (Lobell, 2013; Chivasa et al., 2017). Crop production estimation has been a key research topic for several decades (Atzberger, 2013; Rembold et al., 2013). The main efforts have been directed toward intensive commercial systems where the fields are generally large, crops are homogeneous, and reliable agricultural statistics are accessible to calibrate and validate remote sensing based estimates (Lobell, 2013; Chivasa et al., 2017). Yields of these agricultural systems can be easily estimated even if the remotely sensed imagery has relatively coarse spatial resolution.
Such preconditions do not apply in the heterogeneous African smallholder systems where the agricultural fields are typically very small, irregular in shape and discontinuous in space and in crops cultivated (Burke and Lobell, 2017). Estimates based on household surveys from four African countries suggest that more than 50% of the fields are below 0.4 ha in size and 25% are smaller than 0.2 ha (Carletto et al., 2015a). In addition, a large proportion of the fields are intercropped, with high within-field heterogeneity in productivity (Bayala et al., 2014, 2015) and in situ measurements of crop production are generally unavailable (Tittonell et al., 2007; Bayala et al., 2014). A further complicating condition is that many of the smallholder farmers, in particular in West Africa, practice agroforestry where trees and shrubs are integrated in the fields and thereby pose an additional challenge for remote sensing-based estimates of crop production (Vancutsem et al., 2013; Sweeney et al., 2015; Bégué et al., 2018).
Consequently, coarse-to-medium spatial resolution systems, such as MODIS and Landsat, provide limited possibilities for accurate crop production estimation in these heterogeneous agricultural landscapes because of the inability to distinguish small individual fields. Under such conditions, these satellite systems integrate the spectral measurement over an area that goes beyond the field boundaries, which means that other landscape components influence the signal and thereby results in mixed pixels. An important technological development was achieved when the Sentinel-2 satellite systems became operational (2A in 2015 and 2B in 2017). Sentinel-2 combines key spectral wavelengths at 10–20 m spatial resolution with a relatively short revisit-period (5 days at Equator) and an open-access data policy. These improvements have opened up new possibilities for more frequent high-resolution observations of agricultural fields, which is a precondition for satellite-based crop production estimation in African smallholder systems (Duncan et al., 2015).
Recent research in both eastern and western Africa has demonstrated the feasibility of satellite-based crop production estimation in smallholder systems. Burke and Lobell (2017) used 1 m Terra Bella Skysat imagery to estimate maize production during two growing seasons in Kenya and found promising agreement between satellite and in situ crop production estimates at individual field level. These authors concluded that the low availability of cloud-free imagery was an important limitation for improving accuracy in the estimates. Jin et al. (2017, 2019) expanded on the research in Kenya by also assessing the utility of satellite imagery from RapidEye and Sentinel-2. They found that the inclusion of red-edge wavelengths was useful for crop production estimation and reported considerable improvements in accuracy when aggregating field scale estimates to district level. Also using Sentinel-2 imagery, Lambert et al. (2018) developed crop type specific regression models to estimate production of millet, sorghum, maize and cotton in Mali. They showed that peak growing-season values of vegetation index (VI) and leaf area index (LAI) were the best estimators for the different crops.
The aim of this study is to assess the utility of Sentinel-2 data to estimate crop production at individual field scale in a smallholder farming system in central Burkina Faso. The landscape type in focus is referred to as agroforestry parklands in which the fields include a significant tree component and represents an important subsistence base in West Africa (Bayala et al., 2014). We investigated several critical aspects of satellite-based crop production estimation in this farming system, including (i) choice of vegetation indices (VI), (ii) effectiveness of different periods for image acquisition and temporal metrics, (iii) consistency of the method between years, and (iv) influence of intercropping and trees on accuracy of the estimates. We also assessed the relationship between crop above ground biomass (AGB) and grain yield based on the reasoning that AGB has a stronger influence on the remote sensing data and is therefore easier to estimate.
Materials and Methods
Study Area
The study area is an agroforestry parkland system situated in the rural commune of Saponé (12°04′48″N, 1°34′00″W) located 30 km south from Ouagadougou in central Burkina Faso (Figure 1). This is a typical Sudano-Sahelian smallholder landscape where the fields are rainfed and farmers primarily grow pearl millet (Pennisetum glaucum (L.) R. Br.), sorghum (Sorghum bicolor (L.) Moench) and legumes, such as cowpea (Vigna unguiculata), for household consumption. Parklands are the main production system throughout this region. Farmers apply various forms of organic amendment to the fields, including manure, crop residues, woody litter and compost, but rarely mineral fertilizers (Koussoubé and Nauges, 2016). Doses of applied manure vary from 0.8 to 15 t ha–1, with an average dose of 5.5 ± 0.72 t ha–1 (Sanou, 2010). Crop residues also represent an important source of fodder for the small-scale livestock production, which is a common activity throughout this region.
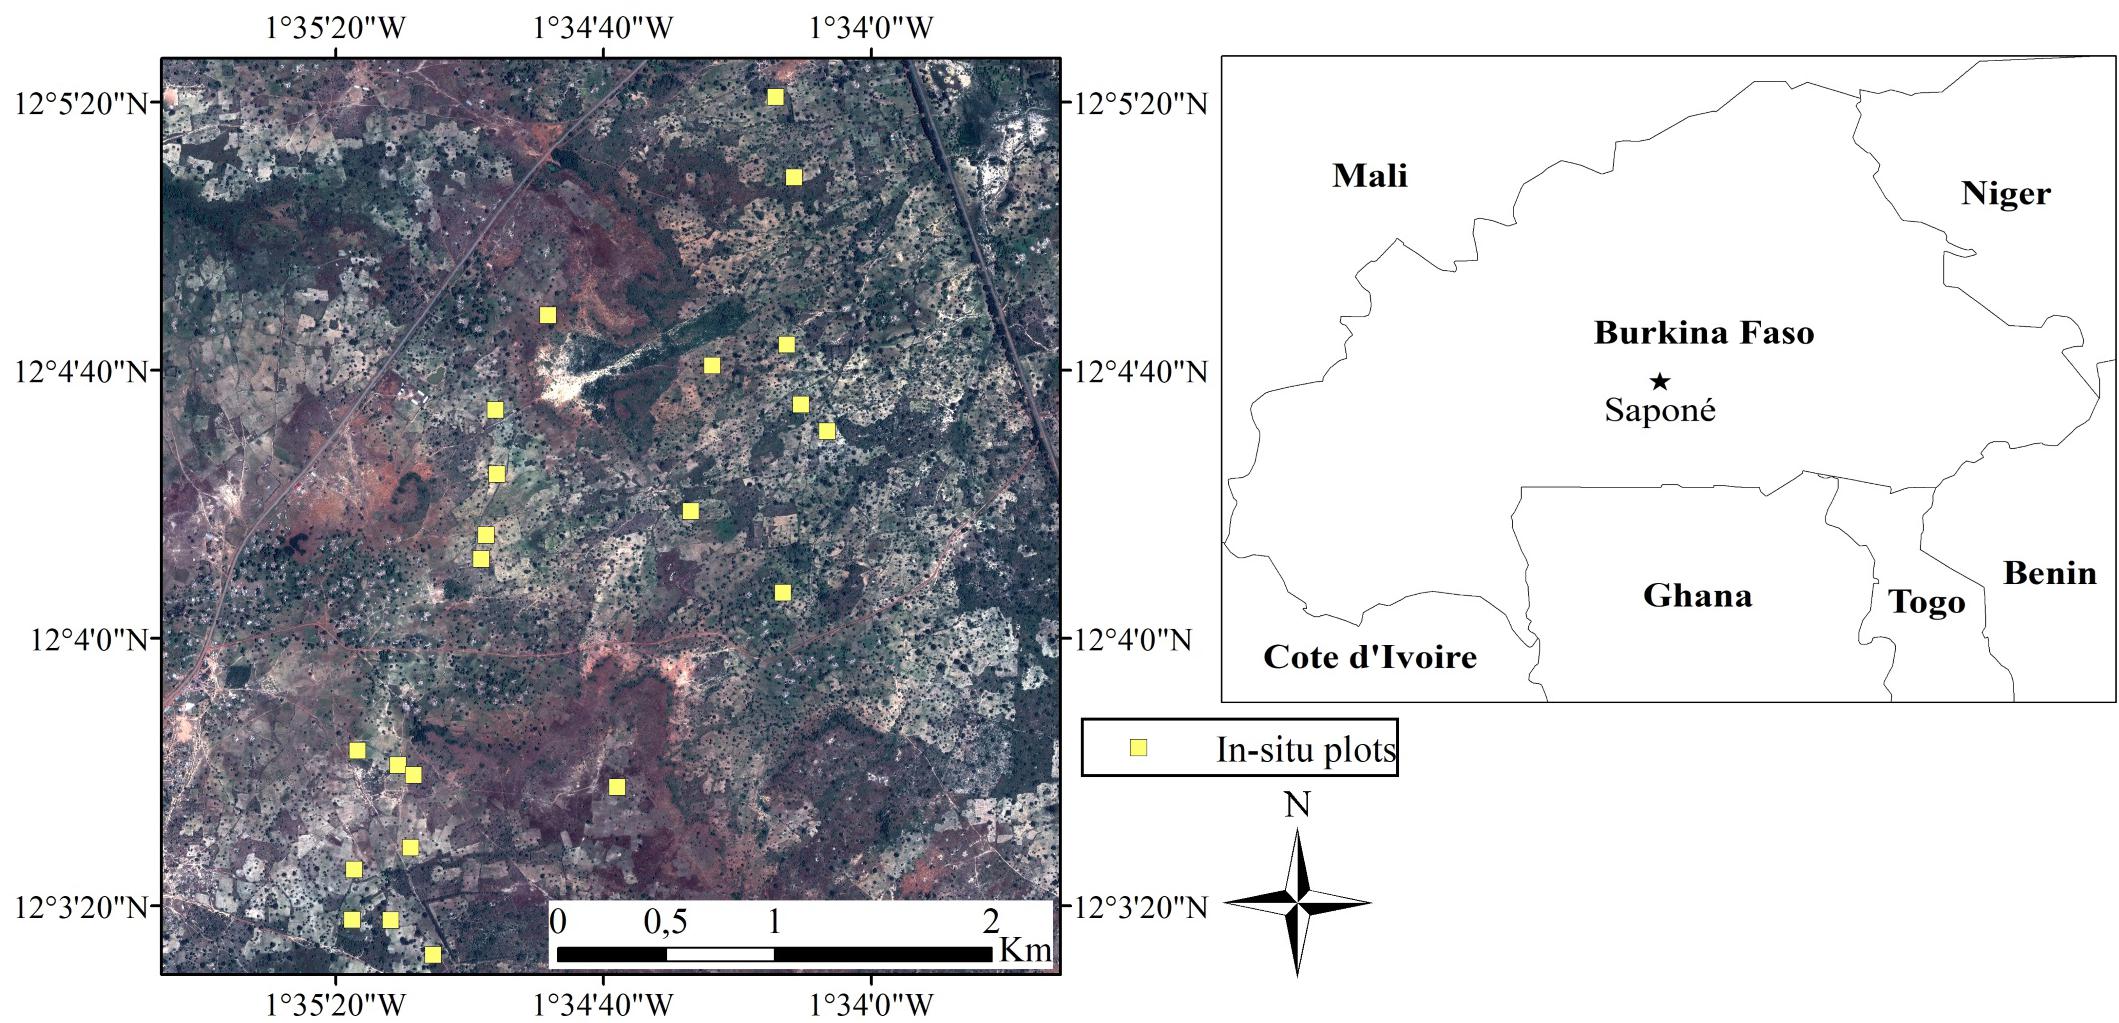
Figure 1. Location of study area and distribution of in situ crop production plots.
The local terrain is relatively flat with small variations in elevation (293–363 m above sea level). The soils are shallow (on average ca. 60 cm), sandy loamy reosols (FAO classification) with very low nutrient content in terms of nitrogen, phosphorus and organic material (Bazié et al., 2012). In addition, the soils are weakly acidic with low cation exchange capacity (Bayala et al., 2002). Mean tree canopy cover is 15% and mainly consists of traditional agroforestry species, in particular Vitellaria paradoxa, Parkia biglobosa, Lannea microcarpa, and Mangifera indica (Karlson et al., 2015).
Average annual rainfall is around 800 mm with high inter-annual variability, which strongly influences crop development and production. Total rainfall was 850.7 mm in 2017 and 789.1 in 2018, with relatively large inter-annual differences in the monthly distribution (Figure 2). Annual mean potential evapotranspiration (PETPenman) is 1900 ± 210 (Bazié et al., 2018). The rainy season generally extends between May and October, with high variability between seasons, and the main proportion of rain is usually falling between July and September. The cropping season starts between May and July, depending on crop type and the onset of the rainy season, whereas harvesting generally takes place at the end of October to November. However, unreliable rainfall at the start and end of the rainy season can lead to large windows for both sowing (May 15–July 15) and harvesting (October 15–December 15). This is even more variable nowadays due to high climate variability, as evidenced by farmers sometimes continuing to sow in August, as well as rains continuing to the beginning of November.
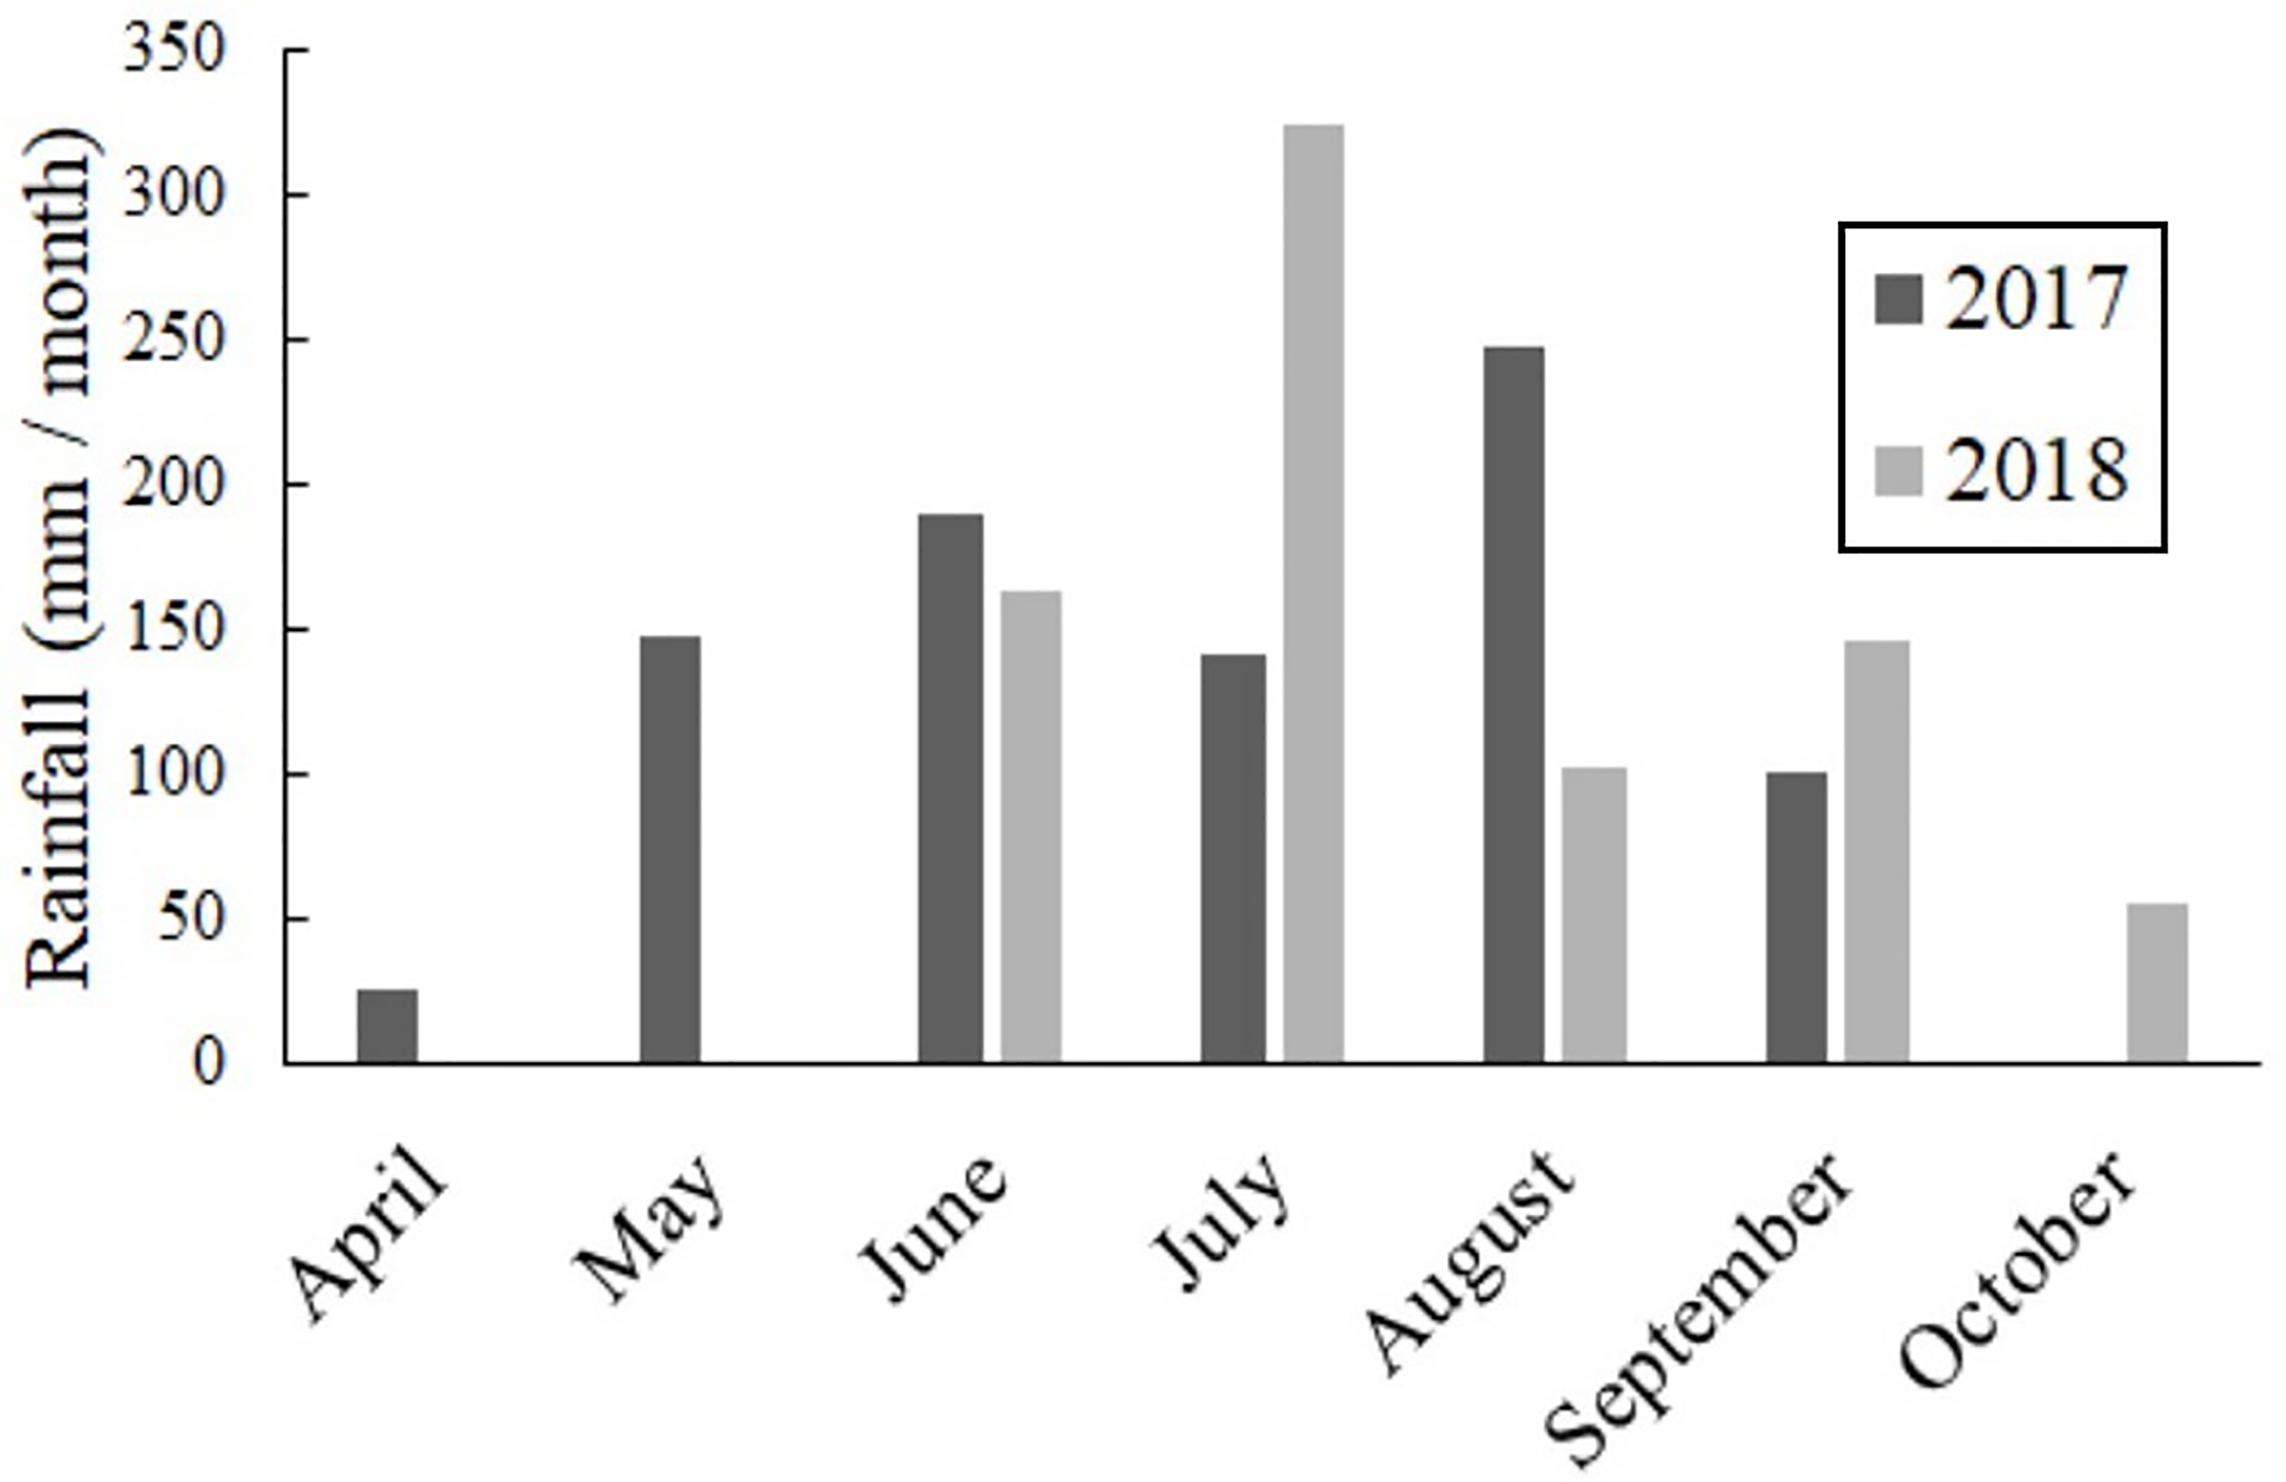
Figure 2. Monthly rainfall distribution reported by Saponé Agricultural Service.
Crop Production Data
We measured total AGB and grain yield in 22 plots (20 × 20 m) during the harvest period (late October to early November) in 2017 and 2018 (Figures 1, 3). The plot locations included agricultural fields with different tree canopy cover and crop combinations, where agreements with the local landowners were organized. Tree canopy cover within and around the fields ranged between 1 and 34% (see section “Analysing the Influence of Tree Cover and Intercropping on Estimation Accuracy”). Each plot was geo-referenced using a Garmin Oregon GPS device with a locational error <3 m. Three different crops were cultivated in the sampled fields, including sorghum, pearl millet and cowpea. The plots included both intercropped and single crop fields. For each plot and crop, we cut, dried and weighed the different plant components. The millet and sorghum plant components included ears, grain and straw, and for cowpea the components included pods, grain and residues. Total AGB represents all dried plant components, including the grain.
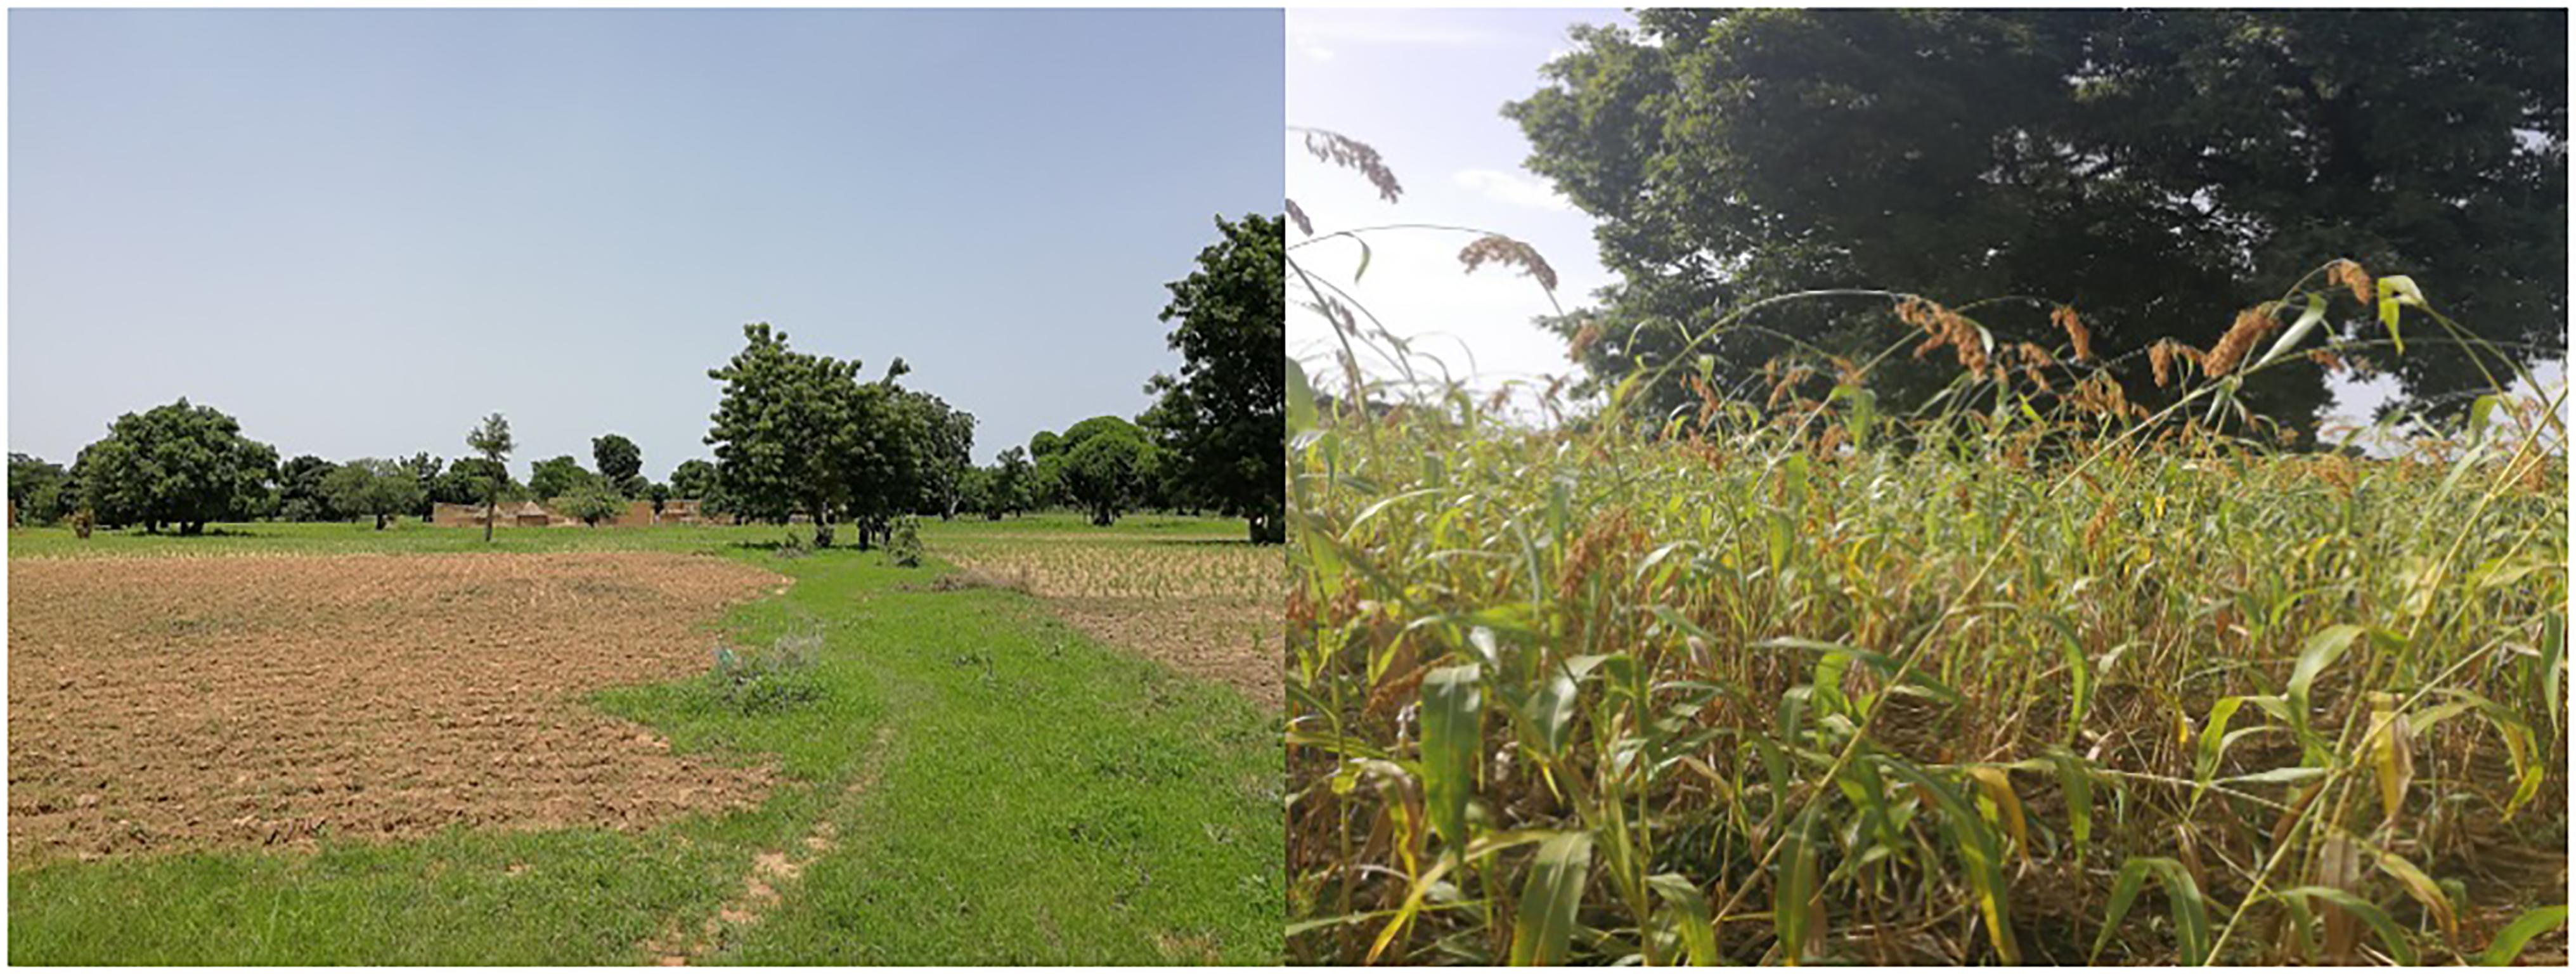
Figure 3. Two examples of field plot locations. Early growing season (left) and before harvest (right).
Satellite Data
Sentinel-2 A/B data from 2017 to 2018 growing seasons (June-October) were processed to Level 2A using version 1.8.3 of the Sentinel-2 for Agriculture system (Bontemps et al., 2015; Defourny et al., 2019). Following these protocols, atmospheric correction, detection of clouds and shadows and retrieval of aerosol optical thickness were done using the MACCS algorithm (Hagolle et al., 2010, 2015). From the two growing season time series, images with cloud cover below 30% were selected for further processing, resulting in six 100 × 100 km granules (30PXU) from 2017 (9/6, 29/6, 29/7, 7/9, 7/10, 22/10) and seven from 2018 (14/6, 14/7, 24/7, 17/9, 27/9, 7/10, 22/10). The image acquisition aimed to select dates from similar points in time for each of the 2 years. MACCS output enabled masking of clouds and shadows in the time series images. Sentinel-2 acquires red-edge and shortwave infrared bands at 20 m resolution. These bands were resampled to 10 m using bilinear interpolation to allow integration with the visible and near-infrared bands.
In addition, we acquired a cloud free Pléiades image (0.5 m spatial resolution) in October 2017 and used it to delineate tree crowns around the field plots. This ancillary dataset enabled an assessment of the potential influence of parkland trees on the Sentinel-2-based crop production estimation.
Vegetation Indices
We used various spectral VI derived from the Sentinel-2 data as estimators of crop production. Table 1 presents candidate VI previously used for estimating crop production in similar agricultural systems. These were identified in recent studies focusing on satellite based estimation of crop production and yield at high spatial resolution in smallholder systems located in comparable agro-ecological zones with similar crops, including Burkina Faso (Forkuor et al., 2018), Mali (Lambert et al., 2018), and Kenya (Jin et al., 2017). Our review indicated that VI with a strong relationship to crop production often included red-edge wavelengths or were designed to be sensitive to canopy chlorophyll content. We also included traditional VI, such as NDVI and EVI, for reference.
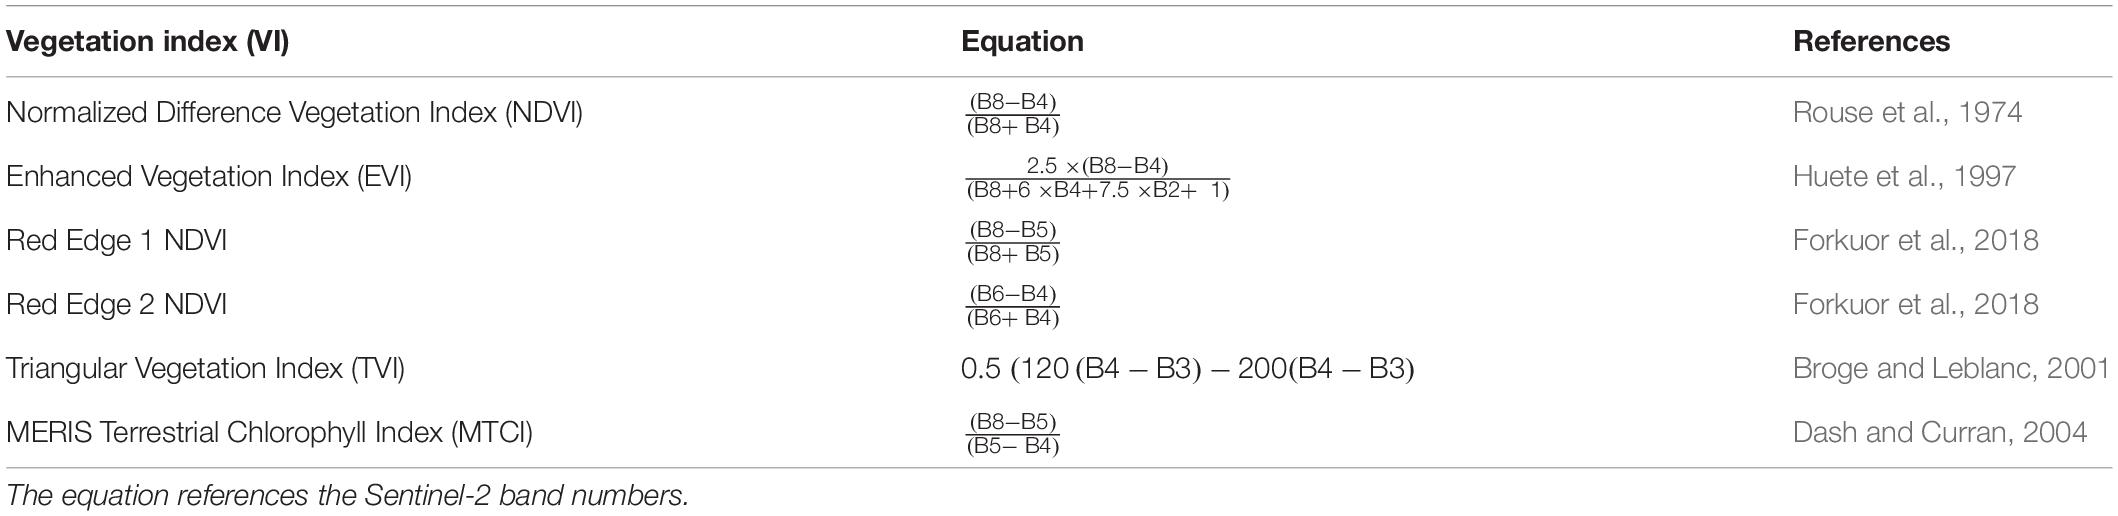
Table 1. Vegetation indices (VI) selected for crop production estimation in Saponé, Burkina Faso.
Temporal Metrics for Crop Production Estimation
The image dates used to derive VI, as well as the method used to integrate a time series of vegetation index values to derive temporal metrics, such as peak or mean values, are critical issues that strongly affect the accuracy of crop production estimation (Chivasa et al., 2017). First, clouds limit the possibility to acquire gap free observations during the growing season, especially in tropical areas, and thereby generally reduces the possibility to acquire dense time series (Roy et al., 2010). Secondly, the phenological phase characterized by the observations is critical for establishing strong relationships between VI and crop production (Duncan et al., 2015). The optimal timing of image acquisition or method for deriving temporal metrics can differ between years, geographical regions and crops, and also depends on the planting period and climatic factors, in particular rainfall (Rasmussen, 1992; Maselli et al., 2000). We evaluated both individual dates and temporal metrics (Table 2) as estimators of crop production. The temporal metrics were derived from the full growing season (GS; June–October), as well as the end of the growing season (EGS) defined here as September to October.
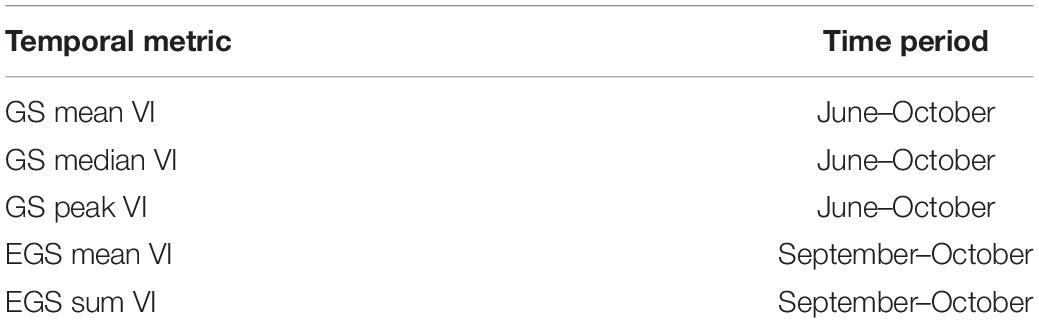
Table 2. Temporal metrics used for crop production estimation based on full growing season (GS) and end of growing season (EGS) VI time series.
Crop Production Estimation
In order to identify the most effective estimators for crop production, we compared average and maximum Pearson correlation coefficients (p < 0.05) between in situ measurements of crop production and the candidate VI. The comparison was done for both the temporal metrics and individual acquisition dates. In the final selection of VI to use as estimators in the crop production models, we gave preference to those that provided high correlation coefficients for both 2017 and 2018. The reason for this was to test whether a crop production model developed in 1 year (2017) was applicable for estimation of crop production in the following year (2018).
Crop production estimation models were calibrated using the most effective estimators identified in the previous step as independent variables in simple Ordinary Least Squares regression. Due to the relatively small sample size (n = 22), we used 10-fold cross validation for model calibration and for computing model accuracy measures (Hastie et al., 2008), including coefficient of determination (R2), root mean square error (RMSE), relative RMSE (relRMSE), and standard deviation (SD).
Analysing the Influence of Tree Cover and Intercropping on Estimation Accuracy
Using the 2017 Pléiades image as reference, we manually delineated individual tree crowns in 60 m × 60 m areas centred over the crop harvest plots and tree canopy cover (%) was calculated within each 3600 m2 area. From the in situ crop production data, we also computed the proportional contribution of cowpea to total AGB, which enabled an assessment of the influence of intercropping on the crop production estimation. Cowpea is a low growing legume and represents the primary crop to combine with cereals (millet and sorghum). We hypothesized that a higher proportion of cowpea in the fields would increase the error in the estimates since this crop is partly obscured from the view of the satellite sensor by the taller cereal canopy. Separate linear regression models were computed to analyse the relationships between residuals from the crop production estimation models and the field level proportion of cowpea AGB, as well as percent tree cover.
Results
Crop Production Measurements
Crop production measured in situ differed substantially between the 2 years, in particular for AGB, which was higher in 2018, whereas inter-annual differences in mean grain yield was comparatively small (Table 3). On the other hand, maximum and minimum values, and consequently the range of AGB and grain yield showed large differences between the 2 years with considerably higher values in 2018. The higher AGB in 2018, when total rainfall was lower compared to 2017, can be explained by variations in the interannual rainfall distribution. Relatively high rainfall in July (2018) can provide more favorable conditions for plant growth, whereas heavy rains in August (2017) can damage the more developed plants through effects of sustained flooding of the soil.
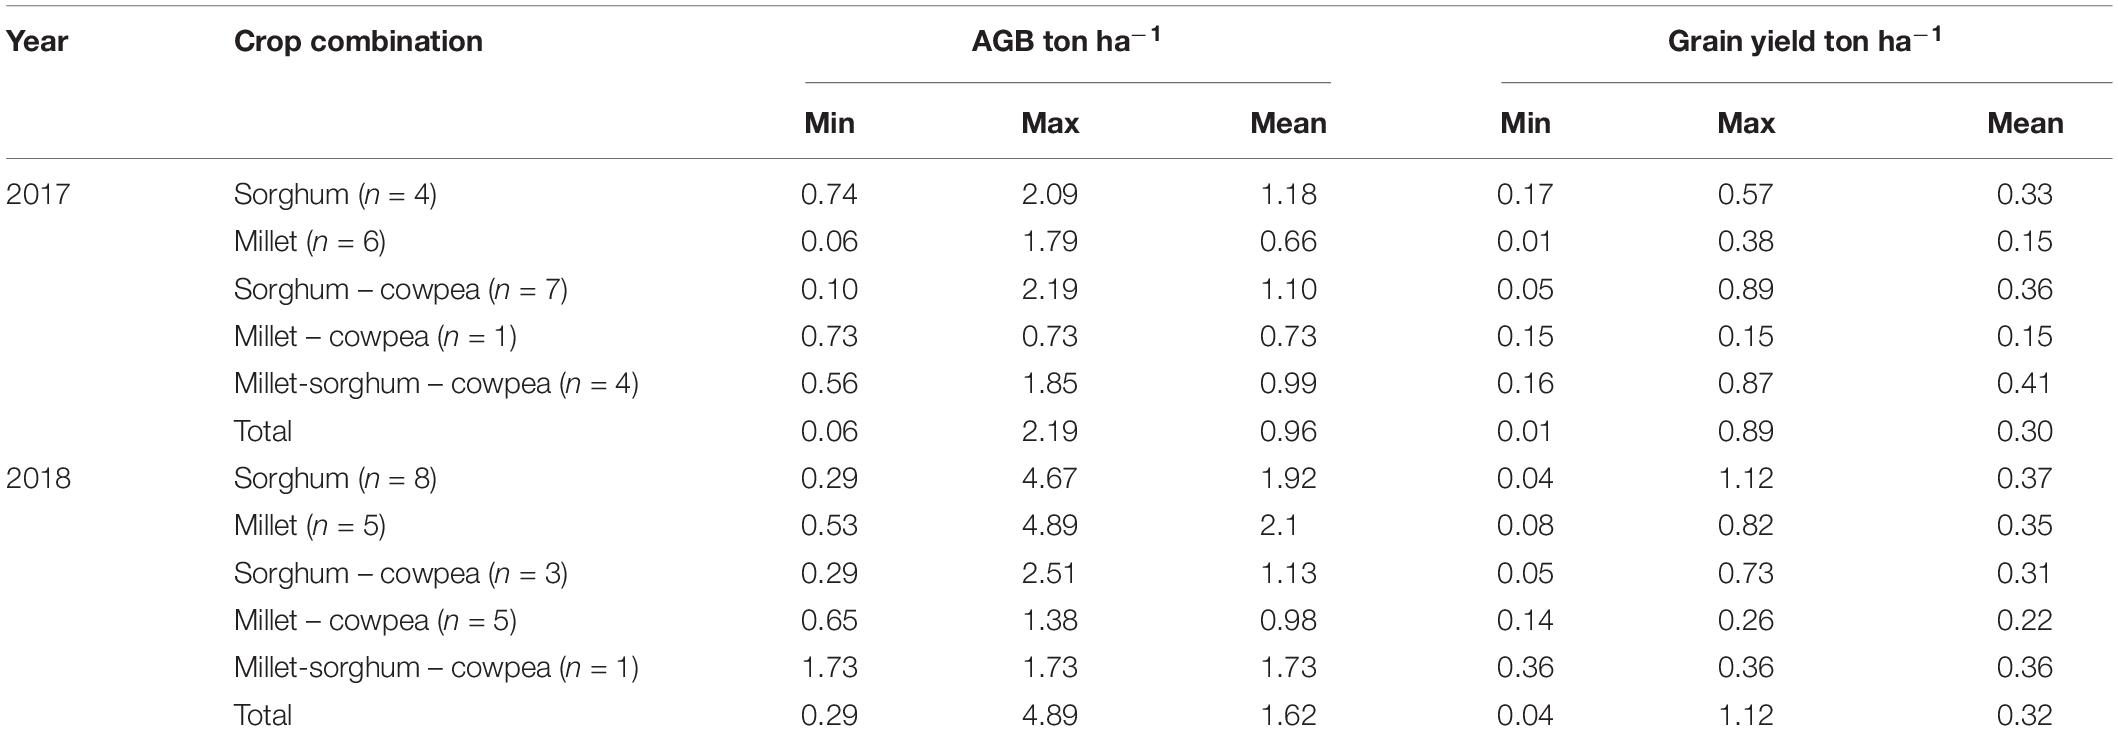
Table 3. Descriptive statistics of in situ crop production measurements in Saponé, Burkina Faso.
There was strong linear relationship between AGB and grain yield in both years, with an R2 of 0.88 and 0.86 in 2017 and 2018, respectively (Figure 4). However, the slope of the regression line differed between the years with a lower AGB to grain yield ratio in 2018 compared to 2017. This suggests that AGB is a very strong indicator of grain yield despite the high prevalence of intercropping of cereals and legumes, which differ markedly in their structure. The results also show that the relationship can be subject to considerable inter-annual differences. We choose to focus the remaining analysis of satellite-based crop production estimation on total AGB instead of grain yield for two reasons. Firstly, AGB is what influences the signal in the Sentinel-2 data and any attempt to estimate grain yield is dependent on the strength of this relationship. Secondly, in addition to the grain yield, all other crop material constitutes an important source of fodder for livestock, which represents a key component of the area’s livelihood (Bayala et al., 2014).
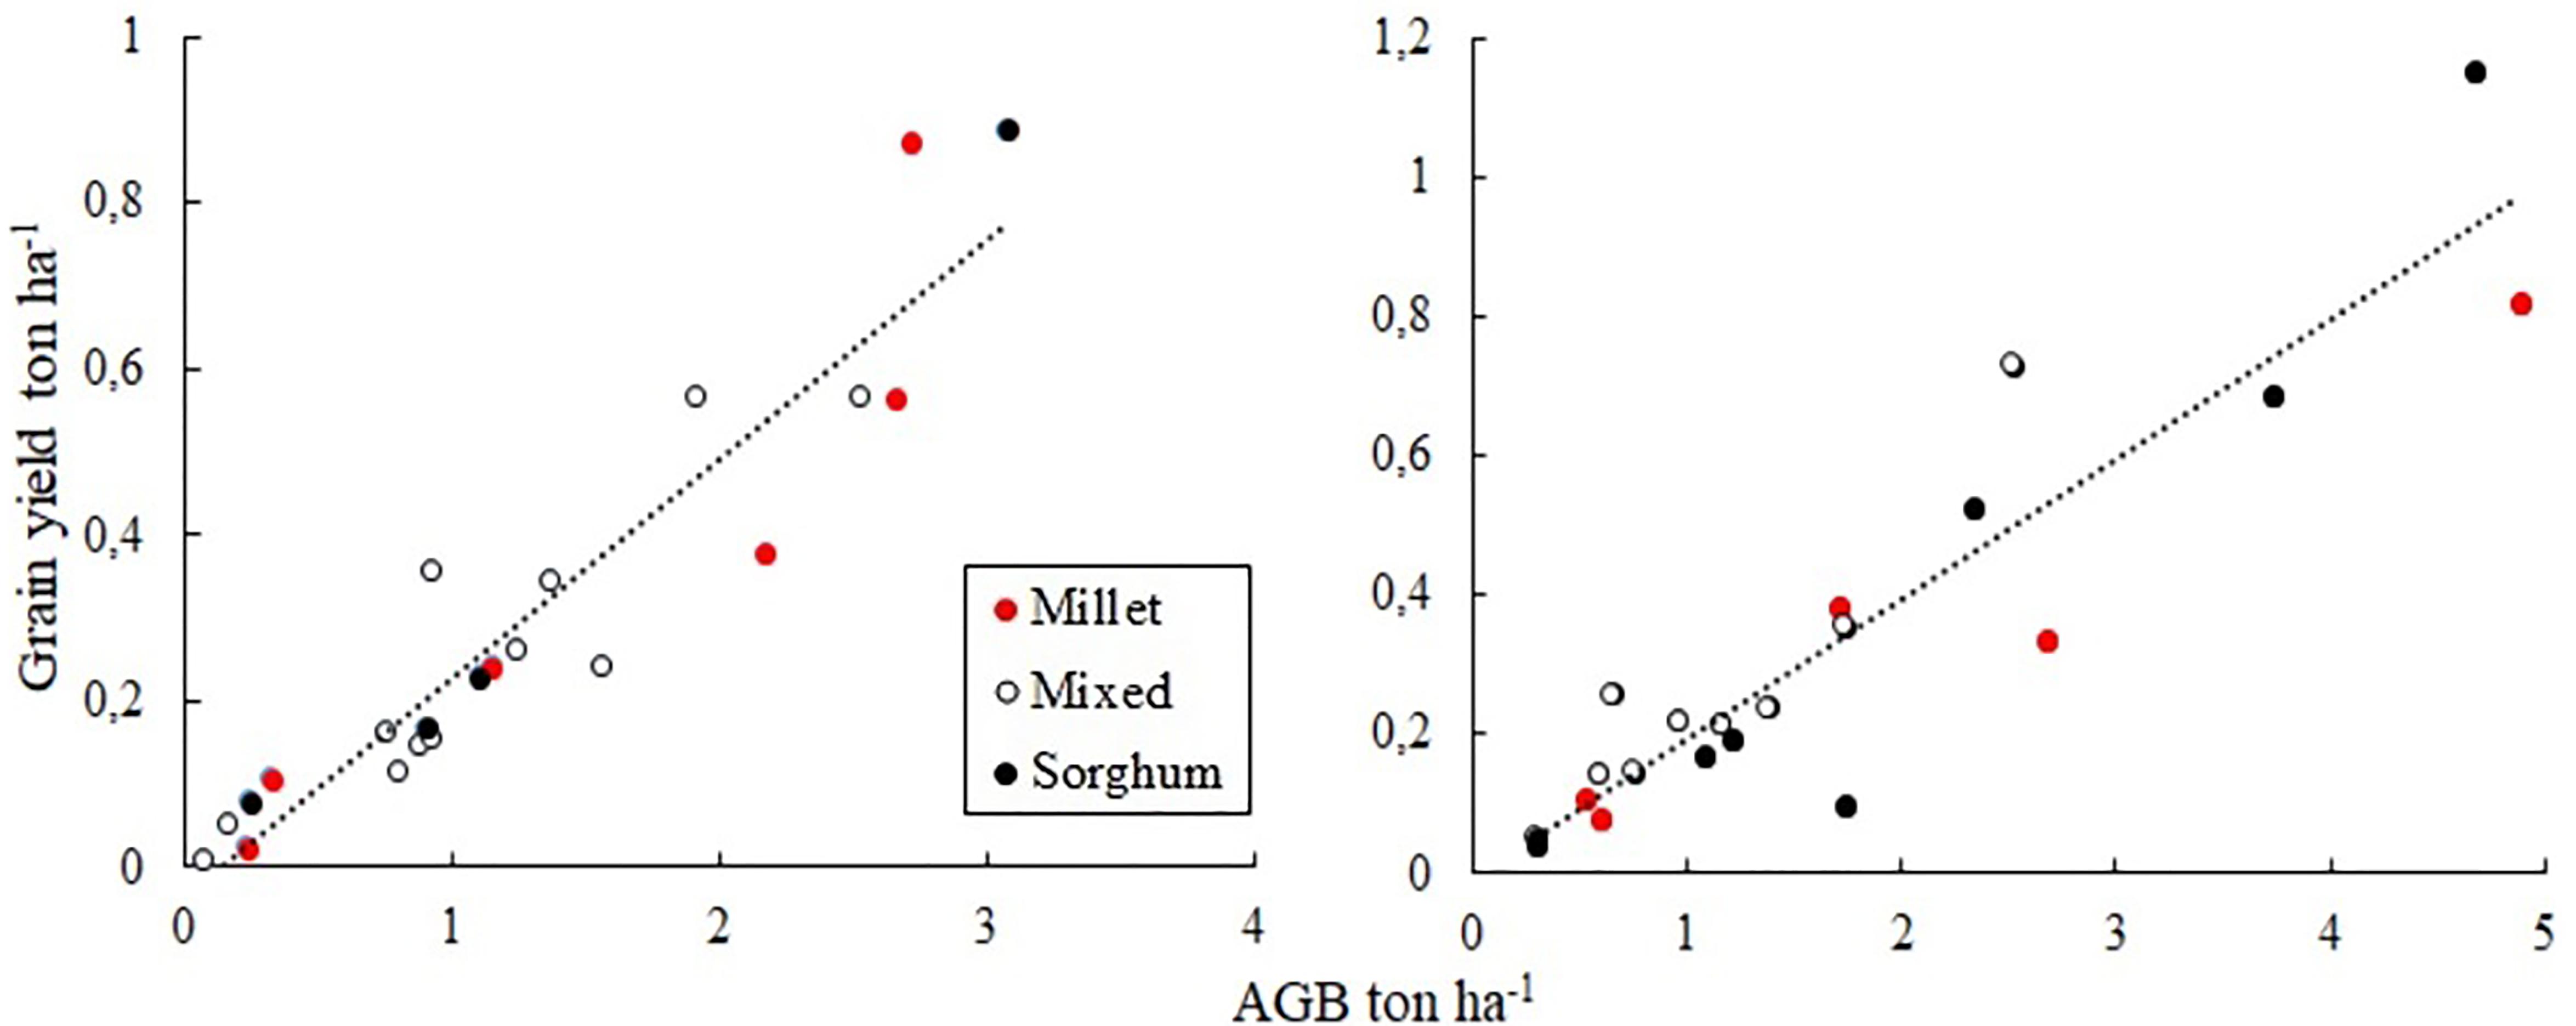
Figure 4. Relationships between in situ aboveground biomass (AGB) and grain yield in 2017 (left; R2 0.88) and 2018 (right; R2 0.86) in Saponé, Burkina Faso.
Identification of Crop Production Estimators
The strength of relationships between the candidate VI and AGB varied slightly with no clear consistency between the years, with the exception of MTCI that did not provide a significant correlation in either 2017 or 2018 (Table 4). When considering both 2017 and 2018, RENDVI 2 proved to be the most stable VI and was therefore selected as the VI to develop regression models for crop production estimation. The temporal metrics with the strongest relationship to AGB also differed between the years, with GS peak VI consistently ranking highest in 2017 and GS median VI in 2018.
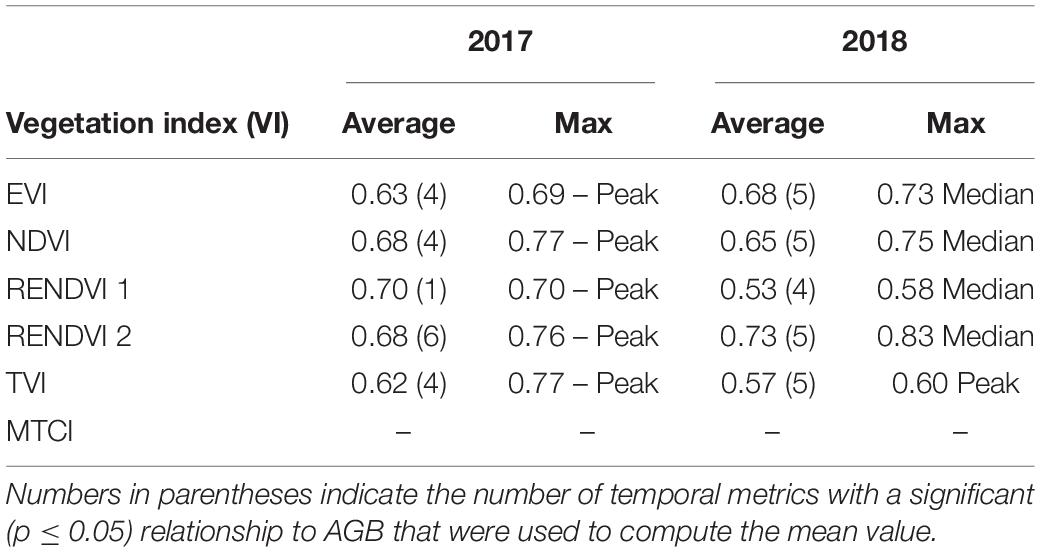
Table 4. Correlation coefficients between vegetation index (VI) temporal metrics and aboveground biomass (AGB) in Saponé, Burkina Faso.
In addition to the temporal metrics, we also investigated the potential of the most effective VI (i.e., RENDVI 2) from individual dates as estimators of AGB. Figure 5 shows a relatively similar temporal pattern for both years, where RENDVI 2 from early to mid-September appears to provide the strongest correlation to AGB. The difference in the September image acquisition dates between 2017 and 2018 needs to be considered when comparing the maximum correlation coefficients.
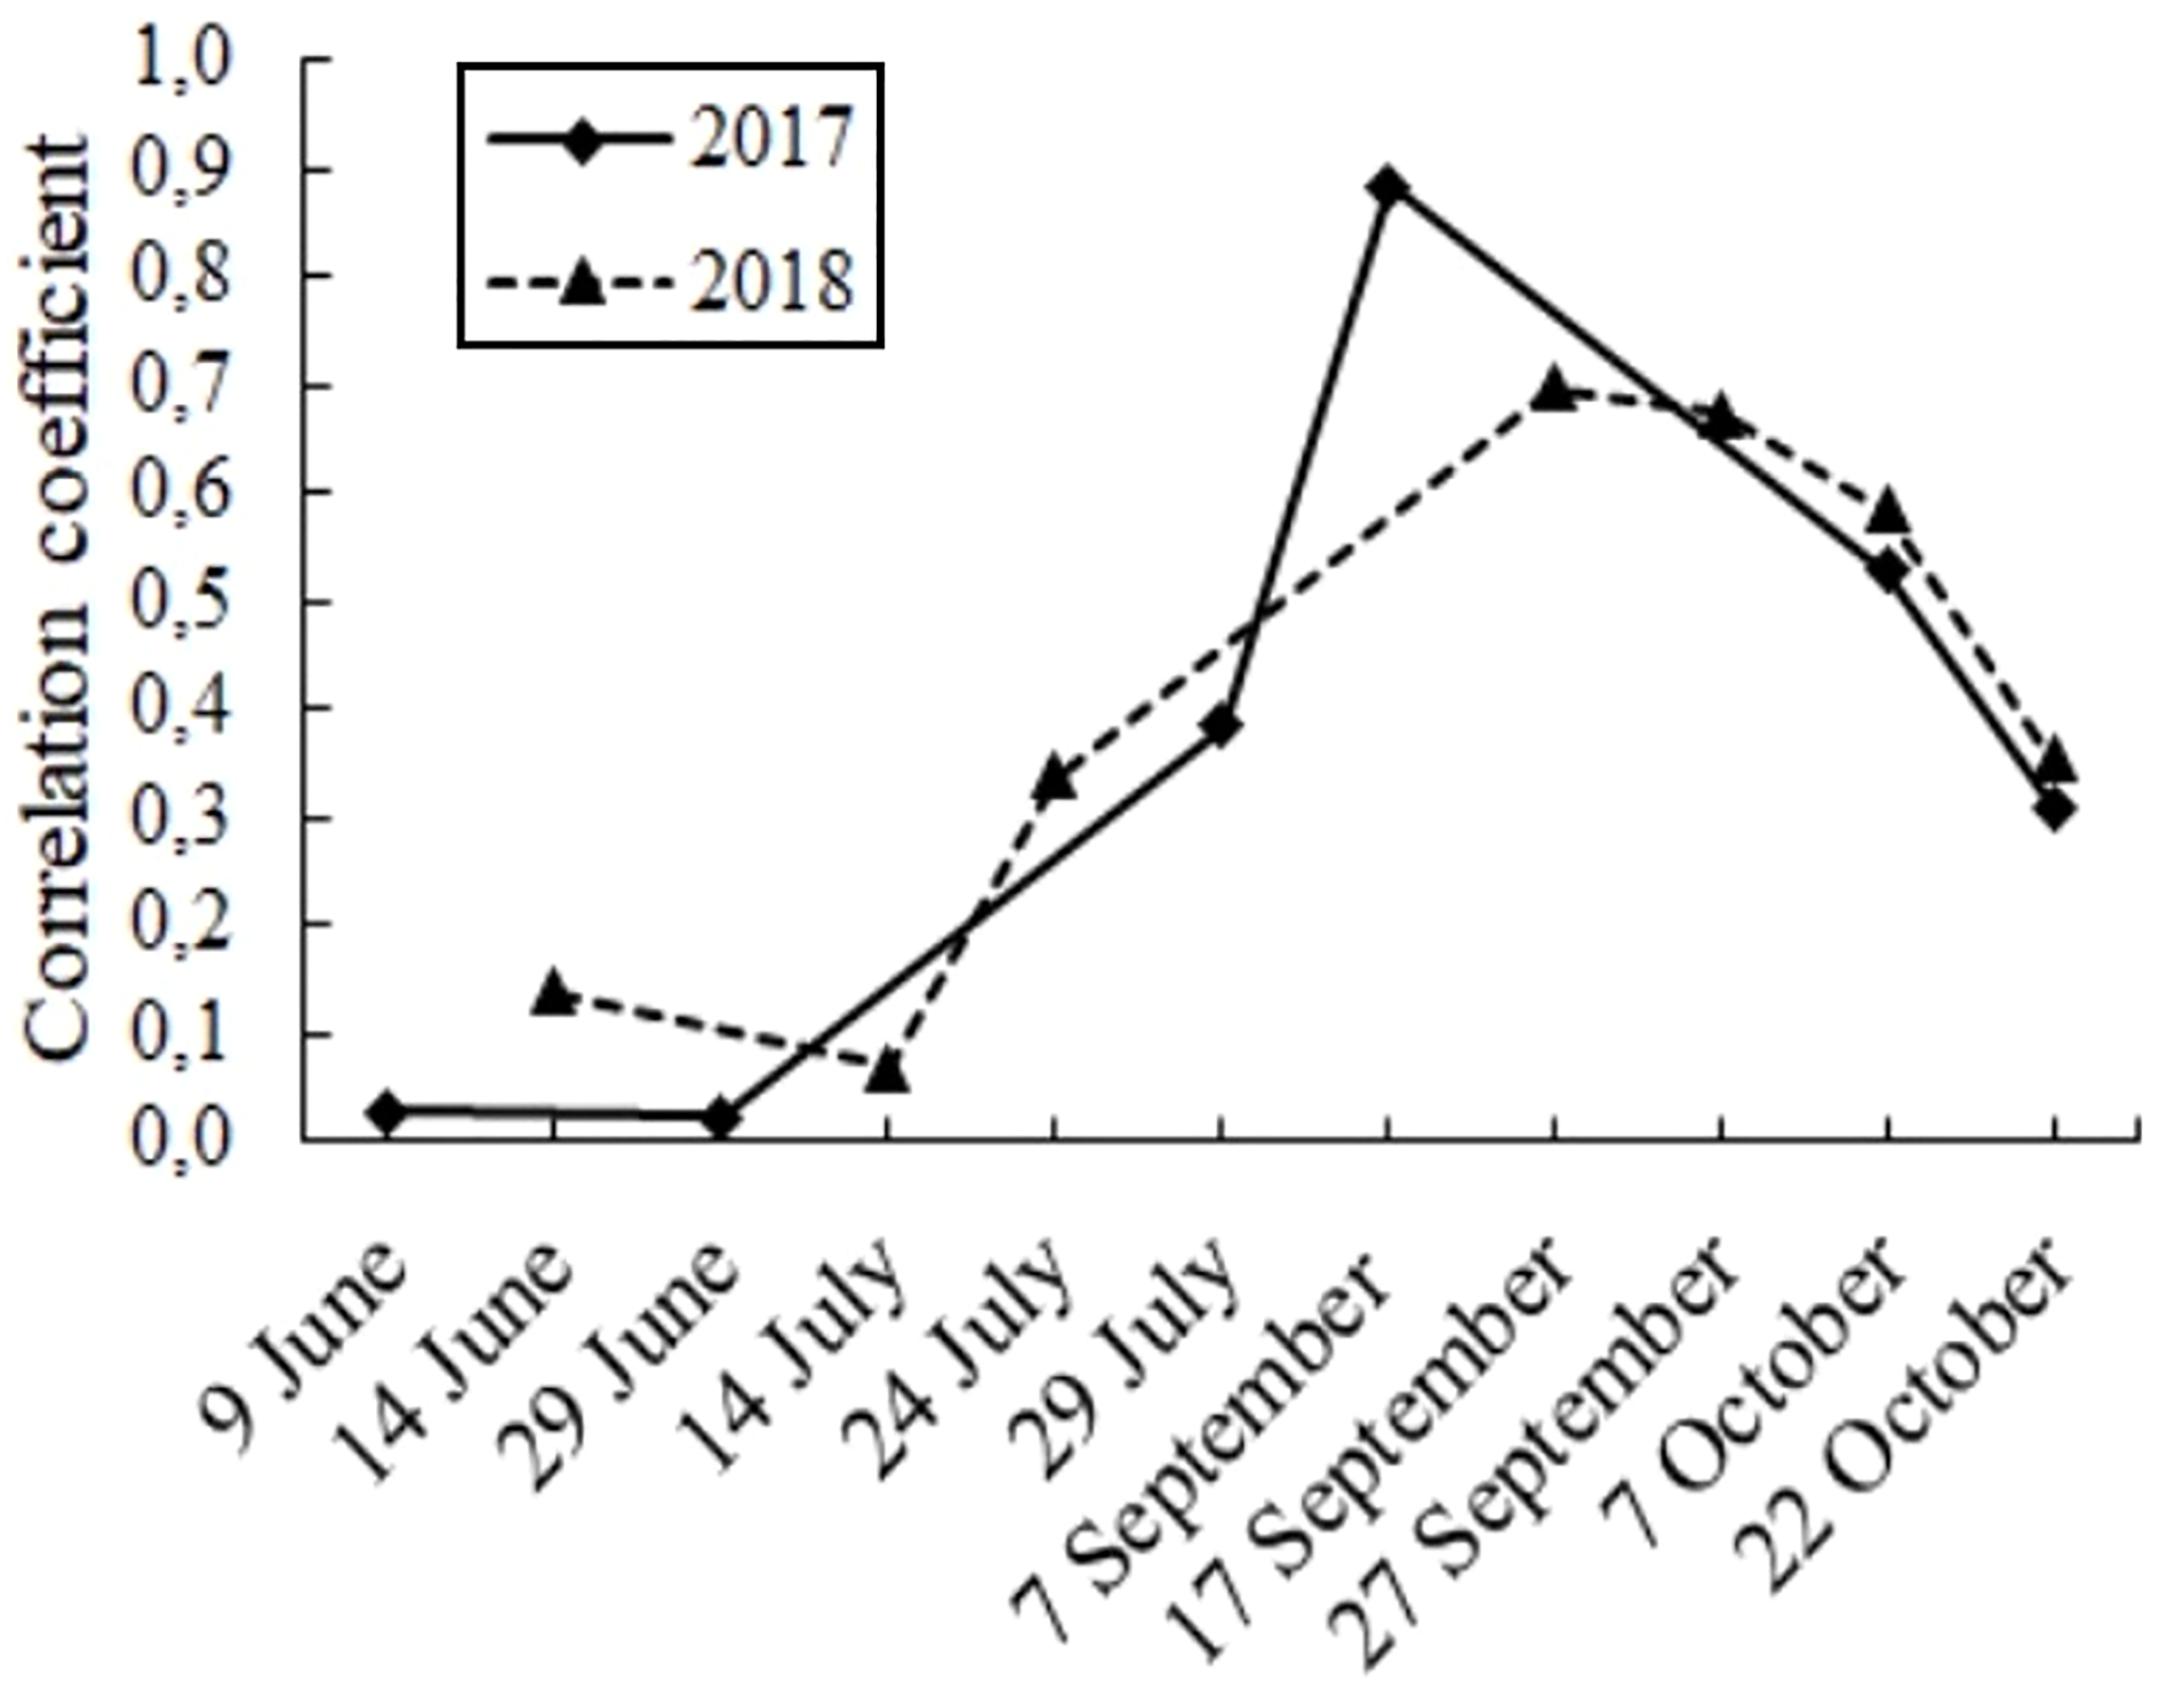
Figure 5. Correlation between RENDVI 2 from different image acquisition dates and aboveground biomass (AGB) at harvest in Saponé, Burkina Faso.
Estimating Crop AGB Production
The regression equations and the validation metrics for the AGB estimations based on temporal metrics and individual dates are presented in Table 5. The strength of the linear regression models between in situ AGB and VI estimates is generally high, with R2 ranging between 0.41 and 0.80. However, there are clear differences in accuracy between the 2 years when using VIs from individual dates as estimators. Specifically, the regression model based on RENDVI 2 from September 7 (2017) resulted in the most accurate estimates overall, with an R2 of 0.80 and relRMSE of 32.2%. This contrasts with the lowest accuracy for AGB estimates that were derived using RENDVI 2 from September 17 in 2018, both in terms of R2 (0.41) and relRMSE (63%). Using temporal metrics (GS peak and median) derived from the full growing season time series as estimators resulted in relatively high accuracy for both 2017 and 2018 with small inter-annual differences.
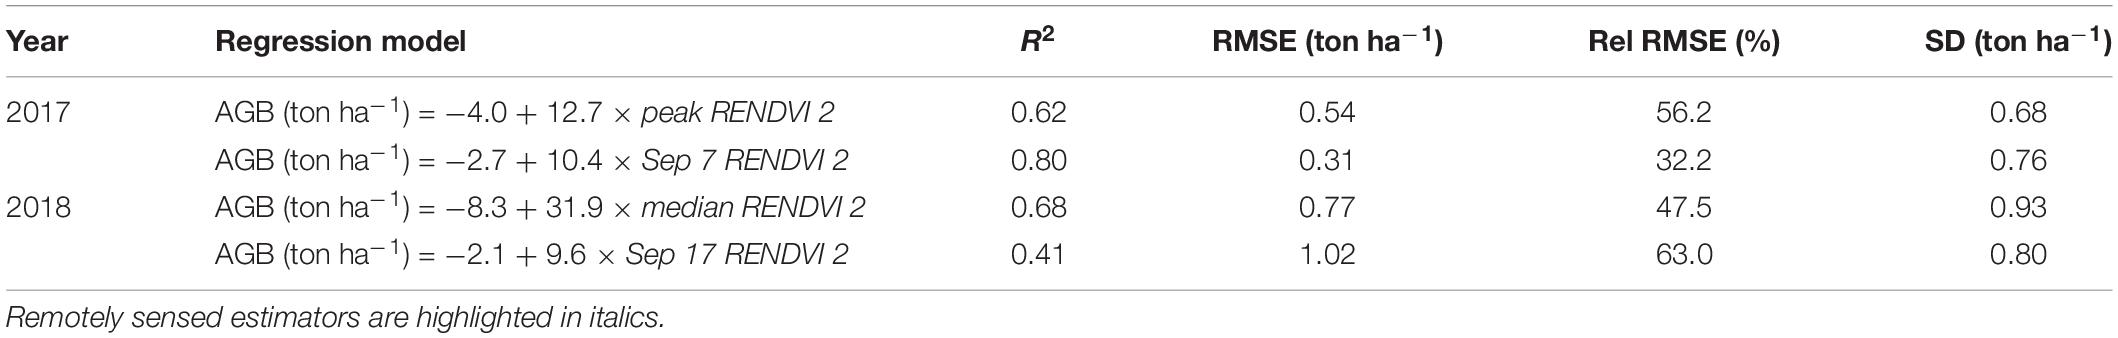
Table 5. Linear regression models used for aboveground biomass (AGB) estimation and validation metrics for 2017 and 2018 for the Saponé site in Burkina Faso.
Above ground biomass estimates in 2017 were within the range of the in situ measurements and the estimation models did not show any signs of bias (Figure 6). In 2018, the AGB estimates were mostly between 0.5 and 3 ton ha–1 and generally smaller as compared to the in situ measurements. The 2018 temporal metric (median) showed less tendency for bias and clearly outperformed the individual date (September 17, 2018) in terms of accuracy.
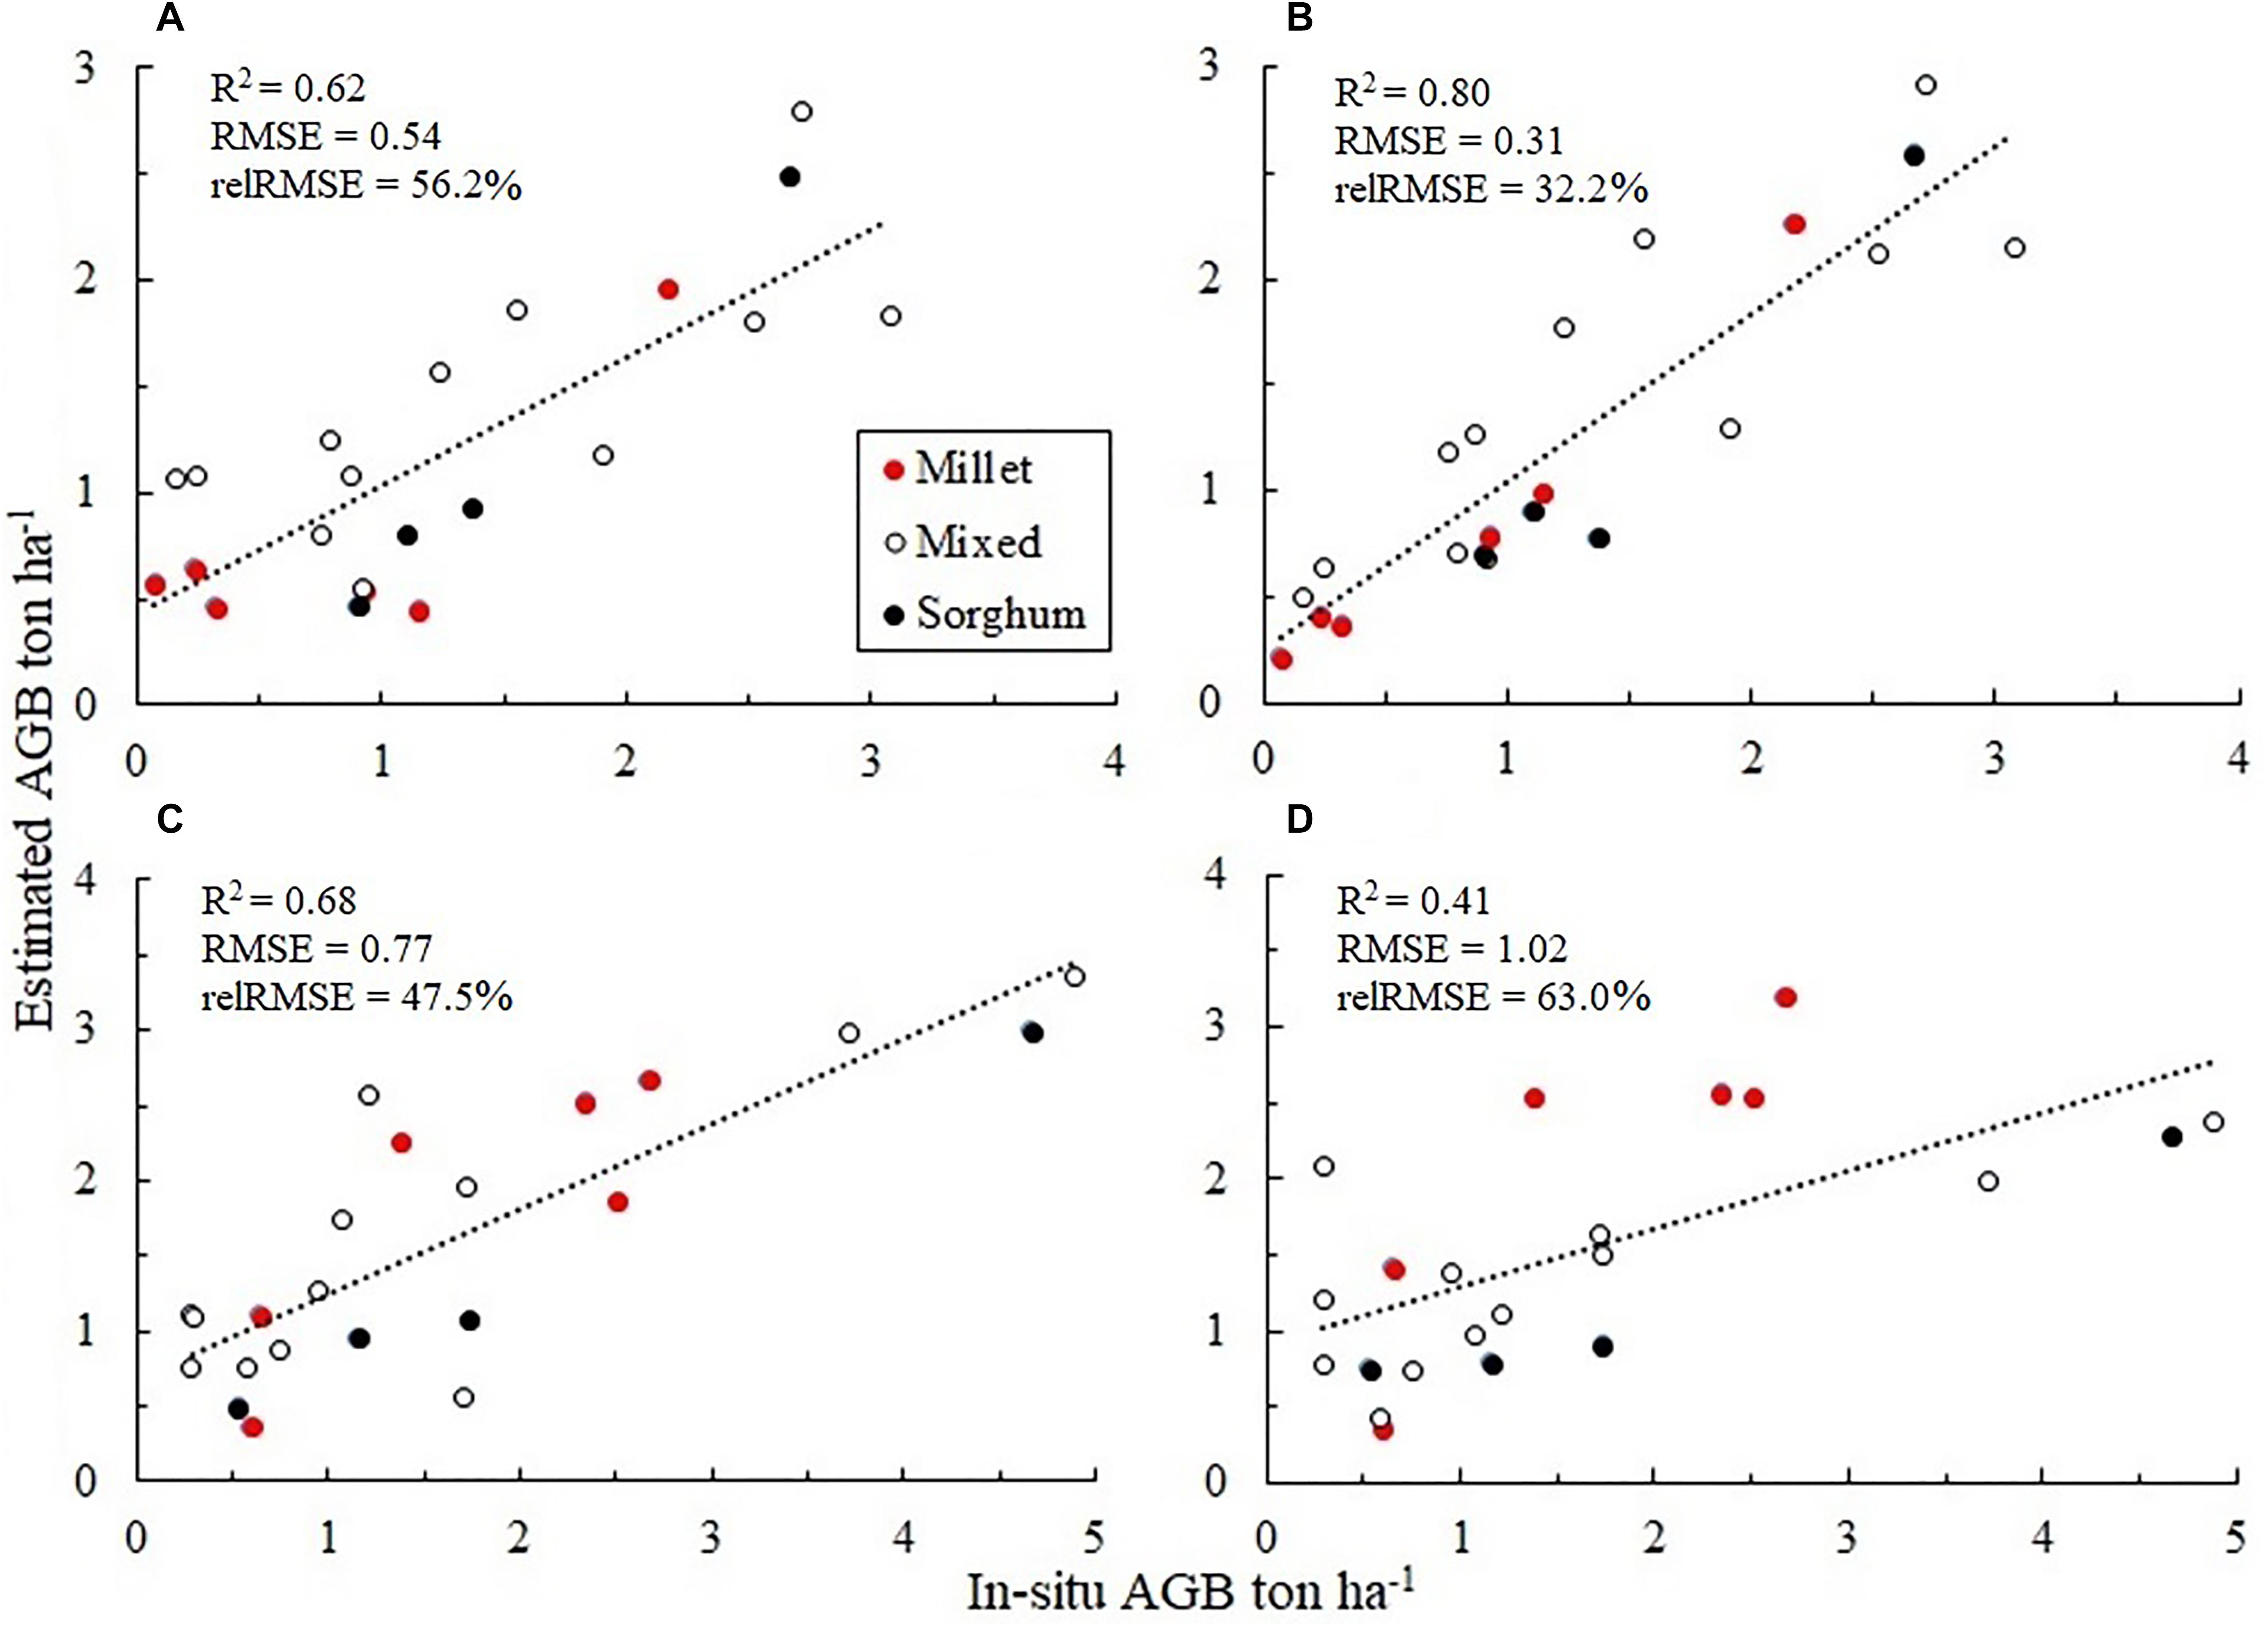
Figure 6. Relationship between in situ and estimations of aboveground biomass (AGB) based on peak VI 2017 (A), 7 September 7, 2017 (B), median VI 2018 (C), and September 17, 2018 (D) for Saponé site in Burkina Faso.
Inter-Annual Consistency
As an additional experiment, we applied the 2017 peak RENDVI 2 regression model to estimate AGB in the following year using the 2018 Sentinel-2 time series as input data. The 2017 peak RENDVI 2 model was able to produce relatively accurate AGB estimates in 2018 in terms of R2 (0.66), RMSE (0.81 ton ha–1) and relRMSE (50%; Figure 7). However, the AGB ranges and mean values are different between the years, and AGB in 2018 was generally underestimated when using the model developed in 2017. The estimates for plots with only millet in particular resulted in large errors, whereas AGB in plots with mixed crops were accurately estimated.
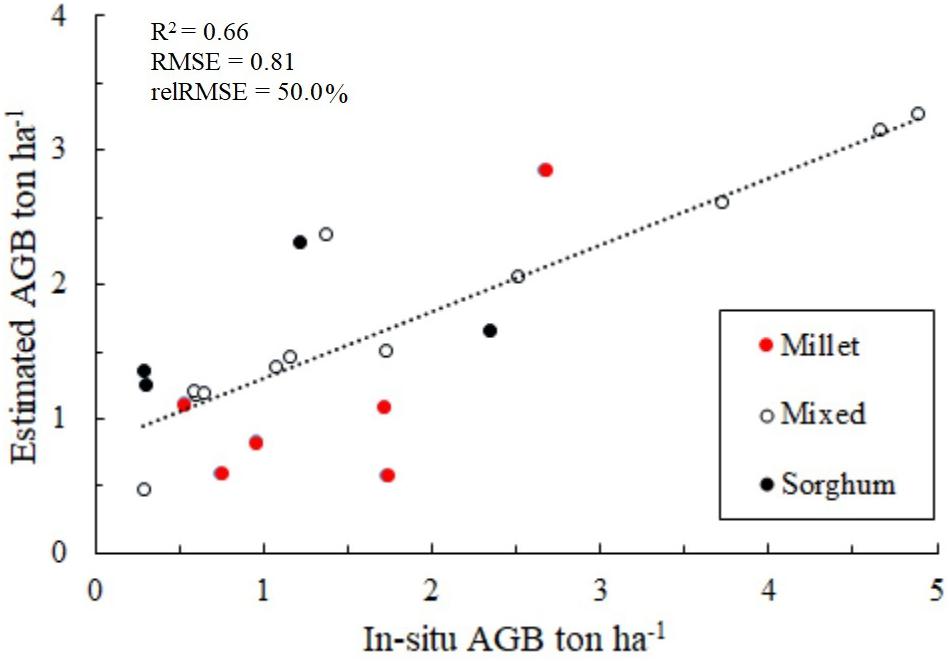
Figure 7. Result when applying the 2017 peak RENDVI 2 regression model to the 2018 time series data for Saponé site in Burkina Faso.
Influence of Tree Cover and Intercropping on Estimation Accuracy
We found no significant correlations between residuals and percent tree cover inside and around the fields (Figure 8), nor between regression residuals and the proportional contribution of cowpea to the total AGB. Consequently, these factors do not appear to significantly influence the satellite-based estimation of AGB in this study.
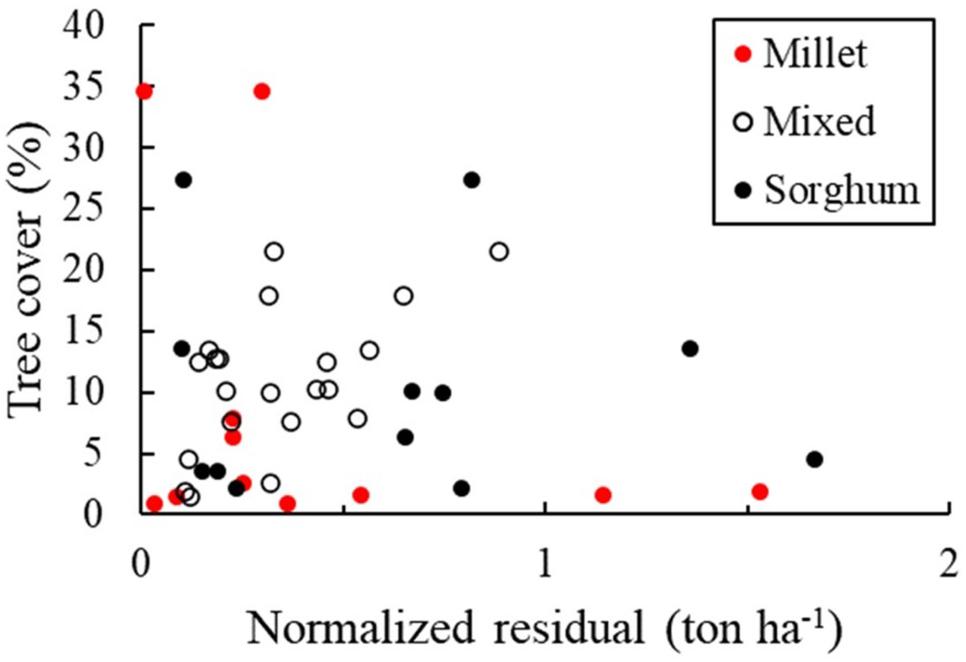
Figure 8. Relationship between normalized residuals from AGB estimation based on RENDVI 2 temporal metrics (peak 2017; median 2018) and percent tree cover in and around in situ plots for Saponé site in Burkina Faso.
Discussion
The ability to produce accurate and spatially explicit estimates of crop production at sub-field level from freely available satellite data would be a major development for the monitoring and analysis of smallholder farming systems in Africa. This study demonstrates that this may be feasible even in the highly heterogeneous and complex agroforestry parklands that extend over large parts of the Sudano-Sahel in West Africa. The following section discusses the relevance of our results for the application of the method to estimate crop production at regional or national level.
Comparison to Previous Crop Production Estimation Based on Satellite Imagery
Depending on the estimator used and the year considered, our method was able to explain between 41 and 80% of the variation in the in situ crop production measurements, with RMSE ranging between 0.31–0.54 and 0.77–1.02 ton ha–1 AGB in 2017 and 2018, respectively. Previous research on the use of medium to high spatial resolution satellite imagery for crop production estimation in Africa is limited compared to other continents. In addition, comparing results from this study to previous research is complicated due to differences in the crops in focus, the spatial scale used for estimating crop production and measures used to report accuracy. While the commonly reported RMSE provides a quantitative measure of accuracy, its interpretation is dependent on the local crop production conditions, in particular the production per spatial unit.
Earlier efforts that focused on similar crops (i.e., millet and sorghum) primarily used coarse resolution AVHRR imagery for estimating crop production at district level (Rasmussen, 1992; Maselli et al., 2000), with limited relevance for comparison with our sub-field level results. In terms of accuracy, our results are comparable to the study in Mali by Lambert et al. (2018) who used peak LAI derived from Sentinel-2 imagery acquired at the end of August to estimate crop yield of millet, sorghum and maize. These authors report results from crop type specific regression models, with R2 ranging between 0.48 and 0.80 and RMSE between 0.5 and 1.0 tons ha–1. Other studies in Africa have also focused on single crop agricultural systems, mainly maize production, with varying results. For example, Jin et al. (2017) achieved R2 between 0.28 and 0.36 for field level estimates of maize production in western Kenya using Sentinel-2 imagery but did not report RSME. In the same area, Burke and Lobell (2017) estimated maize production using Terra Belle high spatial resolution imagery and reported R2 of 0.4 at field level. Other studies have estimated maize production at a higher level of spatial aggregation. Azzari et al. (2017) used peak VI from coarse spatial resolution MODIS data at province level in Zambia and reported R2 of 0.55 and RMSE of 0.4 ton ha–1. In Kenya and Tanzania, Jin et al. (2019) reported district level results with an accuracy of R2 of 0.5 and RMSE of 0.39–0.54 ton ha–1. Consequently, the accuracy of our estimates is in the same range as those previously reported even though a large proportion of the sampled fields in this study included both mixed crops and trees.
Effectiveness of Crop Production Estimators
We assessed several VI for their effectiveness in estimating crop production. Correlation analysis did not show substantial differences in the strength of the relationship between the different VI and AGB, in particular in 2017. In 2018, RENDVI 2 marginally outperformed the other VI and was therefore selected as the principle VI for crop production estimation in this study. The importance of the Sentinel-2 red-edge bands confirms previous research on crop mapping applications in the Sudano-Sahel (Forkuor et al., 2018; Lambert et al., 2018). A main reason for the high correlation between AGB and RENDVI 2 is likely the sensitivity of the Sentinel-2 red-edge bands, in our case particularly band 6, to key elements in photosynthesis, including canopy content of chlorophyll and nitrogen. However, the small differences in predictive performance suggests that the choice of VI does not appear to be a critical consideration in this particular agricultural system. The main exception was MTCI, which previously has been identified as an effective estimator of maize production (Jin et al., 2019), but was not in our study.
The effectiveness of the temporal metrics used as crop production estimators differed between the 2 years. In 2017, growing season peak values provided the strongest relationship between AGB for all VI, whereas median VI values were generally the most effective estimator in 2018. This is likely caused by a combination of differences in i) availability of cloud free imagery between the years, and ii) local growing conditions related to rainfall amount and temporal distribution. The rainfall distribution differed substantially between 2017 and 2018, which may have affected both the total crop production, as well as the relationship between VI and AGB. Growing season peak values are the most commonly used estimator in comparable studies (Azzari et al., 2017; Lambert et al., 2018; Jin et al., 2019). However, our results suggest that the optimal estimator is likely a function of annual crop growth dynamics and crop density, which in the Sudano-Sahel is tightly coupled to the amount and distribution of rainfall (Rockström and de Rouw, 1997; Gibon et al., 2018).
Inter-Annual Consistency of VI-AGB Relationships
There was a relatively large disparity in estimation accuracy between the 2 years in this study with relRMSE ranging between 32.2–56.2% in 2017 and 47.5–63% in 2018. The rather high relRMSE is mainly an effect of the generally low AGB values resulting from unfavorable growing conditions (soil and rainfall) in the area. The higher relRMSE in 2018 can be explained by a combination of two factors: the substantially higher mean AGB and a weaker relationship between the VI based estimators and crop production. The large difference in AGB between the 2 years is the result of high climate variability that characterize this region (Sultan and Gaetani, 2016). In addition, clouds restricted the collection of imagery during late August and early September in 2018. This relatively short window of time appears to be crucial for achieving a strong relationship between VI and AGB at the EGS (see Figure 5), and likely corresponds to the period when crops reach maximum growth and greenness in this region (Lambert et al., 2018). From mid-September, the crops start to ripen with accompanying leaf senescence and chlorophyll breakdown, which results in reduced correlation between AGB and VI based estimators. Since the harvest of millet, sorghum and cowpea usually takes place between late October and early November, this time window opens up for using imagery from this period as an important source of information for predicting the harvest 1–2 months before the end of the growing season. Such information is a key component of early warning systems focusing on food security (Meroni et al., 2014a). However, the duration of this study is too limited to characterize the high inter-annual climate variability and its influence on crop development, as well as the ratio between AGB and grain yield. A longer time series of in situ crop production measurements is needed to derive well-founded conclusions.
In 2017, the use of RENDVI 2 from an individual date (September 7) resulted in slightly more accurate AGB estimates compared to using growing season peak values. When applying this method to map larger areas, the potential increase in accuracy achieved from using single date imagery needs to be contrasted with the possibility of increased data gaps caused by high cloud cover coinciding with the period of maximum vegetation growth. The use of a temporal metric, such as peak VI, has the benefit of limiting the impact of clouds by combing VI values from multiple image acquisitions and thereby increasing the possibilities for deriving gap free data coverage.
The results from this study using 2 years of data represent conditions in a relatively small area, which needs to be kept in mind. Several factors may influence the timing of maximum crop growth and therefore the relationship between VI and AGB, including inter-annual rainfall variability, soil moisture, sowing date and differences between crop varieties or combinations (Meroni et al., 2014b; Sanon et al., 2014; Wolf et al., 2015). These factors are highly variable in space within the Sudano-Sahelian zone, which makes it difficult to predict optimal timing for image acquisition in a specific area. When applying this method for estimating crop production on a regional or national scale, it is therefore advisable to use temporal metrics as estimators instead of individual dates for image acquisition. Besides reducing the influence of clouds, the use of temporal metrics can also compensate for local differences in the timing of maximum crop growth, and consequently strengthen the relationship between VI and AGB. However, further research using both longer time series of in situ crop production, as well as sampling plots distributed in a larger area is needed to clarify this issue.
The collection of in situ crop production measurements is a work intensive and time demanding task. Hence, it would be advantageous if a crop production model developed for 1 year could be applied to estimate crop production for future years. Identifying a temporal metric that is stable through time and space will be an important task in this context in order to facilitate operational application of satellite-based crop production estimation. Our initial attempt to test this showed that reasonably accurate estimates in terms of R2 and RMSE could be achieved when using the 2018 Sentinel-2 time series as input to the 2017 peak RENDVI 2 model. However, the results also showed that large inter-annual differences in the range of in situ AGB could cause problems for the estimation model. In our study, this generally resulted in severe underestimation (relRMSE = 50%) of the 2018 crop production. Another explanation for the high relRMSE in 2018 when using the model developed in 2017 can be that the crop combination changed substantially between the 2 years. More accurate predictions may be possible in areas where the crop rotation cycle is more stable, and the same crops or crop combinations are grown in the fields in consecutive years.
Effects of Intercropping and Tree Cover on Crop Production Estimation
When considering that previous research reported accuracies for single crops or used crop specific prediction models, our results derived from a high proportion of intercropped fields are encouraging. Intercropping cereals with a significant proportion of legumes is a common agricultural strategy in Sudano-Sahel for improving food and nutrition security and replenish soil nitrogen (Franke et al., 2018; Kulkarni et al., 2018). We did not find evidence suggesting that a high degree of intercropping affected the relationship between VI and AGB, and consequently did not affect the ability to estimate crop production from Sentinel-2 imagery. Crop specific regression models may increase estimation accuracy but require a land-cover map in which fields are classified based on crop type or crop combinations. This adds a layer of uncertainty that needs to be considered. In northern Burkina Faso, Forkuor et al. (2018) showed that it is possible to separate mono-crop fields with either cereals or legumes with relatively high accuracy using Sentinel-2 image classification. However, accurately distinguishing intercropped fields in remote sensing imagery is virtually impossible (Bégué et al., 2018). In addition, separation between millet and sorghum using image classification is generally not reliable due to their similar structure and spectral properties (Lambert et al., 2018). Taken together, this limits the applicability of crop specific regression models in smallholder agricultural systems in the Sudano-Sahel.
In addition to intercropping, the prevalence of a substantial tree cover in the fields is generally considered an important factor that restrict remote sensing for agricultural applications in African smallholder systems (Lobell, 2013; Sweeney et al., 2015). In this study, tree cover inside or in close proximity to the fields did not seem to influence the crop production estimation negatively. However, other sources of error may have disturbed the relationship between VI and AGB and reduced the accuracy of the estimations. Quantitative measures of weeds or shrub coppices in the field were not recorded during the in situ data collection. A high presence of such vegetation is likely to influence the performance of the satellite based estimation (Burke and Lobell, 2017), but could not be assessed here due to lack of this information in the collected reference data. The collection of such data is a key issue for future studies.
Potential Applications of Satellite-Based Crop Production Estimates
High-resolution crop production estimates of sufficient accuracy have several applications of prime importance, especially in an African context. Firstly, collection of field level data on crop production is expensive and seldom reported systematically in African countries, including in the Sudano-Sahel (Burke and Lobell, 2017). Lack of such data limits the possibilities to understand the causes of yield gaps in different types of agricultural systems. Knowledge about yield gaps and their causes is a key prerequisite for improving crop production and increasing food security through various interventions (Tittonell and Giller, 2013). In the agroforestry parkland system, such interventions could include different strategies for managing the tree cover, including crown pruning, tree species selection and modifying tree densities in the fields (Bayala et al., 2015). Detailed characterization of parkland tree cover, including canopy structure and species composition can be achieved using satellite remote sensing (Karlson et al., 2014, 2016). The combination of detailed and spatially explicit information on both trees and crops opens up new ways of studying the mechanisms of this important agriculture system.
Crop production statistics reported at district to national levels are generally considered unreliable in many African countries (Carletto et al., 2015b), including Burkina Faso. While limited in geographical scope, our results indicate that Sentinel-2 imagery may represent an important complementary data source to improve the situation. Other researchers have shown that the accuracy can be improved when crop production estimates are aggregated at a coarser spatial unit, including districts and provinces (Azzari et al., 2017; Jin et al., 2019). In Burkina Faso, national statistics of the main crops are based on field level estimates that are aggregated at regional and national level. These surveys are conducted throughout the different regions of the country and thereby captures the spatiotemporal variability in crop types and combinations, and crop production capacity. If quality of the surveys can be ensured and the field level measurements are accurately geo-references, these data could be used to calibrate Sentinel-2 based crop production estimation models, which allow national scale mapping. An important prerequisite for such an approach is, however, accurate maps of agricultural field boundaries. Previous research has demonstrated that such maps can be derived from optical satellite systems, such as Landsat 8 and Sentinel-2, even in the heterogeneous smallholder systems of Sudano-Sahel (Forkuor et al., 2018). Another option for this task may be high-resolution cubesat imagery with daily revisit periods provided by systems such as PlanetScope to capture this highly dynamic landscape where fields are regularly fallowed, and new land is subsequently cleared.
Conclusion
This study investigated the potential of Sentinel-2 data for mapping crop production at 10 m pixel resolution in a smallholder agroforestry area situated in central Burkina Faso. Several factors contribute to making this a challenging landscape for this type of mapping, including pervasive cloud cover during the growing season and heterogeneous agricultural fields in terms of size, shape and a high prevalence of intercropping of cereals and legumes, as well as interspersed trees and shrubs. Our results based on 2 years of in situ crop production data show that inter-annual variability in climate conditions can lead to relatively large differences in the relationship between crop development and VI, which constitutes the basis for estimating crop production from satellite data. This was manifested by interannual differences in the effectiveness of satellite data acquisitions and the method used for deriving VI temporal metrics. While the temporal dimension of crop production estimation appears to be highly influential on mapping accuracy, the choice between different VI appears to be of lesser importance in the agroforestry parkland system, which was in focus here. A way forward would be research targeting a wider area, additional years of in situ data and different crop combinations and densities to confirm these observations.
The method presented here based on freely available satellite data and processing tools was able to explain between 41 and 80% of the variability in the in situ crop production data, depending on year and approach used for deriving temporal metric from VI time-series. This relatively high mapping accuracy is encouraging, especially since a high proportion of the in situ data represented fields where cereals and legumes were intercropped. From an operational mapping perspective targeting regional or national scales, such field conditions are to be expected for large areas of the Sudano-Sahelian zone. These results contribute to a growing body of research showing that sufficiently accurate and spatially explicit estimates of crop production at landscape scale may be feasible not too far into the future, even for the challenging smallholder systems that dominates African agricultural systems. Such information is of prime importance to improve the quality, extent and resolution of national crop statistics, as well as for research analyzing the causes of yield gaps. While the quality may be questionable, field surveys collecting national crop statistics are regularly conducted in many African countries, including Burkina Faso. Relatively small modifications in such survey protocols to better align with the requirements of calibrating satellite-based crop production estimates could be an efficient investment to improve field data availability in this region.
Data Availability Statement
The datasets generated for this study are available on request to the corresponding author.
Author Contributions
MK, MO, HB, HR, and JB conceived and planned the study. HB, AO, BS, and JS planned and carried out the field data collection. MK took the lead in analyzing the data, interpreting the results, and writing the manuscript. All authors provided critical feedback and helped shape the research, analysis, and manuscript. All authors contributed to the article and approved the submitted version.
Funding
The authors would like to acknowledge the Swedish National Space Board for providing funding for the project “An integrated approach to explore the unknown role of trees in dryland crop production” (Dnr 112/16).
Conflict of Interest
The authors declare that the research was conducted in the absence of any commercial or financial relationships that could be construed as a potential conflict of interest.
Acknowledgments
We thank the Swedish Armed Forces and the Swedish National Space Agency for their help in providing the Pléiades satellite data. We would also like to express our gratitude to the farmers in Saponé for letting us use their fields in this research.
References
Atzberger, C. (2013). Advances in remote sensing of agriculture: context description, existing operational monitoring systems and major information needs. Remote Sens. 5, 949–981. doi: 10.3390/rs5020949
Azzari, G., Jain, M., and Lobell, D. B. (2017). Towards fine resolution global maps of crop yields: testing multiple methods and satellites in three countries. Remote Sens. Environ. 202, 129–141. doi: 10.1016/j.rse.2017.04.014
Bayala, J., Sanou, J., Teklehaimanot, Z., Kalinganire, A., and Ouédraogo, S. J. (2014). Parklands for buffering climate risk and sustaining agricultural production in the Sahel of West Africa. Curr. Opin. Environ. Sustain. 6, 28–34. doi: 10.1016/j.cosust.2013.10.004
Bayala, J., Sanou, J., Teklehaimanot, Z., Ouedraogo, S. J., Kalinganire, A., Coe, R., et al. (2015). Advances in knowledge of processes in soil–tree–crop interactions in parkland systems in the West African Sahel: a review. Agric. Ecosyst. Environ. 205, 25–35. doi: 10.1016/j.agee.2015.02.018
Bayala, J., Teklehaimanot, Z., and Ouedraogo, S. J. (2002). Millet production under pruned tree crowns in a parkland system in Burkina Faso. Agrofor. Syst. 54, 203–214. doi: 10.1023/A:1016058906682
Bazié, H. R., Bayala, J., Zombré, G., Sanou, J., and Ilstedt, U. (2012). Separating competition-related factors limiting crop performance in an agroforestry parkland system in Burkina Faso. Agrofor. Syst. 84, 377–388. doi: 10.1007/s10457-012-9483-y
Bazié, H. R., Sanou, J., Bayala, J., Bargués-Tobella, A., Zombré, G., and Ilstedt, U. (2018). Temporal variations in transpiration of Vitellaria paradoxa in West African agroforestry parklands. Agrofor. Syst. 92, 1673–1686. doi: 10.1007/s10457-017-0115-4
Bégué, A., Arvor, D., Bellon, B., Betbeder, J., De Abelleyra, D., Ferraz, R. P. D., et al. (2018). Remote sensing and cropping practices: a review. Remote Sens. 10:99. doi: 10.3390/rs10010099
Bontemps, S., Arias, M., Cara, C., Dedieu, G., Guzzonato, E., Hagolle, O., et al. (2015). Building a data set over 12 globally distributed sites to support the development of agriculture monitoring applications with sentinel-2. Remote Sens. 7, 16062–16090. doi: 10.3390/rs71215815
Broge, N. H., and Leblanc, E. (2001). Comparing prediction power and stability of broadband and hyperspectral vegetation indices for estimation of green leaf area index and canopy chlorophyll density. Remote Sens. Environ. 76, 156–172. doi: 10.1016/S0034-4257(00)00197-8
Burke, M., and Lobell, D. B. (2017). Satellite-based assessment of yield variation and its determinants in smallholder African systems. Proc. Natl. Acad. Sci. U.S.A. 114, 2189–2194. doi: 10.1073/pnas.1616919114
Carletto, C., Gourlay, S., and Winters, P. (2015a). From guesstimates to GPStimates: land area measurement and implications for agricultural analysis. J. Afr. Econ. 24, 593–628. doi: 10.1093/jae/ejv011
Carletto, C., Jolliffe, D., and Banerjee, R. (2015b). From tragedy to renaissance: improving agricultural data for better policies. J. Dev. Stud. 51, 133–148. doi: 10.1080/00220388.2014.968140
Chivasa, W., Mutanga, O., and Biradar, C. (2017). Application of remote sensing in estimating maize grain yield in heterogeneous African agricultural landscapes: a review. Int. J. Remote Sens. 38, 6816–6845. doi: 10.1080/01431161.2017.1365390
Dash, J., and Curran, P. J. (2004). The MERIS terrestrial chlorophyll index. Int. J. Remote Sens. 25, 5403–5413. doi: 10.1080/0143116042000274015
Defourny, P., Bontemps, S., Bellemans, N., Cara, C., Dedieu, G., Guzzonato, E., et al. (2019). Near real-time agriculture monitoring at national scale at parcel resolution: performance assessment of the Sen2-Agri automated system in various cropping systems around the world. Remote Sens. Environ. 221, 551–568. doi: 10.1016/j.rse.2018.11.007
Duncan, J. M. A., Dash, J., and Atkinson, P. M. (2015). The potential of satellite-observed crop phenology to enhance yield gap assessments in smallholder landscapes. Front. Environ. Sci. 3:56. doi: 10.3389/fenvs.2015.00056
Forkuor, G., Dimobe, K., Serme, I., and Tondoh, J. E. (2018). Landsat-8 vs. sentinel-2: examining the added value of sentinel-2’s red-edge bands to land-use and land-cover mapping in Burkina Faso. GISci. Remote Sens. 55, 331–354. doi: 10.1080/15481603.2017.1370169
Franke, A. C., van den Brand, G. J., Vanlauwe, B., and Giller, K. E. (2018). Sustainable intensification through rotations with grain legumes in Sub-Saharan Africa: a review. Agric. Ecosyst. Environ. 261, 172–185. doi: 10.1016/j.agee.2017.09.029
Gibon, F., Pellarin, T., Román-Cascón, C., Alhassane, A., Traoré, S., Kerr, Y., et al. (2018). Millet yield estimates in the Sahel using satellite derived soil moisture time series. Agric. For. Meteorol. 262, 100–109. doi: 10.1016/j.agrformet.2018.07.001
Gollin, D. (2014). Smallholder Agriculture in Africa – An Overview and Implications for Policy. London: International Institute for Environment and Development.
Hagolle, O., Huc, M., Pascual, D. V., and Dedieu, G. (2010). A multi-temporal method for cloud detection, applied to FORMOSAT-2, VENμS, LANDSAT and SENTINEL-2 images. Remote Sens. Environ. 114, 1747–1755. doi: 10.1016/j.rse.2010.03.002
Hagolle, O., Huc, M., Villa Pascual, D., and Dedieu, G. (2015). A multi-temporal and multi-spectral method to estimate aerosol optical thickness over land, for the atmospheric correction of FormoSat-2, LandSat, VENμS and Sentinel-2 Images. Remote Sens. 7, 2668–2691. doi: 10.3390/rs70302668
Hastie, T., Tibshirani, R., and Friedman, J. (2008). The Elements of Statistical Learning – Data Mining, Inference, and Prediction. New York, NY: Springer.
Huete, A. R., Liu, H. Q., Batchily, K., and van Leeuwen, W. (1997). A comparison of vegetation indices over a global set of TM images for EOS-MODIS. Remote Sens. Environ. 59, 440–451. doi: 10.1016/S0034-4257(96)00112-5
Jin, Z., Azzari, G., Burke, M., Aston, S., and Lobell, B. D. (2017). Mapping smallholder yield heterogeneity at multiple scales in Eastern Africa. Remote Sens. 9:931. doi: 10.3390/rs9090931
Jin, Z., Azzari, G., You, C., Di Tommaso, S., Aston, S., Burke, M., et al. (2019). Smallholder maize area and yield mapping at national scales with Google Earth Engine. Remote Sens. Environ. 228, 115–128. doi: 10.1016/j.rse.2019.04.016
Karlson, M., Ostwald, M., Reese, H., Bazié, H. R., and Tankoano, B. (2016). Assessing the potential of multi-seasonal WorldView-2 imagery for mapping West African agroforestry tree species. Int. J. Appl. Earth Obs. Geoinf. 50, 80–88. doi: 10.1016/j.jag.2016.03.004
Karlson, M., Ostwald, M., Reese, H., Sanou, J., Tankoano, B., and Mattsson, E. (2015). Mapping tree canopy cover and aboveground biomass in Sudano-Sahelian woodlands using Landsat 8 and random forest. Remote Sens. 7, 10017–10041. doi: 10.3390/rs70810017
Karlson, M., Reese, H., and Ostwald, M. (2014). Tree crown mapping in managed woodlands (Parklands) of semi-arid West Africa using WorldView-2 imagery and geographic object based image analysis. Sensors 14, 22643–22669. doi: 10.3390/s141222643
Koussoubé, E., and Nauges, C. (2016). Returns to fertiliser use: does it pay enough? Some new evidence from Sub-Saharan Africa. Eur. Rev. Agric. Econ. 44, 183–210. doi: 10.1093/erae/jbw018
Kulkarni, K. P., Tayade, R., Asekova, S., Song, J. T., Shannon, J. G., and Lee, J.-D. (2018). Harnessing the potential of forage legumes, Alfalfa, Soybean, and Cowpea for sustainable agriculture and global food security. Front. Plant Sci. 9:1314. doi: 10.3389/fpls.2018.01314
Lambert, M.-J., Traoré, P. C. S., Blaes, X., Baret, P., and Defourny, P. (2018). Estimating smallholder crops production at village level from Sentinel-2 time series in Mali’s cotton belt. Remote Sens. Environ. 216, 647–657. doi: 10.1016/j.rse.2018.06.036
Lobell, D. B. (2013). The use of satellite data for crop yield gap analysis. Field Crop Res. 143, 56–64. doi: 10.1016/j.fcr.2012.08.008
Lowder, S. K., Skoet, J., and Raney, T. (2016). The number, size, and distribution of farms, smallholder farms, and family farms worldwide. World Dev. 87, 16–29. doi: 10.1016/j.worlddev.2015.10.041
Maselli, F., Romanelli, S., Bottai, L., and Maracchi, G. (2000). Processing of GAC NDVI data for yield forecasting in the Sahelian region. Int. J. Remote Sens. 21, 3509–3523. doi: 10.1080/014311600750037525
Meroni, M., Fasbender, D., Kayitakire, F., Pini, G., Rembold, F., Urbano, F., et al. (2014a). Early detection of biomass production deficit hot-spots in semi-arid environment using FAPAR time series and a probabilistic approach. Remote Sens. Environ. 142, 57–68. doi: 10.1016/j.rse.2013.11.012
Meroni, M., Rembold, F., Verstraete, M. M., Gommes, R., Schucknecht, A., and Beye, G. (2014b). Investigating the relationship between the inter-annual variability of satellite-derived vegetation phenology and a proxy of biomass production in the Sahel. Remote Sens. 6, 5868–5884. doi: 10.3390/rs6065868
Morton, J. F. (2007). The impact of climate change on smallholder and subsistence agriculture. Proc. Natl. Acad. Sci. U.S.A. 104, 19680–19685. doi: 10.1073/pnas.0701855104
Rasmussen, M. S. (1992). Assessment of millet yields and production in northern Burkina Faso using integrated NDVI from the AVHRR. Int. J. Remote Sens. 13, 3431–3442. doi: 10.1080/01431169208904132
Rembold, F., Atzberger, C., Savin, I., and Rojas, O. (2013). Using low resolution satellite imagery for yield prediction and yield anomaly detection. Remote Sens. 5, 1704–1733. doi: 10.3390/rs5041704
Rockström, J., and de Rouw, A. (1997). Water, nutrients and slope position in on-farm pearl millet cultivation in the Sahel. Plant Soil 195, 311–327. doi: 10.1023/A:1004233303066
Rouse, J. W., Haas, R. H., Schell, J. A., and Deering, D. W. (1974). Monitoring Vegetation Systems in the Great Plains with ERTS. Washington, DC: NASA Special Publication, 309–317.
Roy, D. P., Ju, J., Mbow, C., Frost, P., and Loveland, T. (2010). Accessing free Landsat data via the internet: Africa’s challenge. Remote Sens. Lett. 1, 111–117. doi: 10.1080/01431160903486693
Sanon, M., Hoogenboom, G., Traoré, S. B., Sarr, B., Garcia, A. G. Y., Somé, L., et al. (2014). Photoperiod sensitivity of local millet and sorghum varieties in West Africa. NJAS Wageningen J. Life Sci. 68, 29–39. doi: 10.1016/j.njas.2013.11.004
Sanou, J. (2010). Optimizing the Productivity of Agroforestry Parkland Systems in West Africa using Shade-Tolerant Annual Crops. Ph.D. thesis, University of Wales, Bangor.
Sultan, B., and Gaetani, M. (2016). Agriculture in West Africa in the twenty-first century: climate change and impacts scenarios, and potential for adaptation. Front. Plant Sci. 7:1262. doi: 10.3389/fpls.2016.01262
Sweeney, S., Ruseva, T., Estes, L., and Evans, T. (2015). Mapping cropland in smallholder-dominated savannas: integrating remote sensing techniques and probabilistic modeling. Remote Sens. 7, 15295–15317. doi: 10.3390/rs71115295
Tittonell, P., and Giller, K. E. (2013). When yield gaps are poverty traps: the paradigm of ecological intensification in African smallholder agriculture. Field Crop Res. 143, 76–90. doi: 10.1016/j.fcr.2012.10.007
Tittonell, P., Vanlauwe, B., de Ridder, N., and Giller, K. E. (2007). Heterogeneity of crop productivity and resource use efficiency within smallholder Kenyan farms: soil fertility gradients or management intensity gradients? Agric. Syst. 94, 376–390. doi: 10.1016/j.agsy.2006.10.012
Vancutsem, C., Marinho, E., Kayitakire, F., See, L., and Fritz, S. (2013). Harmonizing and combining existing land cover/land use datasets for cropland area monitoring at the african continental scale. Remote Sens. 5, 19–41. doi: 10.3390/rs5010019
Wolf, J., Ouattara, K., and Supit, I. (2015). Sowing rules for estimating rainfed yield potential of sorghum and maize in Burkina Faso. Agric. For. Meteorol. 214–215, 208–218. doi: 10.1016/j.agrformet.2015.08.262
Keywords: remote sensing, parkland, Sudano-Sahel, intercropping, yield mapping, crop statistics, food security, monitoring
Citation: Karlson M, Ostwald M, Bayala J, Bazié HR, Ouedraogo AS, Soro B, Sanou J and Reese H (2020) The Potential of Sentinel-2 for Crop Production Estimation in a Smallholder Agroforestry Landscape, Burkina Faso. Front. Environ. Sci. 8:85. doi: 10.3389/fenvs.2020.00085
Received: 25 February 2020; Accepted: 26 May 2020;
Published: 18 June 2020.
Edited by:
Xuan Zhu, Monash University, AustraliaReviewed by:
Shuisen Chen, Guangzhou Institute of Geography, ChinaDimitris Poursanidis, Foundation for Research and Technology Hellas, Greece
Copyright © 2020 Karlson, Ostwald, Bayala, Bazié, Ouedraogo, Soro, Sanou and Reese. This is an open-access article distributed under the terms of the Creative Commons Attribution License (CC BY). The use, distribution or reproduction in other forums is permitted, provided the original author(s) and the copyright owner(s) are credited and that the original publication in this journal is cited, in accordance with accepted academic practice. No use, distribution or reproduction is permitted which does not comply with these terms.
*Correspondence: Martin Karlson, martin.karlson@liu.se