A Vegetation and Soil Survey Method for Surveillance Monitoring of Rangeland Environments
 Ben D. Sparrow1,2*
  Jeff N. Foulkes3
  Glenda M. Wardle1,4
  Emrys J. Leitch1,2
  Stefan Caddy-Retalic2,4 Stephen J. van Leeuwen1,5 Andrew Tokmakoff1,2 Nicole Y. Thurgate6
  Greg R. Guerin1,2
  Andrew J. Lowe1,2
- 1The Terrestrial Ecosystem Research Network, Australia
- 2School of Biological Sciences and Environment Institute, University of Adelaide, Adelaide, SA, Australia
- 3Australian Wildlife Conservancy, Subiaco, WA, Australia
- 4Desert Ecology Research Group, School of Life and Environmental Sciences, University of Sydney, Sydney, NSW, Australia
- 5Biodiversity and Conservation Science, Department of Biodiversity, Conservation and Attractions, Kensington, WA, Australia
- 6Centre for Freshwater Ecosystems, La Trobe University, Wodonga, VIC, Australia
Ecosystem surveillance monitoring is critical to managing natural resources and especially so under changing environments. Despite this importance, the design and implementation of monitoring programs across large temporal and spatial scales has been hampered by the lack of appropriately standardized methods and data streams. To address this gap, we outline a surveillance monitoring method based on permanent plots and voucher samples suited to rangeland environments around the world that is repeatable, cost-effective, appropriate for large-scale comparisons, and adaptable to other global biomes. The method provides comprehensive data on vegetation composition and structure along with soil attributes relevant to plant growth, delivered as a combination of modules that can be targeted for different purposes or available resources. Plots are located in a stratified design across vegetation units, landforms, and climates to enhance continental and global comparisons. Changes are investigated through revisits. Vegetation is measured to inform on composition, cover, and structure. Samples of vegetation and soils are collected and tracked by barcode labels and stored long-term for subsequent analysis. Technology is used to enhance the accuracy of field methods, including differential GPS plot locations, instrument-based Leaf Area Index (LAI) measures, and three dimensional photo-panoramas for advanced analysis. A key feature of the method is the use of electronic field data collection to enhance data delivery into a publicly accessible database. Our method is pragmatic, whilst still providing consistent data, information, and samples on key vegetation and soil attributes. The method is operational and has been applied at more than 704 field locations across the Australian rangelands as part of the Ecosystem Surveillance program of the Terrestrial Ecosystem Research Network (TERN). The methodology enables continental analyses and has been tested in communities broadly representative of rangelands globally, with components being applicable to other biomes. Here we also recommend the consultative process and guiding principles that drove the development of this method as an approach for development of the method into other biomes. The consistent, standardized and objective method enables continental, and potentially global analyses than were not previously possible with disparate programs and datasets.
Introduction
Ecosystems support social and economic well-being and require our vigilance as to their condition and management interventions to ensure continued functionality (Magnusson et al., 2013; Andersen et al., 2014). The diversity of ecosystems has contributed to a multitude of methods used to sample their composition, structure, and function. Despite acknowledgment of the need for integrated measurements and evidence-based decision making (Likens, 2010; Eyre et al., 2011; Likens and Lindenmayer, 2011), endorsing a single approach to ecosystem monitoring remains difficult because managers, researchers, policy makers, and funding agencies have diverse applications for the data collected, and may have invested considerable effort and monitoring time in existing methods. This causes an integration problem when bringing together monitoring data across large areas, and is particularly problematic for programs involving extensive, multi-jurisdictional, logistically challenging, and sparsely populated areas, such as rangelands (Bastin et al., 2009; Herrick et al., 2010).
Underpinning these issues is a need to report on environmental change over decadal, or longer, time periods (Allen-Diaz et al., 1996; Likens and Lindenmayer, 2011), and requires monitoring methodologies that are well-described and flexible to deliver on future, unanticipated needs (Burton et al., 2014; Bayne et al., 2015). The challenge is to agree on a method without complete knowledge of the requirements of future monitoring programs, the threats to ecosystems or the opportunities that may emerge via innovation and technology (Spellerberg, 2005; Lindenmayer et al., 2014).
Rangelands occur on all inhabited continents (Figure 1A) with the predominant land-use being low-intensity or nomadic livestock grazing on native pastures (Linstadter and Baumann, 2013). In Australia, variable rainfall is perhaps the major ecological driver of spatial patterns (Stafford Smith and McAllister, 2008), with the influence of variability particularly evident in arid areas (van Etten, 2009; Dickman and Wardle, 2012). Rangelands represent 46% of terrestrial ecosystems globally and 81% in Australia (Figure 1B), but remain relatively poorly studied (Sparrow et al., 2014). Understanding broad scale change in rangelands remains difficult due to a lack of monitoring and decadal ecosystem dynamics (White I. A. et al., 2012).
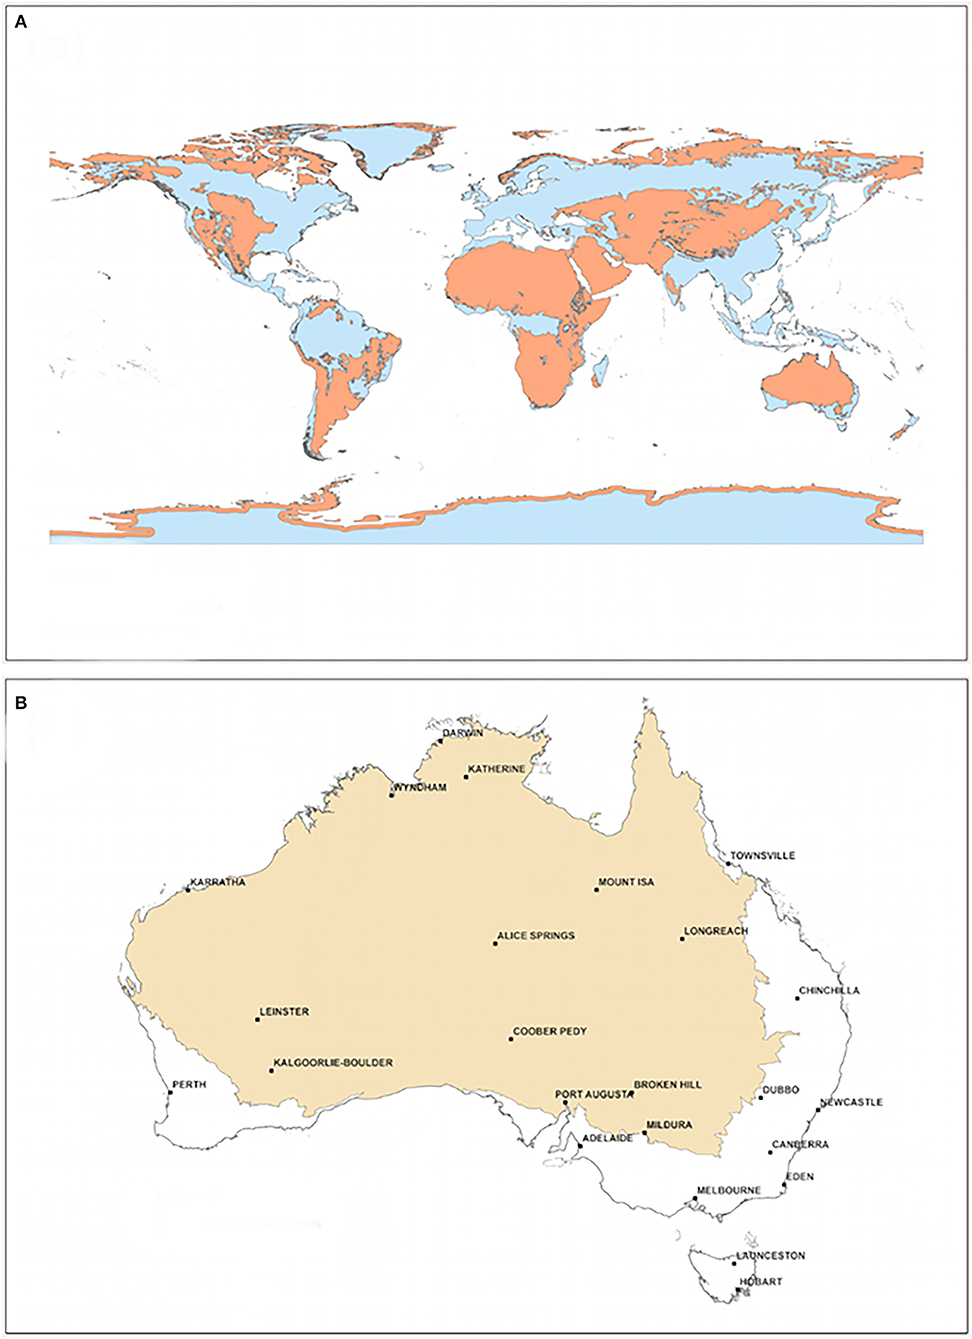
Figure 1. Extent of rangelands: (A) globally and (B) within Australia (White I. A. et al., 2012).
Here we present an overview and rationale of a cohesive and robust ecosystem surveillance method that builds on previous techniques, both in Australia (Watson et al., 2007; Bastin et al., 2009) and internationally (Nusser and Goebel, 1997; Herrick et al., 2010; Toevs et al., 2011; Taylor et al., 2014; Oliva et al., 2019), for characterizing and monitoring rangeland ecosystems. Specific protocols are described in detail in the AusPlots field manual included in Supplementary Material S5, as that material is too extensive to publish within the length of a standard publication (White A. et al., 2012). The method is operational and has been implemented at over 704 sites across Australia (see Box 1 in Supplementary Material S3), producing publicly available data for ecological studies of Australian rangelands (Guerin et al., 2016b; TERN, 2019). While the primary purpose of the program is to detect changes over large scales of space and over long periods of time, it also provides readily available resources to answer pressing current questions. For example, this method incorporates data collection (Tokmakoff et al., 2016) to address key long-standing questions for rangeland ecosystems (Morton et al., 2011), including understanding the role of soil and plant traits on productivity (Bastin et al., 2017a; Gallagher et al., 2020). The combination of vegetation data and samples can be used to extract trait data or genomic data to anticipate responses to environmental stressors across large gradients (Westoby et al., 2002; Wright et al., 2004; Guerin et al., 2012; Caddy-Retalic et al., 2017). Similarly, the soil and plant samples, along with the vegetation data, provide an open-access resource to assess emerging priorities such as understanding the multi-functionality of ecosystems, and especially of drylands (Maestre et al., 2012).
Challenges to Broad Scale Monitoring Approaches
Surveillance monitoring is defined as broad in scope, involving measurements of many attributes and species across a spatially and temporally wide-ranging network of field locations, placing it between landscape, and targeted field monitoring in detail and spatial extent (Eyre et al., 2011; Sparrow et al., 2019a). Challenges to the design and implementation of surveillance monitoring programs stem from practical and scientific considerations (Lindenmayer et al., 2014), as well as from the imperative for monitoring. Firstly, it is necessary to identify knowledge gaps, such as in the geographic extent or type of data available (Sparrow et al., 2014), or the questions arising from environmental or societal changes (Sutherland et al., 2015). The large and remote nature and the difficulty in accessing these rangelands (Dickman et al., 2014; Sparrow et al., 2014, 2019b) also provides a significant challenge for these operational programs. Secondly, practical constraints must be factored into monitoring protocols. Given the high cost of travel and data acquisition, surveillance monitoring methods need to maximize benefits from each visit, necessitating an efficient and integrated workflow from data collection to delivery of new knowledge (Tokmakoff et al., 2016). The level of information collected using this method was determined by widespread consensus of researchers, government scientists, and land managers from across the country at a series of workshops and subsequent feedback (see Supplementary Material S2). The time taken to collect information at each plot is detailed in Table 1.
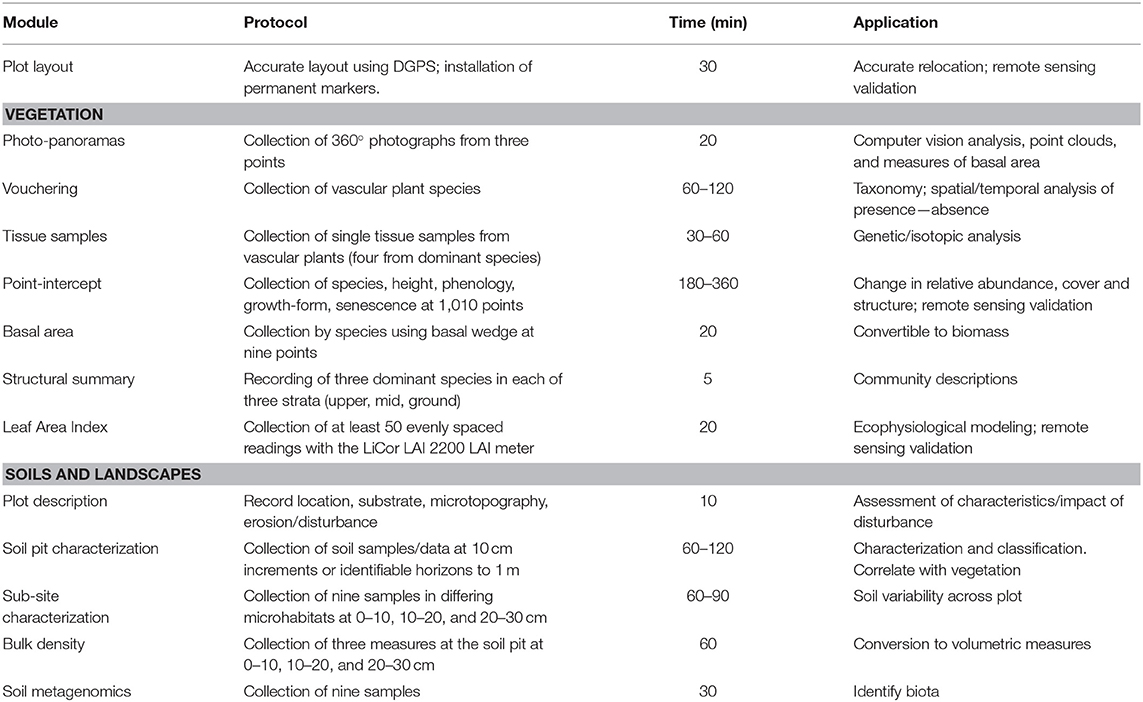
Table 1. Modules in the AusPlots rangelands monitoring method.
The adoption of new monitoring programs, or integration of existing ones, can be hampered by poor communication of goals. A well-designed method may fail because practitioners are resistant to change or have divergent goals or cultural expectations (Ens et al., 2014). Widespread consultation and involvement is therefore key to successful engagement (see Box 2 in Supplementary Material S4). A challenge for these programs is to prioritize time for adequate engagement in the design and evaluation of methods in an environment with pressure to provide rapid results. New technologies and innovations should be considered for inclusion in situations where they provide increased accuracy or efficiencies over traditional techniques.
A key motivation for developing a new rangeland monitoring method in Australia was to overcome the lack of compatibility between existing jurisdictional data collection methodologies (Foulkes et al., 2014; Sparrow et al., 2019b). Global efforts to monitor terrestrial ecosystems (Bastin et al., 2017a) need to build upon regional and local data collection and ideally include a set of essential environmental variables to provide a common modeling framework and scalable data to build a cohesive global synthesis (Schmeller et al., 2015).
Method Overview and Rationale
Pragmatic Site Selection
A site selection protocol for surveillance monitoring of rangelands needs to be scientifically robust but also practical. Consideration needs to be made for site access, both at the time of initial survey, but also for continued access for repeat measures. We implement a two stage stratification procedure where we; (1) choose a bioregion to sample within (an Australian wide landscape classification similar to ecoregions sensu (Olson et al., 2001), Supplementary Material S1, and; (2) determine where within the bioregion to establish plots.
Given the biophysical and anthropogenic context, we use three strategies to determine bioregions within which to sample. (1) Stratified sampling to cover biophysical and disturbance gradients. (2) Setting a minimum number of plots per representative bioregion or vegetation type. (3) Additional sites identified via gap analysis. Strategies one and two were investigated (Guerin et al., 2020) and were shown to perform well against a range of statistically focused techniques as well as several spatially even sampling strategies. Strategy three currently uses Generalized Dissimilarity Modeling (GDM) to identify areas where gap filling plots should be established. Initial results from gap filling plots indicates that this is an effective technique, resulting in an increase in environmental space covered by the plot network. Scatterplots of relevant variables can also reveal poorly sampled regions in environmental space (Guerin et al., 2017a, 2020), while ecologically scaled measures of environmental uniqueness can be mapped over poorly sampled areas to identify priority habitats (Arponen et al., 2008; Guerin et al., 2020).
Once target bioregions have been identified, a more detailed process is undertaken at finer spatial scales. Within stratified units, plot locations can be randomized where practical to maximize representativeness and statistical rigor (Michalcová et al., 2011), whereas random sampling without stratification across large areas results in under-represented habitats (Michalcová et al., 2011). Plots can, and regularly are, co-located with those established by third parties (see Table 2) or legacy projects to extract value and enhance temporal depth. Political information is often relevant, including policy drivers influencing jurisdictions and opportunities for co-investment. Some land managers see standardized surveillance monitoring as an opportunity to capture robust information on the assets they manage and are receptive to co-investment.
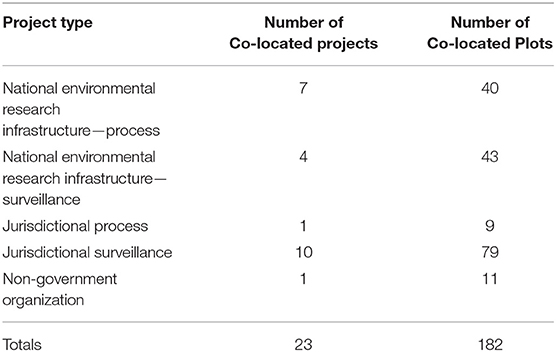
Table 2. Co-location of sites with other projects.
Whether driven by stratification, gap-filling or policy needs, it is essential that site selection accounts for logistical considerations such as access permissions and feasibility, to make the program achievable and increase likelihood that sites will be re-sampled.
Plot Size and Layout
The choice of plot size is guided by the need to optimize the balance of survey resources and scientific rigor. While representativeness and robustness to small-scale variation increase with plot size (assuming vegetation within is homogenous), so does the expense of data collection, equating to fewer plots for fixed resources. Large, single, 50 ha plots have become standard for the study of demographic dynamics in rainforest biomes (Harms et al., 2001), 1 ha plots are used for other woody ecosystems (Phillips et al., 2009; Miehe et al., 2010), whereas grasslands are typically surveyed in smaller 1 m2 plots (Borer et al., 2014).
Given the vastness and heterogeneity of rangelands, there is a need for many plots and therefore one-hectare plots were chosen for this method. Additional reasons for this choice included: (1) The potential to capture species vital rates and vegetation processes (mortality, recruitment, fire, grazing, and drought responses) whilst maintaining a practical sampling size; (2) the benefit of consistent results and reduced coefficients of variation in basal area, crown area, and vegetative structure between plots (Clark and Clark, 2000)—capturing small-scale patchiness whilst providing representativeness overall; (3) Enhanced integration with other activities that use 1 ha plots (Phillips et al., 2009; Jurgens et al., 2012; Wood S. W. et al., 2015; Karan et al., 2016), and (4) to provide information at an appropriate scale for validation of medium and high resolution remotely sensed products (Congalton and Green, 2008).
The monitoring plots are established with Differential Global Positioning System (DGPS) technology, to locate and record the coordinates of plot and transect vertices (Figure 2A) with sub-meter accuracy and metal poles located at the corners and center to aid in relocation for repeated monitoring. Each plot is located entirely within a relatively homogeneous (at the 1 ha scale) area of a particular vegetation community, and is intended to be representative of that vegetation community.
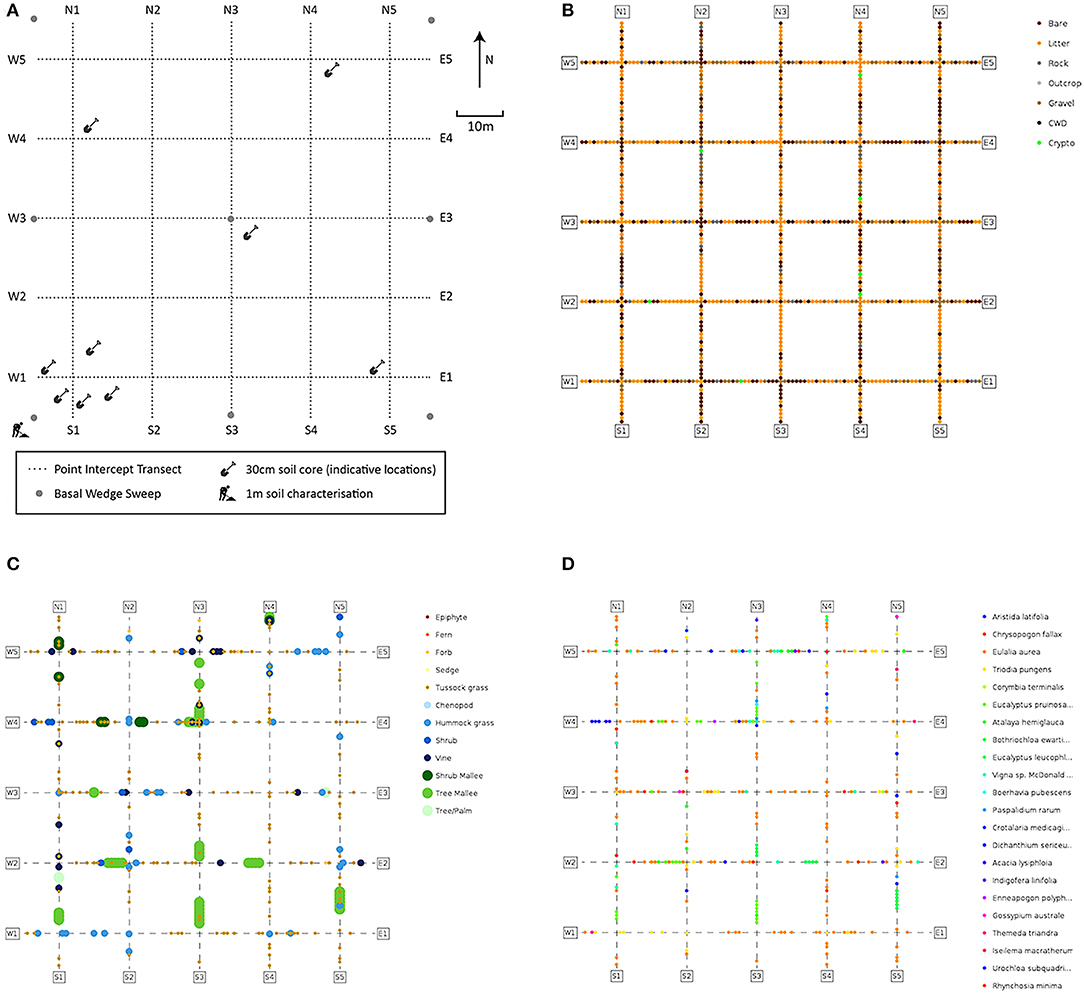
Figure 2. Monitoring plot schemas and examples of information recorded in the point-intercept module. (A) Plot layout and locations of soil sampling, basal wedge sweeps and point-intercept transects; (B–D) point-intercept data on: (B) substrate; (C) growth-forms; (D) species (White A. et al., 2012).
Plots are co-located with existing sites where possible. These sites have been established for a variety of reasons (see Table 2), and co-locating with these sites enables data from both programs to be combined or correlated, enabling greater temporal depth, richer contextual information, and often co-investment in site establishment.
Floristics and Vegetation
Plant cover and species composition are key essential variables (Pereira et al., 2013) for any ecological surveillance monitoring program and are core modules in our method. Careful consideration was given to ensuring adequate sampling effort, confirmation of species names by taxonomists, and flexible methods to record both quantitative estimates of abundance for commonly occurring and locally abundant species and occurrences of less abundant species within the plot. To achieve this, several techniques were combined. All vascular plant species observed within the plot are sampled and recorded, with identifications confirmed later by herbarium botanists. These samples are then stored indefinitely enabling taxonomic change to be updated throughout the collection and database. Vegetation is also characterized quantitatively by cover, composition, growth-form, and height. For this, a line point-intercept method is used across 10 × 100 m transects in a grid (Figure 2A). This configuration ameliorates the skewing effects that site heterogeneity may have on cover, which are difficult to avoid in rangelands (Vetter, 2005). Data collected using this configuration are less sensitive to local heterogeneity or micro-patterning of the vegetation.
Many authors recommend the collection of a minimum of 1,000 intercepts in rangelands to quantify cover per species (Lodge and Gleeson, 1976; Holm et al., 1984; Friedel and Shaw, 1987; Vittoz and Guisan, 2007). Following this research, our method utilizes 1010 point intercepts along transects to determine vegetation cover per species across the plot. Abundance and presence/absence data are obtained by combining the identified sample data with the point-intercept data, with rarer species not intercepted being scored as present but not assigned a cover score. Each intercept is also attributed with information assessing plant height (used to reconstruct vegetation structure and as a surrogate for recruitment of woody species) and whether the vegetation intercepted is dead or senescent, to indicate mortality. Mass recruitment/mortality events are also recorded. Height profiles can be created and their changes through time analyzed to indicate changes in vegetation community structure or to assign strata.
Accurate measures of vegetation cover are important for tracking environmental change, and have many applications (Vittoz and Guisan, 2007). Cover can be summarized to family, genus, species, growth-form levels, or as fractional cover—the fraction of photosynthetically active vegetation, dead vegetation, and bare substrate. Relative cover-abundance can be used in downstream analysis, or to classify vegetation, for example into structural classes such as forest or shrubland based on height and cover of growth-forms. Change in vegetation structure (Figure 2C) or composition can be quantified, for example to detect woody weed encroachment. Raw data can be converted to common cover measures (e.g., opaque canopy cover or projected foliage cover), or summarized by the highest intercepted plant at each point. The location of each point-intercept is recorded (Figure 2), allowing detailed spatial patterning to be investigated as an alternative to gross plot-wide metrics.
Basal area is measured at each plot using a basal wedge sweep, to inform the amount of stored above ground biomass based on allometric equations (Eamus et al., 2000). Basal area is averaged across the plot, while raw tree stem counts are also recorded. A structural summary is also collected, identifying the most dominant species in each of the Ground, Mid-layer and Upper strata following the procedure described in Thackway et al. (2008). This enables the vegetation to be described at the level of an “Association,” equivalent to a Level 5 structural description in the Australian National Vegetation Information System (applicable to all vegetation types), with cover and height information being calculated from the point intercept data.
Photo-Points
Photo-points have long been used for monitoring (Watson and Novelly, 2004) and inventory programs (Brandle et al., 2005). In keeping with this tradition, photo-points are created with a new method in which panoramas (a continuous 360-degree sweep of static digital photographs with at least 50% overlap between frames) are collected at three points (Figures 3A–C). These photographs are comparable with historical photographs, and can be analyzed using computer vision techniques to determine basal area (White A. et al., 2012). It is anticipated that other structural metrics will be able to be extracted from these photosets in future.
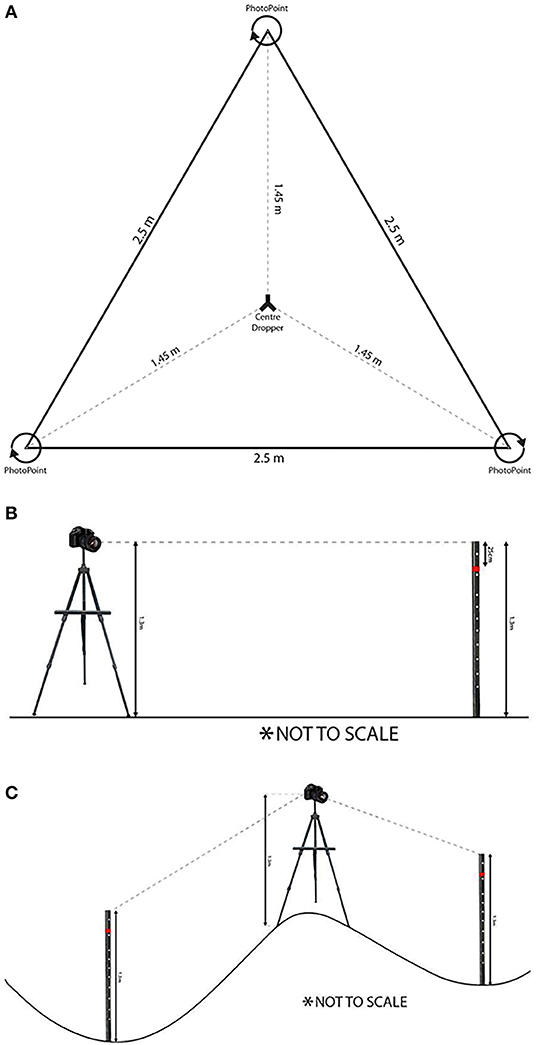
Figure 3. Photo-point panoramas. (A) Configuration: three photo-points are established in an equilateral triangle with 2.5 m sides around the plot center. Photographs are taken in a 360° panorama; (B) Height setup: central dropper and mounted camera lens at 1.3 m; (C) Dealing with topography (White A. et al., 2012).
Soils
The soil protocol quantifies variability within and between plots and over time using a pre-defined standard (National Committee on Soil and Terrain, 2009). This field protocol is undertaken at the same time as the vegetation modules to enable vegetation analyses to consider contemporaneous soil characteristics.
A plot description records erosion, micro-relief, landform pattern and element, drainage, disturbance, and soil surface condition. Four further modules are collected: soil profile pit; bulk density; soil sub-sites; and metagenomic samples. A 1 m deep pit in the southwest corner of the plot (Figure 2A) enables description and photographic recording of the upper soil profile and measurement of pH, electric conductivity, texture, color, and structure (White A. et al., 2012). Soils can then be categorized using a standard such as the Australian Soil Classification (ASC) system (Isbell and Terrain, 2016). Bulk density is measured at three depths of the pit to enable conversion of soil properties to volumetric measures (Table 1). Soil sub-sites are collected at nine locations across the plot, targeting variability in microhabitat, to collect the same information as at the soil profile pit to a depth of 30 cm and analyze small-scale variability (Figure 2A). Soil samples taken specifically to enable metagenomic analysis of environmental DNA (e.g., targeting soil biota in various phyla or traces of above-ground flora and fauna) are collected from the surface at each sub-pit and stored on silica granules. Soil samples are air dried and retained for further analysis and access by researchers (Grundy et al., 2015).
Samples for Re-Use
Many monitoring methods that record species and taxonomic determination rely on botanists who can identify specimens in the field and vouchers may only be collected for obtuse species or records of interest (Hosking et al., 2000). Field identifications are prone to error (Scott and Hallam, 2003; Lacerda and Nimmo, 2010) and the requirement for taxonomic expertise can inhibit delivery of plots. To address this issue, the method mandates the collection of herbarium vouchers for all vascular plant species observed, which are tracked using barcode labels. In addition to ensuring consistent identification, barcoded voucher specimens are a resource for ongoing research. Vouchers can resolve taxonomic issues, including the discovery of new taxa, updating species ranges (Hosking et al., 2000), and support studies of ecophysiology and occupancy across space and time (Guerin et al., 2012).
Additional plant tissue is collected from each species and stored in synthetic gauze bags with a barcode linked to the voucher specimen. These bags are used to avoid contamination from foreign plants (e.g., cotton). The bags are rapidly dried on silica granules, ensuring they can be used for genetic or isotopic analysis.
Soil samples (~500 g) are taken from each 10 cm depth from the soil profile pit and sub-sites, and these are barcode-labeled, air dried, and archived in a dedicated facility.
Validating Remotely Sensed Products
To enhance application of collected data to the validation of remotely sensed products, plots are marked out with sub-meter DGPS for spatial accuracy and where possible aligned to a locally accepted map grid (e.g., Map Grid of Australia). This enables the plot to be accurately matched to pixels from remotely sensed imagery. Locating plots in homogeneous areas increases the likelihood that the entire plot falls within a single remote sensing-derived mapping unit.
Cover information validates products from mid-resolution satellite imagery. Our point-intercepts are able to be converted to either opaque canopy cover or foliage projected cover, making the data useful for both ecological and imagery validation purposes. Because cover can be summarized at different levels, from species to fractional cover (Scarth et al., 2015), multiple applications are possible, for example validation of tree cover interpretation from imagery (Bastin et al., 2017a).
The LAI2200 instrument (LiCor, Nebraska, USA) is used to collect and calculate Leaf Area Index (LAI) data. This information can be used to validate international LAI products (Schaefer et al., 2015), and to assist with the calibration between LAI and foliage projected cover derived from remotely sensed products.
Structural information collected, including basal area determined using the basal wedge and photo-points, along with growth-form and vegetation height data from point-intercepts, is useful for validating satellite, airborne, and terrestrial LIDAR systems.
Data Availability
Data from the program are collected directly on an Android tablet and sent to a database when the field officers have mobile phone coverage (Tokmakoff et al., 2016). Data are subsequently combined with confirmed species identifications received after samples have been submitted to a relevant herbarium, and the combined dataset is curated in preparation for publication. As sites are finalized, they are identified as ready to publish and pushed to TERN's AEKOS data delivery portal. During this process, the location of threatened or highly collectable species is de-natured (Lowe et al., 2017). The data are then made freely available on the web portal for discovery, download and re-use (Turner et al., 2017) using a Creative Commons (CC BY 4.0) by attribution license, or via the R package ausplotsR (Guerin et al., 2019c).
Discussion of Methodology and Applications
The standardized, quantitative surveillance monitoring method and innovative workflow we outline can be employed across jurisdictional borders, allowing the measurement of diverse environments at continental and global scales to answer questions that would be difficult to address using disparate datasets. Streamlined data collection and management ensure rapid delivery to end-users and help minimize error (Box 1 in Supplementary Material S3). The archiving of samples means that data and results can be verified downstream, allowing resilience to nomenclatural change and innovative future re-use of samples, for example bio-discovery (Lemetre et al., 2017).
Our approach is multi-disciplinary, collecting data relevant at multiple levels of ecological analysis from population genetics to remote sensing. By collecting these measures at the same plot using consistent methods, interactions among patch-level variables can be investigated.
The photo-points module is innovative in allowing traditional photo-point based change analysis whilst enabling three-dimensional computer vision analysis. Technology is also embraced in the collection of LAI data, using a DGPS to mark out plots and the use of a purpose data collection app to robustly collect data and minimize data transcription and collection inaccuracies [described in detail in (Tokmakoff et al., 2016)]. Our electronic workflow and data management processes from the point of data collection to data publication (Tokmakoff et al., 2016) also provides increased accuracy and efficiency over traditional methods.
Infrastructure Stimulating Ecological Research
The methods described in this paper have enabled a great many studies (see Table 3) in a wide variety of disciplines. Having said that the monitoring program is still young, with the majority of sites having only been visited once (see Table 4). Over the past few years site re-visits have commenced concurrently with strategic gap filling, with re-visits anticipated to become more prevalent in the coming years. Whilst use of our method and data from it has been widespread we anticipate much greater uptake in future years as the network matures and increases it's spatial and temporal depth of information. There are a wide variety of ways the data can be used with a few specific examples provided below.
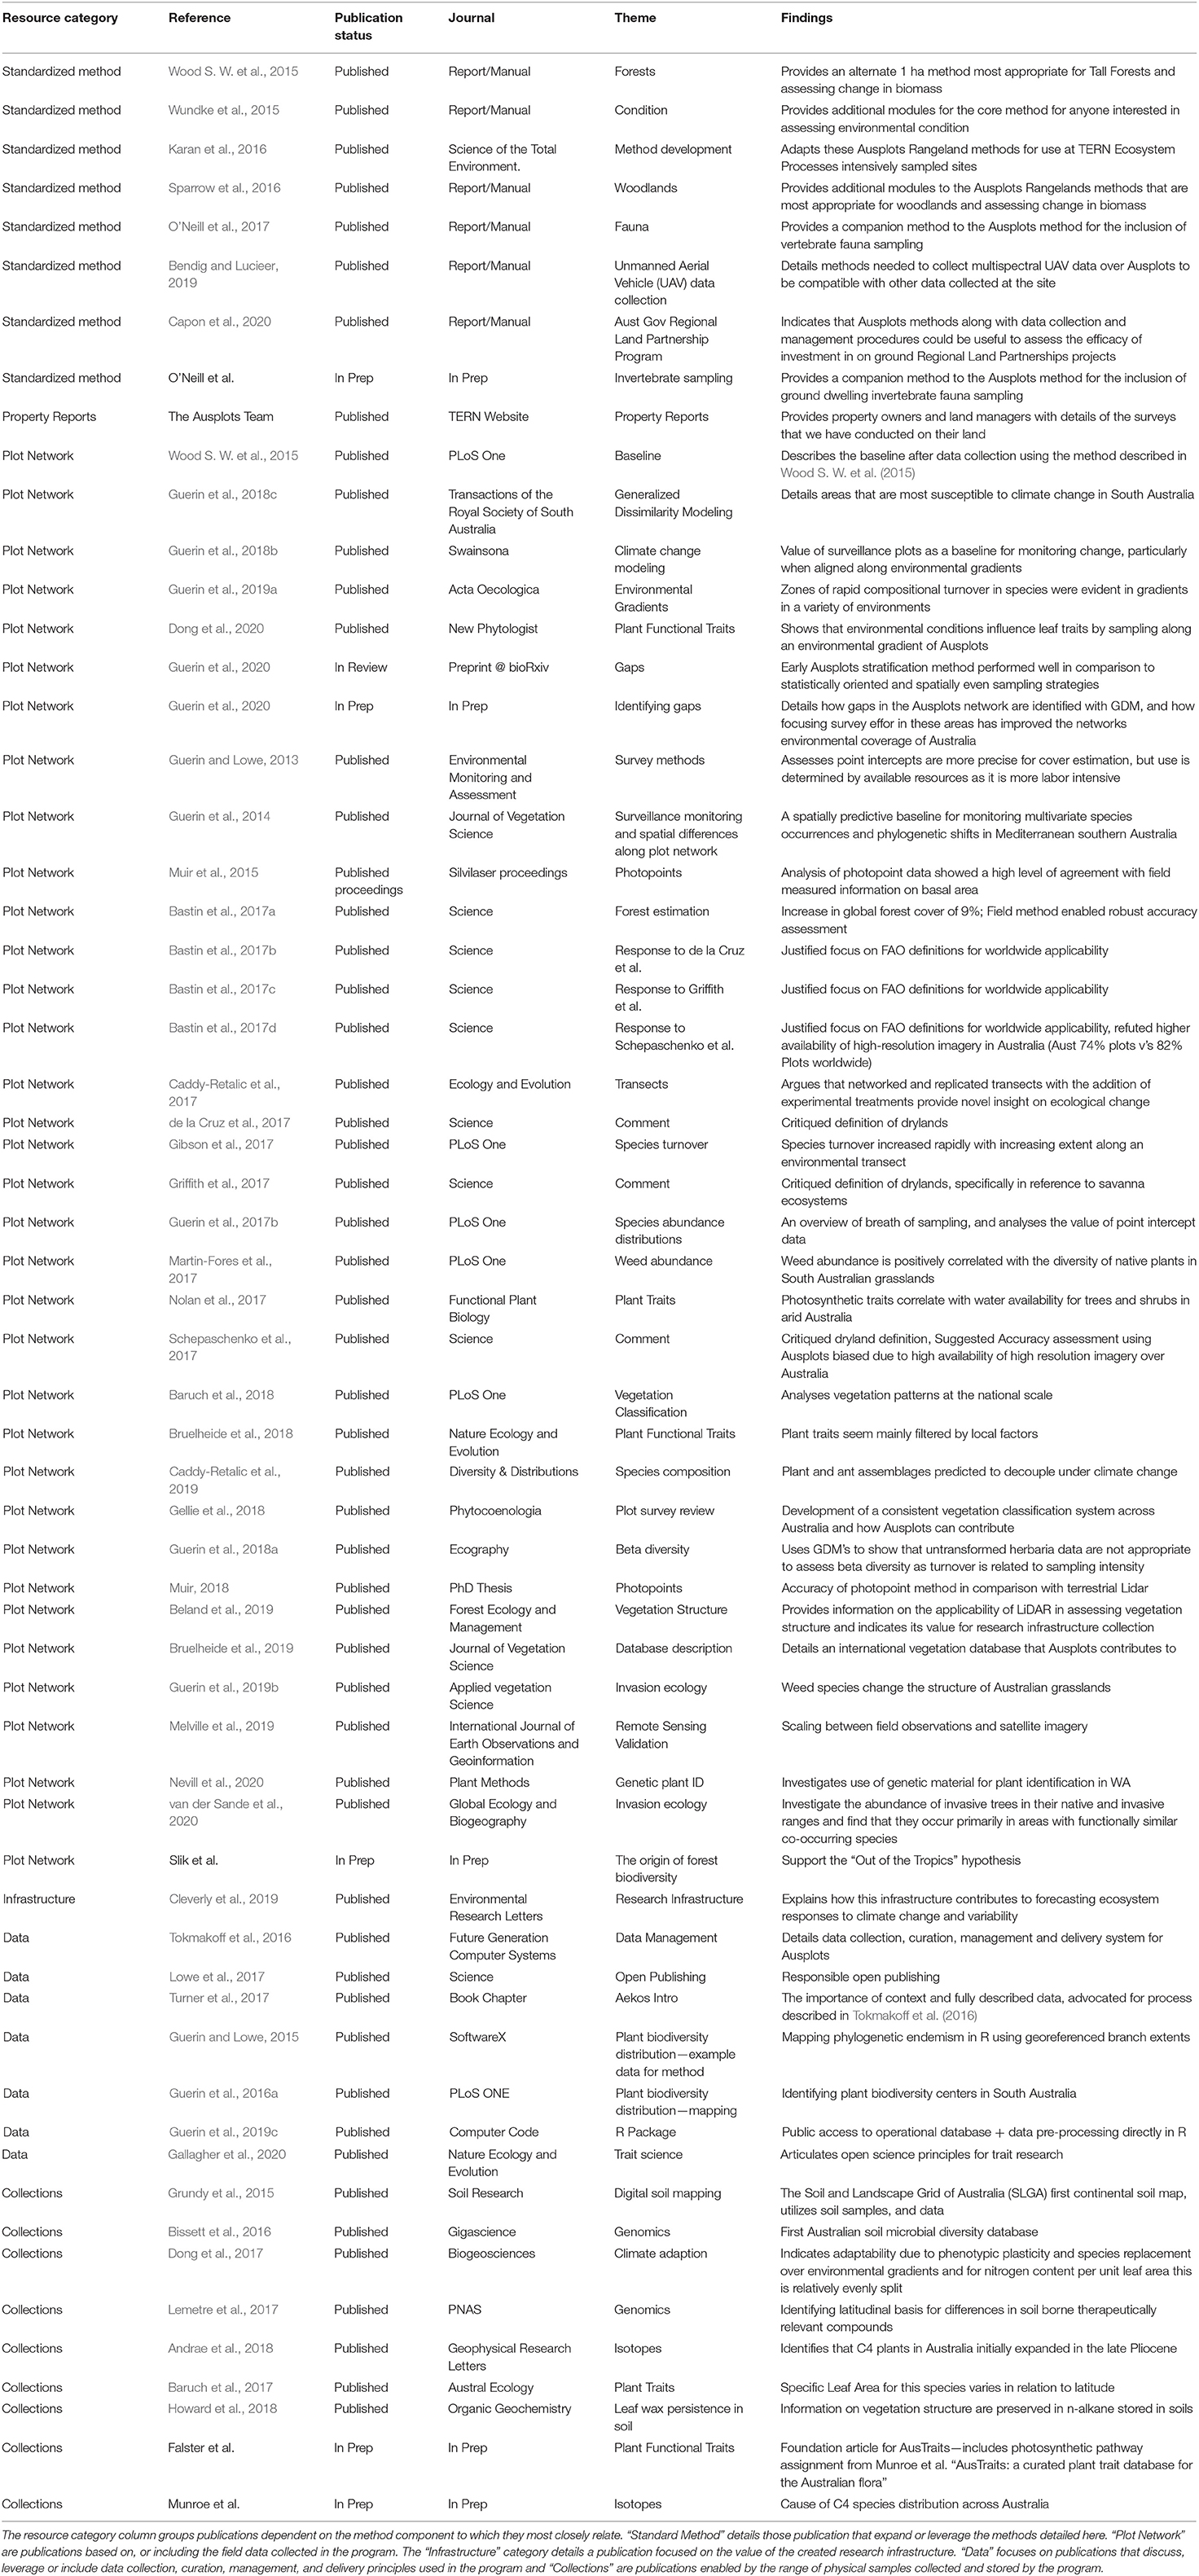
Table 3. Some examples of publications enabled by data obtained using the method.
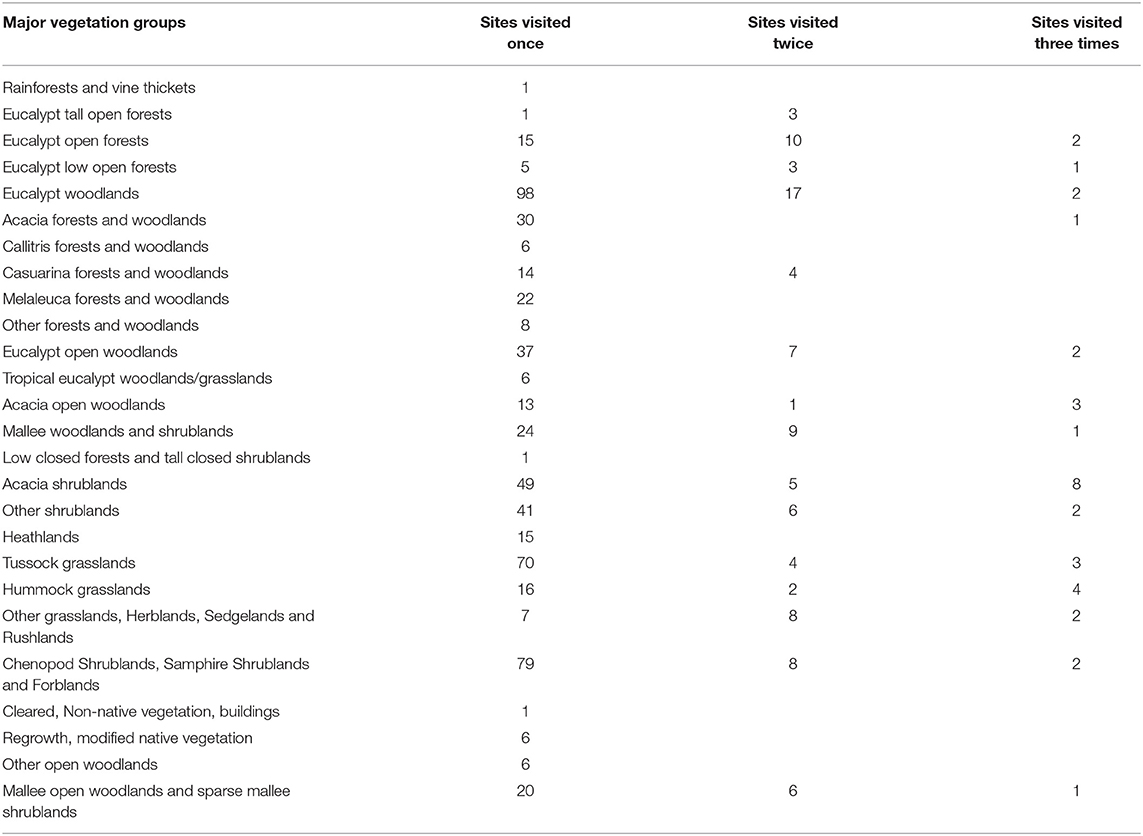
Table 4. Sites collected using the method in the TERN Ecosystem Surveillance program, quantified by the Major Vegetation group in which they occur, along with information on the number of sites revisited.
Leaf Samples
Genomic sequencing technologies now provide cost-effective information on species identification (DNA barcoding) and population genetic structure that allows rapid species identification, the detection of cryptic species and identification of regions of high genetic diversity, all of which are useful in a conservation context. The archiving of plant tissue samples ensures material will be available even if the populations do not persist. Access to samples facilitates work by independent researchers that may otherwise be impeded by the cost of sample collection from remote locations. Leaf samples have been incorporated in a number of studies (Christmas et al., 2017). Leaf samples are also available for isotope analysis and the study of leaf chemical components such as the study of Dong et al. (2017) where these samples were used to demonstrate that Leaf Mass per unit area increases with aridity.
Soils
Investigation of soils has typically focused on agrarian zones, meaning soil characteristics for rangelands have largely been interpolated from sparse data, with this being particularly so in Australia. In addition to basic characterization, the method archives soils for future analysis (e.g., DNA metabarcoding and chemical analyses). Soil surface samples are collected, from which biological activity can be quantified and related to soil parameters. These samples facilitate research on soil–vegetation interactions, typically conducted in local research projects. For example (Lemetre et al., 2017), analyzed these soil samples and reported that turnover in bacterial biosynthetic composition followed a latitudinal pattern but did not appear to be driven by changes in major vegetation type, a finding that directs approaches to future sampling of soils for natural product discovery.
Floristics and Vegetation
Vegetation data collection has been designed for multiple purposes. For example, standard community ecology analytics such as ordination of vegetation and environmental variables can provide insight into spatial patterning of species composition (Figure 2D) and its drivers. The data also enable tracking of composition and cover dynamics with high reliability, enabling practical outcomes like reporting on responses to disturbance or grazing impacts. The collection techniques also provide a useful inventory, providing information on distribution and abundance of species, with management applications such as providing information on the distribution and abundance of problematic woody weed species.
The analysis opportunities for vegetation data from this program have been identified in more detail in Guerin et al. (2017a), including assessment of cover and species dominance analysis. The future opportunities enabled by the multi-disciplinary method described here are also articulated. Vegetation classification studies have also been conducted using the dataset (Baruch et al., 2018).
Validating Remote Sensing Products
The method provides information useful for validating remotely sensed image products at multiple scales, such as vegetation and soil products derived from mid-resolution satellite imagery. By recording the shortest distance to another vegetation type, plots can represent a bigger spatial footprint and be useful for validating lower spatial, but higher temporal, resolution imagery. The data have further potential to validate high-resolution spatial and spectral image products, as well as radar and LIDAR imagery.
Growth-form and cover data from this method were compared by Bastin et al. (2017a) to values obtained from visual estimates of very high resolution imagery over the same sites. This information was then used to quantify observer estimate errors and errors between different observers for this study that quantified the amount of forest occurring in dryland biomes globally. Bastin et al. identified that previous estimates of dryland forest cover were between 40 and 47% lower than their study indicates, leading to an increase of around 9% to estimates of forest cover globally compared to previous knowledge.
Sampling Other Environments
Whist the program was initiated in Australia's rangelands it has been implemented successfully in a wide variety of structurally diverse vegetation types throughout the country (Table 4), broadly representative of a variety of rangeland vegetation types globally. Rainforests and Tall Eucalypt Forests provide some challenges to the point intercept modules and prompted the development of forest specific protocols (Wood S. et al., 2015). Additional optional modules have been developed for woodlands where researchers intend to track tree growth through time (Sparrow et al., 2016).
Conclusion
We present a surveillance monitoring method for rangeland ecosystems developed in Australia but applicable to global context. The method is now implemented as part of the surveillance monitoring program of TERN, under the guiding principles of widespread consultation, continual adaptation and coverage of variables/attributes relevant to multiple disciplines, to meet the needs of a diverse ecosystem science community (Pereira et al., 2013). The method is standardized, quantitative and modular, providing robust baselines and clear protocols for sample and data management. The method embraces new technologies such as a novel photopoint method and robust electronic data collection using a field app alongside more traditional techniques. Sample archiving ensures continued utility of collected data and enables subsequent analysis. A streamlined and accurate dataflow enables rapid open access data provision. The method has had proven application to analyze rangelands systems globally (Bastin et al., 2017a), and many components are suitable for other environments. In future, we anticipate adding additional variables on other environmental parameters including fauna sampling, for which protocols have been prepared and are undergoing consultation, to be implemented as resources permit.
Author Contributions
BS, JF, and AL developed the concept. BS, JF, EL, GW, SC-R, GG, and SL contributed to field testing. BS, JF, EL, GW, SL, AT, and AL contributed to method development. BS, JF, NT, and AL contributed to obtaining funding. BS and JF drafted the manuscript. All authors contributed to method critique, sections of text for the manuscript and contributed critically to the drafts and gave approval for publication.
Funding
This work was supported by the Australian Government's National Collaborative Research Infrastructure Strategy (NCRIS) and Super Science Initiative through the Terrestrial Ecosystem Research Network (TERN), and the University of Adelaide. It was also supported by an Australian Government Research Training Program (RTP) Scholarship.
Conflict of Interest
The authors declare that the research was conducted in the absence of any commercial or financial relationships that could be construed as a potential conflict of interest.
Acknowledgments
We would like to thank Andrew White for his contribution to the beginnings of this program. We would also thank contributors to workshops and method development (identified in Supplementary Material S2). The Ecosystem Surveillance program (formerly Ausplots) was supported by the Australian Government through the Terrestrial Ecosystem Research Network (TERN) and the National Collaborative Research Infrastructure Strategy (NCRIS) and Super Science Initiative. We also thank Nick Gellie for his contribution to Table 3 and thank the TERN Ecosystem Surveillance team both past and present that have helped make this program a reality through years of hard work.
Supplementary Material
The Supplementary Material for this article can be found online at: https://www.frontiersin.org/articles/10.3389/fevo.2020.00157/full#supplementary-material
References
Allen-Diaz, B., Chapin, F. S., Diaz, S., Howden, M., Puigdefabregas, J., and Stafford-Smith, M. (1996). “Rangelands in a changing climate: impacts, adaptations and Mitigation,” in Climate Change 1995 - Impacts, Adaptation and Mitigation, eds W. T. Watson, M. C. Zinyowere, R. H. Moss and D. J. Dokken (New York, NY: Cambridge University Press), 133–158.
Andersen, A., Beringer, J., Bull, C. M., Byrne, M., Cleugh, H., Christensen, R., et al. (2014). Foundations for the future: a long-term plan for Australian ecosystem science. Austral. Ecol. 39, 739–748. doi: 10.1111/aec.12188
Andrae, J. W., McInerney, F. A., Polissar, P. J., Sniderman, J. M. K., Howard, S., Hall, P. A., et al. (2018). Initial expansion of C4 vegetation in Australia during the late pliocene. Geophys. Res. Lett. 45, 4831–4840. doi: 10.1029/2018GL077833
Arponen, A., Moilanen, A., and Ferrier, S. (2008). A successful community-level strategy for conservation prioritization. J. Appl. Ecol. 45, 1436–1445. doi: 10.1111/j.1365-2664.2008.01513.x
Baruch, Z., Caddy-Retalic, S., Guerin, G. R., Sparrow, B., Leitch, E., Tokmakoff, A., et al. (2018). Floristic and structural assessment of Australian rangeland vegetation with standardized plot-based surveys. PLoS ONE 13:e0202073. doi: 10.1371/journal.pone.0202073
Baruch, Z., Christmas, M. J., Breed, M. F., Guerin, G. R., Caddy-Retalic, S., McDonald, J., et al. (2017). Leaf trait associations with environmental variation in the wide-ranging shrub Dodonaea viscosa subsp. angustissima (Sapindaceae). Austral. Ecol. 42, 553–561. doi: 10.1111/aec.12474
Bastin, G. N., Stafford-Smith, D. M., Watson, I. W., and Fisher, A. (2009). The Australian collaborative rangelands information system: preparing for a climate of change. Rangeland. J. 31, 111–125. doi: 10.1071/RJ08072
Bastin, J. F., Berrahmouni, N., Grainger, A., Maniatis, D., Mollicone, D., Moore, R., et al. (2017a). The extent of forest in dryland biomes. Science 356, 635–638. doi: 10.1126/science.aam6527
Bastin, J. F., Mollicone, D., Grainger, A., Sparrow, B., Picard, N., Lowe, A., et al. (2017b). Response to comment on “The extent of forest in dryland biomes”. Science 358:eaao2077. doi: 10.1126/science.aao2077
Bastin, J. F., Mollicone, D., Grainger, A., Sparrow, B., Picard, N., Lowe, A., et al. (2017c). Response to comment on “The extent of forest in dryland biomes”. Science 358:881. doi: 10.1126/science.aao2079
Bastin, J. F., Mollicone, D., Grainger, A., Sparrow, B., Picard, N., Lowe, A., et al. (2017d). Response to comment on “The extent of forest in dryland biomes”. Science 358:eaao2070. doi: 10.1126/science.aao2070
Bayne, E. M., Stralberg, D., and Nixon, A. (2015). Adapting Monitoring to More Effectively Assess the Impacts of Climate Change on Alberta's Biodiversity. Edmonton, AB: Alberta Biodiversity Monitoring Institute.
Beland, M., Parker, G., Sparrow, B., Harding, D., Chasmer, L., Phinn, S., et al. (2019). On promoting the use of lidar systems in forest ecosystem research. For. Ecol. Manage. 450:117484. doi: 10.1016/j.foreco.2019.117484
Bendig, J., and Lucieer, A. (2019). TERN Landscapes Unmanned Aircraft Systems (UAS) Instruments and Platforms Work Package. TERN.
Bissett, A., Fitzgerald, A., Court, L., Meintjes, T., Mele, P. M., Reith, F., et al. (2016). Introducing BASE: the biomes of Australian soil environments soil microbial diversity database. Gigascience 5:21. doi: 10.1186/s13742-016-0126-5
Borer, E. T., Harpole, W. S., Adler, P. B., Lind, E. M., Orrock, J. L., Seabloom, E. W., et al. (2014). Finding generality in ecology: a model for globally distributed experiments. Methods Ecol. Evol. 5, 65–73. doi: 10.1111/2041-210X.12125
Brandle, R., Sparrow, B. D., Foulkes, J. N., and Robinson, A. C. (2005). “A Biological survey of the Mt Willoughby Indigenous Protected Area, South Australia - October 2003,” in The Biological Survey of South Australia (Adelaide, SA: The Department for Environment and Heritage, South Australia) 124.
Bruelheide, H., Dengler, J., Jiménez-Alfaro, B., Purschke, O., Hennekens, S. M., Chytrý, M., et al. (2019). sPlot – a new tool for global vegetation analyses. J. Veg. Sci. 30, 161–186. doi: 10.1111/jvs.12710
Bruelheide, H., Dengler, J., Purschke, O., Lenoir, J., Jimenez-Alfaro, B., Hennekens, S. M., et al. (2018). Global trait-environment relationships of plant communities. Nat. Ecol. Evol. 2, 1906–1917. doi: 10.1038/s41559-018-0699-8
Burton, A. C., Huggard, D., Bayne, E., Schieck, J., Solymos, P., Muhly, T., et al. (2014). A framework for adaptive monitoring of the cumulative effects of human footprint on biodiversity. Environ. Monit. Assess. 186, 3605–3617. doi: 10.1007/s10661-014-3643-7
Caddy-Retalic, S., Andersen, A. N., Aspinwall, M. J., Breed, M. F., Byrne, M., Christmas, M. J., et al. (2017). Bioclimatic transect networks: powerful observatories of ecological change. Ecol. Evol. 7, 4607–4619. doi: 10.1002/ece3.2995
Caddy-Retalic, S., Hoffmann, B. D., Guerin, G. R., Andersen, A. N., Wardle, G. M., McInerney, F. A., et al. (2019). Plant and ant assemblages predicted to decouple under climate change. Diversity Distributions 25, 551–567. doi: 10.1111/ddi.12858
Capon, S., Castley, G., Palmer, G., Linke, S., Piccolo, R., Henderson, E., et al. (2020). A Long-Term Monitoring Framework for the Regional Land Partnerships Stage2: Final Report. Brisbane, QLD: Griffith University.
Christmas, M. J., Biffin, E., Breed, M. F., and Lowe, A. J. (2017). Targeted capture to assess neutral genomic variation in the narrow-leaf hopbush across a continental biodiversity refugium. Sci. Rep. 7:41367. doi: 10.1038/srep41367
Clark, D. B., and Clark, D. A. (2000). Landscape-scale variation in forest structure and biomass in a tropical rain forest. For. Ecol. Manage. 137, 185–198. doi: 10.1016/S0378-1127(99)00327-8
Cleverly, J., Eamus, D., Edwards, W., Grant, M., Grundy, M. J., Held, A., et al. (2019). TERN, Australia's land observatory: addressing the global challenge of forecasting ecosystem responses to climate variability and change. Environ. Res. Lett. 14:095004. doi: 10.1088/1748-9326/ab33cb
Congalton, R. G., and Green, K. (2008). Assessing the Accuracy of Remotely Sensed Data: Principles and Practices. Boca Raton, FL: CRC Press.
de la Cruz, M., Quintana-Ascencio, P. F., Cayuela, L., Espinosa, C. I., and Escudero, A. (2017). Comment on “The extent of forest in dryland biomes”. Science 358:aao0369. doi: 10.1126/science.aao0369
Dickman, C. R., and Wardle, G. M. (2012). “Monitoring for improved biodiversity conservation in arid Australia,” in Biodiversity Monitoring in Australia, eds D. Lindenmayer and P. Gibbons (Collingwood: CSIRO Publishing), 147–164.
Dickman, C. R., Wardle, G. M., Foulkes, J. N., and de Preu, N. (2014). “Desert complex environments,” in Biodiversity and Environmental Change: Monitoring, Challenges and Direction, eds D. Lindenmayer, E. Burns, N. Thurgate and A. Lowe (Collingwood: CSIRO publishing), 379–438.
Dong, N., Prentice, I. C., Evans, B. J., Caddy-Retalic, S., Lowe, A. J., and Wright, I. J. (2017). Leaf nitrogen from first principles: field evidence for adaptive variation with climate. Biogeosciences 14, 481–495. doi: 10.5194/bg-14-481-2017
Dong, N., Prentice, I. C., Wright, I. J., Evans, B. J., Togashi, H. F., Caddy-Retalic, S., et al. (2020). Components of leaf-trait variation along environmental gradients. N. Phytol. doi: 10.1111/nph.16558
Eamus, D., McGuinness, K., and Burrows, W. (2000). “Review of Allometric Relationships for estimating woody biomass for queensland, the Northern territory and Western Australia,” in: National Carbon Accounting System Technical Reports (Canberra, ACT: the Australian Greenhouse Office).
Ens, E., Burns, E., Russell-Smith, J., Sparrow, B., and Wardle, G. (2014). “The cultural imperative: broadening the vision of long-term ecological monitoring to enhance environmental policy and management outcomes,” in Biodiversity and Environmental Change: Monitoring, Challenges and Direction, eds D. Lindenmayer, E. Burns, N. Thurgate and A. Lowe (Melbourne, VIC: CSIRO Publishing), 83–107.
Eyre, T. J., Fisher, A., Hunt, L. P., and Kutt, A. S. (2011). Measure it to better manage it: a biodiversity monitoring framework for the Australian rangelands. Rangeland J. 33, 239–253. doi: 10.1071/RJ10071
Foulkes, J. N., De Preu, N., Sinclair, R., Thurgate, N., Sparrow, B., and White, A. (2014). “Chenopod and Acacia Shrublands,” in Biodiversity and Environmental Change: Monitoring, Challenges and Direction, eds D. Lindenmayer, E. Burns, N. Thurgate and A. Lowe (Collingwood: CSIRO Publishing), 439–478.
Friedel, M. H., and Shaw, K. (1987). Evaluation of methods of monitoring sparse patterned vegetation in arid rangelands. II. trees and shrubs. J. Environ. Manage. 25, 309–318.
Gallagher, R. V., Falster, D. S., Maitner, B. S., Salguero-Gómez, R., Vandvik, V., Pearse, W. D., et al. (2020). Open Science principles for accelerating trait-based science across the tree of life. Nat. Ecol. Evol. 4, 294–303. doi: 10.1038/s41559-020-1109-6
Gellie, N. J. H., Hunter, J. T., Benson, J. S., Kirkpatrick, J. B., Cheal, D. C., McCreery, K., et al. (2018). Overview of plot-based vegetation classification approaches within Australia. Phytocoenologia 48, 251–272. doi: 10.1127/phyto/2017/0173
Gibson, N., Prober, S., Meissner, R., and van Leeuwen, S. (2017). Implications of high species turnover on the south-western Australian sandplains. PLoS ONE 12:e0172977. doi: 10.1371/journal.pone.0172977
Griffith, D. M., Lehmann, C. E. R., Stromberg, C. A. E., Parr, C. L., Pennington, R. T., Sankaran, M., et al. (2017). Comment on “The extent of forest in dryland biomes”. Science 358:aao1309. doi: 10.1126/science.aao1309
Grundy, M. J., Rossel, R. A. V., Searle, R. D., Wilson, P. L., Chen, C., and Gregory, L. J. (2015). Soil and landscape grid of Australia. Soil Res. 53, 835–844. doi: 10.1071/SR15191
Guerin, G. R., Andersen, A. N., Rossetto, M., van Leeuwen, S., Byrne, M., Sparrow, B., et al. (2018a). When macroecological transitions are a fiction of sampling: comparing herbarium records to plot-based species inventory data. Ecography 41, 1864–1875. doi: 10.1111/ecog.03607
Guerin, G. R., Andersen, A. N., Rossetto, M., van Leeuwen, S., Byrne, M., Sparrow, B., et al. (2019a). Consistent sorting but contrasting transition zones in plant communities along bioclimatic gradients. Acta Oecologica Int. J. Ecol. 95, 74–85. doi: 10.1016/j.actao.2019.01.006
Guerin, G. R., Biffin, E., Baruch, Z., and Lowe, A. J. (2016a). Identifying centres of plant biodiversity in South Australia. PLoS ONE 11:e0144779. doi: 10.1371/journal.pone.0144779
Guerin, G. R., Biffin, E., Jardine, D. I., Cross, H. B., Lowe, A. J., and Scheiner, S. (2014). A spatially predictive baseline for monitoring multivariate species occurrences and phylogenetic shifts in mediterranean southern Australia. J. Veg. Sci. 25, 338–348. doi: 10.1111/jvs.12111
Guerin, G. R., Christmas, M. J., Sparrow, B. D., and Lowe, A. J. (2018b). Projected climate change implications for the South Australian flora. Swainsona 30, 25–31. Available online at: https://data.environment.sa.gov.au/Content/Publications/JABG30P025_Guerin.pdf
Guerin, G. R., and Lowe, A. J. (2013). Systematic monitoring of heathy woodlands in a Mediterranean climate—a practical assessment of methods. Environ. Monit. Assess. 185, 3959–3975. doi: 10.1007/s10661-012-2842-3
Guerin, G. R., and Lowe, A. J. (2015). Mapping phylogenetic endemism in R using georeferenced branch extents. SoftwareX 3–4, 22–26. doi: 10.1016/j.softx.2015.10.002
Guerin, G. R., Martín-Forés, I., Munroe, S. E. M., Sparrow, B., Lowe, A. J., and Jansen, F. (2019b). Alien plants alter the growth form ratio and structure of Australian grasslands. Appl. Veg. Sci. 22, 582–592. doi: 10.1111/avsc.12448
Guerin, G. R., O'Connor, P. J., Sparrow, B., and Lowe, A. J. (2018c). An ecological climate change classification for South Australia. Trans. R Soc. South Australia 142, 70–85. doi: 10.1080/03721426.2018.1438803
Guerin, G. R., Saleeba, T., and Tokmakoff, A. (2019c). ausplotsR: TERN AusPlots Analysis Package. R Package version 1.1.
Guerin, G. R., Sparrow, B., Tokmakoff, A., Smyth, A., Leitch, E., Baruch, Z., et al. (2017a). Opportunities for integrated ecological analysis across Inland Australia with standardised data from Ausplots Rangelands. PLoS ONE 12:e0170137. doi: 10.1371/journal.pone.0170137
Guerin, G. R., Sparrow, B., Tokmakoff, A., Smyth, A. K., and Leitch, E. (2017b). “Standardised vegetation survey and monitoring data across the Australian rangelands from TERN AusPlots,” in 19th Biennial Conference of the Australian Rangeland Society (Pt Augusta, SA: The Australian Rangeland Society).
Guerin, G. R., Sparrow, B., Tokmakoff, A., Smyth, A. K., Leitch, E., Baruch, Z., et al. (2016b). Ausplots Rangelands Supplementary Dataset. Version 1.0.
Guerin, G. R., Wen, H., and Lowe, A. J. (2012). Leaf morphology shift linked to climate change. Biol. Lett. 8, 882–886. doi: 10.1098/rsbl.2012.0458
Guerin, G. R., Williams, K. J., Sparrow, B., and Lowe, A. J. (2020). Stocktaking the environmental coverage of a continental ecosystem observation network. bioRxiv 2020:958769. doi: 10.1101/2020.02.20.958769
Harms, K. E., Condit, R., Hubbell, S. P., and Foster, R. B. (2001). Habitat associations of trees and shrubs in a 50-ha neotropical forest plot. J. Ecol. 89, 947–959. doi: 10.1111/j.1365-2745.2001.00615.x
Herrick, J. E., Lessard, V. C., Spaeth, K. E., Shaver, P. L., Dayton, R. S., Pyke, D. A., et al. (2010). National ecosystem assessments supported by scientific and local knowledge. Front. Ecol. Environ. 8, 403–408. doi: 10.1890/100017
Holm, A. M., Curry, P. J., and Wallace, J. F. (1984). Observer differences in transect counts, cover estimates and plant size measurements on range monitoring sites in an arid shrubland. Rangeland J. 6, 98–102. doi: 10.1071/RJ9840098
Hosking, J., Sainty, G., and Jacobs, S. (2000). Certainty and uncertainty in plant identification. New Mexico Botanist 15, 1–4. Available online at: https://floraneomexicana.files.wordpress.com/2014/08/15.pdf
Howard, S., McInerney, F. A., Caddy-Retalic, S., Hall, P. A., and Andrae, J. W. (2018). Modelling leaf wax n-alkane inputs to soils along a latitudinal transect across Australia. Org. Geochem. 121, 126–137. doi: 10.1016/j.orggeochem.2018.03.013
Isbell, R., and Terrain, T. N. C. (2016). The Australian Soil Classification. Melbourne: CSIRO Publishing.
Jurgens, N., Schmiedel, U., Haarmeyer, D. H., Dengler, J., Finckh, M., Goetze, D., et al. (2012). The BIOTA biodiversity observatories in Africa–a standardized framework for large-scale environmental monitoring. Environ. Monit. Assess. 184, 655–678. doi: 10.1007/s10661-011-1993-y
Karan, M., Liddell, M., Prober, S. M., Arndt, S., Beringer, J., Boer, M., et al. (2016). The Australian superSite network: a continental, long-term terrestrial ecosystem observatory. Sci. Total Environ. 568, 1263–1274. doi: 10.1016/j.scitotenv.2016.05.170
Lacerda, A. E. B., and Nimmo, E. R. (2010). Can we really manage tropical forests without knowing the species within? Getting back to the basics of forest management through taxonomy. For. Ecol. Manage. 259, 995–1002. doi: 10.1016/j.foreco.2009.12.005
Lemetre, C., Maniko, J., Charlop-Powers, Z., Sparrow, B., Lowe, A. J., and Brady, S. F. (2017). Bacterial natural product biosynthetic domain composition in soil correlates with changes in latitude on a continent-wide scale. Proc. Natl. Acad. Sci. U.S.A. 114, 11615–11620. doi: 10.1073/pnas.1710262114
Likens, G. E. (2010). The role of science in decision making: does evidence-based science drive environmental policy? Front. Ecol. Environ. 8:132. doi: 10.1890/090132
Likens, G. E., and Lindenmayer, D. B. (2011). A strategic plan for an Australian long-term environmental monitoring network. Austral. Ecol. 36, 1–8. doi: 10.1111/j.1442-9993.2010.02179.x
Lindenmayer, D., Burns, E., Thurgate, N., Lowe, A., Dickman, C. R., Dormontt, E., et al. (2014). “Synopsis,” in Biodiversity and Environmental Change: Monitoring, Challenges and Directions, eds D. Lindenmayer, E. Burns, N. Thurgate and A. Lowe (Melbourne, VIC: CSIRO Publishing), 573–595. doi: 10.1071/9780643108578
Linstadter, A., and Baumann, G. (2013). Abiotic and biotic recovery pathways of arid rangelands: lessons from the high Atlas mountains, Morocco. Catena 103, 3–15. doi: 10.1016/j.catena.2012.02.002
Lodge, G. M., and Gleeson, A. C. (1976). The effect of sample size and plot stratification on the precision of the wheel-point method of estimating botanical composition in clustered plant communities. Rangeland J. 1, 346–350. doi: 10.1071/RJ9790346
Lowe, A. J., Smyth, A. K., Atkins, K., Avery, R., Belbin, L., Brown, N., et al. (2017). Publish openly but responsibly. Science 357:141. doi: 10.1126/science.aao0054
Maestre, F. T., Quero, J. L., Gotelli, N. J., Escudero, A., Ochoa, V., Delgado-Baquerizo, M., et al. (2012). Plant species richness and ecosystem multifunctionality in global drylands. Science 335, 214–218. doi: 10.1126/science.1215442
Magnusson, W., Braga-Neto, R., and Prezzini, F. (2013). Biodiversity and Integrated Environmental Monitoring. Brazil: Attema Editorial.
Martin-Fores, I., Guerin, G. R., and Lowe, A. J. (2017). Weed abundance is positively correlated with native plant diversity in grasslands of southern Australia. PLoS ONE 12:e0178681. doi: 10.1371/journal.pone.0178681
Melville, B., Fisher, A., and Lucieer, A. (2019). Ultra-high spatial resolution fractional vegetation cover from unmanned aerial multispectral imagery. Int. J. Appl. Earth Observ. Geoinform. 78, 14–24. doi: 10.1016/j.jag.2019.01.013
Michalcová, D., Lvončík, S., Chytrý, M., and Hájek, O. (2011). Bias in vegetation databases? A comparison of stratified-random and preferential sampling. J. Veg. Sci. 22, 281–291. doi: 10.1111/j.1654-1103.2010.01249.x
Miehe, S., Kluge, J., Von Wehrden, H., and Retzer, V. (2010). Long-term degradation of Sahelian rangeland detected by 27 years of field study in Senegal. J. Appl. Ecol. 47, 692–700. doi: 10.1111/j.1365-2664.2010.01815.x
Morton, S. R., Stafford-Smith, D. M., Dickman, C. R., Dunkerley, D. L., Friedel, M. H., McAllister, R. R. J., et al. (2011). A fresh framework for the ecology of arid Australia. J. Arid Environ. 75, 313–329. doi: 10.1016/j.jaridenv.2010.11.001
Muir, J. (2018). Developing a Site Based Index of Vegetation Structure Complexity from Terrestrial Laser Scanner Data (Ph.D., thesis). The University of Queensland.
Muir, J., Armston, J., Ward, B., Sparrow, B., Phinn, S., and Scarth, P. (2015). “Comparison of a low-cost photogrammetric method (Photo-Paonoramas) to Terrestrial Laser Scanning for Measurement of Vegetation structure,” in SilviLaser, eds S. Durrieu, and C. Vega 292–294.
National Committee on Soil and Terrain (2009). Australian Soil and Land Survey Field Handbook. Melbourne, VIC: CSIRO Publishing
Nevill, P. G., Zhong, X., Tonti-Filippini, J., Byrne, M., Hislop, M., Thiele, K., et al. (2020). Large scale genome skimming from herbarium material for accurate plant identification and phylogenomics. Plant Methods 16:5. doi: 10.1186/s13007-019-0534-5
Nolan, R. H., Tarin, T., Fairweather, K. A., Cleverly, J., and Eamus, D. (2017). Variation in photosynthetic traits related to access to water in semiarid Australian woody species. Funct. Plant Biol. 44, 1087–1097. doi: 10.1071/FP17096
Nusser, S. M., and Goebel, J. J. (1997). The National resources inventory: a long-term multi-resource monitoring programme. Environ. Ecol. Stat. 4, 181–204. doi: 10.1023/A:1018574412308
Oliva, G., Bran, D., Gaitán, J., Ferrante, D., Massara, V., Martínez, G. G., et al. (2019). Monitoring drylands: the MARAS system. J. Arid Environ. 161, 55–63. doi: 10.1016/j.jaridenv.2018.10.004
Olson, D. M., Dinerstein, E., Wikramanayake, E. D., Burgess, N. D., Powell, G. V. N., Underwood, E. C., et al. (2001). Terrestrial ecoregions of the worlds: a new map of life on Earth. Bioscience 51, 933–938. doi: 10.1641/0006-3568(2001)051[0933:TEOTWA]2.0.CO;2
O'Neill, S., Sparrow, B., Thurgate, N., and Lowe, A. (2017). Ausplots Rangelands Vertebrate Fauna Survey Protocols Manual. Adelaide, SA: Terrestrial Ecosystem Research Network.
Pereira, H. M., Ferrier, S., Walters, M., Geller, G. N., Jongman, R. H., Scholes, R. J., et al. (2013). Essential biodiversity variables. Science 339, 277–278. doi: 10.1126/science.1229931
Phillips, O., Baker, T., Feldpausch, T., and Brienen, R. (2009). RAINFOR Field Manual for Plot Establishment and Remeasurement. Oxford.
Scarth, P., Guerschman, J. P., Clarke, K., and Phinn, S. (2015). “Validation of Australian fractional cover products from MODIS and Landsat data,” in AusCover Good Practice Guidelines: A Technical Handbook Supporting Calibration and Validation Activities of Remotely Sensed Data Products, eds A. Held, S. Phinn, M. Soto-Berelov and S. Jones (Brisbane, QLD: TERN AusCover), 88–118.
Schaefer, M. T., Farmer, E., Soto-Berelov, M., Woodgate, W., and Jones, S. (2015). “Overview of ground based techniques for estimating LAI,” in AusCover Good Practice Guidelines: A Technical Handbook Supporting Calibration and Validation Activities of Remotely Sensed Data Products, eds A. Held, S. Phinn, M. Soto-Berelov and S. Jones (Brisbane, QLD: TERN AusCover), 88–118.
Schepaschenko, D., Fritz, S., See, L., Laso Bayas, J. C., Lesiv, M., Kraxner, F., et al. (2017). Comment on “The extent of forest in dryland biomes”. Science 358:aao0166. doi: 10.1126/science.aao0166
Schmeller, D. S., Julliard, R., Bellingham, P. J., Bohm, M., Brummitt, N., Chiarucci, A., et al. (2015). Towards a global terrestrial species monitoring program. J. Nat. Conserv. 25, 51–57. doi: 10.1016/j.jnc.2015.03.003
Scott, W. A., and Hallam, C. J. (2003). Assessing species misidentification rates through quality assurance of vegetation monitoring. Plant Ecol. 165, 101–115. doi: 10.1023/A:1021441331839
Sparrow, B., Christensen, R., Thurgate, N., O'Neill, S., and Lowe, A. (2016). AusPlots Woodlands Protocols Manual, Version 1.
Sparrow, B., Dormontt, E., Thurgate, N., Burns, E., Lindenmayer, D., and Lowe, A. (2014). “Our capacity to tell an Australian ecological story,” in Biodiversity and Environmental Change: Monitoring, Challenges and Direction, eds D. Lindenmayer, E. Burns, N. Thurgate and A. Lowe (Collingwood: CSIRO Publishing), 49–81.
Sparrow, B., Edwards, W., Munroe, S. E. M., Wardle, G., Guerin, G., Bastin, J. F., et al. (2019a). Effective ecological monitoring requires a multi-scaled approach. EcoEvoRxiv doi: 10.32942/osf.io/3q5v2
Sparrow, B., Guerin, G. R., and Lowe, A. J. (2019b). The need for a nationally consistent ecosystem monitoring framework for Australian rangelands. EcoEvoRxiv. doi: 10.32942/osf.io/f3q42
Stafford Smith, M., and McAllister, R. R. J. (2008). Managing arid zone natural resources in Australia for spatial and temporal variability - an approach from first principles. Rangeland J. 30, 15–27. doi: 10.1071/RJ07052
Sutherland, W. J., Clout, M., Depledge, M., Dicks, L. V., Dinsdale, J., Entwistle, A. C., et al. (2015). A horizon scan of global conservation issues for (2015). Trends Ecol. Evol. 30, 17–24. doi: 10.1016/j.tree.2014.11.002
Taylor, J. J., Kachergis, E. J., Toevs, G. R., Karl, J. W., Bobo, M. R., Karl, M., et al. (2014). AIM-monitoring: a component of the BLM assessment, inventory, and monitoring strategy, in: Technical Note 445. Denver, CO: Department of the Interior, Bureau of Land Management, National Operations Centre.
TERN (2019). AusPlots Ecosystem Surveillance Monitoring Dataset. TERN. Available online at: http://aekos.org.au/collection/adelaide.edu.au/ausplotsrangelands
Thackway, R., Neldner, V. J., and Bolton, M. P. (2008). “Vegetation,” in Guidelines for Surveying Soil and Land Resources, eds N. J. McKenzie, M. J. Grundy, R. Webster, and A. J. Ringrose-Voase (Melbourne, VIC: CSIRO Pub), 115–142.
Toevs, G. R., Karl, J. W., Taylor, J. J., Spurrier, C. S., Karl, M. S., Bobo, M. R., et al. (2011). Consistent indicators and methods and a scalable sample design to meet assessment, inventory, and monitoring information needs across scales. Rangelands 33, 14–20. doi: 10.2111/1551-501X-33.4.14
Tokmakoff, A., Sparrow, B., Turner, D., and Lowe, A. (2016). AusPlots Rangelands field data collection and publication: Infrastructure for ecological monitoring. Future Generat. Comput. Syst. Int. J. Esci. 56, 537–549. doi: 10.1016/j.future.2015.08.016
Turner, D. J., Smyth, A. K., Walker, C. M., and Lowe, A. (2017). “Aekos: next-Generation online data and information infrastructure for the ecological science community,” in Terrestrial Ecosystem Research Infrastructures: Challenges and Opportunities, eds A. Chabbi and H. W. Loescher (Boco Raton, FL: CRC Press), 341–368. doi: 10.1201/9781315368252-17
van der Sande, M. T., Bruelheide, H., Dawson, W., Dengler, J., Essl, F., Field, R., et al. (2020). Similar factors underlie tree abundance in forests in native and alien ranges. Glob. Ecol. Biogeogr. 29, 281–294. doi: 10.1111/geb.13027
van Etten, E. J. B. (2009). Inter-annual rainfall variability of arid Australia: greater than elsewhere? Australian Geogr. 40, 109–120. doi: 10.1080/00049180802657075
Vetter, S. (2005). Rangelands at equilibrium and non-equilibrium: recent developments in the debate. J. Arid Environ. 62, 321–341. doi: 10.1016/j.jaridenv.2004.11.015
Vittoz, P., and Guisan, A. (2007). How reliable is the monitoring of permanent vegetation plots? A test with multiple observers. J. Veg. Sci. 18, 413–422. doi: 10.1111/j.1654-1103.2007.tb02553.x
Watson, I., and Novelly, P. (2004). Making the biodiversity monitoring system sustainable: design issues for large-scale monitoring systems. Austral Ecol. 29, 16–30. doi: 10.1111/j.1442-9993.2004.01350.x
Watson, I. W., Novelly, P. E., and Thomas, P. W. E. (2007). Monitoring changes in pastoral rangelands - the Western Australian Rangeland Monitoring System (WARMS). Rangeland J. 29, 191–205. doi: 10.1071/RJ07008
Westoby, M., Falster, D. S., Moles, A. T., Vesk, P. A., and Wright, I. J. (2002). Plant ecological strategies: some leading dimensions of variation between species. Annu. Rev. Ecol. Syst. 33, 125–159. doi: 10.1146/annurev.ecolsys.33.010802.150452
White, A., Sparrow, B., Leitch, E., Foulkes, J., Flitton, R., Lowe, A. J., et al. (2012). AusPlots Rangelands Survey Protocols Manual. Adelaide, SA: University of Adelaide Press.
White, I. A., Foulkes, J. N., Sparrow, B. D., and Lowe, A. J. (2012). “Biodiversity monitoring in the Australian Rangelands,” in Biodiversity Monitoring in Australia, eds D. Lindenmayer and P. Gibbons (Collingwood: CSIRO Publishing), 179–190.
Wood, S., Stephens, H., Foulkes, J., Ebsworth, E., and Bowman, D. M. J. S. (2015). Ausplots Forests: Survey Protocols Manual. Hobart, 90.
Wood, S. W., Prior, L. D., Stephens, H. C., and Bowman, D. M. (2015). Macroecology of Australian tall eucalypt forests: baseline data from a continental-scale permanent plot network. PLoS ONE 10:e0137811. doi: 10.1371/journal.pone.0137811
Keywords: ecological monitoring methods, vegetation composition, vegetation cover, vegetation structure, soil sampling methods, sample management, electronic data collection
Citation: Sparrow BD, Foulkes JN, Wardle GM, Leitch EJ, Caddy-Retalic S, van Leeuwen SJ, Tokmakoff A, Thurgate NY, Guerin GR and Lowe AJ (2020) A Vegetation and Soil Survey Method for Surveillance Monitoring of Rangeland Environments. Front. Ecol. Evol. 8:157. doi: 10.3389/fevo.2020.00157
Received: 19 August 2019; Accepted: 06 May 2020;
Published: 16 June 2020.
Edited by:
Anouschka R. Hof, Wageningen University and Research, NetherlandsReviewed by:
Stephen M. Mureithi, University of Nairobi, KenyaJudith Sitters, Vrije University Brussel, Belgium
Copyright © 2020 Sparrow, Foulkes, Wardle, Leitch, Caddy-Retalic, van Leeuwen, Tokmakoff, Thurgate, Guerin and Lowe. This is an open-access article distributed under the terms of the Creative Commons Attribution License (CC BY). The use, distribution or reproduction in other forums is permitted, provided the original author(s) and the copyright owner(s) are credited and that the original publication in this journal is cited, in accordance with accepted academic practice. No use, distribution or reproduction is permitted which does not comply with these terms.
*Correspondence: Ben D. Sparrow, ben.sparrow@adelaide.edu.au