Article

Potential Effects of Climate Change on the Geographic Distribution of the Endangered Plant Species Manihot walkerae

by
Gisel Garza
1,
Armida Rivera
1,
Crystian Sadiel Venegas Barrera
2,
José Guadalupe Martinez-Ávalos
3,
Jon Dale
4 and
Teresa Patricia Feria Arroyo
1,*
1
Department of Biology, The University of Texas Rio Grande Valley, 1201 W University Drive, Edinburg, TX 78539, USA
2
Instituto Tecnológico de Ciudad Victoria, Boulevard Emilio Portes Gil 1301, Ciudad Victoria 87010, Mexico
3
Instituto de Ecología Aplicada, Universidad Autónoma de Tamaulipas, División del Golfo 356, Col. Libertad, Ciudad Victoria 87019, Mexico
4
American Forests, 1220 L St NW #750, Washington, DC 20005, USA
*
Author to whom correspondence should be addressed.
Forests 2020, 11(6), 689; https://doi.org/10.3390/f11060689
Submission received: 20 May 2020 / Revised: 12 June 2020 / Accepted: 16 June 2020 / Published: 18 June 2020
(This article belongs to the Special Issue Modeling of Species Distribution and Biodiversity in Forests)

Abstract

:
Walker’s Manihot, Manihot walkerae, is an endangered plant that is endemic to the Tamaulipan thornscrub ecoregion of extreme southern Texas and northeastern Mexico. M. walkerae populations are highly fragmented and are found on both protected public lands and private property. Habitat loss and competition by invasive species are the most detrimental threats for M. walkerae; however, the effect of climate change on M. walkerae’s geographic distribution remains unexplored and could result in further range restrictions. Our objectives are to evaluate the potential effects of climate change on the distribution of M. walkerae and assess the usefulness of natural protected areas in future conservation. We predict current and future geographic distribution for M. walkerae (years 2050 and 2070) using three different general circulation models (CM3, CMIP5, and HADGEM) and two climate change scenarios (RCP 4.5 and 8.5). A total of nineteen spatially rarefied occurrences for M. walkerae and ten non-highly correlated bioclimatic variables were inputted to the maximum entropy algorithm (MaxEnt) to produce twenty replicates per scenario. The area under the curve (AUC) value for the consensus model was higher than 0.90 and the partial ROC value was higher than 1.80, indicating a high predictive ability. The potential reduction in geographic distribution for M. walkerae by the effect of climate change was variable throughout the models, but collectively they predict a restriction in distribution. The most severe reductions were 9% for the year 2050 with the CM3 model at an 8.5 RCP, and 14% for the year 2070 with the CMIP5 model at the 4.5 RCP. The future geographic distribution of M. walkerae was overlapped with protected lands in the U.S. and Mexico in order to identify areas that could be suitable for future conservation efforts. In the U.S. there are several protected areas that are potentially suitable for M. walkerae, whereas in Mexico no protected areas exist within M. walkerae suitable habitat.

1. Introduction

Anthropogenic activities have had a significant influence on the geographic distribution, rate of extinction, and endangerment of many of the world’s plant species [1]. These activities have led to the fragmentation and destruction of plant habitats, as well as the introduction of invasive competitors and pests [2]. Climate change is also having resonant impacts on plants and wildlife [3,4,5]. It is predicted that there will be a shift in the distribution of plants towards higher elevations and latitudes to attempt to cope with the changing climate. However, for plants that are rare, endemic, have lower dispersion distances, or persist in fragmented areas, this transition will be difficult, and they will tend instead toward extinction [5,6]. A plant’s suitable habitat and distribution is dependent on temperature along with other environmental factors, and with changing temperatures they are expected to expand or restrict [7,8]. Invasive plant species that find higher temperatures favorable are expanding in range and out-competing native species [9], while many endemic plants are projected to lose their suitable habitat and are facing extinction. According to the Intergovernmental Panel on Climate Change (IPCC) global temperatures are projected to increase, with heat waves and heavy precipitation events becoming more frequent [10]. For endemic plants that are already faced with habitat fragmentation and competition by invasive species, climate change could act as a catalyst for extinction [6,9,11,12,13].
Species distribution models (SDM) are useful tools in conservation planning and management to project the effects that climate change could have on an endangered species’ distribution [7,14,15]. As our global awareness on climate change increases, SDM have progressively been used to project the effect of climate change on the distribution of invasive pests, pathogens, and endangered species [14,16,17,18,19,20,21,22]. Increasingly, studies have also started assessing the effectiveness of protected areas at conserving endangered species at present and in the future by incorporating climate change SDM [18,19,20,21,22,23]. One study conducted by Vieilledent et al. (2013) explored the effects of climate change on three endangered species of Madagascar (Adansonia grandidieri Baill, Adansonia perrieri Capuron and Adansonia suarezensis H. Perrier) and how climate change would modify the effectiveness of protected areas in the future. It was found that in the future, as a result of climate change, no protected areas were viable for conserving two of these species, which puts them at risk of future extinction [19].
Walker’s Manihot, Manihot walkerae Croizat (Euphorbiaceae), is a rare plant species that is endemic to the Lower Rio Grande Valley (LRGV) of Texas and northeastern Tamaulipas, Mexico [24,25,26,27]. Collectively, they compose part of the Tamaulipan thornscrub ecoregion, a highly biodiverse area that is home to unique endemic species of plants and animals of which nineteen are federally threatened or endangered and nearly 60 are state-protected species [27,28,29]. Habitat destruction, fragmentation, herbicide application, overgrazing, herbivory by native and introduced wildlife, surface mining of caliche, petroleum and natural gas exploration, urban and residential development, and competition by invasive plant species are risk factors that affect M. walkerae [24,25,26]. With over 95% of the focal region’s Tamaulipan thornscrub modified or destroyed, native species of plants and wildlife are faced with the loss of their habitat [27,28,29]. Part of the Tamaulipan thornscrub ecoregion is found in the southwestern United States, where the greatest temperature increase of any area in the lower 48 states is predicted to occur [11,25]. Additionally, semi-arid areas like the Tamaulipan thornscrub might also experience a decrease in water resources due to climate change. This potential development could have adverse effects on native species by restricting their range and increasing the competitive advantage of invasive species [10,25], such as Cenchrus ciliaris buffelgrass [25,30], one of the most detrimental invasive species in the Tamaulipan thornscrub ecoregion and for M. walkerae [24,25,26,27].
Manihot walkerae is a perennial vine-like subshrub that is found in semiarid, shaded shrublands on xeric slopes and uplands, often on overexposed caliche outcrops [24,25,26,27,28]. M. walkerae serves an ecological role in the Tamaulipan thornscrub ecoregion and shares species interactions with native wildlife [27]. Additionally, M. walkerae is a wild relative of the widely utilized agricultural crop Cassava (Manihot esculenta). Cassava is a staple worldwide and serves many roles in food, biofuel, and industrial uses [31,32,33]. A major problem for the Cassava agricultural industry is post-harvest deterioration, a condition which limits the time that Cassava is viable for consumption after its harvest. Studies have found that hybridizing M. walkerae with Cassava has resulted in a tuber that is more resistant to post harvest deterioration [31,32,33]. Furthermore, M. walkerae possesses genes that are resistant to prominent diseases of Cassava, such as Cassava brown streak and Cassava bacterial blight, and it also contains genes for cold resistance [24]. Given the benefits that the genetic constituents of M. walkerae provide, it is a crop wild relative (CWR) of great use to improve longevity and disease resistance in Cassava and its extinction could have negative effects on the future of this crop as its genetic diversity would no longer exist [34].
The objectives of this paper were to evaluate the potential effects of climate change on the geographic distribution of M. walkerae and assess the usefulness of natural protected areas in future conservation. As M. walkerae occurrence data is limited with only a few historical populations documented, we used the maximum entropy algorithm MaxEnt to construct models of its current and future distribution because (1) it uses presence-only data, (2) uses both continuous and categorical data as environmental variables, and (3) its prediction accuracy is reliable even with small sample sizes and gaps [35]. We constructed models of the current and future geographic distribution of M. walkerae for the years 2050 and 2070 using three different general circulation models (CM3, CMIP5, and HADGEM) and two climate change scenarios (RCP 4.5 and 8.5). The geographic distribution consensus models were overlapped with polygons of protected areas in Texas and Mexico to assess the effects of climate change on the effectiveness of protected areas in conserving M. walkerae in the future. We hypothesize that the most severe emission scenario will lead to a more pronounced reduction of distribution and that climate change could reduce the effectiveness of protected areas at conserving M. walkerae in the future. We expect that the results of this modeling exercise can be used to set sound conservation plans for this species.

2. Materials and Methods

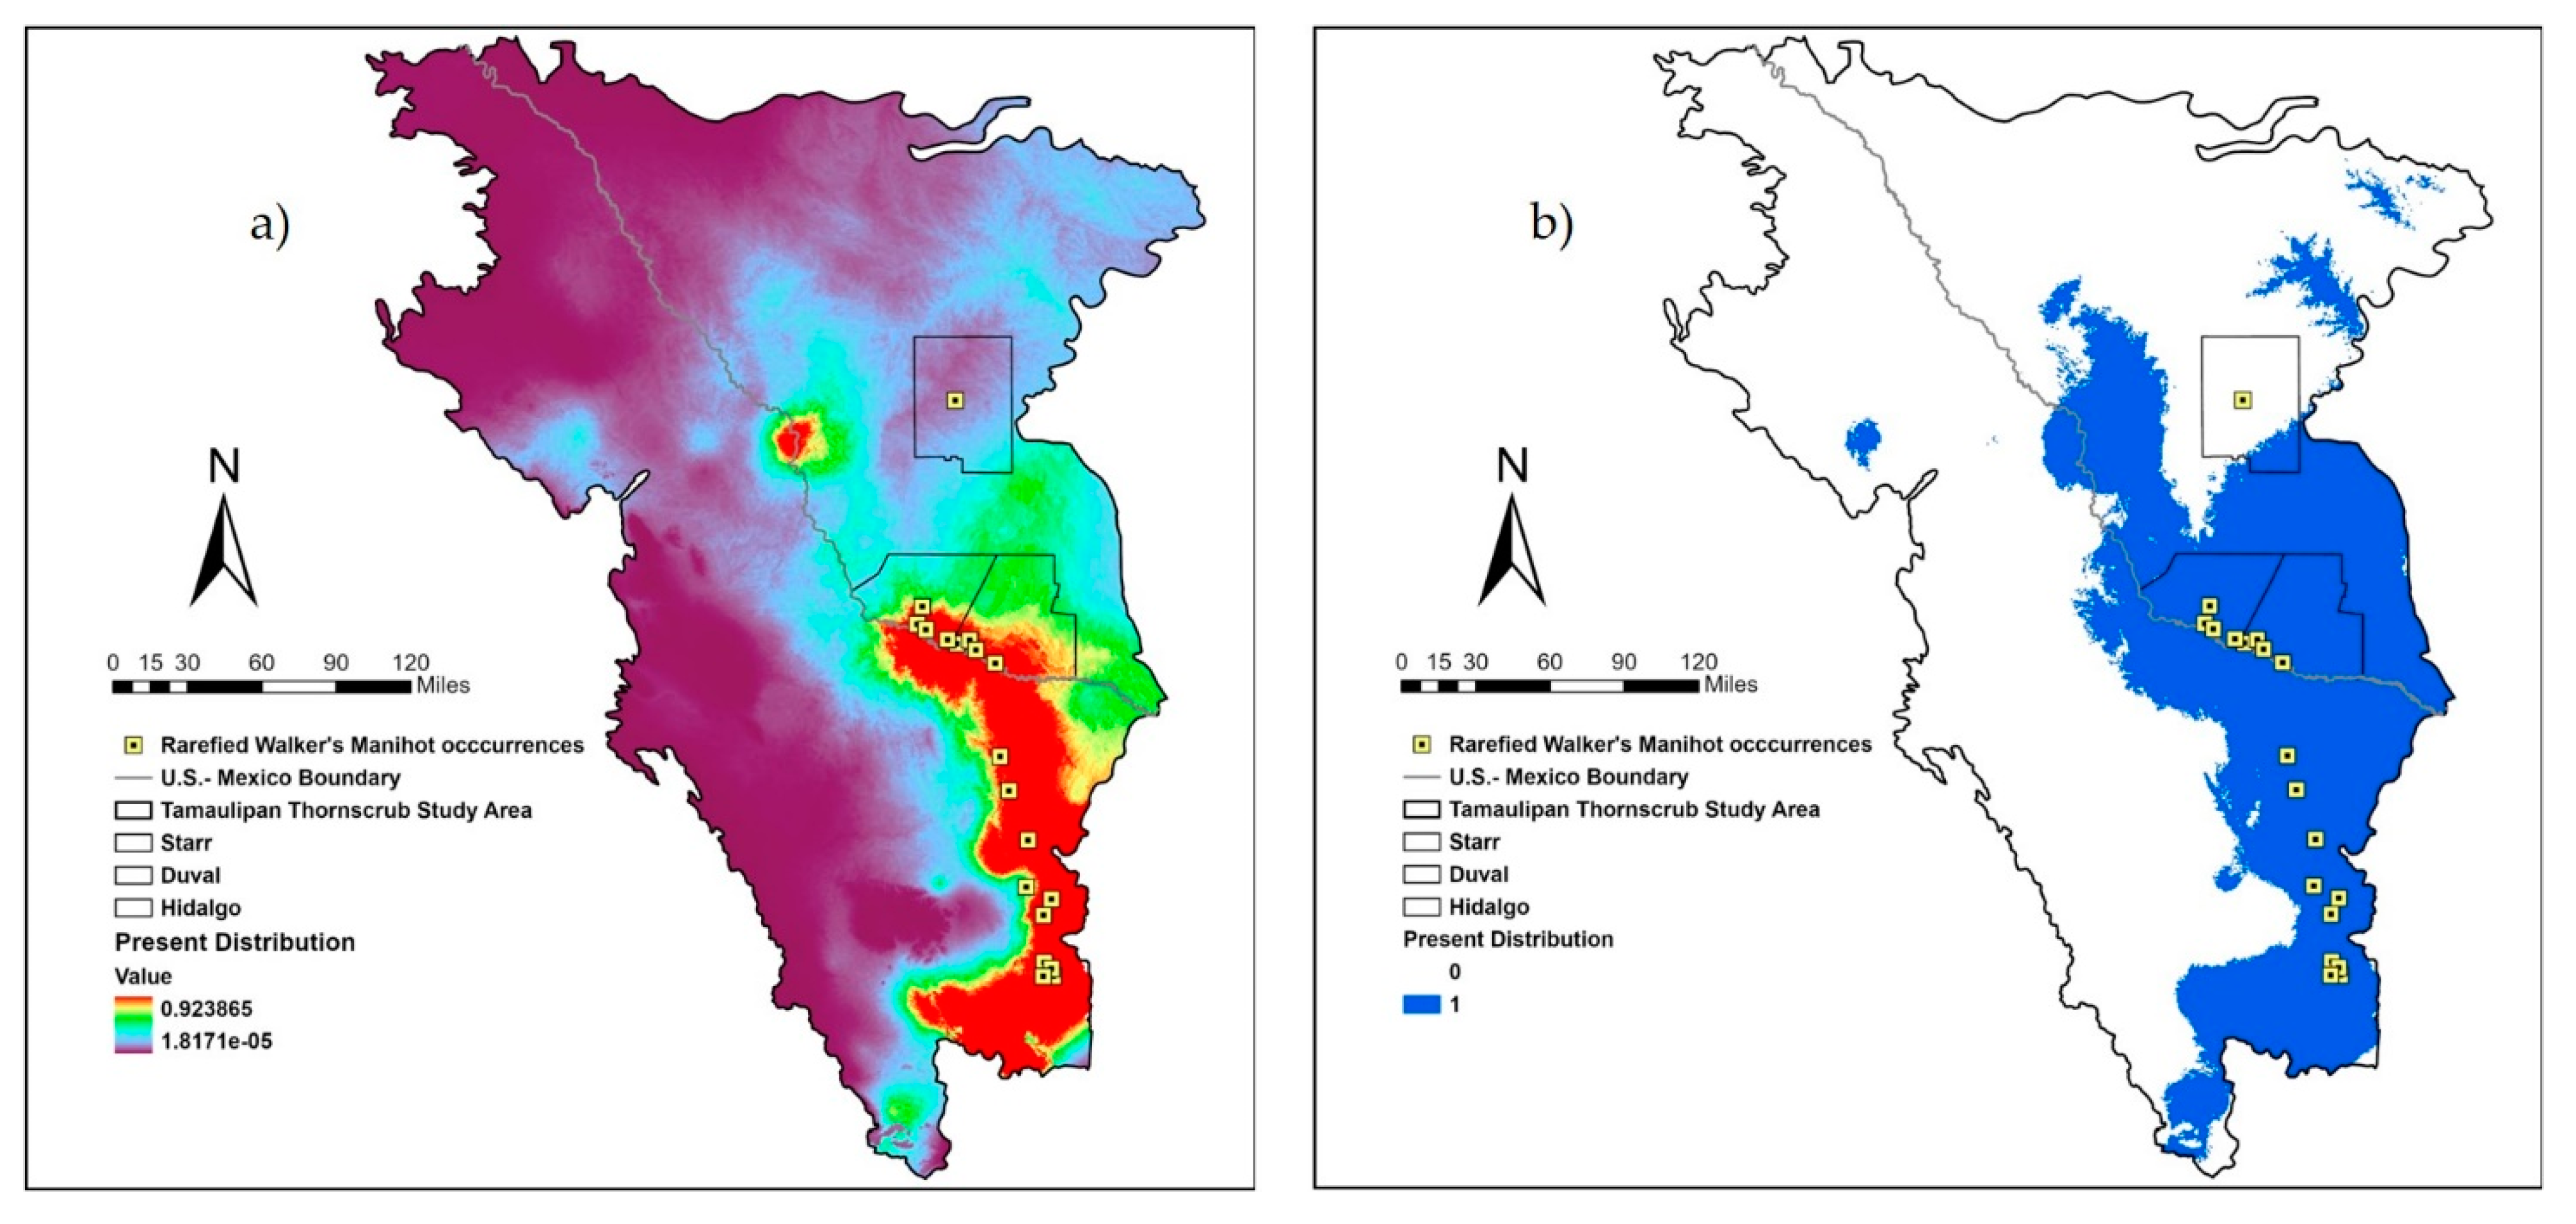
2.1. Occurrence Data

Occurrence data were obtained from three different sources: (1) Historical populations identified according to Source Features (SF; observations) shapefiles and Element Occurrences (EO) provided by the Texas Natural Diversity Database (TXNDD) (TXNDD 2016). SF and EO are matched with shapes and shapefiles using key identificatory fields (IDs). The EO ID represents populations and contains the complete information that TXNDD has for Manihot walkerae. (2) Non-digital data in the form of reports, handwritten notes, pictures and maps obtained from the Texas Parks and Wildlife Department (TPWD). (3) Shapefiles provided by expert botanists that contain precise latitude and longitude data for parcels within the Lower Rio Grande Valley National Wildlife Refuge.
All gathered occurrences were converted into decimal degrees and after removing duplicates and outliers that lay outside the Tamaulipan thornscrub ecoregion study area, the total number of occurrences for M. walkerae was 399 (Figure 1). We reduced geographic autocorrelation for the occurrences using the “spatially rarefy occurrence data” tool in the SDM toolbox version 2.2 [36] at a distance of 4-km. The resulting number of spatially rarefied occurrences was 19 and these were used to generate models through MaxEnt (Figure 1).

2.2. Study Area and Bioclimatic Variables

The geographic potential distribution of M. walkerae was generated in the Tamaulipan thornscrub ecoregion, because it encompassed all M. walkerae historical occurrences (Figure 1). The Tamaulipan thornscrub is characterized by a subtropical, semi-arid vegetation type that occurs on either side of the Rio Grande delta [30]. Spiny shrubs and trees dominate, but grasses, forbs, and succulents are also prominent. It is located within the physiographical province known as the Coastal Gulf Plain [30]. The region originates in the eastern part of Coahuila, Mexico at the base of the Sierra Madre Oriental, and then proceeds eastward to encompass the northern half of the state of Tamaulipas, and into the United States through the southwestern side of Texas. Elevation increases northwesterly from sea level at the Gulf Coast to a base of about 300 m (1000 ft.) near the northern boundary of the ecoregion, from which a few hills and small mountains protrude [30]. Global ecoregion data was downloaded from The Nature Conservancy Geospatial Conservation Atlas for the Tamaulipan thornscrub ecoregion.
We predicted the distribution for M. walkerae at present and for the future using three general circulation models and two representative concentration pathways for the years 2050 and 2070. The three general circulation models and two representative concentration pathways were chosen following a method by Kurpis et al. (2019) [37]. Bioclimatic variables representing current and future conditions were downloaded from WorldClim, a database that provides climatic data derived from monthly temperature and precipitation collected from weather stations around the world, and interpolated onto a surface of approximately 1 km spatial resolution [38]. Nineteen bioclimatic variables representing current global climate data at a 30 arcseconds spatial resolution were downloaded along with the future bioclimatic variables for three general circulation models (GCM): HadGEM2 (Hadley Centre for Climate Prediction and Research), CMIP5 (Coupled Model Intercomparison Project Phase 5), and CM3 (Geophysical Fluid Dynamic Laboratory), and for the two representative concentration pathways: 4.5 watts/m2 and 8.5 watts/m2. These scenarios were developed by the International Panel on Climate Change (IPCC) based on levels of accumulation of greenhouse gas emissions, agriculture area, and air pollution [39,40]. The 4.5 RCP represents an intermediate emissions scenario where temperatures are predicted to increase by approximately 1.5 °C by the end of the 21st century, while the 8.5 RCP represents the most severe scenario with an expected increase of over 2 °C by the end of the 21st century [40].
The bioclimatic variables (Table 1) were cut to fit the Tamaulipan thornscrub ecoregion through ArcGIS [41]. Highly correlated environmental variables with a correlation value above 0.8 were excluded using the “remove highly correlated variables” tool in the SDM toolbox [36]. Ten of the nineteen bioclimatic variables were found as “not-highly” correlated and were used to create the models (Table 1).

2.3. Running MaxEnt and Creating Consensus Models

The nineteen spatially rarefied occurrences along with the ten low correlated bioclimatic variables were inputted in MaxEnt (version 3.4.1) using default parameters and the bootstrap function. Furthermore, a jackknife test was included to assess the contributions of the bioclimatic variables to the model, twenty replicates were run for the current scenario and for each of the three general circulation models at 4.5 and 8.5 RCP for the years 2050 and 2070 [37]. Consensus models were produced from the twenty replicates following the works of Marmion et al. (2008) [42]. Each consensus model was then converted into a binary model using the reclassify tool and the “Fixed Cumulative Value 10” threshold acquired from the MaxEnt results since it was a low threshold value which resulted in a wider distribution for M. walkerae and close to zero omission error [43].

2.4. Calculating Percent Change of Geographic Distribution and Model Evaluation

The difference in distribution between the present distribution model and each respective future climate change binary model was calculated in km2 through ArcGIS as each pixel has a spatial resolution of 1 km2. Consequently, the percentage of change in geographic distribution was calculated for each climate change scenario by subtracting the amount of suitable habitat for M. walkerae in km2 from the amount of unsuitable habitat within the study area which was then multiplied by a 100 and divided by the present suitable habitat (Table 2).
Receiver Operating Characteristics (ROC) were used to evaluate the model based on the area under the curve (AUC) and partial ROC (pROC) values. The AUC is used to evaluate a model’s predictive ability where values range from 0 to 1, with those closer to 1 indicating models with a good predictive ability and a value of 0.5 representing a random predictive ability [44]. However, the reliability of the AUC to evaluate models has been brought into question for several reasons summarized by Lobo et al. (2007) [45]. Therefore, we also calculated pROC as an additional statistic to evaluate the model [46] using NicheToolbox, an application that facilitates its calculation [47].

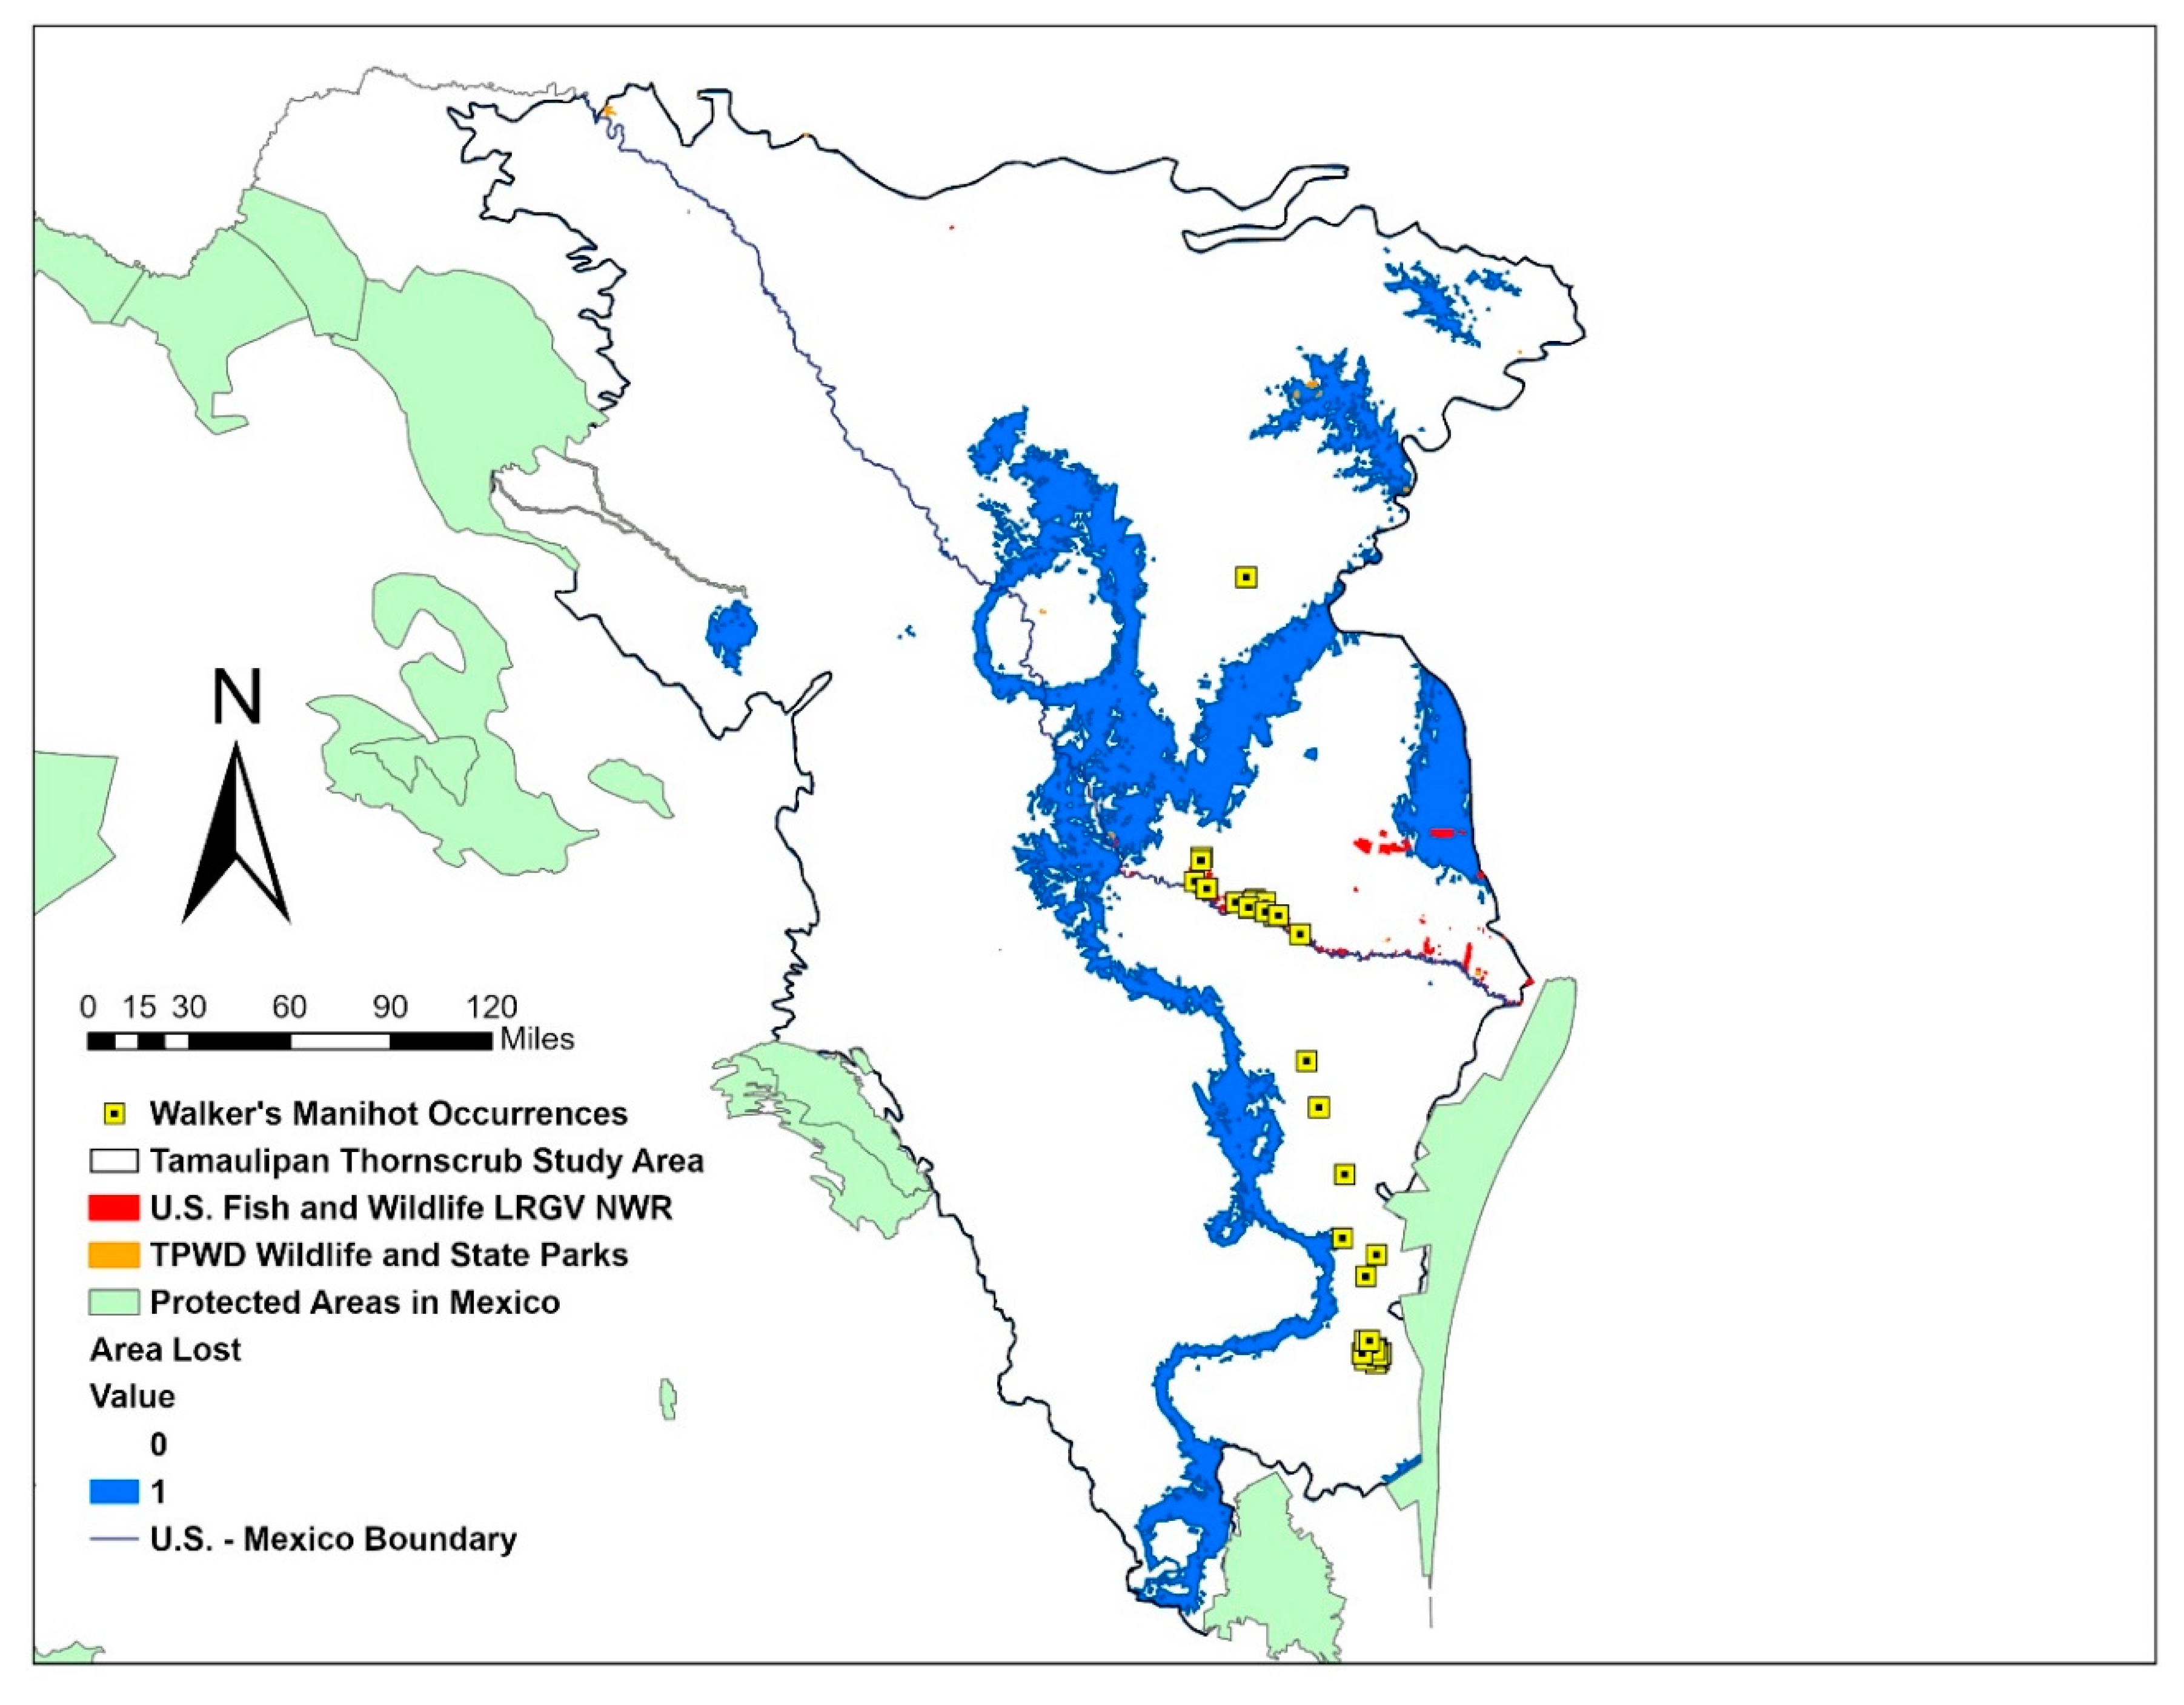
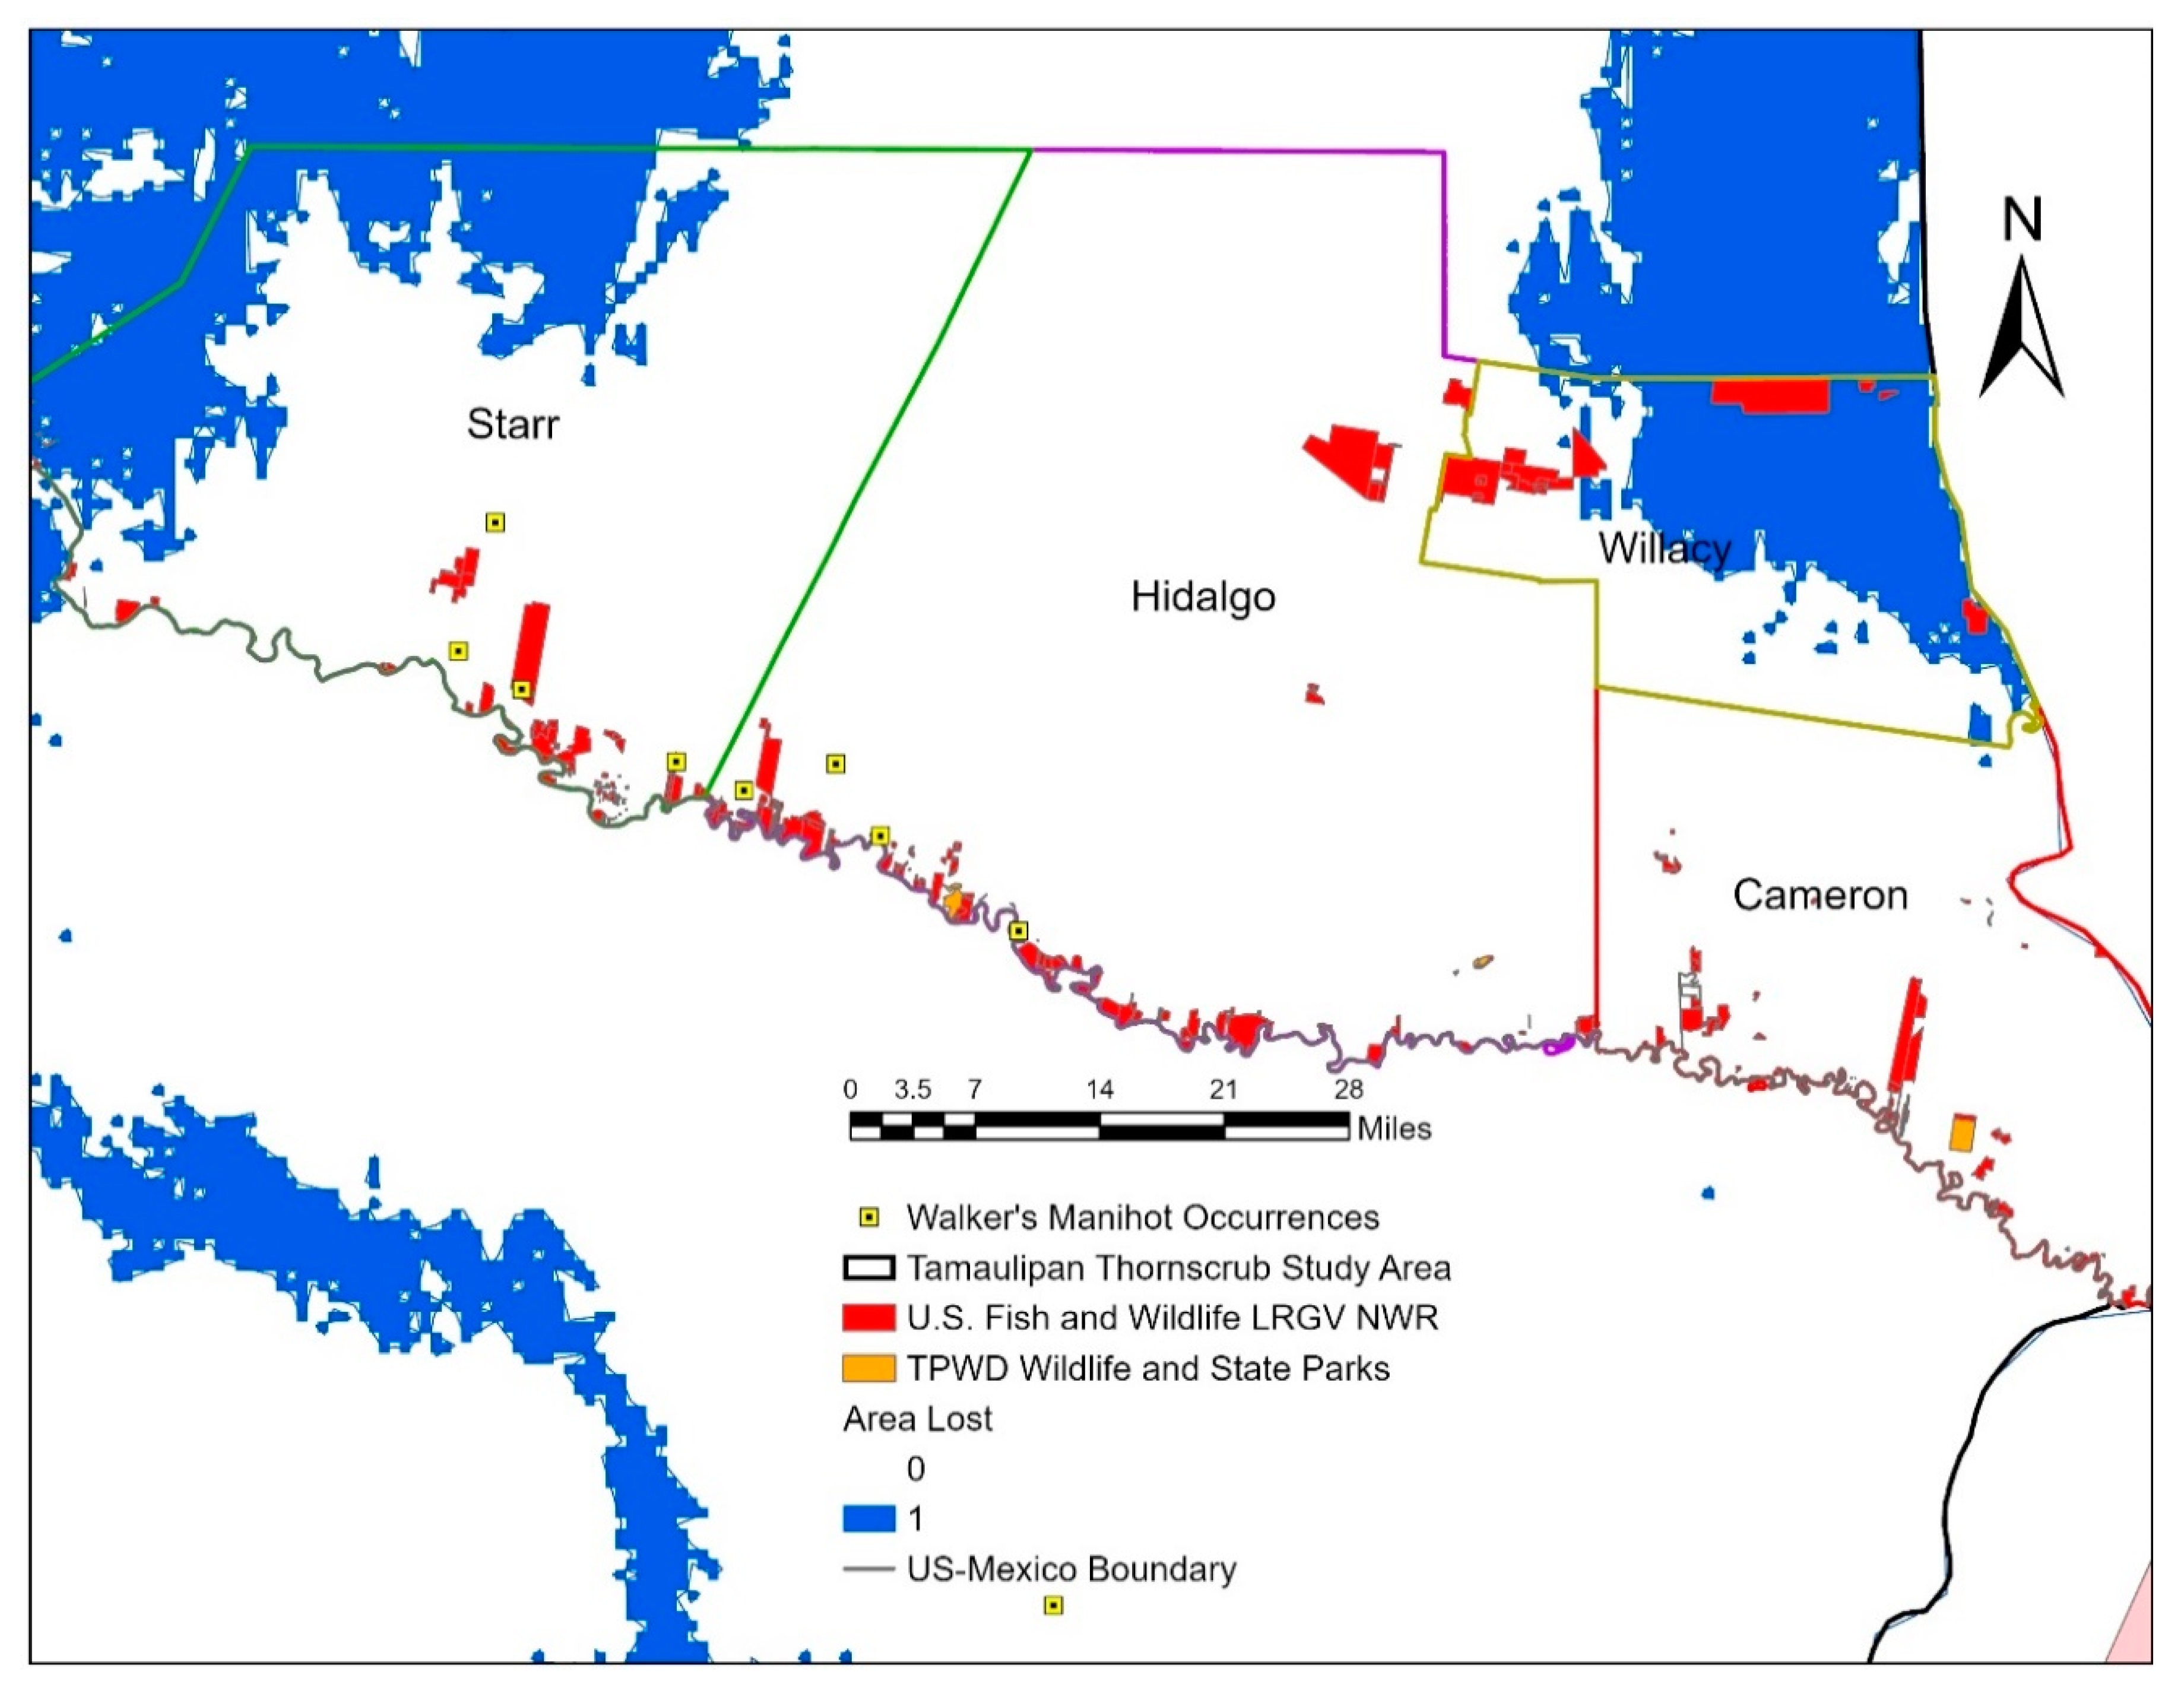
2.5. Protected Areas Maps

The intersect tool in geographic information systems (ArcGIS) was used to overlap the present potential distribution consensus model with the CIMP5 RCP 4.5 2070 consensus model to determine the portions of the study area that were lost as a result of climate change. The CMIP5 RCP 4.5 2070 consensus model was chosen as it had the highest calculated loss of distribution. The area that was lost as a result of climate change was overlapped with polygons of protected areas in Texas and Mexico using ArcGIS to assess if the protected areas were affected by climate change. The protected areas in the U.S. were TPWD lands, and U.S. Fish and Wildlife Service (USFWS) Lower Rio Grande Valley National Wildlife Refuge tracts (LRGV NWR) downloaded from the TPWD GIS database, while for Mexico we used Natural Protected Areas and Priority Terrestrial Regions from the CONABIO data base.

3. Results

The AUC and pRCOC values of the final distribution consensus model produced from ten low correlated bioclimatic variables and nineteen spatially rarefied occurrences was 0.925 and the pROC value was 1.874, indicating that the model has a predictive ability that is better than random, and that overlapped well with known occurrences for Manihot walkerae (Figure 2). Areas of high suitability shown in red are found primarily along the Texas–Mexico boundary and extend towards the southeastern portion of the Tamaulipan thornscrub ecoregion (Figure 2). The variables shown to contribute the most to the model from the jackknife test were Annual Mean Temperature (BIO 1), Temperature Annual Range (BIO 7), Precipitation of Coldest Quarter (BIO 19), Annual Precipitation (BIO 12), and Precipitation of Seasonality (BIO 15), which collectively contributed 96.5% to the model (Table 1). The bioclimatic variables that contributed least were Mean Diurnal Range (BIO 2), Isothermality (BIO 3), Precipitation of Wettest Month (BIO 13), and Precipitation of Driest Month (BIO 14), which collectively contributed 3.4% to the model (Table 1).
The present geographic distribution binary consensus model was used to compare the percent change of geographic distribution with the future climatic models (Figure 2b). For the year 2050, a change in distribution is predicted to occur in the northeastern portion of the Tamaulipan thornscrub study area (Figure 3). Both the CM3 and CMIP5 GCM, at a 4.5 RCP emission scenario, projected an increase of 7.20% and 7.42% in distribution, respectively, primarily in the northeastern portion of the study area (Figure 3a–c). However, at a more severe emission scenario RCP 8.5, CM3 predicted a reduction in distribution, most notably in the north and southwestern portion of the study area (Figure 3b) and a slight decrease in the southernmost portion of the study area for the CMIP5 (Figure 3d). The HadGEM predicted a loss of distribution at both emission scenarios, but notably it is higher for the 4.5 RCP −5.60% than the 8.5 RCP −1.19% (Figure 3e,f and Table 2).
All future climatic models for the year 2070 predicted a loss of potential distribution with notable differences in percent lost between the models (Figure 4 and Table 2). For CM3, a loss of −13.63% of geographic distribution was seen in all areas especially in the northeastern area, northwestern portion along the border, and in the southernmost portion of the Tamaulipan thornscrub ecoregion (Figure 4b). The largest reduction of distribution is shown by the CMIP5 at the 4.5 RCP scenario in the northeastern, northwestern portion along the border, and the southernmost of the study area (Figure 4c) The HadGEM GCM at both emission scenarios show slight decreases of distribution in the southernmost portion of the study area (Figure 4d,e) with a greater loss calculated for the most severe emission scenario −4.13% than the intermediate scenario −2.61%.

4. Discussion

The models produced show that with good predictive ability the potential geographic distribution for Manihot walkerae in the years 2050 and 2070 could be slightly reduced as a result of climate change. As a consensus, the future climate change models show a restriction in future distribution for Manihot walkerae with the lowest loss of distribution calculated as −2.08% for the year 2050 with an RCP of 8.5, and the highest, −14.37%, for the year 2070 with an RCP of 4.5, whereas for two of the future climate change scenarios at an RCP of 4.5 for the year 2050, it is predicted that there could be a potential increase of approximately 7% in distribution (Table 2). Similarly, another SDM study conducted in the Chihuahan desert found that some endemic plants were shown to be affected by climate change and expanded in distribution [48]. The areas that were shown to be most affected by climate change were those in the northeastern and southernmost portions of the Tamaulipan Thornscrub ecoregion (Figure 3, Figure 4 and Figure 5). Although there are no documented occurrences of M. walkerae in these regions, there are some protected lands within the area that was lost and it is predicted that they will not be suitable for M. walkerae in the future (Figure 5 and Figure 6). This potential outcome could limit success in the future for conservation efforts such as reintroduction. Successful reintroduction of M. walkerae to increase the number of populations of this species would be best in areas that are predicted to have high potential for geographic distribution. Areas that have a high potential for geographic distribution also have the highest potentially suitable habitat for a said species. Species distribution modeling has been used as a tool for reintroduction of endangered species when models show the areas have potentially suitable habitat for a given species [21,22]. In Texas, there are several protected lands that have high potential for geographic distribution for M. walkerae and that are predicted to be unaffected by climate change (Figure 5). These protected lands could be used for future conservation efforts such as the reintroduction of M. walkerae. In Mexico, currently there are no protected lands that lie within the areas that are potentially suitable for M. walkerae, making the future of this species in Mexico uncertain. In order for successful conservation efforts to be conducted in Mexico, relationships with private landowners that agree to conserve M. walkerae on their property would have to be formed.
Some limitations of our study are that we relied solely on bioclimatic variables for our modeling and that we used a small number of occurrences to create our models. Using bioclimatic variables for climate change modeling is common and has been used to model the effects of climate change on the distribution of different species of plants and animals, some of which are endangered and restricted [23,48,49]. Including static topographic variables could have improved the reliability of our models, but in some instances, such as when topographic variables like elevation and bioclimatic variables are highly correlated, they could hinder the statistic reliability of the model [50]. In the case of our study, we obtained AUC and pROC values that were higher than random indicating that even though we used a low number of occurrences and bioclimatic variables, these models could serve as a good reference for future conservation plans for Manihot walkerae. Most importantly, these models show that although there are some protected areas that could conserve this species in southern Texas, in Mexico there are no conservation areas that lay within M. walkerae historical occurrences or predicted current and future distribution. A probable reason why there are no protected areas for this species can be attributed to a lack of sufficient data on its biotic inventory, species ecological requirements, and species distribution patterns [51]. This study provides valuable information for M. walkerae’s distribution and can allow for an inference of some of the ecological requirements of this species. The results of the jackknife procedure show that temperature and precipitation are important influencers of M. walkerae’s distribution.
Although there is a growing collective awareness for the effects of climate change on the world’s species, most of the attention is focused on those that are used in agriculture or provide a direct threat or benefit to humans [52]. There is scarce research done so far that contributes to the conservation of endemic endangered species of the Tamaulipan thornscrub, especially when it applies to rare plant species that are generally unknown. As human populations continue to grow in South Texas and northeastern Mexico, it is probable that there will be a reduction of suitable habitat for M. walkerae due to land cover change. As climate change is not predicted to be an imminent threat to M. walkerae populations, but could act synergistically with other harmful factors that threaten this species (e.g., loss of genetic diversity), future studies exploring the effects of land cover change on this species would be of great use for conservation efforts. Although most occurrences for M. walkerae in Texas show a close distribution to the U.S.–Mexican border, there is one population further north which is isolated from the others. We constructed models where we omitted this record and found that omitting it did not have an effect on M. walkerae’s predicted distribution, we decided to include it in our study since it is a historical record for this species. Unfortunately, this population exists within private property which restricts our access to this population for potential field studies. Additionally, given that there is a lack of connectivity from this population to other historical occurrences that are located near the U.S.–Mexican border, there is some uncertainty on whether this population is native or could have been introduced. Furthermore, an approaching threat for M. walkerae and other native species of the Tamaulipan thornscrub ecoregion is the impending construction of additional border wall segments, which are expected to exasperate fragmentation as well as increase anthropogenic disturbance in the known current distributional range [53]. Collectively, the results of this study show that climate change can potentially have an effect on the geographic distribution of this endangered species and although it is not known if the distribution could expand or restrict, protected areas are essential for conserving M. walkerae and we recommend that the geographic distribution of this species be taken into account when designating protected areas in Mexico and southern Texas.

5. Conclusions

In conclusion, this work brings to light the potential effects that climate change could have on the geographic distribution of the endangered species Manihot walkerae. An endemic of the Tamaulipan thornscrub ecoregion, it shares ecological relationships with other native species, and also provides beneficial genetic qualities to its relative Cassava. Climate change as a restrictor of distribution for this species could exasperate fragmentation and increase invasive competition. The geographic distribution of M. walkerae was overlapped with protected lands in the U.S. and Mexico in order to identify areas that could be suitable for future conservation efforts and to assess if climate change would change the usefulness of these protected areas. In the U.S., there are several protected areas that are potentially suitable for M. walkerae; future predictions show that a few of these protected areas will be no longer suitable for future conservation efforts for this species. While in Mexico no protected areas exist within M. walkerae suitable habitat, and conservation efforts will depend on the cooperation of private landowners. When developing future conservation plans, it will be necessary to incorporate climate change as a possible harmful factor alongside those that are known, especially as more lands with natural land cover are converted for human development.

Author Contributions

Conceptualization, T.P.F.A., J.D., and J.G.M.-Á.; methodology, T.P.F.A., C.S.V.B., and G.G.; formal analysis, G.G.; investigation, G.G. and T.P.F.A.; resources G.G.; data curation G.G. and A.R.; writing—original draft preparation, G.G.; writing—review and editing, G.G., T.P.F.A., J.D., C.S.V.B., J.G.M.-Á., and A.R.; visualization, G.G.; supervision, T.P.F.A.; project administration, T.P.F.A; funding acquisition, T.P.F.A. All authors have read and agreed to the published version of the manuscript.

Funding

This research was funded by the Section 6 Texas Parks and Wildlife grant titled “Understanding the ecological and geographic distribution of Manihot walkerae”.

Acknowledgments

The authors would like to thank expert botanist Chris Best from the U.S. Fish and Wildlife Service for providing us with occurrence data for Lower Rio Grande Valley National Wildlife Refuges. Much appreciation is also given to Anna W. Strong from the Texas Parks and Wildlife Department, and Kimberly Wahl-Villarreal for providing information on M. walkerae’s distribution and biology.

Conflicts of Interest

The authors declare no conflicts of interest.

References

  1. Paul, A.; Bharali, S.; Khan, M.L.; Tripathi, O.P. Anthropogenic disturbances led to risk of extinction of Taxus wallichiana Zuccarini, an endangered medicinal tree in Arunachal Himalaya. Nat. Areas J. 2013, 33, 447–454. [Google Scholar] [CrossRef]
  2. Crowl, T.A.; Crist, T.O.; Parmenter, R.R.; Belovsky, G.; Lugo, A.E. The spread of invasive species and infectious disease as drivers of ecosystem change. Front. Ecol. Environ. 2008, 6, 238–246. [Google Scholar] [CrossRef]
  3. Thuiller, W.; Lavorel, S.; Araújo, M.B.; Sykes, M.T.; Prentice, I.C. Climate change threats to plant diversity in Europe. Proc. Natl. Acad. Sci. USA 2005, 102, 8245–8250. [Google Scholar] [CrossRef] [PubMed] [Green Version]
  4. Walther, G.R.; Post, E.; Convey, P.; Menzel, A.; Parmesan, C.; Beebee, T.J.; Fromentin, J.M.; Hoegh-Guldberg, O.; Bairlein, F. Ecological responses to recent climate change. Nature 2002, 416, 389. [Google Scholar] [CrossRef] [PubMed]
  5. Jump, A.S.; Penuelas, J. Running to stand still: Adaptation and the response of plants to rapid climate change. Ecol. Lett. 2005, 8, 1010–1020. [Google Scholar] [CrossRef]
  6. IŞIK, K. Rare and endemic species: Why are they prone to extinction? Turk. J. Bot. 2011, 35, 411–417. [Google Scholar] [CrossRef]
  7. Pulliam, H.R. On the relationship between niche and distribution. Ecol. Lett. 2000, 3, 349–361. [Google Scholar] [CrossRef]
  8. Soberón, J.; Peterson, A.T. Interpretation of models of fundamental ecological niches and species’ distributional areas. Biodivers. Inform. 2005, 2, 1–10. [Google Scholar] [CrossRef] [Green Version]
  9. Thuiller, W.; Richardson, D.M.; Midgley, G.F. Will Climate Change Promote Alien Plant Invasions? Springer: Berlin/Heidelberg, Germany, 2008; pp. 197–211. [Google Scholar] [CrossRef]
  10. Pachauri, R.K.; Reisinger, A. Climate Change 2007: Synthesis Report. Assessment Report of the Intergovernmental Panel on Climate Change; IPCC: Geneva, Switzerland, 2007; p. 104. [Google Scholar]
  11. Brook, B.W.; Sodhi, N.S.; Bradshaw, C.J. Synergies among extinction drivers under global change. Trends Ecol. Evol. 2008, 23, 453–460. [Google Scholar] [CrossRef] [PubMed]
  12. Leimu, R.; Vergeer, P.; Angeloni, F.; Ouborg, N.J. Habitat fragmentation, climate change, and inbreeding in plants. Ann. N. Y. Acad. Sci. 2010, 1195, 84–98. [Google Scholar] [CrossRef]
  13. El-Keblawy, A. Impact of climate change on biodiversity loss and extinction of endemic plants of arid land mountains. J. Biodiver. Endang. Spp. 2014, 2, 2. [Google Scholar] [CrossRef]
  14. Jeschke, J.M.; Strayer, D.L. Usefulness of bioclimatic models for studying climate change and invasive species. Ann. N. Y. Acad. Sci. 2008, 1134, 1–24. [Google Scholar] [CrossRef] [PubMed]
  15. Pecchi, M.; Marchi, M.; Burton, V.; Giannetti, F.; Moriondo, M.; Bernetti, I.; Bindi, M.; Chirici, G. Species distribution modelling to support forest management. A literature review. Ecol. Model. 2019, 411, 108817. [Google Scholar] [CrossRef]
  16. Abolmaali, S.M.; Tarkesh, M.; Bashari, H. MaxEnt modeling for predicting suitable habitats and identifying the effects of climate change on a threatened species, Daphne mucronata, in central Iran. Ecol. Inform. 2018, 43, 116–123. [Google Scholar] [CrossRef]
  17. Khanum, R.; Mumtaz, A.S.; Kumar, S. Predicting impacts of climate change on medicinal asclepiads of Pakistan using Maxent modeling. Acta Oecologica 2013, 49, 23–31. [Google Scholar] [CrossRef]
  18. Qin, A.; Liu, B.; Guo, Q.; Bussmann, R.W.; Ma, F.; Jian, Z.; Xu, G.; Pei, S. Maxent modeling for predicting impacts of climate change on the potential distribution of Thuja sutchuenensis Franch., an extremely endangered conifer from southwestern China. Glob. Ecol. Conserv. 2017, 10, 139–146. [Google Scholar] [CrossRef]
  19. Vieilledent, G.; Cornu, C.; Sanchez, A.C.; Pock-Tsy, J.M.; Danthu, P. Vulnerability of baobab species to climate change and effectiveness of the protected area network in Madagascar: Towards new conservation priorities. Biol. Conserv. 2013, 166, 11–22. [Google Scholar] [CrossRef]
  20. Yu, J.; Wang, C.; Wan, J.; Han, S.; Wang, Q.; Nie, S. A model-based method to evaluate the ability of nature reserves to protect endangered tree species in the context of climate change. For. Ecol. Manag. 2014, 327, 48–54. [Google Scholar] [CrossRef]
  21. Adhikari, D.; Barik, S.K.; Upadhaya, K. Habitat distribution modelling for reintroduction of Ilex khasiana Purk., a critically endangered tree species of northeastern India. Ecol. Eng. 2012, 40, 37–43. [Google Scholar] [CrossRef] [Green Version]
  22. Ardestani, E.G.; Tarkesh, M.; Bassiri, M.; Vahabi, M.R. Potential habitat modeling for reintroduction of three native plant species in central Iran. J. Arid Land. 2015, 7, 381–390. [Google Scholar] [CrossRef]
  23. Hole, D.G.; Huntley, B.; Arinaitwe, J.; Butchart, S.H.; Collingham, Y.C.; Fishpool, L.D.; Pain, D.J.; Willis, S.G. Toward a management framework for networks of protected areas in the face of climate change. Conserv. Biol. 2011, 25, 305–315. [Google Scholar] [CrossRef] [PubMed]
  24. Clayton, P.W. Walker’s Manioc Manihot Walkerae Recovery Plan; U.S. Fish and Wildlife Service, Region 2: Albuquerque, NM, USA, 1993. [Google Scholar]
  25. Best, C.; Miller, A.; Cobb, R. Walker’s Manioc (Manihot walkerae) 5-Year Review: Summary and Evaluation; U.S. Fish and Wildlife Service: Albuquerque, NM, USA, 2009. [Google Scholar]
  26. Vera-Sánchez, K.S.; Nassar, N. Manihot Walkerae. The IUCN Red List of Threatened Species. 2019. Available online: https://www.iucnredlist.org/species/20755842/20756066 (accessed on 7 April 2020).
  27. Leslie, D.M., Jr. An International Borderland of Concern: Conservation of Biodiversity in the Lower Rio Grande Valley; No. 2016-5078; U.S. Geological Survey: Reston, VA, USA, 2016. [Google Scholar]
  28. Jahrsdoerfer, S.E.; Leslie, D.M., Jr. Tamaulipan brushland of the Lower Rio Grande Valley of South Texas: Description, human impacts, and management options. U.S. Fish Wildl. Serv. Biol. Rep. 1988, 88, 1–63. [Google Scholar]
  29. Cook, T.; Adams, J.; Valero, A.; Schipper, J.; Allnutt, T. Southern North America: Southern United States into Northeastern Mexico. World Wildlife Fund. Available online: https://www.worldwildlife.org/ecoregions/na1312 (accessed on 24 April 2020).
  30. Marshall, V.M.; Lewis, M.M.; Ostendorf, B. Buffel grass (Cenchrus ciliaris) as an invader and threat to biodiversity in arid environments: A review. J. Arid Environ. 2012, 78, 1–2. [Google Scholar] [CrossRef]
  31. Saravanan, R.A.; Ravi, V.; Stephen, R.; Thajudhin, S.H.; George, J. Post-harvest physiological deterioration of cassava (Manihot esculenta)-A review. Indian J. Ag. Sci. 2016, 86, 1383–1390. [Google Scholar]
  32. Zainuddin, I.M.; Fathoni, A.; Sudarmonowati, E.; Beeching, J.R.; Gruissem, W.; Vanderschuren, H. Cassava post-harvest physiological deterioration: From triggers to symptoms. Postharvest Biol. Technol. 2018, 142, 115–123. [Google Scholar] [CrossRef]
  33. Morante, N.; Sánchez, T.; Ceballos, H.; Calle, F.; Pérez, J.C.; Egesi, C.; Cuambe, C.E.; Escobar, A.F.; Ortiz, D.; Chávez, A.L.; et al. Tolerance to postharvest physiological deterioration in cassava roots. Crop Sci. 2010, 50, 1333–1338. [Google Scholar] [CrossRef]
  34. Dempewolf, H.; Eastwood, R.J.; Guarino, L.; Khoury, C.K.; Müller, J.V.; Toll, J. Adapting agriculture to climate change: A global initiative to collect, conserve, and use crop wild relatives. Agroecol. Sustain. Food Syst. 2014, 38, 369–377. [Google Scholar] [CrossRef] [Green Version]
  35. Syfert, M.M.; Smith, M.J.; Coomes, D.A. The effects of sampling bias and model complexity on the predictive performance of MaxEnt species distribution models. PLoS ONE 2013, 8, e55158. [Google Scholar] [CrossRef]
  36. Brown, J.L. SDM toolbox: A python-based GIS toolkit for landscape genetic, biogeographic and species distribution model analyses. Methods Ecol. Evol. 2014, 5, 694–700. [Google Scholar] [CrossRef]
  37. Kurpis, J.; Serrato-Cruz, M.A.; Arroyo, T.P. Modeling the effects of climate change on the distribution of Tagetes lucida Cav. (Asteraceae). Glob. Ecol. Conser. 2019, 20, e00747. [Google Scholar] [CrossRef]
  38. Hijmans, R.J.; Cameron, S.E.; Parra, J.L.; Jones, P.G.; Jarvis, A. Very high resolution interpolated climate surfaces for global land areas. Int. J. Climatol. J. R. Meteorol. Soc. 2005, 25, 1965–1978. [Google Scholar] [CrossRef]
  39. Van Vuuren, D.P.; Edmonds, J.; Kainuma, M.; Riahi, K.; Thomson, A.; Hibbard, K.; Hurtt, G.C.; Kram, T.; Krey, V.; Lamarque, J.F.; et al. The representative concentration pathways: An overview. Clim. Chang. 2011, 109, 5. [Google Scholar] [CrossRef]
  40. Pachauri, R.K.; Allen, M.R.; Barros, V.R.; Broome, J.; Cramer, W.; Christ, R.; Church, J.A.; Clarke, L.; Dahe, Q.; Dasgupta, P.; et al. Climate Change 2014: Synthesis Report. Contribution of Working Groups I, II and III to the Fifth Assessment Report of the Intergovernmental Panel on Climate Change; IPCC: Geneva, Switzerland, 2014. [Google Scholar]
  41. ESRI 2020. ArcGIS Pro 2.5.1; Environmental Systems Research Institute: Redlands, CA, USA, 2020. [Google Scholar]
  42. Marmion, M.; Parviainen, M.; Luoto, M.; Heikkinen, R.K.; Thuiller, W. Evaluation of consensus methods in predictive species distribution modelling. Divers. Distrib. 2008, 15, 59–69. [Google Scholar] [CrossRef]
  43. Norris, D. Model thresholds are more important than presence location type: Understanding the distribution of lowland tapir (Tapirus terrestris) in a continuous Atlantic forest of southeast Brazil. Trop. Conserv. Sci. 2014, 7, 529–547. [Google Scholar] [CrossRef] [Green Version]
  44. Elith, J.; Graham, C.H.; Anderson, R.P.; Dudík, M.; Ferrier, S.; Guisan, A.; Hijmans, R.J.; Huettmann, F.; Leathwick, J.R.; Lehmann, A.; et al. Novel methods improve prediction of species’ distributions from occurrence data. Ecography 2006, 29, 129–151. [Google Scholar] [CrossRef] [Green Version]
  45. Lobo, J.M.; Jiménez-Valverde, A.; Real, R. AUC: A misleading measure of the performance of predictive distribution models. Glob. Ecol. Biogeogr. 2008, 17, 145–151. [Google Scholar] [CrossRef]
  46. Peterson, A.T.; Papeş, M.; Soberón, J. Rethinking receiver operating characteristic analysis applications in ecological niche modeling. Ecol. Model. 2008, 213, 63–72. [Google Scholar] [CrossRef]
  47. Osorio-Olvera, L.; Barve, V.; Barve, N.; Soberón, J.; Falconi, M. Niche Toolbox: From Getting Biodiversity Data to Evaluating Species Distribution Models in a Friendly GUI Environment. R Package Version 0.2.5.4. 2018. Available online: http://shiny.conabio.gob.mx:3838/nichetoolb2/ (accessed on 13 April 2020).
  48. Sosa, V.; Loera, I.; Angulo, D.F.; Vásquez-Cruz, M.; Gándara, E. Climate change and conservation in a warm North American desert: Effect in shrubby plants. PeerJ 2019, 7, e6572. [Google Scholar] [CrossRef]
  49. Borzée, A.; Andersen, D.; Groffen, J.; Kim, H.T.; Bae, Y.; Jang, Y. Climate change-based models predict range shifts in the distribution of the only Asian plethodontid salamander: Karsenia koreana. Sci. Rep. 2019, 9, 1–9. [Google Scholar] [CrossRef] [Green Version]
  50. Stanton, J.C.; Pearson, R.G.; Horning, N.; Ersts, P.; Reşit Akçakaya, H. Combining static and dynamic variables in species distribution models under climate change. Methods Ecol. Evol. 2012, 3, 349–357. [Google Scholar] [CrossRef]
  51. Téllez-Valdés, O.; D¡Vila-Aranda, P. Protected areas and climate change: A case study of the Cacti in the Tehuacán-Cuicatlán Biosphere Reserve, México. Conserv. Biol. 2003, 17, 846–853. [Google Scholar] [CrossRef]
  52. Rosenzweig, C.; Iglesius, A.; Yang, X.B.; Epstein, P.R.; Chivian, E. Climate change and extreme weather events-Implications for food production, plant diseases, and pests. Glob. Chang. Hum. Health 2001, 2, 90–104. [Google Scholar] [CrossRef]
  53. Greenwald, N.; Segee, B.; Curry, T.; Bradley, C. A Wall in the Wild: The Disastrous Impacts of Trump’s Border Wall on Wildlife; Center for Biological Diversity: Tucson, AZ, USA, 2017. [Google Scholar]
Figure 1. Known occurrences for Manihot walkerae in Texas and Mexico within the Tamaulipan Thornscrub ecoregion study area. The yellow dots represent all 399 known occurrences for M. walkerae, and the red dots represent the 19 4 km spatially rarefied occurrences.
Forests 11 00689 g001
Figure 2. Consensus models of present geographic distribution for Manihot walkerae based on ten bioclimatic variables and 19 spatially rarefied occurrences. (a) The color scale ranges from blue to red, with blue depicting areas of unsuitable distribution (value: 0) and red areas with highest potential of distribution (value: 1). (b) Binary model, blue areas are potentially suitable. The calculated area under the curve (AUC) and partial receiver operating characteristics (pROC) values for this model are 0.925 and 1.874, indicating good performance.
Forests 11 00689 g002
Figure 3. Future potential geographic distribution for M. walkerae for the year 2050 using ten bioclimatic variables and nineteen spatially rarefied occurrences. Panels (a,b) correspond to the CM3 GCM at an RCP of 4.5 and 8.5, respectively. Panels (c,d) correspond to the CMIP5 GMC at an RCP of 4.5 and 8.5. Panels (e,f) correspond to the HadGEM GMC at an RCP of 4.5 and 8.5.
Forests 11 00689 g003
Figure 4. Future potential geographic distribution for M. walkerae for the year 2070 using ten bioclimatic variables and nineteen spatially rarefied occurrences. Panels (a,b) correspond to the CM3 GCM at an RCP of 4.5 and 8.5, respectively. Panels (c,d) correspond to the CMIP5 GMC at an RCP of 4.5 and 8.5. Panels (e,f) correspond to the HadGEM GMC at an RCP of 4.5 and 8.5.
Forests 11 00689 g004
Figure 5. The portion of area lost (blue) as a result of climate change for the CMIP5 RCP 4.5 2070 model that had the highest predicted loss of distribution −14.37%. The known occurrences of Manihot walkerae were shown to not be affected, but some U.S. Fish and Wildlife LRGV NWR protected areas (red) in the northeastern portion of the study area are predicted to no longer be suitable for M. walkerae in the future. No protected areas in Mexico are shown to overlap with suitable areas of distribution of M. walkerae at present and in the future.
Forests 11 00689 g005
Figure 6. Detail of the suitable area lost (blue) in Lower Rio Grande Valley Texas counties of Starr, Hidalgo, Cameron, and Willacy. The protected areas that are shown to be most affected by climate change are U.S. Fish and Wildlife Service LRGV NWR tracts located in Willacy County.
Forests 11 00689 g006
Table 1. Available and used (bold) bioclimatic variables for modeling of the present and future potential suitable habitat of M. walkerae. The percent contribution of each of the low correlated variables to the present potential suitable habitat model is also included.
VariableExplanation% Contribution
BIO1Annual Mean Temperature37.1
BIO2Mean Diurnal Range (Mean of monthly (max temp-min temp))0.3
BIO3Isothermality (BIO2/BIO7) × 1001
BIO4Temperature Seasonality (standard deviation × 100)
BIO5Max Temperature of Warmest Month
BIO6Min Temperature of Coldest Month
BIO7Temperature Annual Range (BIO5-BIO6)20.3
BIO8Mean Temperature of Wettest Quarter
BIO9Mean Temperature of Driest Quarter
BIO10Mean Temperature of Warmest Quarter0
BIO11Mean Temperature of Coldest Quarter
BIO12Annual Precipitation7.1
BIO13Precipitation of Wettest Month0
BIO14Precipitation of Driest Month2.1
BIO15Precipitation of Seasonality (Coefficient of Variation)13.7
BIO16Precipitation of Wettest Quarter
BIO17Precipitation of Driest Quarter
BIO18Precipitation of Warmest Quarter
BIO19Precipitation of Coldest Quarter18.3
Table 2. Percent change of geographic distribution for Manihot walkerae between the current model and the future projected climate change models for the years 2050 and 2070.
Present2050
RCP 4.5RCP 8.5
CM3CMIP5HadGEMCM3CMIP5HadGEM
Suitable Area km275,90188,18688,57166,34559,65772,35273,870
% Change+7.20+7.42−5.60−9.52−2.08−1.19
Present2070
RCP 4.5RCP 8.5
CM3CMIP5HadGEMCM3CMIP5HadGEM
Suitable Area km275,90163,99551,39871,44952,65365,15668,845
% Change−6.98−14.37−2.61−13.63−6.30−4.13

