Microbial Functional Diversity in Vineyard Soils: Sulfur Metabolism and Links With Grapevine Plants and Wine Quality
 Stefano Mocali
 Eiko E. Kuramae
 George A. Kowalchuk
 Flavio Fornasier
 Simone Priori
- 1Consiglio per la Ricerca in Agricoltura e l'Analisi dell'Economia Agraria – Centro di Ricerca Agricoltura e Ambiente, Firenze, Italy
- 2Department of Microbial Ecology, Netherlands Institute of Ecology (NIOO-KNAW), Wageningen, Netherlands
- 3Department of Biology, Utrecht University, Utrecht, Netherlands
- 4Consiglio per la Ricerca in Agricoltura e l'Analisi dell'Economia Agraria – Centro di Ricerca Viticoltura e Enologia, Gorizia, Italy
- 5Department of Agricultural and Forestry Sciences, University of Tuscia, Viterbo, Italy
The quality of the vineyard soils has a direct impact on grapes and wine quality and represents a key component of the “Terroir concept.” However, information on the impact of soil microbiota on grapevine plants and wine quality are generally lacking. In fact, over the last few years most of the attempts made to correlate soil microbial communities and wine quality were limited by overlooking both the functional traits of soil microbiota and the spatial variability of vineyards soils. In this work, we used a functional gene microarray approach (GeoChip) and soil enzymatic analyses to assess the soil microbial community functional potential related to the different wine quality. In order to minimize the soil variability, this work was conducted at a “within-vineyard” scale, comparing two similar soils (BRO11 and BRO12) previously identified with respect to pedological and hydrological properties within a single vineyard in Central Tuscany and that yielded highly contrasting wine quality upon cultivation of the same Sangiovese cultivar (BRO12 exhibited the higher quality). Our results showed an enrichment of Actinobacteria in BRO12, whereas Alfa- and Gamma-Proteobacteria were more abundant in BRO11, where an enrichment of bacteria involved in N fixation and denitrification occurred. Overall, the GeoChip output revealed a greater biological activity in BRO11 but a significant enrichment of sulfur-oxidation genes in BRO12 compared to BRO11 soil, where a higher level of arylsulfatase activity was also detected. Moreover, the low content of sulfates and available nitrogen found in BRO12 suggested that the reduced availability of sulfates for vine plants might limit the reduced glutathione (GSH) synthesis, which plays an important role in aroma protection in musts and wines. In conclusion, in addition to nitrogen availability, we propose that soil microbial sulfur metabolism may also play a key role in shaping plant physiology, grapes and wine quality. Overall, these results support the existence of a “microbial functional terroir” effect as a determining factor in vineyard-scale variation among wine grapes.
Introduction
The relationship between soil and crop quality has been studied intensively over the past several decades, especially with respect to grapes used in wine production (Seguin, 1986; Vaudour, 2002; Deloire et al., 2005). The quality of wine is largely determined by grapes but a number of factors, such as grapes variety and vine rootstock, water availability, climate, soil properties, and viticultural-oenological practices directly affect grape quality at harvest (OIV, 2010). The interactions among such factors over time determine the “Terroir concept,” an interactive ecosystem which define a specific vineyard site with unique features that give wine grapes their distinctive character (van Leeuwen and Seguin, 2006). Although many studies have demonstrated that soil chemical, physical and hydrological features can strongly affect wine peculiarities (van Leeuwen et al., 2004; Vaudour et al., 2015), the potential contribution of soil microbiota has until recently been overlooked (Bokulich et al., 2014; Gilbert et al., 2014; Knight et al., 2015; Garofalo et al., 2016; Miura et al., 2017). In fact, whereas the uniqueness of the microbiota present typically on the skins of the fruit, and how this influences the compounds produced during fermentation, is a well-accepted concept (Barata et al., 2012; Felder et al., 2012; Bokulich et al., 2014, 2016; Capozzi et al., 2015; Knight et al., 2015; Jara et al., 2016; Mezzasalma et al., 2017), the uniqueness of the microbial community structure found in the soil and/or associated to various plant parts which influence the flavor, color, and quality of the fruit and wine is not clearly established (Gilbert et al., 2014). In the last few years several authors tried to support the “microbial terroir” concept suggesting that soil microbiome may affect wine quality (Burns et al., 2015; Zarraonaindia et al., 2015; Bokulich et al., 2016; Belda et al., 2017; Vadakattu et al., 2019). However, the results generally highlighted distinct microbial communities correlated to different vineyards but without finding any direct effect on vine growth, fruit properties, or wine quality. In fact, as the authors indicate, “correlation is not causation” and more research is needed to link specific microbial functions to one or more sensory features of wines. Moreover, most of such studies have been conducted on different vineyards or soils located in different areas, thus providing severe limitations for the assignment of any soil microbial taxa/groups associated to a specific vine plant. In fact, it is well-known that microbial community structure and biogeography change with environmental variations and are primarily controlled by edaphic features (Fierer and Jackson, 2006; Kuramae et al., 2012; Burns et al., 2015; Li et al., 2019). Thus, in order to assess the role of soil microbial diversity and functions in determining grape and wine quality, it is essential to minimize the environmental variability and conduct the research at a within-vineyard scale, in the same soil or among similar soils.
Thus, in this study we selected two experimental plots within the same vineyard in Chianti municipality (Tuscany, Italy), corresponding to subareas with highly similar soils, called BRO11, and BRO12. Remarkably, although their similarity, BRO11 and BRO12 soils gave rise to grape and wines that differ in their quality (Costantini et al., 2013).
This experimental field thus provided a means to examine the microbial community properties of two highly similar soils giving rise to wine grapes of disparate quality, thereby potentially providing a means to examine how soil microbial community structure and functions are related to grapevine performance and wine quality. Here, we hypothesized that soil microbial functions are different in these two plots that might exert a key role in shaping the grapevine performance and wine quality. To test this hypothesis, we (i) determined the soil properties, compared the (ii) microbial functional diversity and major metabolic pathways using microbial function microarray (Geochip 3.0), and (iii) soil enzyme activity involved in C, N, and P cycles in plots BRO11 and BRO12. Results are discussed with respect to the potential factors effecting microbial communities in these soils, potential links between microbial community properties and final grape and wine quality and the general notion of a microbial terroir concept.
Materials and Methods
Description of the Study Area
The selected vineyard is located in the Brolio farm (lat: 43.384°, long: 11.436°), which belongs to the Barone Ricasoli estate, one of the most important wineries of the Chianti Classico wine-area, in Gaiole in Chianti municipality (Tuscany region, Italy). The vineyard was established in 2000, after weak slope re-shaping and deep plowing to a depth of 0.8–1.0 m. The grape cultivar was Sangiovese, which is the main variety of Chianti Classico and other red wines of central Italy. Plant density was 6,250 plants/ha (2.0 × 0.8 m) and the rootstock was 420A.
This vineyard has been the subject of previous research projects aimed to determine the relationships between soil and wine quality, in which a total of 3 + 3 years of mapping and monitoring activities on grapevines and soils have been undertaken. Some results of research activities relating to water and nitrogen nutrition were already published by Costantini et al. (2013), whereas other results on geophysical investigation were published by Martini et al. (2013) and Braschi et al. (2018). The depositional sequence started in the bottom by clayey deposits, some tens of meters thick, characterized by small lignite lenses and gypsum crystals, overlying by sandy-gravelly deposits of beach environment, for an average thickness, determined by geophysical analysis (Martini et al., 2013), of about 10 meters. The erosion during Quaternary period brought the clayey deposits on the surface only along valley and in the lower part of the slope. In this vineyard, about 70% of the total surface is characterized by sandy-gravelly marine deposits, whereas the lower part of the slope (<310 m a.s.l.) shows clayey deposits on the surface or buried by shallow (20–30 cm) deposits of sands, recently sedimented for colluviation from the slope.
The two plots selected for this study, BRO11 and BRO12, were about 80 m apart on a single vineyard row in the same soil typological unit (Figure 1 and Figure S1), and developed on marine sands and conglomerates dating back to 4.5 million years B.P. (Early Pliocene period). Both soils have sandy loam texture, moderate calcium carbonate content (60–150 g·kg−1), subalkaline pH (8.2–8.4), and low organic carbon (2.3–6.5 g·kg−1). The soil moisture monitoring of the 0–70 cm evidenced a very similar water availability among the two soils (Costantini et al., 2013). BRO12 has little higher content of sand (about +10%) and coarse fragments (about +10%), as well as slightly lower organic carbon (about −4 g·kg−1) and available water capacity (AWC, −10 mm·m−1).
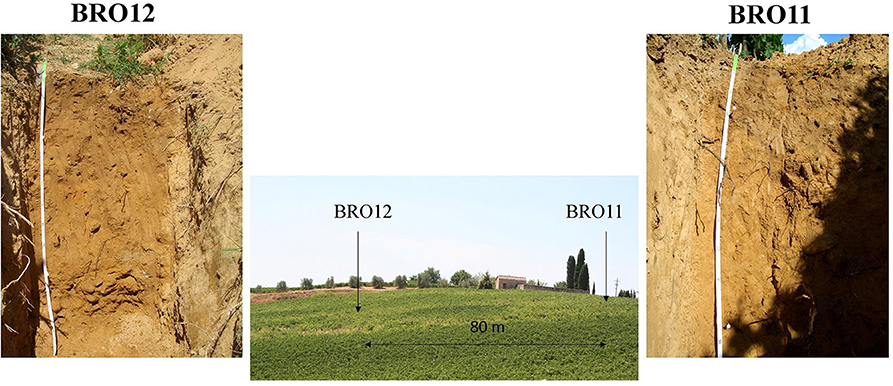
Figure 1. Pictures of the studied vineyard (from North to Southward) and soil profiles of BRO11 and BRO12 plots.
Despite the high similarity of the two soils, the grapevines response in the two plots were different, as reported in the previous paper (Costantini et al., 2013). Briefly, the ratio between the carbon isotopes 13C/12C (δ13C) found in the wines demonstrated higher grapevine water stress during summer in BRO11 than in BRO12. However, BRO12 produced lower grape yield/plant during experimental years (2008/'09/'10), which on average was about 1 kg/plant vs. 1.6 kg/plant of BRO11. On the other hand, the grapes of BRO12 showed a small increase of the average sugar content (23.2 °Brix, instead 22.2 °Brix of BRO11), extractable polyphenols (1,883 vs. 1,638 mg·l−1) and significantly (p < 0.05) higher total anthocyanins (1,500 vs. 1,316 mg ·l−1, data available only for 2008 and 2009). The overall wine quality was determined by means of the “Vine Performance of Sangiovese” (VPS) index (Bucelli et al., 2010), which showed a higher VPS value (VPS = 81) in BRO12 than in BRO11 (VPS = 62) over the three vintages.
Pedological Survey and Soil Sampling
In order to assess the soil spatial homogeneity across the vineyard, the experimental field was surveyed in greater detail by the use of soil proximal sensors, namely electromagnetic induction sensor (EM38- Mk2, Geonics Ltd., Canada) and gamma-ray spectroscopy (The Mole, Soil Company, The Netherlands), able to provide a cheap, non-invasive, and rapid mapping of the soil apparent electric conductivity (ECa) and soil stoniness and mineralogy, respectively (Priori et al., 2013, 2014). The maps obtained by proximal soil sensing defined the homogeneity of the study area and allowed to select the sampling points within two homogeneous plots. At the harvest, three sub-plots (replicates) of the two soils were then laid out along the same vineyard row, at about 5 m from each other. Five soil sub-samples were collected at the same distance from the plants (about 50 cm across the row), at 0–30 cm depth and accurately mixed together in a unique sample for each sub-plot (about 1 kg each). Soil samples were air-dried at room temperature and sieved at 2 mm before being stored at −30°C for the subsequent GeoChip and enzymatic analysis.
In the same vineyard row, two soil profiles (BRO11 and BRO12) were dug until a depth of about 1.3 m, and described by following the international guidelines for soil description (Jahn et al., 2006). For laboratory physical and chemical analysis, each soil horizon of the soil profiles was collected, air-dried and 2.0 mm sieved; the resulting sample was then stored at room temperature before being analyzed.
Soil Chemical and Physical Analyses
Soil texture was determined by a X-ray/sedimentation throughout a Micromeritics Sedigraph III analyser, according to Andrenelli et al. (2013). Total soil organic carbon (SOC) and nitrogen (TN) were determined by dry combustion using a ThermoFlash 2000 CN soil analyzer, after removing the carbonates with HCl 10%. The total equivalent CaCO3 was calculated as the difference of total C between the untreated soil (mineral C + organic C) and the HCl-treated soil (organic C). The active lime was determined using the Drouineau method in accordance with Loeppert and Suarez (1996). The soil pH was measured potentiometrically in a 1:2.5 soil–water suspension. The soil cation exchange capacity (CEC) and the exchange bases were determined with the BaCl2-triethanolamine (pH 8.2) method, whereas the amount of Ca, Mg, K, and Na in the extracts were quantified by flame atomic absorption spectrometry (Agilent SpectrAA 220FS spectrometer) (Gessa and Ciavatta, 2000). Finally, the total SO4-S was determined by turbidimetric assay according with the standard method for water-soluble sulfate in soil proposed by the ASTM International (2015).
DNA Extraction, Purification, and Whole Genome Amplification
The total DNA was extracted from a 5 g soil sample using a procedure including freezing, grinding and thawing samples in liquid nitrogen (3 times), and treatment with sodium dodecyl sulfate (SDS) and cetyl-trimethylammonium bromide (CTAB) for cell lysis and DNA extraction, respectively, in accordance with Richard et al. (2001). The DNA was then purified with the Promega Wizard DNA Clean-Up System (Madison, WI, USA), in accordance with the manufacturer's instruction. Then, the DNA quality was assessed by gel electrophoresis (1% agarose), stained with 0.5 μg/mL ethidium bromide solution. Both quantity and quality of the DNA samples were carefully checked by means of a Nanodrop Lite spectrophotometer (Thermo Fisher Scientific). Only DNA samples with concentration exceeding 8.5 ng μl−1 and 260/280 ratio between 1.5 and 1.9 were considered viable for subsequent processing, according to van Nostrand et al. (2010a). In order to reach the amount and the quality of DNA requested for the Geochip analysis, a whole genome amplification was carried out on 100 ng DNA using the Templiphi Amplification kit (GE Healthcare Life Sciences, Piscataway, NJ) with the following modifications: 0.1 μmol/L spermidine and 260 ng/μL single stranded DNA binding protein (Single Stranded DNA Binding Protein, SSB) were added to enhance the amplification efficiency and representativeness (van Nostrand et al., 2010b). The final DNA samples were then stored at −80°C until further analysis.
GeoChipTM Hybridization and Analysis
GeoChipTM 3.0 was used for DNA hybridization. It is a functional gene array containing approximately 28,000 DNA probes targeting 292 functional gene families involved in most of the main soil processes, such as: carbon (C), nitrogen (N), phosphate (P), and sulfur (S) cycling, energy metabolism, antibiotic resistance, metal resistance, and organic contaminant degradation. Moreover, the DNA gyrase (gyrB) gene is included in the GeoChip v.3.0, and it is useful for comparing microbial community structure across a broad range of taxonomic levels (He et al., 2010a; Lu et al., 2012). Hybridization and subsequent analysis of the DNA samples were carried out by the Institute for Environmental Genomics (IEG) at the University of Oklahoma (USA), as previously described (van Nostrand et al., 2010a). Briefly, 2.5 μg DNA was labeled for fluorescence with Cy5 (GE Healthcare) and the entire processing pipeline was conducted as previously described (Zhang et al., 2006). After hybridization, microarrays were scanned (NimbleGen MS200 Microarray Scanner, Madison, WI, USA) and the signal intensities were quantified using the customized pipeline at IEG (http://ieg.ou.edu/microarray), as described previously (He et al., 2010b). Spots with a signal to-noise ratio (SNR) <2.0 were removed, and a signal intensity 2,000 was considered as threshold value. The raw signal was then log-transformed and normalized, and its relative abundance was calculated in each sample using internal and external standards (Li et al., 2014). Alpha-diversity was determined using Shannon–Wiener index (H), Simpson index (1/D), and Simpson evenness (E). The shared (overlapped) genes between all samples were calculated by dividing the number of overlapping genes by the total genes present in both samples. The BRO11/BRO12 ratio was calculated by dividing the difference occurring among BRO11 and BRO12 unique values and their sum. The entire dataset was submitted to the public repository “Gene Expression Omnibus (GEO) of the NCBI and it is available at the following link: https://www.ncbi.nlm.nih.gov/geo/query/acc.cgi?acc=GSE146289.”
Soil Enzyme Assays
The following enzymatic activities related to C, N, P, S cycles were determined on BRO11 and BRO12 soils: β-glucosidase (gluc), leucine aminopeptidase (leu), pyrophosphatase (pyro), alkaline phosphomonoesterase (alkP), phosphodiesterase (bis-P), and arylsulphatase (aryS). An heteromolecular exchange procedure was used to desorb enzymes from soil, and the subsequent extraction was carried out through a bead-beating step, in accordance with Cowie et al. (2013). Briefly, 400 mg of moist soil plus 1.4 mL of 30 gL−1 lysozyme solution as desorbent, plus 0.4 mL glass beads (<100 μm) and 0.4 mL ceramic beads were put in a 2-mL Eppendorf tube. Tubes were bead-beating for 180 s at 30 strokes s−1 (Retsch MM400 beating mill) and followed by centrifugation at 20,000 g for 5 min. Afterwards, enzyme activities were quantified by fluorometric assay and results were expressed as nanomoles of fluorophore per gram of soil (dry basis) per hour. Fluorophore was 4-methyl-umbelliferone for β-glucosidase, phosphodiesterase, pyrophosphatase, alkaline phosphomonoesterase, and arylsulphatase, whereas 7-amino-4-methyl coumarine was used for leucine aminopeptidase. The double-stranded DNA (dsDNA) was determined as a measure of soil microbial biomass, as previously reported (Fornasier et al., 2014). The procedure was the same as for enzymes, but the extraction buffer was 0.12 M, pH 7.8 Na-phosphate buffer and bead-beating lasted 120 s. The dsDNA was then quantified by fluorimetry on microplate, without any further purification, using PicoGreen (Life Technologies). The assay was performed according to the manufacturer's instructions, and results were recorded by a microplate reader (Synergy HT, Bio-Tek). All the measurements were done in duplicate.
Statistical Analyses
The overall GeoChip 3.0 data were analyzed and processed at the Institute for Environmental Genomics, University of Oklahoma (http://ieg.ou.edu/). Preprocessed data were then used for further analysis. Functional gene diversity was calculated using Simpson's 1/D, Shannon-Weiner's H′, and evenness. Multivariate detrended correspondence analysis (DCA) of the GeoChip data was used for comparing the different functional gene communities (Zhou et al., 2008). Hierarchical cluster analysis was carried out with Gene Cluster (v. 3.0) and visualized with TreeView on group genes on the basis of the expression pattern (Eisen et al., 1998). Only probes detected in at least 2 out of 3 replicates of each soil sample were considered as positive, regardless the intensity of the signal, and analyzed as binary (0/1) data. Then, the total abundance of each gene category (calculated as the sum of the detected genes for the gene category or family) was used for ANOVA analysis and for determining the BRO11/BRO12 ratio, which was calculated according to the following formula: BRO11/BRO12 ratio = (N11–N12)/(N11+N12) where N11 and N12 are the number of the unique genes detected in BRO11 and BRO12, respectively. SIMPER dissimilarity index was also calculated for the main relevant gene groups. It gives the average percent contribution of the different taxa/genes to the dissimilarity among samples in a Bray-Curtis dissimilarity matrix. Analysis of variance (one-way ANOVA) was used to assess the differences among soil chemical-physical properties (Tukey's test), the functional microbial communities detected by both Geochip and the enzymatic assays. A significance value of p < 0.05 was adopted for all comparisons to estimate the statistical difference between the two sites. All the statistical analyses were performed by PAST software v.3.26 (Hammer et al., 2001).
Results
Soil Pedological Survey and Chemical-Physical Analysis
The maps obtained by the interpolation of EM38-MK2 proximal sensor (ECa1 0–75 cm, map not reported; ECa2 0–150 cm, Figure 2) showed very similar apparent electrical conductivity between BRO11 (ECa2 = 22 mS/m) and BRO12 (ECa2=18 mS/m). These values were coherent with the slight difference in clay content between the sites (Table 1). The results of gamma-ray spectroscopy, summarized in Figure 2 with map of gamma-ray total counts (TC), confirmed the homogeneity of the topsoil in terms of mineralogy and texture within the area between BRO11 and BRO12 with values between 400 and 420 Bq·kg−1. The chemical-physical analysis of the soil profiles showed an overall higher fertility in BRO11, in terms of SOC, total nitrogen, CEC, Ca, K, Mg, and total sulfates (Table 1 and Table S1).
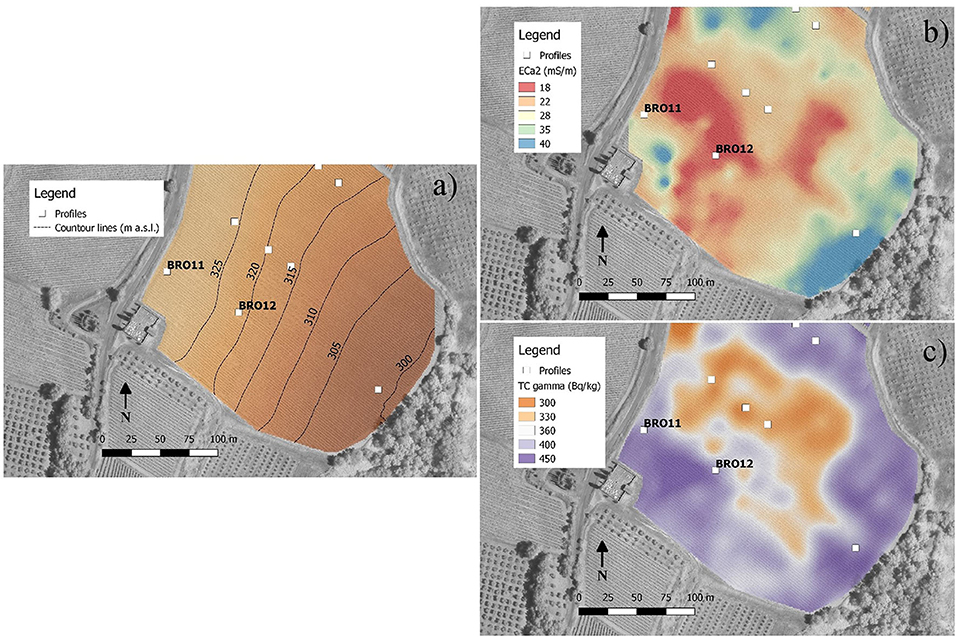
Figure 2. Maps obtained by soil proximal sensing. (a) Contour lines of elevation (m a.s.l.); (b) apparent electrical conductivity for a soil depth of about 0–150 cm (ECa2) measured by EM38-Mk2 and interpolated by ordinary kriging; (c) total counts of gamma-rays emitted from the topsoil (about 0–30 cm).
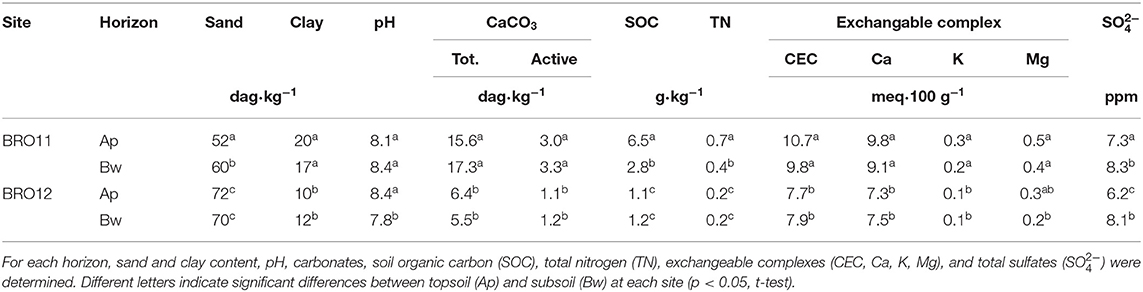
Table 1. Main soil physical and chemical properties.
Overview of the Detected Gene Diversity
The examined samples showed a different number of total detected genes, ranging from 16,688 (BRO12c) to 20,732 (BRO11b) (Table S2), showing unique and overlapping genes. In general, soils from BRO11 revealed an average gene number about 12% higher than in BRO12 (Figure 3A).
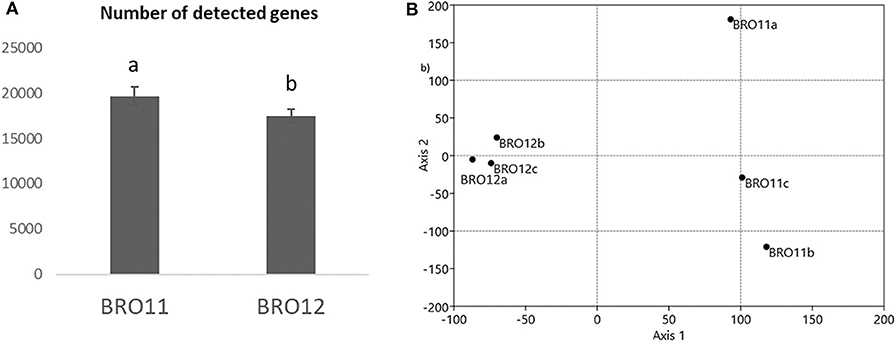
Figure 3. (A) Number of total detected genes by GeoChip analysis. Different letters indicates significant differences of the variable means between the BRO11 and BRO12 soil samples (p < 0.05); (B) detrended corresponding analysis (DCA) of the overall genes detected by GeoChip 3.0.
DCA of all detected genes categories showed that the samples from the BRO11 and BRO12 soils were clearly separated along axis 1 (Figure 3B). Moreover, BRO11 samples exhibited a high variability along axis 2. Such variability is likely related to the differences occurring among the different gene categories. Moreover, BRO11 and BRO12 samples exhibited different microbial community structure, as shown by the results of both unique and shared (overlapped) genes determined by the phylogenetic marker gyrB (Table 2). Thus, to better define the microorganisms involved in soil carbon and nitrogen cycling as well as other key soil processes, selected gene groups were further analyzed.
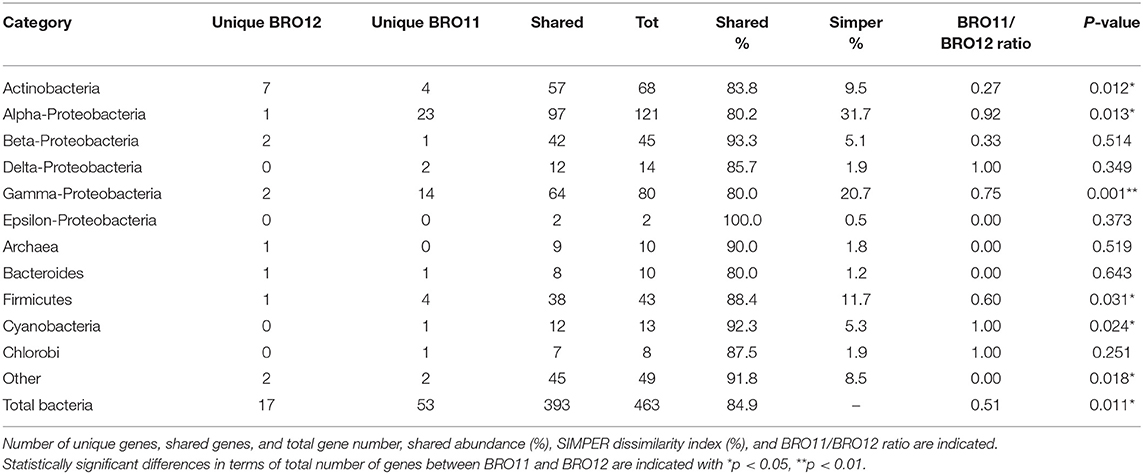
Table 2. Total microbial taxonomy (gyrB) detected in BRO11 and BRO12 soils.
Phylogenetic Structure of Soil Microbial Communities
The gyrB-based phylogenetic results showed the Proteobacteria phyla as the dominant group, accounting for over 56.6% (262 out of 463) of all the detected genes (Table 2), followed by Actinobacteria (14.7%) and Firmicutes (9.3%). Genes from Cyanobacteria (2.8%), Archaea (2.2%), Bacteroides (2.2%), Chlorobi (1.7%), and other (10.5%) were also detected. As shown in Table 2, Epsilon- and Beta-Proteobacteria had the most overlapped genes (100 and 93.3%, respectively), while Alpha- and Gamma-Proteobacteria had the fewest values (80.2 and 80%, respectively). In fact, the abundance of Alpha- and Gamma-Proteobacteria was significantly higher in BRO11 than in BRO12 (+22.4%, p < 0.05 and +18.2%, p < 0.001, respectively), as well as Firmicutes (+7.7%, p < 0.05). Conversely, Actinobacteria showed a significant enrichment in BRO12 compared to BRO11 (+4.9%, p < 0.05). Moreover, considering the overall abundance of each category, the Simper dissimilarity values indicated Alfa-Proteobacteria (31.7%), Gamma-Proteobacteria (20.7%), and Firmicutes (11.7%) as the highest diverse samples which showed the highest contribution to the overall bacterial diversity between BRO11 and BRO12 sites. Similar results were obtained by calculating the BRO11/BRO12 ratio on the unique genes, except for Alpha-Proteobacteria which exhibited the highest value (0.92). However, as the total number of the genes belonging to the different phylogenetic groups may vary considerably, the contribution of the unique and overlapping genes of BRO11 and BRO12 to the Simper dissimilarity index in all detected genes might be different. For example, the value of the BRO11/BRO12 ratio for Actinobacteria (0.27) is quite lower than for Alpha-Proteobacteria (0.92), indicating that the phylogenetic diversity within Alpha-Proteobacteria bacterial group may be higher than in Actinobacteria, despite the Simper dissimilarity values.
As expected, in general BRO11 showed a higher number of unique genes than BRO12. Interestingly, BRO12 soil showed a higher number of detected genes retrieved from Actinobacteria compared to BRO11 (7 vs. 4), including organisms such as Micrococcus luteus NCTC 2665, Mycetocola lacteus, Saccharopolyspora erythraea NRRL 2338, Rhodococcus zopfii, Gordonia bronchialis, and Rubrobacter xylanophilus DSM 9941.
On the other hand, BRO11 exhibited a higher number of unique genes belonging to Alpha-Proteobacteria (most of which belonging to Rhodobacter, Rhodospirillum, Bradyrhizobium, Jannaschia, Roseobacter, and Methylobacterium genera) and Gamma-Proteobacteria (most of which belonging to Shewanella, Alcanivorax, Enterobacter, and Pseudomonas). Remarkably, among Gamma-Proteobacteria, BRO12 showed higher presence of Acidithiobacillus ferrooxidans ATCC 23270 than BRO11.
Interestingly, among Firmicutes an enrichment in Sulfobacillus thermosulfidooxidans sp. and Anoxybacillus flavithermus WK1 was detected in BRO11 and BRO12, respectively.
Analysis of the Functional Gene Categories
The number of total detected functional genes was 24,676. Among these, 2,164 were involved in C degradation, 537 in C fixation, 37 in methane oxidation, 35 in methane production, 15 in acetogenesis, 856 in denitrification, 284 in nitrification, 255 in nitrogen fixation, 134 in assimilatory N reduction, 130 in dissimilatory N reduction, 271 in ammonification, 3 anammox, 973 in sulfur cycling, 342 in phosphorus cycling, 5,892 in organic compound remediation, 5,036 in stress process, 258 in energy process, 5,649 in metal resistance, 889 in antibiotic resistance, 858 in fungi-related activities, 1,165 in pathogens and virus, and 261 in other categories. The results revealing the most relevant differences are indicated in Figure 4.
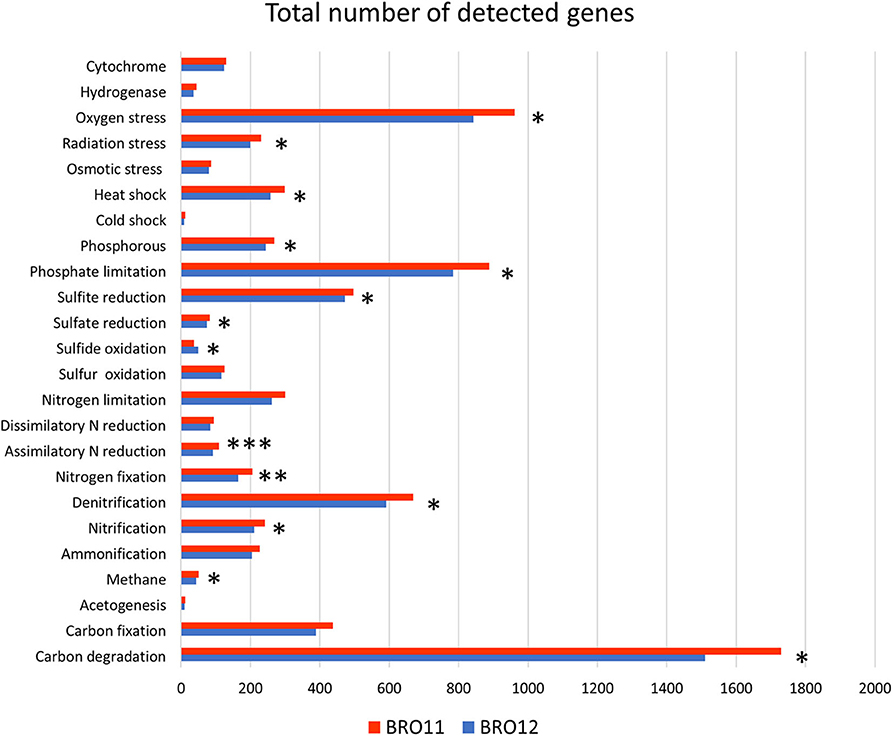
Figure 4. Results of metagenomic analysis of soils BRO11 and BRO12 by means of Geochip 3.0. The total number of the detected functional genes is reported for each gene category. Asterisks indicate significant differences of the variable means between BRO11 and BRO12 genes (*p < 0.05; **p < 0.01; and ***p < 0.001).
For each category, detected genes were analyzed by hierarchical clustering (not shown). Among the gene categories involved in biogeochemical cycles, genes related to carbon and nitrogen cycles were the most abundant. Considering that BRO11 samples showed about 12% more genes than BRO12, it is not surprising that most of the gene categories display significant higher values in BRO11 than in BRO12. Thus, besides C and N gene categories, we specifically focused the analyses on functional genes categories that highlighted contrasting patterns among BRO11 and BRO12 compared the overall distribution (i.e., sulfide oxidation category).
Carbon cycling is one of the most important and complex microbial-driven process occurring in soils. Here, a total of 2,788 genes involved in carbon cycling were detected, of which 2,164 were related to carbon degradation and 1,800 were shared between BRO11 and BRO12 soils. Overall, BRO11 showed the highest number of detected unique genes (267) compared to BRO12 (97). Among all the detected genes, carbon degradation is the most important gene category and includes several sub-categories specific for distinct organic substrates. As expected, BRO11 showed a greater number of total genes involved in C degradation than BRO12 (+8.9%, p < 0.05). In particular, the higher differences occurred in cellulose (+11.5%, p < 0.01), lignin (+12.6%, p < 0.01), chitin (+12.8%, p < 0.05), and starch (+8.6%, p < 0.05) sub-categories (Table 3). However, most of the genes of such sub-categories were shared among the two vineyards: starch (456/543), cellulose (159/190), hemicellulose (285/337), chitin (262/336), lignin (176/211), and pectin (12/16) (Table 3). Furthermore, the key enzymes involved in C fixation (CODH, pcc, rubisco, adB) are shared among the two vineyards and did not show any statistical difference.
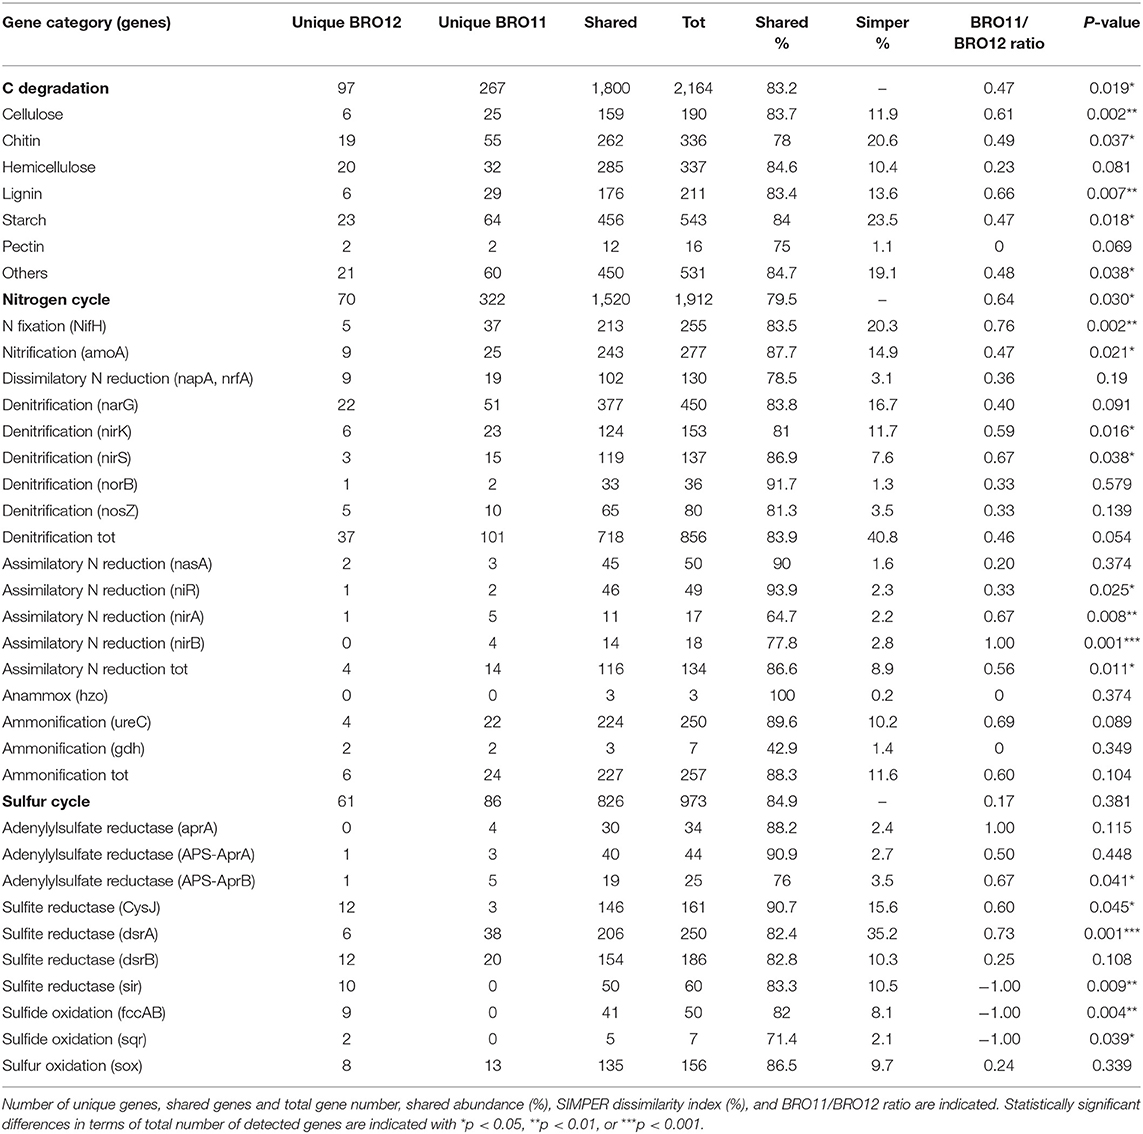
Table 3. The detected gene probes involved in carbon, nitrogen, and sulfur cycling and their main sub-categories.
Considering the nitrogen cycle, as already observed for C degradation, BRO11 soils displayed a greater number of total genes involved in N cycle than BRO12 (+15.8%, p < 0.05). A total of 1912 gene probes involved in nitrogen fixation (255), denitrification (856), nitrification (277), dissimilatory N reduction (130), assimilatory N reduction (134), ammonification (257), and anaerobic ammonium oxidation (3) were detected in BRO11 and BRO12 soils and most of them (79.5%) resulted overlapping (Table 3). Interestingly, the least shared gene number among BRO11 and BRO12 was detected in assimilatory (nirA and nirB) N reduction gene sub-category, which showed the higher statistical difference (+33.3%, p < 0.01 and +28.6%, p = 0.001, respectively; Table 3). Significant differences between BRO11 and BRO12 occurred also in nitrogen fixation and denitrification sub-categories, which are considered among the most important processes in nitrogen cycling. In the first case, the majority of nifH genes (83.5%) were shared among BRO11 and BRO12, and sub-category exhibited the highest BRO11/BRO12 ratio value (0.76), indicating that most of the unique nifH genes were found in BRO11 soils (+14.7%, p < 0.01). Similarly, some of the genes involved in denitrification such as nirK and nirS were more abundant in BRO11 soils (+9.8%, p < 0.05 and +13.1%, p < 0.05, respectively; Table 3). Moreover, also the total number of nifH and nirA genes resulted significantly higher in BRO11 than in BRO12 (+24.2%, p = 0.002 and +36.3%, p = 0.001, respectively). On the other hand, most of the functional genes involved in denitrification were shared among BRO11 and BRO12 (718/856). Among them, nirK and nirS genes provided the highest values of BRO11/BRO12 ratio (0.59 and 0.67, respectively), while narG, norB, and nosZ had lower values (0.40, 0.33, and 0.33, respectively). Interestingly, nirK and nirS were more represented in BRO11 than in BRO12 site (+24.0% and +16.5%, respectively; p < 0.05)Despite the low values of both Simper dissimilarity index and BRO11/BRO12 ratio, genes involved in ammonification (amoA) are significantly more abundant in BRO11 (+14.5%; p < 0.05).
No significant differences occurred in the other nitrogen sub-categories.
Among all the other gene categories included in Geochip 3.0, the most interesting results have been found in the sulfur cycling (Table 3). Most of the detected genes (826/973) in this category were shared among BRO11 and BRO12, and mainly related to sulfate and sulfite reduction processes (aprA, APS_AprAB, dsrA, dsrB, cysJ, sir). Hierarchical clustering analysis highlighted two groups of genes with contrasting values among BRO11 and BRO12. As shown in Figure 5, four different patterns were observed (indicated with letters A, B, C, and D): green and red color indicates all the detected genes with signal intensity below and above the average value calculated for this category, respectively. Thus, pattern A includes genes with high signal intensity in BRO11 and BRO12 soils, whereas pattern D includes genes with low signal intensity in both of them. Most of the detected genes clustered in group B were dsrA and dsrB and exhibited higher intensity in BRO11 compared to BRO12. On the other hand, in group C the highest signal intensity was provided by genes cysJ and, in minor extent, fccAB, dsrA, dsr B, and sox in BRO12 (Figure 5). Remarkably, an overrepresentation of genes involved in sulfate reduction was observed in BRO11, including aprA gene which encodes the subunit A of the adenylylsulfate reductase (EC 1.8.99.2, K00394), and dsrA and dsrB genes encoding subunits A and B of the sulfate reductase (EC 1.8.99.3, K11180, and K11181). As also indicated by the highest Simper value and BRO11/BRO12 ratio, dsrA gene was significantly more represented in BRO11 than in BRO12 (+21.4%, p < 0.001). Nevertheless, BRO12 exhibited an unusual high number of fccAB (+29.9%, p < 0.01) and sqr (+40%, p < 0.05) genes involved in sulfide oxidation compared to BRO11.
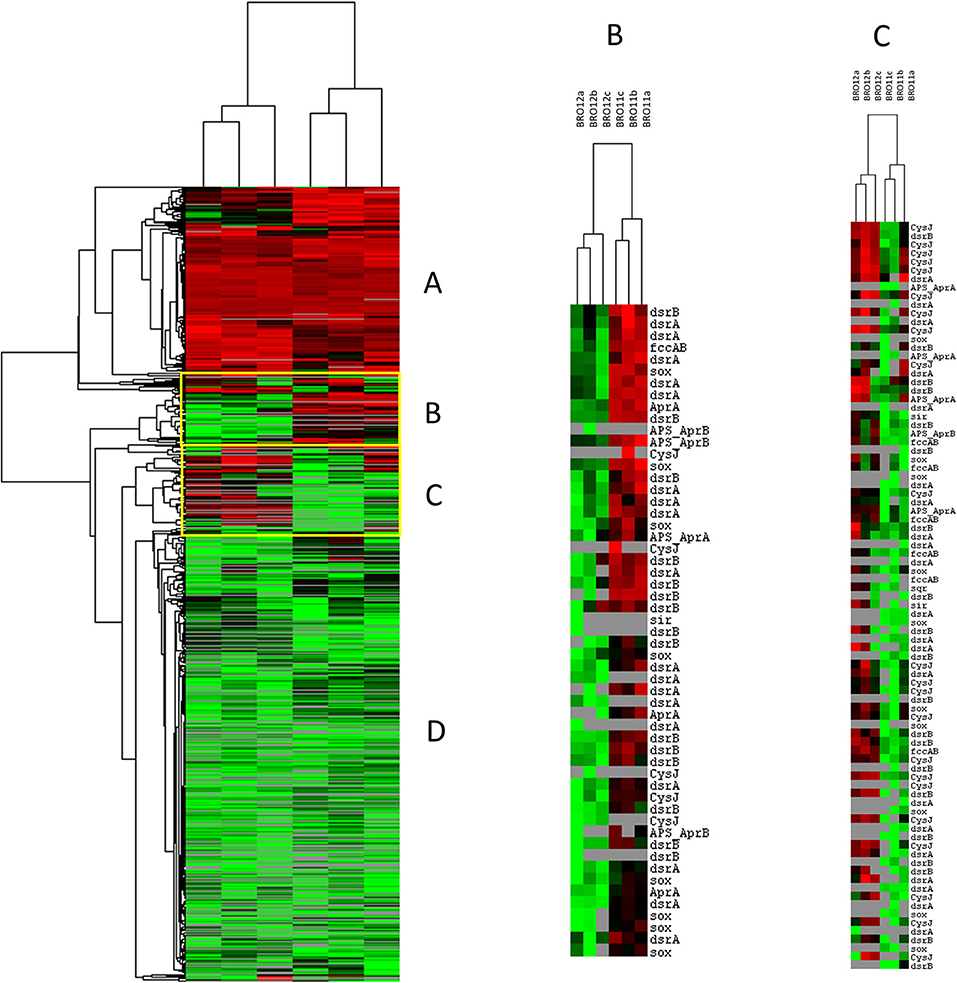
Figure 5. Clustering analysis of sulfur cycling related genes detected using GeoChip 3.0. The figure was generated using CLUSTER and visualized in TREEVIEW. Green and red colors indicate signal intensities respectively below and above the average value of the hybridization signal intensity. The samples from different soils (BRO11 and BRO12) were reported in triplicate. Four different gene patterns were observed and indicated by letters A, B, C, D.
Enzymatic Analyses
In general, BRO11 soils showed higher enzymatic activities than BRO12 (Figure 6). The activity of alkaline phosphatase (alkP) showed the highest values (180 pmol/g soil), whereas the lowest were found for arylsulfatase (8 pmol/g soil). With this regard, the higher arylsulfatase activity ratio revealed that, among the considered enzymes the arylsulfatase is the most present in BRO11. This result is consistent with the higher sulfate content in the Ap horizon of the BRO11 soil (7.26 ppm) compared to BRO12 (6.22 ppm).
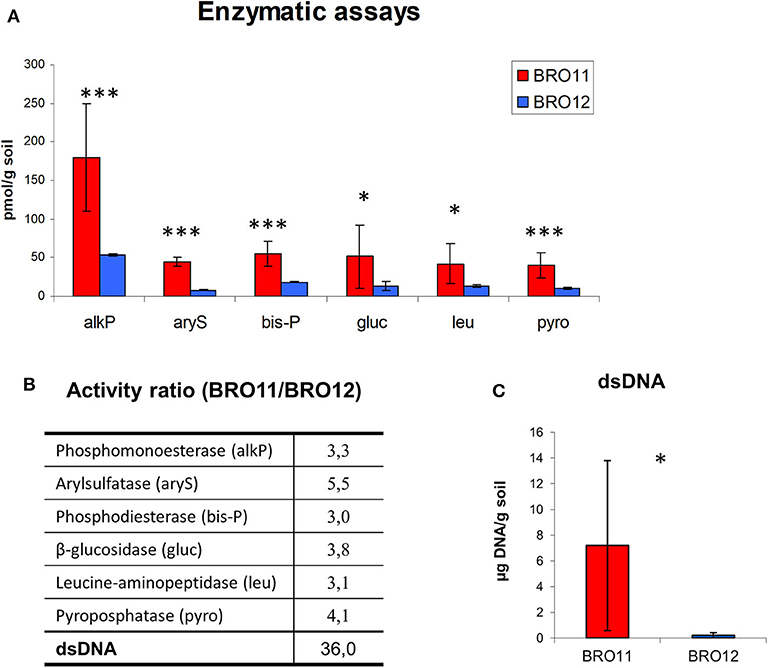
Figure 6. (A) Enzymatic activities detected in BRO11 and BRO12 soils and the amount of dsDNA extracted with the same procedure used for enzymes. Asterisk indicates significant differences of the variable means between BRO11 and BRO12 genes (p < 0.05); (B) the activity ratio among BRO11/BRO12 values indicate the relative enzymatic activity and dsDNA amount in the two soils. (C) Total amount of the dsDNA extracted from BRO11 and BRO12 soils. Asterisks indicate significant differences of the variable means between BRO11 and BRO12 sites (*p < 0.05; and ***p < 0.001).
The total amount of dsDNA extracted from the two soil with the same procedure used for enzymes was significantly different. Specifically, the extraction yield of the DNA varied among 1.8–15 μg/g soil in BRO11, while it was < 0.2 in all the BRO12 samples. This data is consistent with the higher gene number detected in BRO11.
Discussion
In the present study, we examined the microbial communities of similar soils giving rise to wines of highly disparate qualities to assess the relevance of the “microbial terroir” concept.
Thus, to figure out the role of soil microbiota and its functions in determining grape and wine quality, it was essential to minimize the environmental variability by conducting research at a within-vineyard scale, to compare microbial features among really similar soils. It does not just mean to select soils belonging to the same “soil type” category, according with the IUSS taxonomy, but it is necessary a preliminary pedological survey to assess the spatial soil heterogeneity to support soil sampling. In fact, the high spatial and temporal heterogeneity of most of soil properties and processes may vary from nano- to macroscales. For example, the physical and chemical properties might change even within soils of the same IUSS class, and the of input of labile organic compounds released by roots creates microbial hotspots over short periods of time (Kuzyakov and Blagodatskaya, 2015). Such differences in terms of soil structure, pH, nutrients availability, etc. may strongly affect the soil microbiota, both in terms of diversity and function (Fierer and Jackson, 2006; Kuramae et al., 2012; Yan et al., 2019). Nevertheless, to date most of the studies conducted to assess any correlation between soil microbiota and grapevine health and wine quality have been carried out on different sites or soils, regardless of soil heterogeneity. For example, a previous study about the composition of the soil microbiota in 19 vineyards selected from sub-appellations of the GI Napa Valley AVA, an American Viticultural Area located in California, USA has found different soil microbial community structures (Burns et al., 2015). However, the authors could not state whether the differences were merely correlated with the AVA features or if the microbiota had a direct effect on vine health and/or grape quality. Bokulich et al. (2016) showed that the wine grape-associated microbiota correlate with vineyard and pedoclimatic conditions and suggested that the grape microbiome was reflected in the fermentations thus influencing the wine qualitative traits. Similarly, another study reported that most of the bacterial communities associated with vine plants exhibited patterns highly reflective of the surrounding native soil microbiota, thus highlighting the importance of both local soil pedoclimatic factors and vineyard management in shaping their composition and structure (Zarraonaindia et al., 2015). Recently, a similar conclusion was reported by Vadakattu et al. (2019), who showed how distinct soil bacterial and fungal communities were correlated to the aroma of Shiraz grapes within the same vineyard in the Grampians region of Victoria (Australia); however, they could not detect any specific functional trait of the microbial members that accounted for these differences.
As a first study of this type, here we investigated the functional diversity of soil microbiota occurring at within-vineyard scale, after surveying soils with proximal sensors on BRO11 and BRO12 sites and confirming that such soils were very similar and spatially homogeneous, especially in the Ap horizon (0–40 cm), where soil samples for microbiological analyses were collected. Although this approach allowed us to minimize the soil variability and to link the microbial community structure and functions with grape and wine quality, the fact that we compared only two plots within the same vineyard (although with replications within the sections of the field) might represent also a limitation. In fact, more analyses should be carried out on a higher number of vineyards to make these data more robust. Another limitation might be related to the small differences in soil parameters of BRO11 and BRO12, which are similar but not identical (see Table 1 and Table S1), that might also directly affect grape quality. For example, the sand content of BRO11 is lower than in BRO12. Similarly, CaCO3, total nitrogen, total sulfate, and SOC availability in BRO12 soil were much lower than in BRO11. Moreover, in our previous research conducted on such soils to monitor the water stress over 3 years (2008-′09-′10), we found out that the grapevine water stress, determined by means of the ratio occurring among the two stable carbon isotopes 13C/12C (δ13C), was moderately higher in BRO11 despite the soil moisture monitoring provided similar results in both the profiles (Costantini et al., 2013). A possible explanation to the lower grapevine water stress of BRO12 is the shallower limit between sandy deposits, very permeable, and the underlying clayey deposits, characterized by slow water permeability. This boundary is suitable for the formation of a temporary water table or for higher soil moisture, also during dry season. According to the electrical resistivity tomography (ERT), reported by the study of Martini et al. (2013), this limit is about 10 m deep in the area of BRO11 and about 4–5 m in BRO12. Although it is unlikely that vine rooting system in BRO12 reach the water table at 4 meters depth, it is possible that the subsoil remains more humid than in BRO11. In any case, such scenario should not significantly affect the microbial community structure and activity in the topsoil, at 0–30 cm depth.
The GeoChip 3.0 microarray analyses revealed that the average gene number detected in BRO11 was about 12% higher than in BRO12. This might be likely due to the higher SOC content and the higher native dsDNA content in BRO11 soil. However, although most of the detected genes were shared among the two soils, in general they presented a different gene pattern distribution, highlighting distinct microbial traits among BRO11 and BRO12 soils. Thus, we have focused our attention mainly on the statistically significant differences occurring among the two soils and the unique phylogenetic and functional features associated to BRO11 or BRO12.
The phylogenetic structure of the microbial community based upon gyrB revealed an enrichment of bacterial taxa belonging to Actinobacteria in BRO12, whereas an increase of Alfa- and Gamma-Proteobacteria occurred in BRO11 soils. Among Actinobacteria, some of the detected taxa such as Rubrobacter xylanophilus DSM 9941 and Mycobacterium smegmatis str, MC2 155 are known to accumulate and synthetize trehalose, an organic compound able to protect bacteria from several environmental stress such as heat, salinity, oxidation, radiation, and desiccation (Nobre et al., 2008). Interestingly, threalose was reported to play as both a thermoprotectant and a precursor of critical cell wall metabolites. Thus, as many bacteria were shown to use trehalose as major organic osmoprotectant and/or thermoprotectant (Woodruff et al., 2004), we speculate that the enrichment of bacteria such as Rubrobacter xylanophilus DSM 9941 and Mycobacterium smegmatis str, MC2 155 might be related to the higher water and desiccation stress conditions found in BRO12 compared to BRO11.
On the other hand, among the bacterial taxa belonging to Alpha-Proteobacteria, most of the unique organisms detected in BRO11 belonged to Rhodobacter (i.e., R. sphaeroides and R. capsulatus) and Rhodospirillum (i.e., R. centenum and R. rubrum) genera or to Rhizobiales order (i.e., Bradyrhizobium, Mesorhizobium, and Methylobacterium genera) which are known to be involved in nitrogen-fixation process (Masepohl et al., 2002; Zhang et al., 2005; Carvalho et al., 2010), thus promoting the nitrogen availability in BRO11 compared to BRO12 soil.
Interestingly, most of the microbial taxa exclusively detected in BRO11 soil and belonging to Gamma-Proteobacteria have been reported to display extracellular electron transfer metabolism they can use under strictly anaerobic or microaerophilic conditions (i.e., Shewanella sp., Alcanivorax sp., Enterobacter sp., etc.) as well as Geobacter sulfurreducens among Delta-Proteobacteria. Such peculiar features have been reported to be potentially interesting for biotechnological purposes (Logan, 2009), but also as key mechanisms for the humification of soil organic matter (Mocali et al., 2013). Hence, their enrichment in BRO11 soil might indicate more reducing conditions than in BRO12. The higher presence of Acidithiobacillus ferrooxidans in BRO12 is likely related to its ability to oxidize iron and various reduced inorganic sulfur compounds as energy sources, thus promoting the bioleaching and the extraction of such metals from soil. More specifically, despite its ability to use sulfur as substrate to form thiosulfate S2 thus promoting sulfur oxidation, the Sox multienzyme-complex is absent in A. ferrooxidans (Janosch et al., 2015). It worth mentioning the enrichment in Sulfobacillus thermosulfidooxidans sp. in BRO11, a thermophilic and facultative anaerobe bacteria related to Firmicutes and capable of reversible oxidation of sulfur-containing compounds. Interestingly, S. thermosulfidooxidans displays similar functional properties than A. ferrooxidans, which strongly suggests that they may share the similar niche. However, the model of sulfur oxidation in S. thermosulfidooxidans has some different characteristics from the sulfur oxidation of A. ferrooxidans. In fact, it was reported that the genes involved in direct or indirect sulfite oxidation pathway are missing in S. thermosulfidooxidans whereas in A. ferrooxidans sulfites may be converted to adenosine-5′-phosphosulphate (APS) and then oxidized to sulfate via an indirect pathway controlled by APS reductase (Guo et al., 2014).
Regarding the carbon cycle, the main significant differences between BRO11 and BRO12 occurred among the genes involved in C degradation. In general, more than 80% of the genes were overlapped among the two soils and most of the unique genes occurred in BRO11, thus indicating a greater degradation potential occurring in such soil, likely due to the higher content of organic matter and microbial biomass. More specifically, BRO11 displayed higher number of genes related to the subcategories degrading chitin and starch, which showed the highest contribution to explain the differences between BRO11 and BRO12 (Table 3), according to the Simper values. However, the highest statistical differences occurred in cellulose and lignin subcategories, also in according to the BRO11/BRO12 ratio. In general, this suggests a greater mineralisation rate of organic compounds in BRO11 soils, thus providing a higher availability of nutrients than in BRO12.
Concerning the nitrogen cycling, 79.5% of the total genes (1,520/1,912) were shared among BRO11 and BRO12, whereas most of the unique genes were detected in BRO11 soil samples. The main differences occurred in the nitrogen fixation and denitrification sub-categories, also according to the BRO11/BRO12 ratio index (Table 3); moreover, according to the Simper values, together they contributed for 71.3% of the total dissimilarity among BRO11 and BRO12 (Table 3). This result is consistent with the hypothesis that BRO11 soils provide more reducing conditions than BRO12. Interestingly, as oxygen-limiting condition in soil is known to promote both N mineralization (Ono, 1989) and the activity of nitrogen-fixing bacteria, it might also be related to the greater N availability in BRO11 than in BRO12. It is important to note that in the production of red table wines, moderate nitrogen availability is one of the main factors in determining the plant health and, ultimately, the wine quality. In fact, low nitrogen supply limits berry size and vine vigor, and it increases sugar content, anthocyanins, and phenolic content, whereas excessive nitrogen supply is not desired because it increases susceptibility of grapes to gray rot (Soubeyrand et al., 2014; van Leeuwen et al., 2018). Because nitrogen also stimulates the synthesis of glutathione (a compound that preserves aroma compounds in musts and wines) and limits the production of tannins (that are involved in volatile thiol degradation), moderately high nitrogen supply to the vines is desired in wine production only in varieties dependent on volatile thiols for their aromatic signature (Choné et al., 2006).
Regarding the differences among the other functional gene categories, in general the two soils presented a very similar gene pattern distribution. Overall, BRO11 showed a higher number of detected genes than BRO12 except for genes involved in S cycling category, where a significant enrichment of sulfur- and sulfide-oxidation genes was observed in BRO12. These results suggest that S cycling, might play a key role in determining plant health and, ultimately, wine quality. Moreover, such results are consistent with the higher content of total sulfate found in BRO11 and the higher presence of sulfate transporters provided by fungi such as Sclerotinia sclerotiorum 1980 and Aspergillus terreus NIH2624 detected only in BRO11 soil, indicating a higher sulfate availability in BRO11 soil compared to BRO12. The enrichment of genes involved in sulfur oxidation in BRO12 may be due to the activities of chemolithotrophic sulfur-oxidizing bacteria such as Paracoccus denitrificans, Thiobacillus denitrificans, or Acidithiobacillus ferrooxidans, which are metabolically very flexible and capable to uptake CO2 and inorganic sulfur to support both cell basal metabolism and the acquisition of energy (Tang et al., 2009; Pokorna and Zabranska, 2015), but also to use denitrification process under oxygen-limited conditions (P. denitrificans and T. denitrificans) or to perform the solubilisation of minerals by bioleaching activity (A. ferrooxidans). P. denitrificans and T. denitrificans were more abundant in BRO11, where nir genes (niR, nirA, nirB, nirK, and nirS) were significantly enriched, confirming a greater denitrification process compared to BRO12. On the other hand, A. ferrooxidans resulted more enriched in BRO12, thus promoting the oxidation of sulfur to thiosulfate and, ultimately, to sulfate (Guo et al., 2014; Janosch et al., 2015). This result is consistent with the overexpression of sqr and fccAB genes detected in BRO12, which are involved in the sulfur and sulfide oxidation pathways, thus indicating an enhancement of oxidative reactions in S cycling of BRO12 soils.
The high BRO11/BRO12 ratio value of the arylsuphatase activity confirm a greater sulfate turnover in BRO11 than in BRO12 soils. Arylsulphatase is known to be an important enzyme promoting the hydrolysis of sulfate esters in the soil, and the ability to mobilize sulfate esters is extremely important for the survival of many soil bacterial species but it is also critical to promote plant growth (Kahnert et al., 2002; Kertesz and Mirleau, 2004). Since plants are able to uptake sulfur primarily as inorganic sulfate, reducing it to S2− and incorporating it into cysteine for protein synthesis, the most important form of sulfur for plant nutrition is (Wilhelm Scherer, 2009). Consequently, the efficient use of carbon and nitrogen in plant growth depends also on the absorption and assimilation of appropriate amounts of sulfate (Kertesz et al., 2007). Therefore, sulfur deficiency in BRO12 soils may have seriously inhibited nitrogen fixation, in accordance with literature (i.e., Anderson and Spencer, 1950), thus reducing the available nitrogen for plants.
Interestingly, plants can uptake molecules not only for protein synthesis. For example, the reduced glutathione (GSH) is a linear tripeptide constituted by glycine, glutamate and cysteine which exerts several activities in must and wine (Kritzinger et al., 2012). In fact, high GSH content in grapes is a key factor in aroma protection in several wine varieties and plays an important role in protecting varietal volatile thiols from oxidation in musts and wines (Lacroux et al., 2008). The first source of GSH is the grape, where it can exceed 200 mg/L of grape juice according to plant cultivar, pedoclimatic conditions and agronomic practices and the amount of available nitrogen in the soil (Fracassetti and Vigentini, 2018). It is well-known that a higher availability of nitrogen leads to an increase of GSH levels in berries and grape juice but also to a decrease of phenolic compounds, which are important factors for determining some wine traits and preserving volatile thiols during grape processing (Choné et al., 2006). Therefore, in addition to the well-established effects due to nitrogen limitation, we suggest that the reduced availability of nitrogen and sulfate in BRO12 soil might have reduced the GSH levels in berries and increased the amount of phenolic compared to the grapes deriving from BRO11 site. This hypothesis is also consistent with the overall VPS values related to wine quality (BRO11 = 62, BRO12 = 81) determined in our previous work (Costantini et al., 2013), as one of the main parameters used to calculate the VPS values is the phenolic compounds content (Bucelli et al., 2010; Figure 7).
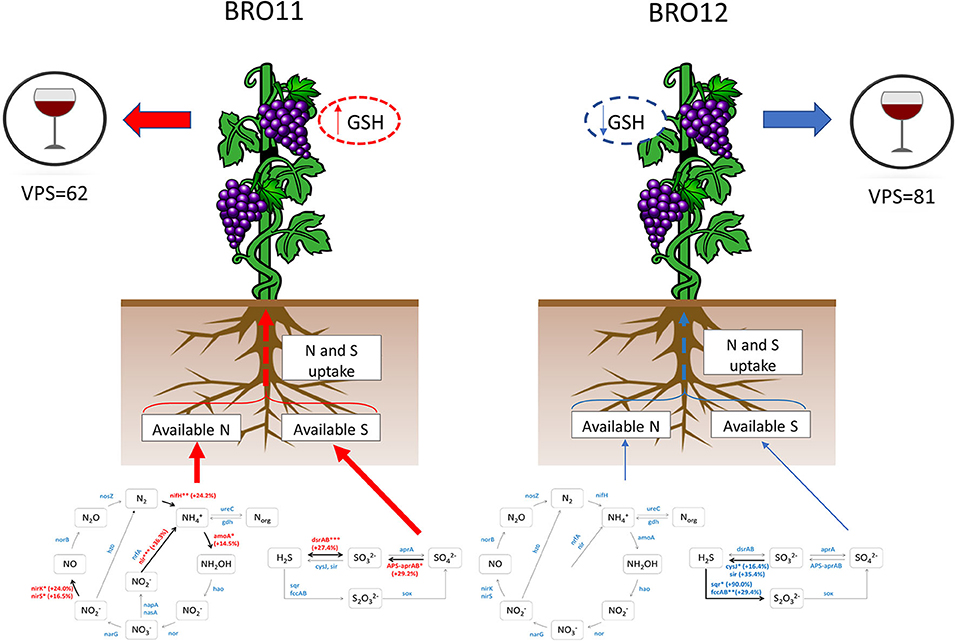
Figure 7. Schematic overview of the potential effects of the different nitrogen and sulfur availability on the plant physiology and wine quality of BRO11 and BRO12 plots. On BRO11 the higher availability of sulfate and nitrogen is supposed to enhance the plant uptake of such nutrients, thus promoting the synthesis of reduced glutathione (GSH) and reducing the phenolic compounds which determine the final wine quality (VPS). Dashed lines indicate the hypothetic effect whereas the reduced arrow's thickness in BRO12 indicates a minor amount of available nitrogen ad sulfate.
Conclusion
In this work, we assessed a possible effect of soil microbiota on wine quality through a functional approach at vineyard-scale. The metagenomic approach by Geochip 3.0 not only confirmed the key role of nitrogen availability in shaping grape and wine quality but also highlighted the potential role of the sulfur metabolism as another determining co-factor in vineyard-scale variation among wine grapes. Overall, the results represent a starting point to better unravel the complexity of plant-soil-microbial interactions behind the terroir concept supporting the existence of a “microbial functional terroir” effect. In fact, functional—rather than just genetic—microbial diversity might play a key role in the development of novel approaches in viticulture. For example, these results might open the door to new approaches in viticulture, aiming to “modulate” the plant phenotype and its related products throughout specific manipulation of plant-associated soil microbiota metabolism rather than their composition. Some recent results showed the importance of plant-associated microorganisms in regulating the plant phenotype, proposing “to approach microbiota as modulators of plant phenotype” and providing effects with strong similarities with breeding (Ravanbakhsh et al., 2019). Therefore, our results have potentially important implications for (precision) viticulture, grape growers and winemakers to better understand the potential role of the native soil microbiota in vineyards to satisfy the growing demand for high grape yield and improving specific wine traits, thus exalting the typicality and the characteristics of every single plot within the vineyard.
Data Availability Statement
The datasets generated for this study can be found in the Gene Expression Omnibus (GEO) of the NCBI (https://www.ncbi.nlm.nih.gov/geo/query/acc.cgi?acc=GSE146289).
Author Contributions
SM and SP defined the experimental design and collected the soil samples. SM prepared and conducted the GeoChip analysis and did the statistical analysis. SP carried out the pedological surveys and the soil characterization. EK and GK contributed to the discussion of molecular data. FF did the enzymatic assays. All the authors contributed to prepare the manuscript.
Funding
This work was funded by the CREA grant (Prot. No. 33122, 15/07/2013) and achieved during the research activity entitled “the study of bacterial community associated to grapevine plants grown under different water stress through the exploitation of the rhizospheric metagenome”, in collaboration with the Netherlands Institute of Ecology, Wageningen (the Netherlands).
Conflict of Interest
The authors declare that the research was conducted in the absence of any commercial or financial relationships that could be construed as a potential conflict of interest.
Acknowledgments
We thank Arturo Fabiani and Giuseppe Valboa for the technical support in preparing the DNA samples for the GeoChip analysis and determining the total sulfate content, respectively. We are grateful to Edoardo A. C. Costantini for supporting the sampling campaign and the previous work conducted on the experimental area. We are also grateful to Mattias de Hollander for his technical support in the computational analysis of data. Publication number 6975 of the Netherlands Institute of Ecology (NIOO-KNAW).
Supplementary Material
The Supplementary Material for this article can be found online at: https://www.frontiersin.org/articles/10.3389/fenvs.2020.00075/full#supplementary-material
References
Anderson, A. J., and Spencer, D. (1950). Sulphur in nitrogen metabolism of legumes and non-legumes. Aust. J. Biol. Sci. 3, 431–449. doi: 10.1071/BI9500431
Andrenelli, M. C., Fiori, V, and Pellegrini, S. (2013). Soil particle-size analysis up to 250 μm by X-ray granulometer: device set-up and regressions for data conversion into pipette-equivalent values. Geoderma 192, 380–393. doi: 10.1016/j.geoderma.2012.06.011
ASTM International (2015). C1580-09e1: Stand and Test Method for Water-Soluble Sulfate in Soil. West Conshohocken, PA: American Society for Testing and Materials.
Barata, A., Malfeito-Ferreira, M., and Loureiro, V. (2012). The microbial ecology of wine grape berries. Int. J. Food Microbiol. 153, 243–259. doi: 10.1016/j.ijfoodmicro.2011.11.025
Belda, I., Zarraonaindia, I., Perisin, M., Palacios, A., and Acedo, A. (2017). From vineyard soil to wine fermentation: microbiome approximations to explain the “terroir” concept. Front. Microbiol. 8:821. doi: 10.3389/fmicb.2017.00821
Bokulich, N. A., Collins, T. S., Masarweh, C., Allen, G., Heymann, H., Ebeler, S. E., et al. (2016). Associations among wine grape microbiome, metabolome, and fermentation behavior suggest microbial contribution to regional wine characteristics. MBio 7:e00631-16. doi: 10.1128/mBio.00631-16
Bokulich, N. A., Thorngate, J. H., Richardson, P. M., and Mills, D. A. (2014). Microbial biogeography of wine grapes is conditioned by cultivar, vintage, and climate. Proc. Natl. Acad. Sci. U.S.A. 111, E139–E148. doi: 10.1073/pnas.1317377110
Braschi, E., Marchionni, S., Priori, S., Casalini, M., Tommasini, S., Natarelli, L., et al. (2018). Tracing the 87Sr/86Sr from rocks and soils to vine and wine: an experimental study on geologic and pedologic characterisation of vineyards using radiogenic isotope of heavy elements. Sci. Total Environ. 628, 1317–1327. doi: 10.1016/j.scitotenv.2018.02.069
Bucelli, P., Costantini, E. A. C., and Storchi, P. (2010). It is possible to predict Sangiovese wine quality through a limited number of variables measured on the vines. OENO One 44, 207–218. doi: 10.20870/oeno-one.2010.44.4.1473
Burns, K. N., Kluepfel, D. A., Strauss, S. L., Bokulich, N. A., Cantu, D, and Steenwerth, K. L. (2015). Vineyard soil bacterial diversity and composition revealed by 16S rRNA genes: differentiation by geographic features. Soil Biol. Biochem. 91, 232-−247doi: 10.1016/j.soilbio.2015.09.002
Capozzi, V., Garofalo, C., Chiriatti, M. A., Grieco, F., and Spano, G. (2015). Microbial terroir and food innovation: the case of yeast biodiversity in wine. Microbiol. Res. 181, 75–83. doi: 10.1016/j.micres.2015.10.005
Carvalho, F. M., Souza, R. C., Barcellos, F. G., Hungria, M., and Vasconcelos, A. T. R. (2010). Genomic and evolutionary comparisons of diazotrophic and pathogenic bacteria of the order Rhizobiales. BMC Microbiol. 10:37. doi: 10.1186/1471-2180-10-37
Choné, X., Lavigne-Cruège, V., Tominaga, T., van Leeuwen, C., Castagnède, C., Saucier, C., et al. (2006). Effect of vine nitrogen status on grape aromatic potential: flavor precursors (S-cysteine conjugates), glutathione and phenolic content in Vitis vinifera L. Cv Sauvignon blanc grape juice. OENO One 40, 1–6. doi: 10.20870/oeno-one.2006.40.1.880
Costantini, E. A. C., Agnelli, A., Bucelli, P., Ciambotti, A., Dell'Oro, V., Natarelli, L., et al. (2013). Unexpected relationships between δ 13 C and wine grape performance in organic farming. OENO One 47, 269–285. doi: 10.20870/oeno-one.2013.47.4.1556
Cowie, A. L., Lonergan, V. E., Fazle Rabbi, S. M., Fornasier, F., Macdonald, C., Harden, S., et al. (2013). Impact of carbon farming practices on soil carbon in northern New South Wales. Soil Res. 51, 707–718. doi: 10.1071/SR13043
Deloire, A., Vaudour, E., Carey, V. A., Bonnardot, V., and Van Leeuwen, C. (2005). Grapevine response to terroir: a global approach. J. Int. Sci. Vigne Vin. 39–34, 149–162. doi: 10.20870/oeno-one.2005.39.4.888
Eisen, M, Spellman, P, Brown, P, and Botstein, D. (1998). Cluster analysis and display of genome-wide expression patterns. Proc. Natl Acad. Sci. U.S.A. 95, 14863–14868. doi: 10.1073/pnas.95.25.14863
Felder, D., Burns, D., and Chang, D. (2012). Defining microbial terroir: the use of native fungi for the study of traditional fermentative processes. Int. J. Gastr. Food Sci. 1, 64–69. doi: 10.1016/j.ijgfs.2011.11.003
Fierer, N., and Jackson, R. B. (2006). The diversity and biogeography of soil bacterial communities. Proc. Natl Acad. Sci. U.S.A. 103, 626–631. doi: 10.1073/pnas.0507535103
Fornasier, F., Ascher, J., Ceccherini, M. T., Tomat, E., and Pietramellara, G. (2014). A simplified rapid, low-cost and versatile DNA-based assessment of soil microbial biomass. Ecol. Indic., 45, 75–82. doi: 10.1016/j.ecolind.2014.03.028
Fracassetti, D., and Vigentini, I. (2018). “Occurrence and analysis of sulfur compounds in wine,” in Grapes and Wines: Advances in Production, Processing, Analysis and Valorization, eds A. M. Jordão and F. Cosme (London, UK: IntechOpen) 225. doi: 10.5772/intechopen.72823
Garofalo, C., Russo, P., Beneduce, L., Massa, S., Spano, G., and Capozzi, V. (2016). Non-Saccharomyces biodiversity in wine and the ‘microbial terroir': a survey on Nero di Troia wine from the Apulian region, Italy. Ann. Microbiol. 66, 143–150. doi: 10.1007/s13213-015-1090-5
Gessa, C., and Ciavatta, C. (2000).“Complesso di scambio,” in Metodi di AnalisiChimicadelSuolo. Ministero per le PoliticheAgricole e Forestali, OsservatorioNazionalePedologico e per la QualitàdelSuolo, 13, ed F. Angeli (Milano: Franco Ange), 1–31.
Gilbert, J. A., van der Lelie, D., and Zarraonaindia, I. (2014). Microbial terroir for wine grapes. Proc. Natl. Acad. Sci. U.S.A. 111, 5–6. doi: 10.1073/pnas.1320471110
Guo, X., Yin, H., Liang, Y., Hu, Q., Zhou, X., Xiao, Y., et al. (2014). Comparative genome analysis reveals metabolic versatility and environmental adaptations of Sulfobacillus thermosulfidooxidans strain ST. PLoS ONE 9:e99417. doi: 10.1371/journal.pone.0099417
Hammer, Ø., Harper, D. A., and Ryan, P. D. (2001). PAST: paleontological statistics software package for education and data analysis. Palaeontol. Electron. 4:9.
He, Z., Deng, Y., Van Nostrand, J. D., Tu, Q., Xu, M., Hemme, C. L., et al. (2010a). GeoChip 3.0 as a high-throughput tool for analyzing microbial community composition, structure and functional activity. ISME J. 4:1167. doi: 10.1038/ismej.2010.46
He, Z., Xu, M., Deng, Y., Kang, S., Kellogg, L., Wu, L., et al. (2010b). Metagenomic analysis reveals a marked divergence in the structure of belowground microbial communities at elevated CO2. Ecol Lett, 13, 564–575. doi: 10.1111/j.1461-0248.2010.01453.x
Jahn, R., Blume, H.P., Asio, V.B., Spaargaren, O., and Schad, P. (2006). Guidelines for Soil Description. Rome: FAO.
Janosch, C., Remonsellez, F., Sand, W., and Vera, M. (2015). Sulfur oxygenase reductase (Sor) in the moderately thermoacidophilic leaching bacteria: studies in Sulfobacillusthermosulfidooxidans and Acidithiobacilluscaldus. Microorganisms 3, 707–724. doi: 10.3390/microorganisms3040707
Jara, C., Laurie, V. F., Mas, A., and Romero, J. (2016). Microbial terroir in Chilean Valleys: diversity of non-conventional yeast. Front. Microbiol. 7:663. doi: 10.3389/fmicb.2016.00663
Kahnert, A., Mirleau, P., Wait, R., and Kertesz, M. A. (2002). The LysR-type regulator SftR is involved in soil survival and sulphate ester metabolism in Pseudomonas putida. Environ. Microbiol. 4, 225–237. doi: 10.1046/j.1462-2920.2002.00289.x
Kertesz, M. A., Fellows, E., and Schmalenberger, A. (2007). Rhizobacteria and plant sulfur supply. Adv. Appl. Microbiol. 62, 235–268. doi: 10.1016/S0065-2164(07)62008-5
Kertesz, M. A., and Mirleau, P. (2004). The role of soil microbes in plant sulphur nutrition. J. Exp. Bot. 55, 1939–1945. doi: 10.1093/jxb/erh176
Knight, S., Klaere, S., Fedrizzi, B., and Goddard, M. R. (2015). Regional microbial signatures positively correlate with differential wine phenotypes: evidence for a microbial aspect to terroir. Sci. Rep. 5:14233. doi: 10.1038/srep14233
Kritzinger, E. C., Bauer, F. F., and Du Toit, W. J. (2012). Role of glutathione in winemaking: a review. J. Agric. Food Chem. 61, 269–277. doi: 10.1021/jf303665z
Kuramae, E. E., Yergeau, E., Wong, L., Pijl, A. S., Van Veen, J. A., and Kowalchuk, G. A. (2012). Soil characteristics more strongly influence soil bacterial communities than land -use type. FEMS Microbiol. Ecol. 79, 12–24. doi: 10.1111/j.1574-6941.2011.01192.x
Kuzyakov, Y., and Blagodatskaya, E. (2015). Microbial hotspots and hot moments in soil: concept & review. Soil Biol. Biochem. 83, 184–199. doi: 10.1016/j.soilbio.2015.01.025
Lacroux, F., Trégoat, O., van Leeuwen, C., Pons, A., Tominaga, T., Lavigne-Cruège, V., et al. (2008). Effect of foliar nitrogen and sulphur application on aromatic expression of Vitis vinifera L. cv. Sauvignon blanc. OENO One 42, 125–132. doi: 10.20870/oeno-one.2008.42.3.816
Li, X., Jousset, A., de Boer, W., Carrión, V. J., Zhang, T., Wang, X., et al. (2019). Legacy of land use history determines reprogramming of plant physiology by soil microbiome. ISME J. 13, 738. doi: 10.1038/s41396-018-0300-0
Li, Y., He, J., He, Z., Zhou, Y., Yuan, M., Xu, X., et al. (2014). Phylogenetic and functional gene structure shifts of the oral microbiomes in periodontitis patients. ISME J. 8, 1879–1891. doi: 10.1038/ismej.2014.28
Loeppert, R. H., and Suarez, D. L. (1996). “Carbonate and gypsum,” in Methods of soil analysis, Part 3: Chemical Methods, ed D. Sparks (Madison, WI: SSSA and ASA), 437–474. doi: 10.2136/sssabookser5.3.c15
Logan, B. E. (2009). Exoelectrogenic bacteria that power microbial fuel cells. Nat. Rev. Microbiol. 7, 375–381. doi: 10.1038/nrmicro2113
Lu, Z., He, Z., Parisi, V. A., Kang, S., Deng, Y., Van Nostrand, J. D., et al. (2012). Geochip-based analysis of microbial functional gene diversity in a land fill leachate-contaminated aquifer. Environ. Sci. Technol. 46, 5824–5833. doi: 10.1021/es300478j
Martini, E., Comina, C., Priori, S., and Costantini, E. A. C. (2013). A combined geophysical-pedological approach for precision viticulture in the Chianti hills. Bollettino Di Geofisica Teorica Ed Applicata, 54, 165–181. doi: 10.4430/bgta0079
Masepohl, B., Drepper, T., Paschen, A., Gross, S., Pawlowski, A., Raabe, K., et al. (2002). Regulation of nitrogen fixation in the phototrophic purple bacterium Rhodobacter capsulatus. J. Mol. Microbiol. Biotechnol. 4, 243–248.
Mezzasalma, V., Sand ionigi, A., Bruni, I., Bruno, A., Lovicu, G., Casiraghi, M., et al. (2017). Grape microbiome as a reliable and persistent signature of field origin and environmental conditions in cannonau wine production. PLoS ONE 12:e184615. doi: 10.1371/journal.pone.0184615
Miura, T., Sánchez, R., Castañeda, L. E., Godoy, K., and Barbosa, O. (2017). Is microbial terroir related to geographic distance between vineyards?. Environ. Microbiol. Rep. 9, 742–749. doi: 10.1111/1758-2229.12589
Mocali, S., Galeffi, C., Perrin, E., Florio, A., Migliore, M., Canganella, F., et al. (2013). Alteration of bacterial communities and organic matter in microbial fuel cells (MFCs) supplied with soil and organic fertilizer. Appl. Microbiol. Biotechnol. 97, 1299–1315. doi: 10.1007/s00253-012-3906-6
Nobre, A., Alarico, S., Fernand es, C., Empadinhas, N., and da Costa, M. S. (2008). A unique combination of genetic systems for the synthesis of trehalose in rubrobacter xylanophilus: properties of a rare actinobacterial TreT. J. Bacteriol. 190, 7939–7946. doi: 10.1128/JB.01055-08
Ono, S. I. (1989). Nitrogen mineralization from paddy and upland soils under flooded and non-flooded incubation. Soil Sci. Plant Nutr. 35, 417–426. doi: 10.1080/00380768.1989.10434774
Pokorna, D., and Zabranska, J. (2015). Sulfur-oxidizing bacteria in environmental technology. Biotechnol. Adv. 33, 1246–1259. doi: 10.1016/j.biotechadv.2015.02.007
Priori, S., Bianconi, N., and Costantini, E. A. (2014). Can γ-radiometrics predict soil textural data and stoniness in different parent materials? A comparison of two machine-learning methods. Geoderma 226, 354–364. doi: 10.1016/j.geoderma.2014.03.012
Priori, S., Martini, E., Andrenelli, M. C., Magini, S., Agnelli, A. E., Bucelli, P., et al. (2013). Improving wine quality through harvest zoning and combined use of remote and soil proximal sensing. Soil Sci. Soc. Am. J. 77, 1338–1348. doi: 10.2136/sssaj2012.0376
Ravanbakhsh, M., Kowalchuk, G. A., and Jousset, A. (2019). Root-associated microorganisms reprogram plant life history along the growth–stress resistance tradeoff. ISME J. 13, 3093–3101. doi: 10.1038/s41396-019-0501-1
Richard, A. H., Qiu, X. Y., Wu, L. Y., Roh, Y., Palumbo, A. V., Tiedje, J. M., et al. (2001). Simultaneous recovery of RNA and DNA from soils and sediments. Appl. Environ. Microbiol. 67, 4495–4503. doi: 10.1128/AEM.67.10.4495-4503.2001
Seguin, G. (1986). ‘Terroirs' and pedology of wine growing. Experientia 42, 861–873. doi: 10.1007/BF01941763
Soubeyrand, E., Basteau, C., Hilbert, G., van Leeuwen, C., Delrot, S., and Gomès, E. (2014). Nitrogen supply affects anthocyanin biosynthetic and regulatory genes in grapevine cv. Cabernet-Sauvignon berries. Phytochemistry 103, 38–49. doi: 10.1016/j.phytochem.2014.03.024
Tang, K., Baskaran, V., and Nemati, M. (2009). Bacteria of the sulphur cycle: an overview of microbiology, biokinetics and their role in petroleum and mining industries. Biochem. Eng. J. 44, 73–94. doi: 10.1016/j.bej.2008.12.011
Vadakattu, G. V., Bramley, R. G., Greenfield, P., Yu, J., and Herderich, M. (2019). Vineyard soil microbiome composition related to rotundone concentration in Australian cool climate ‘peppery'Shiraz grapes. Front. Microbiol. 10:1607. doi: 10.3389/fmicb.2019.01607
van Leeuwen, C., Friant, P, Choné, X, Tregoat, O, Koundouras, S., and Dubourdieu, D. (2004). Influence of climate, soil and cultivar on terroir. Am. J. Enol. Vitic. 55,207–217.
van Leeuwen, C., Roby, J. P., and de Rességuier, L. (2018). Soil-related terroir factors: a review. OENO one 52, 173–188. doi: 10.20870/oeno-one.2018.52.2.2208
van Leeuwen, C, and Seguin, G. (2006). The concept of terroir in viticulture. J. Wine Res. 17:1–10. doi: 10.1080/09571260600633135
van Nostrand, J. D., Liang, Y., He, Z., Li, G., and Zhou, J. (2010a). Geochip: a high throughput genomic tool for linking community structure to functions. Handb. Hydrocarbon Lipid Microbiol. 2677–2685. doi: 10.1007/978-3-540-77587-4_198
van Nostrand, J. D., Wu, L., He, Z., and Zhou, J (2010b). GeoChips for analysis of microbial functional communities. Handb. Hydrocarbon Lipid Microbiol. 4039–4050. doi: 10.1007/978-3-540-77587-4_314
Vaudour, E. (2002). The quality of grapes and wine in relation to geography: notions of terroir at various scales, J. Wine Res. 13, 117–141. doi: 10.1080/0957126022000017981
Vaudour, E., Costantini, E., Jones, G. V., and Mocali, S. (2015). An overview of the recent approaches to terroir functional modelling, footprinting and zoning. Soil 1, 287–312. doi: 10.5194/soil-1-287-2015
Wilhelm Scherer, H. (2009). Sulfur in soils. J. Plant Nutr. Soil Sci. 172, 326–335. doi: 10.1002/jpln.200900037
Woodruff, P. J., Carlson, B. L., Siridechadilok, B., Pratt, M. R., Senaratne, R. H., Mougous, J. D., et al. (2004). Trehalose is required for growth of Mycobacterium smegmatis. J. Biol. Chem. 279, 28835–28843. doi: 10.1074/jbc.M313103200
Yan, Y., Klinkhamer, P. G. L., van Veen, J. A., and Kuramae, E. E. (2019). Environmental filtering: a case of bacterial community assembly in soil. Soil Biol. Biochem. 136:107531. doi: 10.1016/j.soilbio.2019.107531
Zarraonaindia, I., Owens, S. M., Weisenhorn, P., West, K., Hampton-Marcell, J., Lax, S., et al. (2015). The soil microbiome influences grapevine-associated microbiota. MBio 6:e02527-14. doi: 10.1128/mBio.02527-14
Zhang, Y., Li, D., Wang, H., Xiao, Q., and Liu, X. (2006). Molecular diversity of nitrogenfixing bacteria in Tibet Plateau, China. FEMS Microbiol. Lett. 260, 134–142. doi: 10.1111/j.1574-6968.2006.00317.x
Zhang, Y., Pohlmann, E. L., and Roberts, G. P. (2005). GlnD is essential for NifA activation, NtrB/NtrC-regulated gene expression, and posttranslational regulation of nitrogenase activity in the photosynthetic, nitrogen-fixing bacterium Rhodospirillum rubrum. J. Bacteriol. 187, 1254–1265. doi: 10.1128/JB.187.4.1254-1265.2005
Keywords: microbial terroir, sulfur cycling, wine quality, soil biodiversity, GeoChip
Citation: Mocali S, Kuramae EE, Kowalchuk GA, Fornasier F and Priori S (2020) Microbial Functional Diversity in Vineyard Soils: Sulfur Metabolism and Links With Grapevine Plants and Wine Quality. Front. Environ. Sci. 8:75. doi: 10.3389/fenvs.2020.00075
Received: 29 February 2020; Accepted: 18 May 2020;
Published: 17 June 2020.
Edited by:
Hannes Schmidt, University of Vienna, AustriaReviewed by:
Cornelis Van Leeuwen, Ecole Nationale Supérieure des Sciences Agronomiques de Bordeaux-Aquitaine, FranceAdemir Araujo, Federal University of Piauí, Brazil
Copyright © 2020 Mocali, Kuramae, Kowalchuk, Fornasier and Priori. This is an open-access article distributed under the terms of the Creative Commons Attribution License (CC BY). The use, distribution or reproduction in other forums is permitted, provided the original author(s) and the copyright owner(s) are credited and that the original publication in this journal is cited, in accordance with accepted academic practice. No use, distribution or reproduction is permitted which does not comply with these terms.
*Correspondence: Stefano Mocali, stefano.mocali@crea.gov.it