Thermal Analysis of Insulation Design for a Thermal Energy Storage Silo Containment for Long-Duration Electricity Storage
 Jeffrey Gifford
 Zhiwen Ma
 Patrick Davenport
- Thermal Sciences R&D, National Renewable Energy Laboratory, Golden, CO, United States
Greater renewable energy penetration requires increasing energy storage capacity. Long-duration energy storage (LDES) will be required to balance intermittent renewable energy supply with daily, weekly, and even seasonal supply changes. At these timescales, traditional electrochemical batteries become uneconomical. Solid-particle thermal energy storage (TES) is a viable solution to this issue. Solid particles can achieve higher temperatures (>1,100°C) than the molten salt used in traditional concentrated solar power (CSP) TES systems. Higher temperatures yield higher power cycle thermal-electrical conversion efficiencies. However, at these higher temperatures, greater heat loss, and insulation material cost could negate the efficiency benefits. In this work, the insulation design of a full-size 3D containment silo capable of storing 5.51 GWht for the purpose of LDES for grid electricity was thermally analyzed. Proposed operating conditions were simulated using transient FEA methods. After 5 days (120 h) of storage, <3% thermal energy loss was achieved at a design storage temperature of 1,200°C. Material thermal limits were considered and met. Sensitivity of the storage system's performance to operational, climate, and temporal changes were also studied. These changes had minimal impacts on the thermal efficiency of the system but did have meaningful implications for other aspects of the insulation design.
Introduction
As intermittent renewable energy electricity production increases, the need for larger, long-duration energy storage (LDES) technologies becomes critical to support continued grid integration. Electrochemical battery storage systems have proven to provide short duration grid services but fail to meet the economic constraints of LDES systems, which are designed to achieve days, weeks, or even longer durations of electricity storage capacity. Previous work by the authors show that thermal energy storage (TES) could best meet this growing storage need economically, and without the siting restrictions common to other traditional LDES technologies (i.e., pumped hydro, compressed air in caverns; Ma et al., 2012).
Thus far, TES systems have been successfully implemented in combination with concentrated solar power (CSP; Sioshansi and Denholm, 2010). However, TES systems are currently limited by the relatively small thermal stability ranges of oil and molten salts, the heat-transfer media (HTM) used in current CSP systems. The thermal limits of the current HTMs reduce the efficiency of the thermal power cycle that converts the thermal energy into electrical energy. Using solid particles as the HTM has grown in interest because particles can have substantially higher thermal limits, thereby increasing the efficiency of the thermal power cycle that converts the thermal energy into electrical energy (Ho and Iverson, 2014; Ma et al., 2014; Lee et al., 2015; Wu et al., 2015; El-Leathy et al., 2018). For example, increasing the HTM temperature from 650 to 1,200°C increases the Carnot efficiency from 53.8 to 75.0%, respectively, for the same cold temperature of 300°C. The higher thermal limit also increases the sensible energy storage density due to broader stability operating range, which leads to reduced storage costs.
In a standalone TES system functioning as a LDES system for grid electricity, the thermal power cycle imposes the greatest limit on the roundtrip (electrical-thermal-electrical) efficiency. Therefore, increasing the efficiency of the thermal power cycle increases the attractiveness of using TES as a LDES technology separate from CSP. A standalone TES system allows for greater flexibility as the electricity for the heater can come from any generation source thereby balancing the grid as needed; this contrasts with traditional molten salt TES systems that are sited with CSP systems. Figure 1 shows how a standalone TES system could store grid electricity. “Charging” would utilize an efficient, insulated electric particle heater, and “discharging” would use a state-of-the-art Brayton combined cycle power system (BCCP) with the working gas heated by a pressurized fluidized bed particle-to-gas heat exchanger.
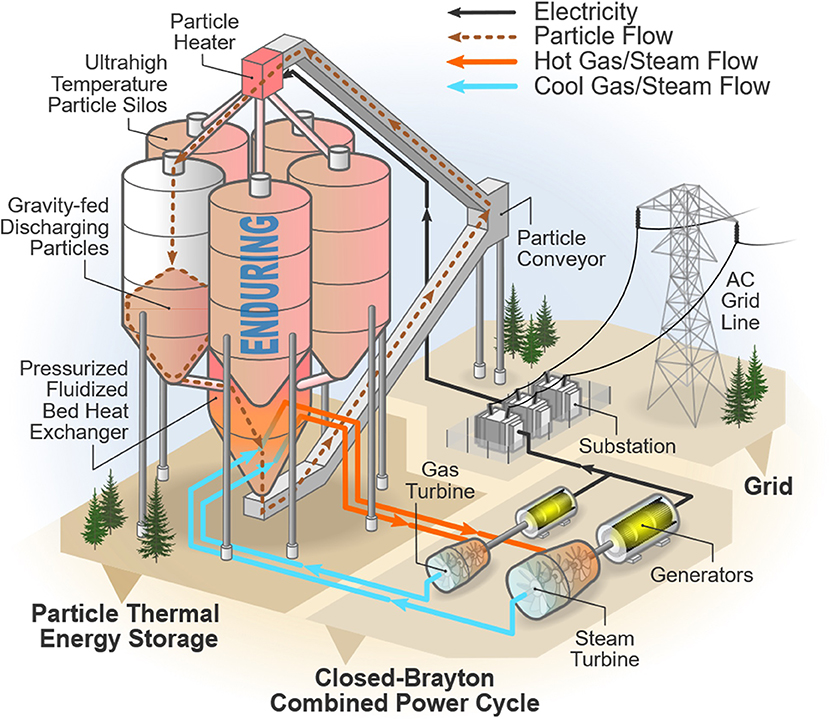
Figure 1. A concept of a standalone TES grid electricity storage system.
The BCCP system is adapted from a high-efficiency gas turbine combined cycle system. Since a BCCP system can achieve power cycle efficiencies greater than 50%, ensuring the remaining components do not limit the system's roundtrip efficiency is critical. A major component in this standalone TES system is the ultra-high temperature solid particle containment silos. A particle HTM storage temperature of 1,200°C makes the insulation design of these silos a challenge and more important in order to minimize the potential for large thermal losses from the ultra-high storage temperature. Furthermore, the insulation design must be optimized to minimize insulation costs. These challenges make the insulation design critical as thermal loss and/or insulation cost directly affect the efficiency and economics of operating this energy storage system.
To deal with these design challenges, a full-scale 3D transient thermal analysis was conducted using FEA. The use of a numerical simulation method is common for transient, multilayer insulation studies in many sectors (Mavromatidis et al., 2010; Daryabeigi, 2019). Analysis of a TES containment vessel itself has been studied several times (Avila-Marin et al., 2013; El-Leathy et al., 2014; Kim et al., 2015). El-Leathy et al. used the ANSYS Workbench software suite to conduct the FEA analysis; the same FEA software was used in this study. However, their containment temperature was under 900°C, and the goal of this study was to examine a 1,200°C containment temperature. Additionally, this study sought to improve thermal performance to 1% heat loss per day compared to the 4.4% reported by El-Leathy et al. Furthermore, the scale of the thermal energy storage vessel in this study was designed to contain significantly more energy at 5.51 GWht; this equates to around 10 h of 300 MWe after power cycle efficiency losses. Lastly, this study explored the performance of a novel silo design in contrast to the traditional tank designs.
The study sought to mimic operating conditions closely in order to measure thermal efficiency and optimize the insulation design to meet both thermal efficiency and economic targets. Proving high thermal efficiency and optimizing insulation design are critical to evaluating the technical and economic feasibility of a standalone TES system for LDES supplying grid electricity.
Thermal Insulation Modeling Method
Model Description
Geometry
The thermal energy storage silo was modeled as a large cylinder (R = 8.0 m, H = 58.0 m) with a funnel cone at the bottom. This created a total particle storage volume of roughly 12,376 m3. While this geometry does not maximize the ratio of volume to surface area in order to minimize heat losses, this geometry was chosen due to other considerations. In order for this technology to easily transition into commercialization, established construction designs were preferred. Silos for solid material storage can come in many forms; a spherical form maximizes the ratio of volume to surface area, but requires more complex and expensive construction techniques. A radius of 8.0 m for the particle domain was chosen because a radius of 10.0 m was the maximum radius contractors could quickly and cheaply, using slip-casting or slip-forming methods, construct the outer most layer of concrete; choosing a radius of 8.0 m for the particle domain allowed for up to 2.0 m of insulation. Choosing the radius of the particle domain to be close to its maximum reduces the volume to surface area as much as possible while keeping the silo design. A height of 58.0 m was chosen to ensure the thermal energy capacity of the silo was in excess of a 5.5 GWht design target.
All sides of the silo were covered in four individual layers of insulation. Various insulation designs were first analyzed using a transient one-dimensional (1D) heat equation solver. After this initial analysis, the thicknesses and material choices of the insulation layers were modified based on material cost and thermal limits. Then, a three-dimensional (3D) heat transfer model was developed for simulating the transient thermal cycles to assess the insulation performance. Figure 2 shows the overall insulation design and highlights the materials and geometry used.
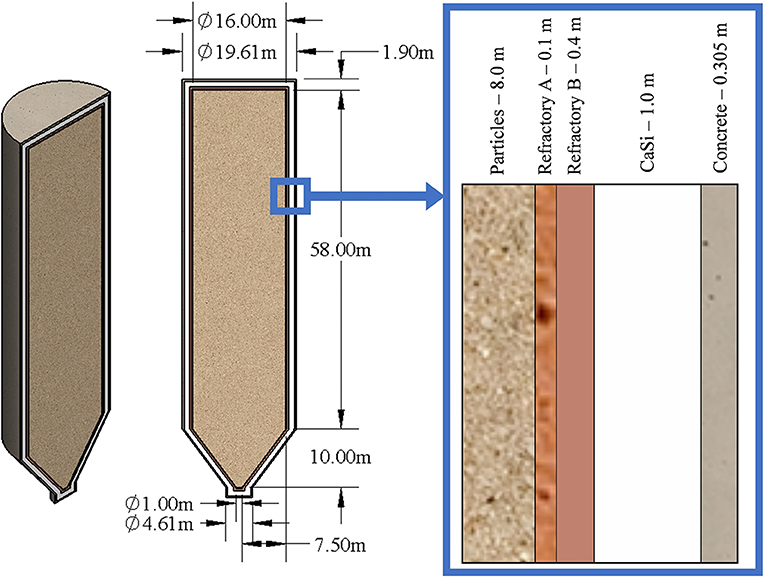
Figure 2. The full 3D silo geometry used with global dimensions and insulation material choices with the dimensions highlighted on the right. Insulation material dimensions shown are uniform thicknesses while the particle dimension shown is the particle domain's radius.
Material Properties
Table 1 shows the relevant material properties. Thermal conductivity, density, and specific heat capacity are key material properties in the heat equations being solved for in this study, see Eqs. (3,4). Refractory layers, the Refractory A and B materials in Table 1, composed the initial insulation layer that was in contact with the solid particles due to their high thermal service temperatures and overall chemical inertness. However, these materials are significantly more costly than another insulation material, Calcium Silicate (CaSi). While economic analysis was not a key focus of this study, the material costs were considered in making design decisions (i.e., favoring to maximize cheaper materials and to minimize more expensive materials).
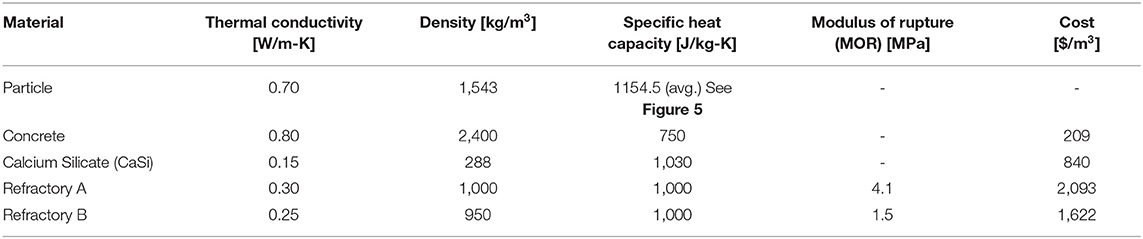
Table 1. Relevant material properties and cost of the materials used in the models.
All particle properties were measured in a packed bed configuration. The particle material properties, therefore, capture the effects of porosity due to the voids between particles. The packed bed was assumed homogeneous. Therefore, the particle properties were assumed isotropic; all other material properties were also assumed isotropic due to homogeneity. All material properties were also assumed to be isothermal, except for the particle specific heat capacity which follows a linear piece-wise function with a jump discontinuity to capture the effect of a displacive phase transition at 573°C; this is a typical phenomenon for crystalline silica, a candidate material for this technology (Chase, 1998).
Convective Heat Transfer Coefficients
A natural convective heat flux was applied to all exterior faces. Using Rayleigh, Eq. (1), and Nusselt, Eq. (2), correlations for horizontal and vertical plates, heat transfer coefficients (HTCs) could be calculated and applied to the top, bottom, and side surfaces. Table 2 shows the parameters used and the resulting HTCs.
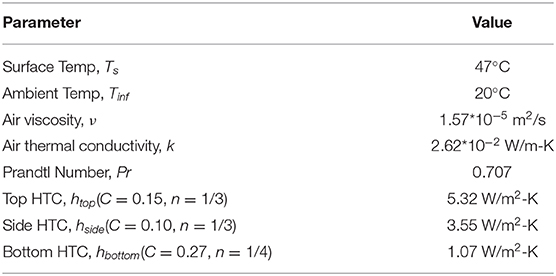
Table 2. Parameters used for and results of natural convection HTC calculations.
Thermal Cycle Profile
The 3D model simulated a total of 10 operating cycles, see Figure 3. This was done to simulate start up conditions as well as eliminate transient effects between cycles. Therefore, steady-state operating conditions could be simulated and analyzed. A single operating cycle consisted of four subsequent steps: (1) Charge, (2) Storage, (3) Discharge, and (4) Recovery. Each step's initial condition was the result from the final time step of the previous step in the cycle, with the charge step being initialized using the end of the recovery step from the previous cycle.
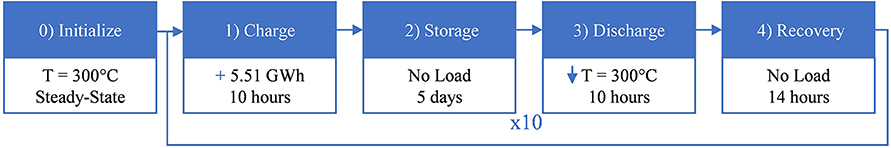
Figure 3. Diagram of how operating conditions were modeled with an initialization step and four-step cycles. The primary thermal effect applied to the particle domain and the length of the operating step are listed. All steps include the constant HTCs on the respective exterior walls.
Charge steps consisted of raising the bulk particle temperature by 900°C based on the bulk average particle temperature at the end of the prior recovery step. The bulk average particle temperature is computed as a volume-weighted average over the entire particle domain. A constant temperature increase of 900°C simulated a constant quantity of electrical energy input equivalent to raising the particle temperature from 300 to 1,200°C for every cycle. This temperature rise occurred over a 10-h time period, the length of the charge step.
Storage steps simulated a 5-days energy storage time where no charging or discharging occurs. No thermal load was applied except for the constant convective heat transfer on the exterior surfaces; this convective heat transfer was present during all operating steps.
Discharge steps consisted of decreasing the bulk particle temperature back to 300°C no matter what the ending bulk average particle temperature was at the end of the storage step. As the cold temperature of the proposed power cycle was 300°C, this simulated all the particles being discharged to the pressurized-fluidized bed heat exchanger and returned to the silo at their cold temperature. Similar to the charge step, this occurred over a 10-h time period.
Recovery steps, the final step of a single operating cycle, leveraged the thermal mass of the insulation over a 14-h time period. This step had potential to improve thermal performance by “preheating” the particles prior to the charging step using the thermal energy contained within the insulation layers that cooled slower than the particles during discharging. Furthermore, practically, there may be gaps between charging and discharging steps during system operation. Thereby including the recovery step captures this potential operating condition. The importance and sensitivity of the recovery step will be analyzed in this study.
Mathematical Description
Transient, 1D Model
A partial differential equation solver was built to solve the transient, 1D heat equation for the storage operating step to save computational time during the initial insulation design screening process. The main goal of this model was to ensure material thermal limits were not being exceeded as well as if the insulation could hold a reasonable exterior wall temperature, defined as 40–50°C. Energy efficiency calculations would be calculated based on the results from the full 3D model as the particle temperature was allowed to cool; in the 1D model, the particle temperature was fixed at 1,200°C.
The 1D heat equation with no heat generation that was solved by this model was
The thermal properties were considered temperature-independent in this 1D model but changed depending on material hence the position dependence. The full 1D problem description can be found in Figure 4. As the domain is not expected to reach steady-state at the end of the 5-days storage time, the initial conditions do matter. The initial conditions were determined by first finding the steady-state temperature profile for an interior wall temperature of 300°C. The average temperature of each material's domain was then set to the initial conditions for the case with a wall temperature of 1,200°C. In practice, and in the full 3D model, the particles would actually cool some near the wall (i.e., Twall in Figure 4 would be less than the prescribed 1,200°C). As this 1D model was primarily for initial screening purposes, this slight deviation from actuality was deemed acceptable.
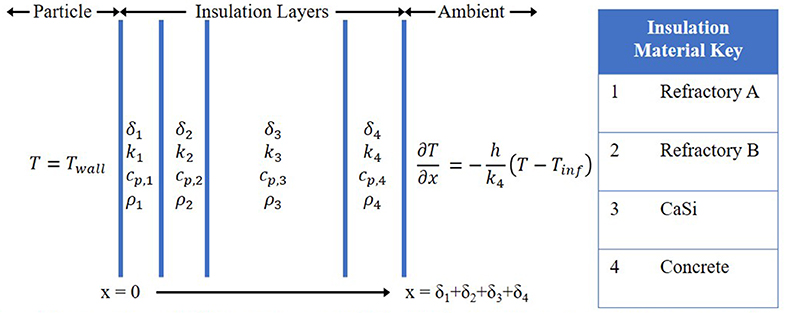
Figure 4. Diagram of transient lD heat equation model with fixed wall inside wall temperature and natural convective flux on exterior surface. Material properties were assumed constant. Insulation thicknesses (δi) were the design parameters. h = 3.55 W/m2-K.
The 1D partial differential equation was solved using MATLAB's pdepe solver (Mathworks, 2019).
Transient, 3D Model
The full 3D model was performed in ANSYS Mechanical's Transient Thermal FEA tool (Ansys Inc, 2019a). The geometry for the 3D model was built in SpaceClaim (Ansys Inc, 2019b); the full geometry was sliced in half along of the line of symmetry to reduce computational load. A high-quality, fine mesh was generated; the mesh where mesh independence was reached consisted of roughly 28,450 elements with 31,330 nodes.
ANSYS Mechanical is a finite element analysis software that is capable of analyzing structural and thermal problems. The energy conservation equation solved by Mechanical was given as
Again, the material properties (i.e., cp, ρ, and k) were functions of position to account for the different materials present in the domain, and all properties were assumed isotropic because all materials were considered homogeneous (i.e., the spacing between particles were considered uniform throughout the domain). The non-isothermal behavior for the specific heat of the particles can be found in Figure 5. The literature data was linearized in the model based on the very accurate linear regression lines.
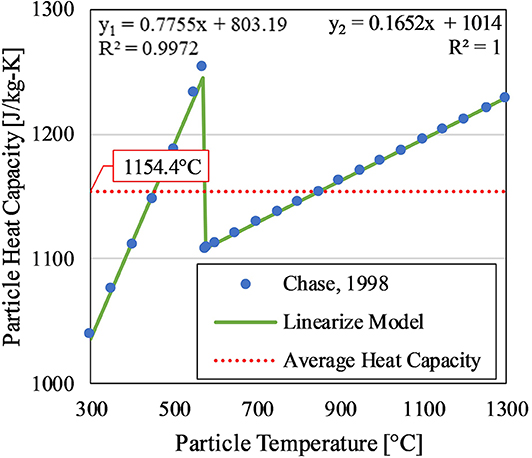
Figure 5. Temperature-dependence of the particle's heat capacity. The linear equations y1 and y2 correspond to the linear regression lines for the lower (<573°C) and higher (>573°C) temperature ranges, respectively. The linearized model was based off silica heat capacity profiles from Chase (1998). The average heat capacity was the average over the operating range of 300–1,200°C.
Energy Balance and Thermal Efficiency
The total thermal energy storage in the particles at any given time t was defined as
The total amount of energy input (per silo) during each charge step was given by
where ΔTavg = 1,200 – 300°C = 900°C.
The total amount of energy output (per silo) during each discharge step was given by
where Tdis, 0 was the bulk average particle temperature at the start of the discharge cycle and the average heat capacity, cp,avg, was the average heat capacity over the temperature range of that specific step.
The steady-operation energy efficiency of the thermal energy storage was given by
Where Qout, 10 was the amount of energy output during the discharge step of cycle number 10, a cycle where steady-state operation had been achieved. This measure of efficiency was chosen because it captured the energy lost due to the storage system and ambient convection.
Results and Discussion
Insulation Design Iteration
Various insulation designs were first studied using the simplified, transient 1D thermal model to screen for potential designs; this saved significant computing time. For the initialization step, an arbitrarily large end time was set for the pdepe solver to ensure the model reached steady state (e.g., tf = 24 days). At this simulation time, the temperature profile remained unchanged during the final half of the simulation, therefore a steady state temperature profile had been achieved.
Using the final temperature profile from this initializations step, the storage step could be simulated. An exemplary case generated Figure 6.
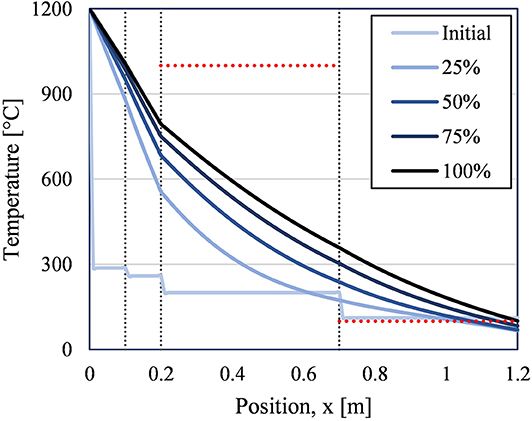
Figure 6. 1D temperature profiles from storage step (120 h) for different points in time from exemplary case (Refractory A = 0.1 m, Refractory B = 0.1 m, CaSi = 0.5 m, concrete = 0.5m). Vertical lines mark changes in insulation material. Horizontal red lines mark material temperature limits for CaSi (1,000°C) and concrete (100°C).
In Figure 6, the initial condition was taken from the initialization results and can be seen as the palest blue line (Initial). Steady state conditions were not achieved in the much shorter time scale of this simulation, 5 days, compared to the steady-state simulation, 24 days. These results clearly show that for this specific insulation design the CaSi stays well below its thermal limit, while concrete greatly exceeds its thermal limit. Furthermore, the exterior wall temperature approaches 100°C. In the full 3D simulation, this would result in substantial heat loss through convection that would translate into a lower average particle temperature and therefore lower thermal efficiency for the storage silo. Thus, additional iterations were performed to improve the insulation performance from this example case until a possible suitable design was found.
Based on the results for the exemplary case above, significantly thicker insulation was required to bring the maximum concrete and exterior temperature down to meet design constraints. After several iterations, an acceptable design was found. The transient temperature profiles for this design is shown in Figure 7.
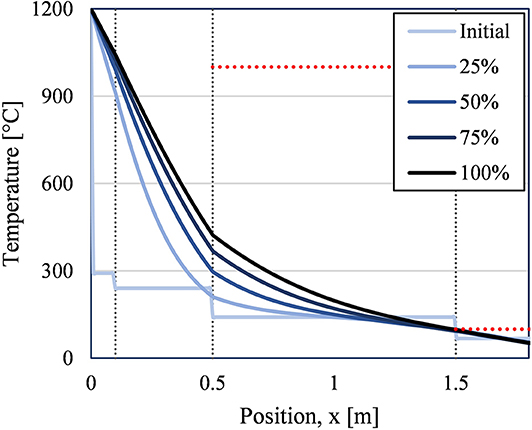
Figure 7. 1D temperature profiles from storage step (120 h) for different points in time for an acceptable case (Refractory A = 0.1 m, Refractory B = 0.4 m, CaSi = 1.0 m, concrete = 0.305m). Vertical lines mark changes in insulation material. Horizontal red lines mark material temperature limits for CaSi (1,000°C) and concrete (100°C).
Both the Refractory B (layer 2) and CaSi (layer 3) layers were thickened to 0.4 and 1.0 m up from 0.1 and 0.5 m, respectively. The concrete layer was also slightly thinned to 1 ft (0.305 m), this reduced the possible temperature difference across the concrete, and therefore reduced the maximum concrete temperature at the CaSi-concrete interface. The maximum concrete temperature at the end of 5 days was 97°C and the exterior wall temperature was 51°C.
Due to economic considerations, a design choice was made to limit the thickness of the Refractory A (Layer 1) because it is about 25% more expensive than the Refractory B, see Table 2. However, while eliminating Refractory A would have been economically preferred, Refractory A was still required as the initial layer for its high erosion resistance compared to Refractory B. Therefore, a compromise between these two competing design considerations resulted in a thin (0.1 m) Refractory A layer then wrapped in a thicker (0.4 m) Refractory B layer. Other economically driven design choices were also made; thicker insulation designs were analyzed, but their increase in performance did not warrant the corresponding increase in insulation cost. Therefore, the insulation design presented in Figure 7 was the insulation design chosen to be analyzed using the full, 3D transient model.
Operating Cycle Convergence
Before analysis of the results could be conducted, 10 operating cycles had to be verified as enough cycles to reach steady-operating conditions. To ensure this, the convergence of four key temperatures (average particle temperature at the end of each storage step, average particle, maximum CaSi, and maximum concrete temperatures at the end of each recovery step) was tracked. Convergence was defined as a less than 0.1% change from the previous cycle. After the eighth cycle, all of these values had met this convergence criteria. The convergence continued to improve in subsequent cycles. Therefore, the results for cycles nine and 10 were deemed representative of steady-operating conditions.
Insulation Design Performance
Energy Efficiency
In Figure 8, the bulk average particle temperature is shown over progressive operating cycles. Initially, each successive cycle had a slightly higher temperature profile, but after the fourth cycle, the particle temperature did not change significantly.
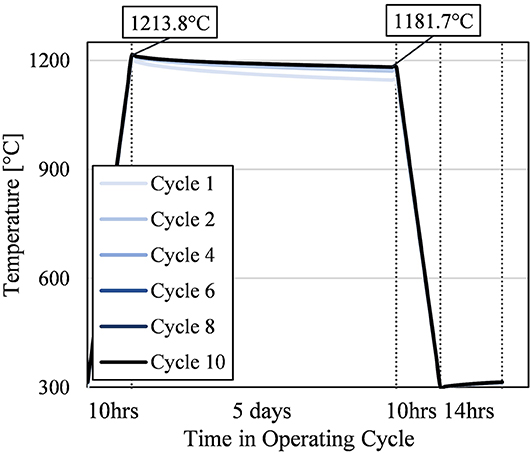
Figure 8. Bulk average particle temperature over selected operational cycles; not all cycles are presented for conciseness. Vertical dotted lines mark changes in operating step; x-axis is not to scale.
From Figure 8, the particle temperature at the end of the storage step of the final cycle was 1181.7°C. This equates to 5.40 GWht remaining in the particle or a round trip thermal efficiency for the storage silo of 98% after 5 days of storage. This performance achieved the original design target of <5% efficiency loss after 5 days of storage (i.e., average 1% loss per day of storage). Longer storage lengths would also have similarly high round trip thermal efficiencies because of the plateauing particle temperature. Half of the temperature decrease between the start and end of the storage step occurs in the first quarter of the storage period.
As this design exceeds the design target, a technoeconomic analysis should be performed to find if the high performance was worth the opportunity cost of foregoing a potentially cheaper, slightly poorer performing insulation design. Based on this design, the raw insulation material cost came to $6.2 million per silo. However, a full economic analysis was not within the scope of this study. While the energy efficiency design target was met, the material thermal limits needed to be checked, see Section Thermal Design Within Material Temperature Limits.
Effect of Recovery Step
Figure 8 also shows that the temperature reached after charging in the final cycles was 1213.8°C. That meant the recovery step consistently increased the average particle temperature about 14°C; this equates to 76.7 MWht (based on average heat capacity over 300–315°C range) or 1.39% of the energy input during the charging phase, 5.51 GWht. That is not an insignificant amount of thermal energy recaptured by adding the recovery step instead of immediately recharging the cooled particles.
Figure 9 shows how the recovery step recuperated energy from the thermal mass of the insulation layers. At the start of the recovery step (i.e., end of discharge cycle or “Initial” in Figure 9), the particles were significantly cooler than the Refractory A and Refractory B insulation layers because they cooled much more rapidly due to discharging than the thermal response time of the passive insulation layers. Therefore, by delaying the next charging cycle, thermal energy could be transferred into the particle domain, especially to the particles near the wall. This can be seen by the temperature decreasing in the Refractory A and Refractory B layers in Figure 9, and the particle temperature correspondingly increasing near the wall as the recovery step progresses to completion (i.e., tf = 14 h).
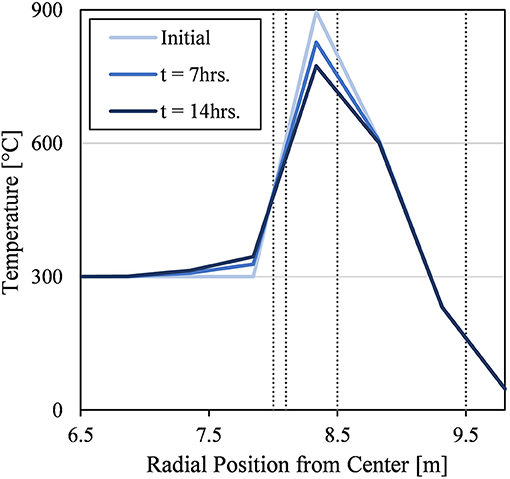
Figure 9. lD temperature profile along the radial direction at the midplane of the silo during the tenth recovery step. The initial condition from the final time step of the prior discharge step. Gray lines mark changes in material (from left to right): Particle, Refractory A, Refractory B, CaSi, and Concrete.
Thermal Design Within Material Temperature Limits
While the energy efficiency of the insulation was vital to the design, the material thermal limits cannot be exceeded. Concrete and CaSi were the two materials in this insulation design with thermal limits, 100 and 1,000°C, respectively, that were within the operating temperature range of the domain (20–1,214°C); Refractory A and Refractory B have thermal limits of 1,370 and 1,260°C, respectively. Figure 10 shows that the maximum temperature of the CaSi and concrete never exceed their respective thermal limits; the maximum temperature reached by each material was 836.8 and 92.3°C, respectively. As expected, the maximum temperature reached by the concrete was indeed slightly lower than the maximum temperature predicted by the 1D model due to the particles being able to cool in this 3D model. The CaSi maximum temperature predicted by the 3D model was higher than the 1D model predicted. If the 1D model was run for several operating cycles similar to the 3D model, the two models may have agreed better. Nonetheless, the CaSi maximum temperature was still far below its thermal limit.
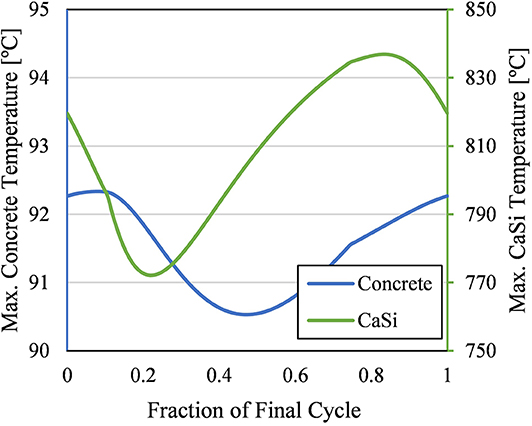
Figure 10. Maximum temperatures of concrete (left) and CaSi (right) throughout the final cycle. The thermal limits of concrete and CaSi are 100 and 1,000°C respectively.
The maximum temperature of both materials had steady, periodic oscillations throughout each operational cycle. The concrete maximum temperature only oscillated by 1.8°C during the final operational cycle. This small cycling temperature means the concrete would not experience much thermal fatigue from thermal expansion and contraction during operation. The CaSi maximum temperature oscillations were significantly larger, about 64.7°C. CaSi does have a relatively small thermal expansion coefficient, so this temperature change may not warrant much thermal fatigue. However, expansion joints may be required to reduce stress of the insulation layers.
Sensitivity Analysis of Insulation Design
Upon obtaining a successful simulation, sensitivity analysis was performed to evaluate the flexibility of the model and the validity of the presented results under different operating conditions. Three aspects of the operating conditions were changed, and their effects analyzed.
1) Recovery Time (±50%)
2) Climate (25°C, 10°C)
3) Temporal Ambient Conditions (Tinf = f(t)).
Sensitivity to Recovery Time
While the time and conditions for the first three steps of the operating cycle (i.e., charge, storage, and discharge) were mostly fixed constraints, the time of the recovery step was not fixed, but was set at an arbitrary length. Therefore, it was important to validate the results, or see how much they could change, if the length of the recovery time was changed. Also, if a different recovery time performs better, that would also valuable information. Therefore, the recovery lengths for all 10 cycles were decreased or increased by 7 h to new lengths of 7 or 21 h, respectively; this represented a 50% change from the initial recovery time in both directions. All other parameters and operating conditions were held constant, convergence and material thermal limits were tracked.
As expected, Figure 11 shows the quantity of energy recovered during the recovery step increased for the longer recovery case (i.e., Energy Recovered). While the average particle temperature only changed +3.24 and −4.98°C for the longer and shorter recovery cases, respectively, those are significant temperature changes; the longer case recovers 45.6 MWht more energy than the shorter case. However, increasing the length of the recovery step indefinitely will have diminishing returns. Contrastingly, decreasing the length of the recovery step will have disproportionally negative effects. For an equal 50% change in the length of the recovery step, the shorter and longer recovery cases impacted the absolute quantity of energy recovered by 36.0 and 23.4%, respectively. This was expected as Figure 8 shows a plateauing trend of the average particle temperature during this step.
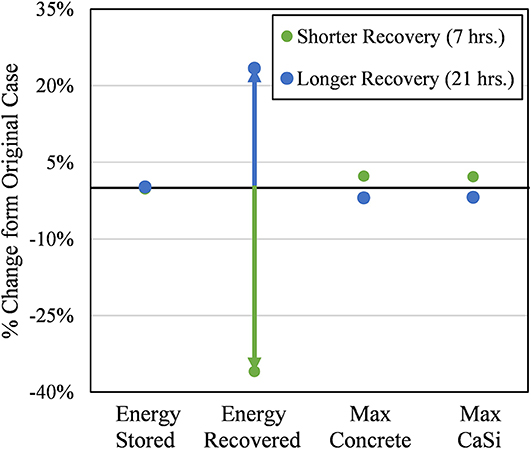
Figure 11. Sensitivity of key results to a 50% longer (to 21 h) and shorter (to 7 h) from the original recovery length (14 h). Energy stored refers to the quantity of thermal energy remaining in the particles at the end of the last storage cycle. Energy recovered refers to the quantity of thermal energy recovered by the particles at the end of the last recovery cycle. Max. Concrete and CaSi refer to the absolute maximum point temperature over the final cycle for the respective materials.
Figure 11 also shows the relative change in quantity of energy remaining in the silo at the end of the storage step (i.e., Energy Stored). This value remains largely unchanged from the original case for both cases; 0.14 and −0.26% for the longer and shorter cases, respectively. This means, overall, the energy efficiency of the thermal energy storage does not change significantly for different recovery lengths. The disproportional changes in the average particle temperature at the recovery step discussed prior were dampened by the relatively much longer 5-days storage step. This was important to note as it gives operators at least a 14-h window (7–21 h) to decide when to begin a charging cycle after discharging without having a significant impact on the overall performance of the system. However, it should be noted that the recovery step still had significant benefits in energy efficiency, but after 7 h, the growth in benefits from longer recovery times diminished.
Lastly, there was minimal impact on the absolute maximum concrete and CaSi temperatures. The shorter recovery length resulted in both of these values increasing; the longer recovery length had the opposite effect (i.e., lower maximum CaSi and concrete temperatures). In the shorter recovery length, the maximum concrete and CaSi temperatures still met their design targets by never exceeding 94.4 and 854.9°C, respectively.
Sensitivity to Climate
One key feature of TES for LDES is that it is free from the geographical or geological requirements that constrain traditional LDES technologies. The technology needs to be deployable in many different climate regions. Therefore, analyzing the current insulation design's sensitivity to different climates is valuable information for the wide deployment of TES for LDES. In order to do this, the ambient air temperature (previously 20°C) was increased and decreased to 25°C (annual average temperature of Miami, FL, USA) and 10°C (annual average temperature for Chicago, IL, USA), respectively; two cities in two very different climate regions of the U.S.
Figure 12 shows that the biggest impact from changing the climate was on the maximum concrete temperature. Hotter and colder climate temperatures change the absolute maximum concrete temperature by +5.0% (up to 97.0°C) for a 25% ambient temperature increase and −10.1% (down to 83.0°C) for a 50% ambient temperature decrease, respectively. All other key variables were not significantly impacted by this change; the next highest change had a magnitude of 0.27%. This result verified the insulation design and this technology can indeed be used in many different climates without a change in energy efficiency—since the particle temperature at the beginning of the discharge step (i.e., end of storage step) remained practically unchanged.
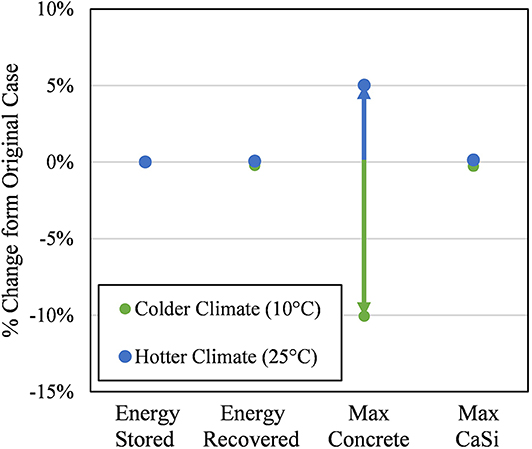
Figure 12. Sensitivity of key results to colder (l0°C) and hotter (25°C) climates relative to their value from the original climate case (20°C). Energy stored refers to the quantity of thermal energy remaining in the particles at the end of the last storage cycle. Energy recovered refers to the quantity of thermal energy recovered by the particles at the end of the last recovery cycle. Max. Concrete and CaSi refer to the absolute maximum point temperature over the final cycle for the respective materials.
However, special attention should be paid to the maximum concrete temperature in hotter climates and especially seasons within a climate. Not many climates have sustained outdoor temperatures above 25°C but verifying the insulation design for these particular climates would be required, as well as possibly a different insulation design.
Sensitivity to Temporal Ambient Conditions
While the previous analyses kept ambient air temperature at fixed climate averages, this analysis looked at the system's response to temporally varying ambient conditions. A sinusoidal ambient temperature was applied to the exterior walls; the temperature varied daily between 10 and 30°C at midnight and noon, respectively. Mathematically, when t is in seconds, the ambient temperature, Tinf in degrees Celsius, follows Eq. (9). The HTCs were kept constant at their values found in Table 2 as the average ambient temperature was 20°C. This temporal ambient temperature was applied at the beginning of the Charge step and continued through all operational steps. The initial condition for this scenario was the end of the Recovery step of the 10th cycle.
This prescribed ambient condition had insignificant effect on the overall energy efficiency of the system; the particle temperature at the end of the storage cycle was unchanged from 1181.7°C. This meant the established thermal mass of the silo dominated the thermal behavior of the system.
Where the temporal ambient conditions did have a significant effect was on the exterior wall, as shown by Figure 13. The exterior wall average temperature oscillations followed slightly behind the ambient temperature oscillations. The exterior wall average temperature was always greater than the ambient temperature; this means, on average, the heat flux was overwhelmingly leaving the exterior surface. However, at the hottest points of the day (i.e., when Tinf = 30°C), certain areas of the exterior surface had small heat flux into the exterior surface.
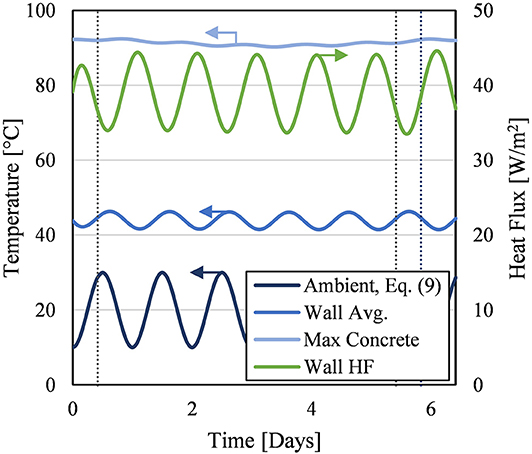
Figure 13. Key results of temporally varying ambient conditions. Blue curves represent temperatures (left axis). Green curve represents heat flux (right axis). The “Wall Avg.” and “Wall HF” are area-weighted averages of temperature and heat flux, respectively, over the entire exterior surface of the silo. Positive heat flux means heat leaving the exterior wall to the ambient. Gray vertical lines mark changes in operating step.
In addition to the exterior surface, the effect of the temporal ambient conditions on the maximum concrete temperature can be found in Figure 13. Most importantly, the thermal limits of the concrete were still not exceeded. The maximum concrete temperature does show some oscillatory behavior, but not a significant amount. The effect of the temporal ambient condition already significantly dampened before it reached the inner layer of concrete, where the maximum concrete temperature occurred.
Uncertainties and Next Steps
This study focused on the modeling of thermal insulation performance. The work is, therefore, limited to provide useful insights into the feasibility of long-duration energy storage using particle-based TES. The model was developed to simulate a large-scale TES thermal performance to understand the operational cycle and thermal losses. With mature commercial FEA software used, the uncertainty between the modeled results and field performance primarily lies on the assumed operating conditions (e.g., wind speed, ambient temperatures), the material properties (e.g., temperature-dependence of thermal conductivity and heat capacity), and the structure after construction (e.g., material morphology, interface contact among the layers). Thus, the model may not be able to capture those physical constrains yet. With such a large-scale storage silo, the modeling results can only be validated after the actual facilities would be built. However, a laboratory scale prototype of the storage silo is in the plan to be developed for validating a small-scale model against experimental results. The future study will help to identify and characterize the uncertainty factors enumerated above; the results of which will be used to improve the confidence of the large-scale model presented in the current study.
Conclusion
This study found and analyzed a potential feasible insulation design for an ultra-high temperature, particle TES silo for LDES for grid electricity. A full-scale, 3D, transient thermal model was built and used to simulate conceptual operating conditions. Sensitivity analysis showed the overall performance of the system was relatively consistent against changes in ambient conditions, climate, and operating conditions; round trip thermal efficiencies of the containment silos were close to 98% for all cases. This study showed, from a thermal perspective, that this technology has potential as an efficient, cost-effective energy storage method as intermittent renewables continue to grow their share of electricity generation. Future work on the silo design will focus on technoeconomic and structural analyses to further optimize the insulation design as well as the development of a small-scale model validated with experimental results to characterize uncertainties in the model.
Data Availability Statement
The datasets generated for this study are available on request to the corresponding author.
Author Contributions
JG developed the 1D and 3D models, analyzed the results, and wrote the manuscript. ZM guided the development of the models and analyses. PD provided the general silo and insulation design from which the model grew, provided the materials and their associated properties, and assisted in the designing and analysis of the models.
Funding
This work was authored by the National Renewable Energy Laboratory, operated by Alliance for Sustainable Energy, LLC, for the U.S. Department of Energy (DOE) under Contract No. DE-AC36-08GO28308. Funding provided by U.S. Department of Energy Advanced Research Projects Agency—Energy DE-FOA-0001906 under work authorization number 18/CJ000/07/05.
Conflict of Interest
The authors declare that the research was conducted in the absence of any commercial or financial relationships that could be construed as a potential conflict of interest.
Acknowledgments
The authors would like to thank ARPA-E for funding this work. In addition, the authors would like to thank Matthew Lambert from Allied Minerals Products for insightful discussions.
The views expressed in the article do not necessarily represent the views of the DOE or the U.S. Government or any agency thereof. Neither the United States Government nor any agency thereof, nor any of their employees, makes any warranty, expressed or implied, or assumes any legal liability or responsibility for the accuracy, completeness, or usefulness of any information, apparatus, product, or process disclosed, or represents that its use would not infringe privately owned rights. The U.S. Government retains and the publisher, by accepting the article for publication, acknowledges that the U.S. Government retains a nonexclusive, paid-up, irrevocable, worldwide license to publish or reproduce the published form of this work, or allow others to do so, for U.S. Government purposes.
References
Ansys Inc (2019a). Mechanical Enterprise. Available online at: https://www.ansys.com/products/structures/ansys-mechanical-enterprise (accessed March 5, 2020).
Ansys Inc (2019b). SpaceClaim. Available online at: http://www.spaceclaim.com/en/default.aspx (accessed March 5, 2020).
Avila-Marin, A. L., Alvarez-Lara, M., and Fernandez-Reche, J. (2013). A regenerative heat storage system for central receiver technology working with atmospheric air. Energy Procedia 49, 705–714. doi: 10.1016/j.egypro.2014.03.076
Chase, M.W. J. (1998). NIST-JANAF thermochemical tables. J. Phys. Chem. Ref. Data Monograph 9:1–1951.
Daryabeigi, K. (2019). AIAA 2001-2834 thermal analysis and design of multi-layer insulation for re-entry aerodynamic heating. 35th AIAA Thermophysics Conference. Anaheim. doi: 10.2514/6.2001-2834
El-Leathy, A., Al-Ansary, H., Jeter, S., Djajadiwinata, E., Alaqel, S., Golob, M., et al. (2018). Preliminary tests of an integrated gas turbine-solar particle heating and energy storage system. AIP Conference Proc. 2033, 1–10. doi: 10.1063/1.5067049
El-Leathy, A., Jeter, S., Al-Ansary, H., Abdel-Khalik, S., Roop, J., Golob, M., et al. (2014). Thermal performance evaluation of two thermal energy storage tank design concepts for use with a solid particle receiver-based solar power tower. Energies 7, 8201–8216. doi: 10.3390/en7128201
Ho, C. K., and Iverson, B. D. (2014). Review of high-temperature central receiver designs for concentrating solar power. Renew. Sustain. Energy Rev. 29, 835–846. doi: 10.1016/j.rser.2013.08.099
Kim, H., Park, D., Park, E. S., and Kim, H. M. (2015). Numerical modeling and optimization of an insulation system for underground thermal energy storage. Appl. Ther. Eng. 91, 687–693. doi: 10.1016/j.applthermaleng.2015.08.070
Lee, T., Lim, S., Shin, S., Sadowski, D. L., Abdel-Khalik, S. I., Jeter, S. M., et al. (2015). Numerical simulation of particulate flow in interconnected porous media for central particle-heating receiver applications. Solar Energy 113, 14–24. doi: 10.1016/j.solener.2014.12.017
Ma, Z., Glatzmaier, G., and Mehos, M. (2014). Fluidized bed technology for concentrating solar power with thermal energy storage. J. Solar Energy Eng. 136:031014. doi: 10.1115/1.4027262
Ma, Z., Glatzmaier, G. C., and Kutscher, C. F. (2012). The thermal energy storage solution. Solar Today, 26, 22–26.
Mathworks (2019). Pdepe. Available online at: https://www.mathworks.com/help/matlab/ref/pdepe.html?searchHighlight=pdepe&s_tid=doc_srchtitle (accessed March 5, 2020).
Mavromatidis, L. E., Michel, P., El Mankibi, M., and Santamouris, M. (2010). Study on transient heat transfer through multilayer thermal insulation: numerical analysis and experimental investigation. Build. Simulat. 3, 279–294. doi: 10.1007/s12273-010-0018-z
Sioshansi, R., and Denholm, P. (2010). The Value of Concentrating Solar Power and Thermal Energy Storage in a Production Cost Model. Technical Report NREL-TP-6A2-45833 (Vol. 1) (Golden, CO: National Renewable Energy Laboratory). doi: 10.2172/973964
Keywords: thermal energy storage, long-duration electricity storage, particle thermal energy storage, renewable energy, FEA
Citation: Gifford J, Ma Z and Davenport P (2020) Thermal Analysis of Insulation Design for a Thermal Energy Storage Silo Containment for Long-Duration Electricity Storage. Front. Energy Res. 8:99. doi: 10.3389/fenrg.2020.00099
Received: 17 December 2019; Accepted: 05 May 2020;
Published: 16 June 2020.
Edited by:
Rangan Banerjee, Indian Institute of Technology Bombay, IndiaCopyright © 2020 Gifford, Ma and Davenport. This is an open-access article distributed under the terms of the Creative Commons Attribution License (CC BY). The use, distribution or reproduction in other forums is permitted, provided the original author(s) and the copyright owner(s) are credited and that the original publication in this journal is cited, in accordance with accepted academic practice. No use, distribution or reproduction is permitted which does not comply with these terms.
*Correspondence: Jeffrey Gifford, jeffrey.gifford@nrel.gov