
Abstract
Objective. To explore the impact of different electrical stimulation profiles in human recipients of the Geneva-Maastricht vestibular implant prototypes. Approach. Four implanted patients were recruited for this study. We investigated the relative efficacy of systematic variations of the electrical stimulus profile (phase duration, pulse rate, baseline level, modulation depth) in evoking vestibulo-ocular (eVOR) and perceptual responses. Main results. Shorter phase durations and, to a lesser extent, slower pulse rates allowed maximizing the electrical dynamic range available for eliciting a wider range of intensities of vestibular percepts. When either the phase duration or the pulse rate was held constant, current modulation depth was the factor that had the most significant impact on peak velocity of the eVOR. Significance. Our results identified important parametric variations that influence the measured responses. Furthermore, we observed that not all vestibular pathways seem equally sensitive to the electrical stimulus when the electrodes are placed in the semicircular canals and monopolar stimulation is used. This opens the door to evaluating new stimulation strategies for a vestibular implant, and suggests the possibility of selectively activating one vestibular pathway or the other in order to optimize rehabilitation outcomes.
Export citation and abstract BibTeX RIS

Original content from this work may be used under the terms of the Creative Commons Attribution 4.0 license. Any further distribution of this work must maintain attribution to the author(s) and the title of the work, journal citation and DOI.
1. Introduction
Bilateral vestibulopathy is a heterogeneous disorder resulting in many disabling symptoms, including imbalance, oscillopsia (visual illusion of motion of the environment), reduced mobility, and increased risk of falling. It has even been associated with cognitive impairments [1–3]. Consequently, the quality of life of patients with bilateral vestibulopathy is significantly impaired [4]. Unfortunately, the prognosis is poor and currently available treatment options have very low efficacy, resulting in significant socio-economic impact [5, 6].
Vestibular implants are implantable devices that attempt to partially restore vestibular function to patients with severe bilateral vestibulopathy of peripheral origin, using electrical currents [7, 8]. The concept of the vestibular implant mimics those of cochlear implants. A motion sensor (gyroscope) is used to capture head rotations. This motion information is then used to modulate electrical currents which are directly delivered to vestibular afferents via implanted electrodes, in an attempt to replace semicircular canal function. Early demonstrations of the feasibility of the concept were first provided in animal models by Cohen and Suzuki [9–11] and were later verified in humans [12, 13]. Since then, several groups have undertaken significant research efforts in the field, providing proof of concept both in animal and human experiments [14–26]. Recently, the concept of the vestibular implant has extended to also target the otolith organs, which sense linear accelerations, including gravity [27]. The concept is being meticulously investigated in animal models [28] and one team has even begun experimental trials in human subjects [29].
Our group, the Geneva-Maastricht team, developed an original concept based on a modified cochlear implant. This device, developed in close collaboration with MED-EL (Innsbruck, Austria), provides 1 to 3 extra-cochlear electrodes which are implanted in the vicinity of vestibular afferents in addition to the 'standard' cochlear implant array [30]. We started implantations in humans in 2007 and, to date, 13 patients with severe bilateral vestibulopathy were implanted with these prototype devices without surgical or medical complications [8, 30, 31]. Note that, for ethical reasons, all the implanted ears were deaf [8, 25]. The cochlear implant part of the device is used chronically by the patients. The vestibular electrodes are activated only during acute experiments in controlled laboratory settings.
Special surgical techniques were developed for safe implantation of these devices and their feasibility was demonstrated [32–37]. First experiments revealed the surprising adaptation capabilities of the human vestibular system to sudden, steady-state electrical stimulation provided by the vestibular implant [38]. Successful restoration of the vestibulo-ocular reflex in the mid- to high- frequency range could then be established [39–42]. These results have been recently confirmed by a group at the Johns Hopkins School of Medicine, who also showed that the artificial vestibulo-ocular reflex could be restored in all three semicircular canal planes and even after long, chronic periods of electrical stimulation [43]. We also showed that it is possible to activate the vestibulo-collic reflex, and that controlled postural responses can be obtained with our prototype vestibular implant device [31, 44]. Finally, visual abilities in dynamic settings were restored with the vestibular implant [45]. The latter is a major step forward, providing the first ever demonstration of useful rehabilitation of this patient population.
All the above mentioned milestones raise high hopes on the potential of the device. However, in order to achieve optimum efficacy, a number of issues still need to be addressed. One of particular interest relates to the best electrical stimulation paradigm that might allow selective and precise control of the different vestibular pathways. Studies in chinchillas showed that increasing both pulse rate and pulse amplitude resulted in increasing velocity of the evoked vestibulo-ocular reflex [18]. However, increasing pulse amplitude also resulted in increasing misalignment, presumably because of current spread to neighboring structures. Shorter pulses appeared as an effective means to reduce charge requirements, and interphase gaps had no significant effect on vestibulo-ocular reflex responses. Different modulation strategies have also been investigated in chinchillas and Rhesus monkeys [22, 46]. Pulse amplitude modulation resulted in faster eye movements than pulse rate modulation. The fastest eye responses were achieved when co-modulating rate and amplitude simultaneously, both in the excitatory and inhibitory directions. On this basis, together with fundamental knowledge on the physiology of vestibular afferents, the same group implemented special stimulation paradigms that were validated in modelling studies [47, 48] as well as in animal experiments and are currently investigated in a prospective clinical trial in humans [43] (ClinicalTrials.gov Identifier: NCT02725463).
Our group, using a different approach, decided to implement a basic stimulation paradigm based on our first acute experiments in humans. In those experiments we identified that current amplitude modulations of a charge balanced, cathodic-first, biphasic pulse train (phase durations of 200–400 μs and rates of 200–400 pulses-per-second—pps) were an effective paradigm to evoke controlled vestibulo-ocular responses [49]. We also decided, as a first approximation, to assume a linear relationship between electrical stimulation and the evoked eye movement response. However, even though we were successful in achieving good results with our straight-forward stimulation strategy, it is necessary to carefully explore the influence of the stimulation paradigm in order to improve outcomes. For example, in our above-mentioned experiments, we observed that other non-linear relationships (e.g. logarithmic) could be useful to improve the symmetry of the vestibulo-ocular responses [39, 41, 50]. Other groups have chosen to use transfer functions inspired from the physiological response of vestibular afferents of Rhesus monkeys [51, 52].
This paper presents a first attempt to systematically investigate the influence of the basic stimulation parameters of the electrical stimulus in humans. For this purpose, we pushed this characterization beyond the traditionally investigated vestibulo-ocular reflex, and we investigated the activation of the vestibulo-thalamo-cortical pathway (responsible for conscious perception). Our precise goal was to compare the different relationships between electrical stimulation and the strength of activation of each pathway.
2. Methods
2.1. Subjects, device, and surgery
Four patients with a severe bilateral vestibulopathy, having received a vestibular implant prototype, participated in this study. Details on the inclusion criteria, device and surgical procedures can be found in previous publications [8, 30, 39]. Briefly, the device consisted of a modified cochlear implant (MED-EL, Innsbruck, Austria) providing 1 to 3 extra-cochlear electrodes for vestibular stimulation (table 1). These vestibular electrodes were implanted in the vicinity of the lateral, posterior and superior ampullary branches of the vestibular nerve (respectively LAN, PAN and SAN) using an intralabyrinthine or extralabyrinthine surgical approach [32, 34, 35]. Note that some of the electrodes were not tested during the experiments presented here (grayed out in table 1). The PAN electrodes of S3 and S4 were not used since they did not evoke any vestibular responses even at the highest current levels available for safe stimulation. This lack of response could be due to post traumatic fibrotic changes in the ampulla of the PAN due to intraotic temporal bone fracture. The availability of S4 for these experiments was limited, therefore the patient was only able to complete the variable pulse rate experiments with the SAN electrode.
Table 1. Main demographic characteristics of the four patients participating in the study.
| Age at | Year | Implanted | Vestibular | Surgical | Electrode | Testing | Maximum compliant | ||||
|---|---|---|---|---|---|---|---|---|---|---|---|
| Patients | Sex | Etiology | Onset | implantation | implanted | side | electrodes | approach | impedances [kΩ] | period | current amplitude [µA] |
| S1 | M | Idopathic | Progressive | 68 | 2007 | left | PAN | EL | 3.96 | 17.11.2014–21.01.2015 | 1200 |
| S2 | M | Congenital/idopathic | Progressive | 46 | 2008 | left | PAN | EL | 8.05 | 23.11.2014–13.01.2015 | 700 |
| S3 | F | Traumatic | Acute (<1 year) | 67 | 2013 | left | PAN/LAN/SAN | IL | 1.80/2.95/3.36 | 16.10.2014–12.11.2014 | 1200 |
| S4 | M | Traumatic | Acute(3 years) | 53 | 2015 | right | PAN/LAN/SAN | IL | 3.33/1.24/2.83 | 26.05.2015–27.05.2015 | 1200 |
| M—male | PAN—posterior ampullary nerve | EL—extralabyrinthic[32–34] | |||||||||
| F—female | LAN—lateral ampullary nerve | IL—intralabyrinthic [35] | |||||||||
| SAN—superior ampullary nerve | |||||||||||
All patients were recruited at the Division of Otorhinolaryngology and Head and Neck Surgery of the Geneva University Hospitals.
Note that only one vestibular electrode was activated at a time for a given experimental trial. All cochlear electrodes were switched off during the experimental procedures.
2.2. Experimental paradigm
The basic electrical stimulation profile consisted of trains of charge-balanced, cathodic-first biphasic pulses. The parameters under investigation were: current amplitude (0 to the maximum allowed by the electrode impedance and the implant compliance limits, see table 1), phase duration (50, 100, 200, and 400 μs), and pulse rate (100, 200, 400, and 800 pulses-per-second—pps). We evaluated the effect of either phase duration or pulse rate at a time, while the other was held constant. This paradigm is useful for evaluating the effect of one without biasing it with the effect of the other. For the variable phase duration experiments, we set the pulse rate to 400pps. For the variable pulse rate experiments, we set the phase duration to 200 µs. These parameters were chosen for consistency with our previous results, where they have shown to be an effective stimulation profile for the vestibular implant [30, 31, 39, 41, 42, 44, 45, 49, 53].
The setup for electrical stimulation was composed of a desktop computer running custom-made research software (Matlab R2014b, The Mathworks Inc., Natick, Massachusetts, USA) that allowed precise control of stimulation parameters (current amplitude, pulse rate, number of pulses/pulse train duration, and phase duration). The computer communicated this information to the implanted stimulator via the manufacturer's Research Interface Box II (RIBII, MED-EL, Innsbruck, Austria) and the cochlear implant system's antenna.
For each patient, each electrode, and each parameter set, we first determined the dynamic range (DR), from perception threshold up to the upper comfortable level (UCL). The procedure is illustrated in figure 1(a). Each electrode was stimulated with brief pulse trains of 2 s duration. Each experiment started with a pulse train with zero amplitude. Then, current amplitude was gradually increased by 25–50 µA steps. After each pulse train, the patient had to report the intensity of the percept using the clinical 0–8 visual-analog scale (0–no perception, 8—too strong) used for fitting cochlear implant patients in our center. Patients were also asked to describe the percept (open question), and only percepts that could be identified as vestibular were considered. For example auditory percepts (i.e. evoking sound) were not considered in the computation of the vestibular dynamic range (see 30 for details on the nature of reported percepts). For the next stimulation trial, the current amplitude was increased by steps of 25–50 µA. The UCL was set either when the patient's perception reached a level of 7, or at the current level immediately below which undesired effects (i.e. facial nerve activation, uncomfortably loud sound) were observed. A similar procedure was previously described [30].
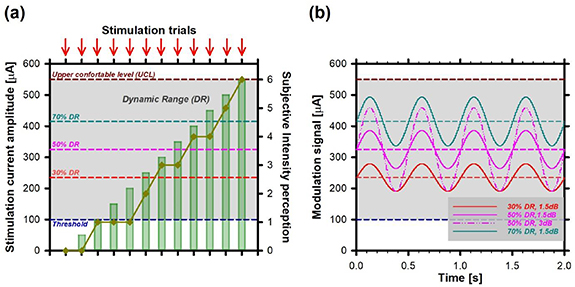
Figure 1. Schematic illustration of the experimental procedure for determination of the efficacy of the stimulation paradigm. (a) Determination of the dynamic range (DR) for a given stimulation profile. The threshold (dark blue dotted line) and UCL (dark red dotted line) were measured by consecutive increases of the current amplitude (green bars) of the stimulating pulse train, delivered to one of the vestibular electrodes. The reported DR was the current range between these two values (grey shaded area). Note that the threshold and UCL were determined using subjective reports from the patient, on a 0–8 visual analog scale (dark yellow plot) after each stimulation trial (red arrows). (b) Vestibulo-ocular responses were evaluated at three baseline levels: 30% (red dotted line), 50% (pink dotted line), and 70% (cyan dotted line) of the DR using sinusoidal modulation profiles with a frequency of 2 Hz. The effect of modulation depth was investigated using two amplitude levels of the modulation signal: 1.5 dB (solid lines) and 3 dB (dash-dotted line, only for a baseline of 50% of the DR). The data shown were simulated for illustration purposes, and although representative, do not correspond to particular results of any given patient.
Download figure:
Standard image High-resolution imageVariable pulse rate and variable phase duration experiments were done on different experimental sessions, to limit adaptation effects and subjects' fatigue. All experiments reported here were carried out within three months of the first experimental session, depending on the availability of the patients and on the number of tested electrodes. The precise testing periods per patient are provided in table 1. The order of the tested parameters was the same across patients (short to long phase durations, slow to fast pulse rates). Note that this experimental protocol tended to favor performance for stimulation profiles involving less electrical charge (e.g. short phase durations and slow pulse rates) due to potential adaptation effects. However, this effect was very small in our previous studies [39, 40, 50].
Once the DR was established, we evaluated vestibulo-ocular responses obtained upon modulation of the electrical stimulus delivered via the vestibular electrodes. Using video-oculography (EyeSeeCam; EyeSeeTec, Munich, Germany), eye movements were assessed in two dimensions. As previously shown and discussed this represents a reasonable alternative to the more complex 3D eye movement analysis [30]. The generation of bi-directional eye movements in a given plane (i.e. leftwards and rightwards, upwards and downwards) with unilateral electrical stimulation requires that a baseline or 'resting' activity of the vestibular nerve be restored. This baseline activity can be restored using trains of biphasic pulses of a given rate and amplitude [39, 40]. The detailed stimulation procedure was previously described [38, 39]. Briefly, patients first received a continuous baseline electrical stimulation on their vestibular electrode until all vestibular symptoms and signs (e.g. vertigo, nystagmus) disappeared (about 30 min). This corresponds to an 'adapted' state. Then the amplitude of the electrical stimulation can be up- and down-modulated to generate bi-directional eye movements.
For each tested parameter set (pulse rate and phase duration), we evaluated the effect of varying the baseline level on the evoked vestibulo-ocular responses using three baseline levels (BL) with amplitudes corresponding to 30% of the DR, 50% of the DR and 70% of the DR.
The influence of modulation depth (i.e. amplitude of the modulation signal) on the evoked vestibulo-ocular responses was evaluated using modulation signals with a sinusoidal profile. We chose a frequency of 2 Hz (see figure 1(b)) because (1),it is within the frequency range of head movements where the vestibular system predominates, (2) [54–56] it is within the critical range of head movements during everyday activities such as walking [57–59], and (3) it evokes good vestibulo-ocular responses upon electrical stimulation [39, 40]. Modulation signals with two amplitudes were investigated: 1.5 dB (baselines of 30%, 50%, and 70% of the DR) and 3 dB (baseline of 50% of the DR). The conversion from dB to modulation amplitude [µA] was defined as the ratio between the upper modulation depth and the selected baseline.
During eye movement recordings, patients were sitting still and comfortably in a dark room, with their heads upright, and were requested to remain as still as possible during stimulation trials. They were also requested to keep their eyes as open as possible during the recordings. We recorded eye movement responses during a 60 s continuous stimulation period, ensuring 120 complete sinusoidal cycles. Experiments were done in normal room lighting for security reasons (i.e. allowing the experimenter to carefully observe the reactions of the patient) and to evaluate performance in close-to-reality conditions.
Eye position data were first filtered at 30 Hz with a low-pass moving average filter (zero-phase shift). Eye velocity and acceleration were then obtained via the first and second derivatives of eye position. Analysis was performed on as many valid cycles (i.e. cycles free of saccades and blinks) as possible (minimum 15, maximum 102). Horizontal and vertical peak eye velocity (PEV) were calculated for each cycle using best-fit frequency-fixed sinusoids. Total PEV was then computed as the vector norm of these 2D components. The axis of the vestibulo-ocular response was defined as the angle between the horizontal PEV and the total PEV vector norm. More details on the eye movement processing algorithms can be found in [30, 39]. The misalignment was defined as the difference between the 'theoretical' angle of the stimulated canal and the measured angle. To facilitate comparisons between conditions, we established the 'theoretical' angle of the LAN to be 0° and a 'theoretical' angle of the SAN and PAN to be 90°. Asymmetry per cycle was calculated as the difference of the root-mean-square value of the excitatory and inhibitory half cycles of total peak eye velocity, divided by the sum of both, similar to previous reports [21, 40].
2.3. Statistics
All statistical analyses were carried out with SigmaPlot 14 (Systat Software, San Jose, CA, USA) and will be presented in detail in the results section.
2.4. Ethical considerations
This protocol was approved and carried out in accordance with the recommendations of the local ethics committee (Geneva University Hospitals NAC 11–080) and was designed in accordance with the declaration of Helsinki for which patients provided written informed consent.
2.5. Funding
This study was funded by a donation from a private foundation (AURIS, www.fondationauris.org). MED-EL Elektromedizinische Geräte GMBH (Innsbruck, Austria) has provided additional funding to finalize data analysis together with support for conference attendance.
3. Results
Figure 2 illustrates how the stimulation paradigm influences the vestibular threshold, UCL, and consequently DR. This comparison was carried out using different stimulus profiles: (a) with variable phase duration (PD) and constant pulse rate (400 pps), and (b) with variable pulse rate (PR) and constant phase duration (200 µs). A one-way repeated measures analysis of variance (ANOVA) confirmed that systematic variations of the PD and the PR had a significant effect on the dynamic range (respectively F(3,9) = 8.28, p = 0.006 and F(3,12) = 3.675, p = 0.04). Post-hoc analyses (Tukey test) showed statistically significant differences (p < 0.05) in means between 50 µs and 400 µs, and between 100 µs and 400 µs for variable PD as well as between 100 pps and 800 pps for variable PR experiments (asterisks in figure 2).
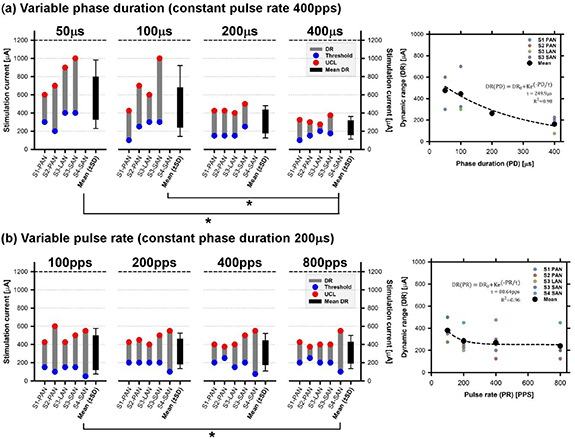
Figure 2. Influence of the stimulation profile on the vestibular threshold (blue circles), upper comfortable level (UCL–red circle), and corresponding dynamic range (DR–grey columns). The panels on the left display individual data in each experimental condition for: (a) stimulation profiles with a variable phase duration and constant pulse rate (400 pps) and (b) stimulation profiles with variable pulse rate and constant phase duration (200 µs). The black box in each plot represent mean results (±standard deviation–SD) across electrodes for a given condition. Statistically significant differences (p < 0.05) in means are marked with asterisks. The panels on the right present individual (coloured circles) and mean (black circles) DRs for each condition. The dotted black line represents the best exponential fit to the data (see equation in each graph).
Download figure:
Standard image High-resolution imageThe effect of both variable PD and variable PR was further quantified by modeling the average DR results as a function of PD or PR with a simple exponential function (right panels in figure 2). Increasing PD generated a rapid decay in DR: at around 200 µs phase–1, the DR had already decreased 3-fold (figure 2(a), right panel), while a smaller decrease (<25%) could be observed for variable PR from 100pps to higher pulse rates (right panel of figure 2(b)).
The next step of our investigation was to explore the self-reported intensity of percepts evoked upon stimulation using the same stimulation profiles presented above. Individual results for variable PD and variable PR experiments are presented in the supplementary figures (figure S1 (stacks.iop.org/JNE/17/036027/mmedia)). The global trends are better represented in figure 3, which presents the individual and group average slopes of the intensity growth functions for variable PD (left panel) and variable PR (right panel) trials. While the regression slope increased for increasing phase duration, it remained practically stable for the different pulse rates tested. Statistical analyses (one way repeated measures ANOVA) confirmed the statistically significant influence of variable PD on the intensity growth function of the percept (F(3,9) = 29.45; p < 0.001). Post-hoc pairwise comparisons (Tukey test) indicated that all PD profiles differed significantly (p < 0.05) from each other except for the 50 µs vs 100 µs comparison. We observed no statistically significant influence of variable PR.
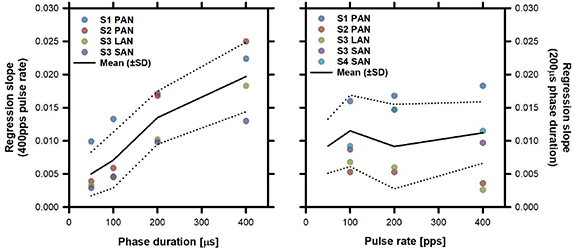
Figure 3. Slope of intensity growth functions of percepts evoked upon stimulation versus PD (left column) and PR (right column). Individual slopes in each condition are presented as coloured dots. Average and standard deviation (SD) values are presented as black solid and dotted lines, respectively.
Download figure:
Standard image High-resolution imageFinally, we evaluated how varying PD and PR influenced the eVOR. For each parameter set, three baseline levels (30%, 50%, and 70% of the DR) and two modulation depths (1.5 dB and 3 dB) were evaluated. The eVOR was evaluated in terms of total PEV, misalignment, and asymmetry.
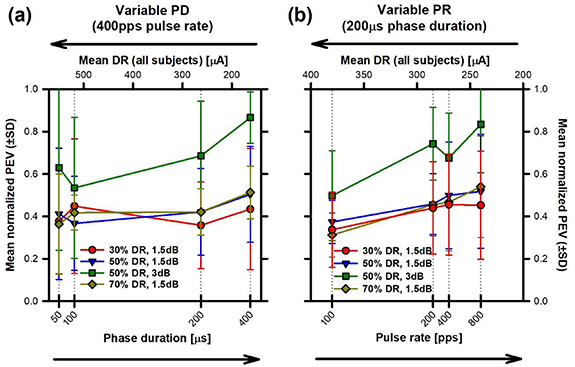
Individual PEV results as a function of PD and PR are presented in the supplementary figure (figure S2). To facilitate comparison across subjects, total PEV values were normalized to the maximum response per subject and per electrode. Average results across subjects (±SD) are presented in figure 4 as a function of PD and PR (lower axes). PEV values were comparable across the different PDs and baselines tested at 1.5 dB (figure 4(a)). However, increasing the modulation depth from 1.5 dB to 3 dB resulted in a 50%–100% increase in PEV, especially for the largest PD tested (400 µs). These observations were confirmed by statistical analyses, where no statistically significant effects of baseline level or PD were identified, but a significant effect of modulation level was observed (see table 2). The trend of the results was similar for the variable PR experiment (figure 4(b)). Modifying the baseline level did not affect total PEV, but increasing the modulation depth from 1.5 dB to 3 dB resulted in a nearly two-fold, significant increase in PEV. Increasing PR also seemed to result in faster PEV but this trend did not reach statistical significance. Detailed results of all statistical analyses are provided in table 2 and supplementary table 1 (post-hoc Tukey tests).
Figure 4. Mean normalized PEV (±standard deviation, SD) as a function of mean DR (upper horizontal axes) and of (a) variable PD and (b) variable PR (lower horizontal axes). Normalized PEV values were calculated from eVOR recordings obtained upon sinusoidal (2 Hz) modulation of three electrical baseline levels (30%, 50%, and 70% of the DR) with a modulation depth of 1.5 dB (respectively red, blue and dark yellow plots). For the baseline level of 50% of the DR an additional modulation depth of 3 dB was tested (green plot).
Download figure:
Standard image High-resolution image
Table 2. Statistical analyses (two way repeated measures ANOVA) of eVOR results.
| Variable | Experiment | Source | df | MS | F | p | η2 | |||
|---|---|---|---|---|---|---|---|---|---|---|
| Total PEV | Variable PD | BL | 2 | 0.003 | 0.13 | 0.87 | 0.003 | |||
| PD | 3 | 0.02 | 1.64 | 0.25 | 0.036 | |||||
| BL x PD | 6 | 0.006 | 0.79 | 0.58 | 0.02 | |||||
| Mod | 1 | 0.51 | 40.04 | 0.008* | 0.20 | |||||
| PD | 3 | 0.08 | 2.51 | 0.12 | 0.09 | |||||
| Mod x PD | 3 | 0.01 | 0.81 | 0.52 | 0.02 | |||||
| Variable PR | BL | 2 | 0.008 | 1.11 | 0.37 | 0.007 | ||||
| PR | 3 | 0.07 | 1.75 | 0.21 | 0.09 | |||||
| BL x PR | 6 | 0.003 | 0.87 | 0.53 | 0.008 | |||||
| Mod | 1 | 0.51 | 10.52 | 0.03* | 0.23 | |||||
| PR | 3 | 0.10 | 2.83 | 0.08 | 0.13 | |||||
| Mod x PR | 3 | 0.02 | 2.78 | 0.08 | 0.027 | |||||
| Misalignment | Variable PD | BL | 2 | 0.01 | 0.21 | 0.82 | 0.02 | |||
| PD | 3 | 0.04 | 0.76 | 0.54 | 0.08 | |||||
| BL x PD | 6 | 0.04 | 2.94 | 0.03* | 0.16 | |||||
| Mod | 1 | 0.18 | 2.19 | 0.24 | 0.13 | |||||
| PD | 3 | 0.03 | 0.94 | 0.46 | 0.07 | |||||
| Mod x PD | 3 | 0.11 | 6.31 | 0.01* | 0.24 | |||||
| Variable PR | BL | 2 | 0.04 | 3.90 | 0.07 | 0.07 | ||||
| PR | 3 | 0.01 | 0.57 | 0.65 | 0.04 | |||||
| BL x PR | 6 | 0.02 | 3.23 | 0.02* | 0.12 | |||||
| Mod | 1 | 0.007 | 0.24 | 0.65 | 0.006 | |||||
| PR | 3 | 0.02 | 0.54 | 0.66 | 0.05 | |||||
| Mod x PR | 3 | 0.004 | 0.185 | 0.90 | 0.011 | |||||
| Asymmetry | Variable PD | BL | 2 | 0.001 | 0.21 | 0.81 | 0.0023 | |||
| PD | 3 | 0.0063 | 0.53 | 0.67 | 0.020 | |||||
| BL x PD | 6 | 0.0018 | 1.15 | 0.37 | 0.0118 | |||||
| Mod | 1 | 0.0031 | 0.17 | 0.71 | 0.0042 | |||||
| PD | 3 | 0.0014 | 1.17 | 0.91 | 0.0057 | |||||
| Mod x PD | 3 | 0.004 | 1.22 | 0.36 | 0.016 | |||||
| Variable PR | BL | 2 | 0.0002 | 0.06 | 0.94 | 0.0004 | ||||
| PR | 3 | 0.0035 | 0.92 | 0.46 | 0.013 | |||||
| BL x PR | 6 | 0.003 | 3.08 | 0.02* | 0.024 | |||||
| Mod | 1 | 0.0007 | 0.03 | 0.88 | 0.0007 | |||||
| PR | 3 | 0.0015 | 0.27 | 0.85 | 0.0052 | |||||
| Mod x PR | 3 | 0.0032 | 1.60 | 0.24 | 0.0110 | |||||
| MS—mean squares | η2—effect size (Eta squared) | * p < 0.05 | ||||||||
| BL—baseline level (30%, 50%, 50%) | Mod—modulation level (1.5 dB, 3 dB) | |||||||||
We also performed an additional linear regression analysis to have an estimate of how PEV results might be predicted based on the DR. Figure 4 also presents the average of the normalized PEV values for all subjects, per condition, plotted as a function of the average DR (upper axes). Surprisingly, we observed a small trend of decreasing PEV with increasing DR (figure 4(a)). However, the correlations were not statistically significant. For the variable PR experiment, we also observed a decreasing trend for total PEV as a function of DR (figure 4(b)). This correlation was statistically significant only for the three baseline levels and a modulation depth of 1.5 dB (Pearson's correlation: 30% DR r = −0.97, p < 0.05; 50% DR: r = −0.99, p < 0.05; 70% DR r = −0.99, p <−0.01), but not for the 50% DR baseline with a modulation depth of 3 dB (r = −0.95, p = 0.05).
Results on the misalignment of eVOR showed large variability both between subjects and across conditions (see figure S3 in the supplementary figures). No systematic trend could therefore be identified. Results of statistical analyses (two way repeated measures ANOVA, see table 2) confirmed no statistically significant effect of the baseline level or the modulation depth, both for variable PD and for variable PR experiments. However, the analyses also showed a significant interaction effect between parameters (baseline level and PD, baseline level and PR, modulation depth and PR). The following post-hoc pairwise comparisons (Tukey test) reached statistical significance (p < 0.05) for variable PD experiments: (1) 50 µs vs 200 µs pulse durations for a baseline of 50% of the DR and a modulation depth of 1.5 dB; and (2) modulation depths of 1.5 dB vs 3 dB for a baseline level of 50% of the DR at all PD tested. The following post-hoc pairwise comparisons (Tukey test) reached statistical significance (p < 0.05) for variable PR experiments: (1) 30% vs 50% baseline levels at 400 pps; (2) 30% vs 70% baseline levels at 400 pps; and (3) 400 pps vs 800 pps at a baseline level of 50% of the DR and a modulation depth of 1.5 dB. Note that, in light of the significant interactions identified in the results, the interpretation of the effects of the main parameters remains difficult, since the effect of one of the factors depends upon the level of the other.
Overall, mean asymmetry values remained low (below 5%) in all conditions (see figure S4 in the supplementary figures). Furthermore, the results remained equivalent across the different stimulation parameters (baselines, modulation depths, phase durations, and pulse rates). The statistical analysis (see table 2) did not reveal any significant effect of the main parameters either. Note however that a significant interaction effect between PR and baseline level was obtained. Yet, the effect size was small (see η2 value in table 2) and no significant differences were identified by post-hoc (Tukey) tests. This confirms that the stimulation parameters tested in this study did not impact the asymmetry of the eVOR responses.
4. Discussion
The goal of this study was to investigate the effect of applying systematic variations to the stimulation paradigm on the vestibular responses evoked with our vestibular implant prototype. This was motivated by the idea that identifying the best stimulation paradigm should allow us to optimize the rehabilitation prospects of the device. This estimation should consider vestibular function as a whole, going beyond the traditionally investigated vestibulo-ocular reflex. Indeed, this particular outcome measure has been the parameter of choice in most vestibular implant research studies, because it is an objective measure that is relatively simple to quantify and follow up [7]. However, complaints from patients suffering with bilateral vestibulopathy cannot be simply and uniquely attributed to this reflex response. Other responses, such as the perception of motion and orientation of the head with respect to the body and the gravity vector, as well as postural responses are probably related to the frequent and multiple complaints from this population of patients [1].
In our experimental setting, shorter phase durations were the parameter of choice to maximize the dynamic range of electrical currents available for vestibular stimulation. This first finding is in accordance with previous studies that have also reported that pulses with shorter phase durations required less charge to reach activation threshold, consistent with classical strength-duration curve descriptions of action potential initiation and other threshold responses to sensory input [60]. In addition, shorter phase durations can result in more spatially selective excitation of the targeted ampullary nerve [16, 18, 60]. Using shorter pulse durations has a number of additional advantages. First, in our study, shorter phase durations allowed evoking softer percepts with gentler intensity growth functions. This is also consistent with neurophysiology: The rate of charge increase at the membrane is higher for longer pulse durations, resulting in 'stronger' intensity percepts. Second, higher pulse rates and thus faster interleaved stimulation on a larger number of electrodes is theoretically possible with shorter pulse durations [18]. Third, overall power consumption should also be reduced, allowing longer battery life [16]. Finally, shorter phase durations are less likely to generate corrosive electrochemistry byproducts [61]. Considering all these facts, shorter phase durations appear to be a suitable parameter for maximizing efficacy, energetic efficiency, and safety of the vestibular implant.
Despite the above-mentioned advantages of shorter phase durations, other aspects need to be considered. Since shorter phase durations generally require higher amplitude stimulation currents to reach threshold, voltage compliance issues can arise if electrode impedances are high. In our experiment, this was the case for subject S2, where the impedance of the PAN electrode was such that the maximum electrical current that could be applied while remaining inside compliance limits was only 700 µA, compared to the maximum 1200 µA for the other subjects (see table 1). This particular factor was, in this particular subject's case, the main limitation for the DR for the 50 µs and 100 µs phase durations. Individual electrode impedances are therefore a critical factor to consider for the determination of the best stimulation paradigm.
The efficacy of the stimulation paradigm was also evaluated on the basis of the characteristics of the evoked eVOR. We evaluated three different baseline levels and two modulation depths for different combinations of phase durations and stimulation pulse rates. This evaluation revealed that, for the range of parameters investigated, the major parameter influencing total PEV of the evoked eVOR responses is modulation depth. Baseline level showed very small or no effects at all. For a single baseline, increasing phase duration or pulse rate increased total PEV by approximately 5% only, while doubling the modulation depth increased the total PEV by approximately 20% for the shorter phase durations and slower pulse rates. This difference increased with increasing phase durations and pulse rates, improving by 40%–50% for experiments using phase durations >200 µs and >200pps. This suggests that baseline level should be primarily chosen in order to maximize modulation depth: Optimizing eVOR responses requires using the entire dynamic range for electrical stimulation. These results also confirm our previous studies showing that the amplitude of eVOR responses evoked with a vestibular implant are more sensitive to current amplitude than pulse rate [49, 62]. In light of the results shown here, co-modulation of pulse rate and amplitude also appears to be a promising approach to maximize eVOR velocities [46].
At this point, it is interesting to note that the larger dynamic ranges observed for shorter phase durations and slower pulse rates did not improve the velocity of eVOR responses (see figure 4). Note that the determination of the dynamic range was based on the perceived intensity of vestibular percepts and/or unwanted responses (e.g. facial nerve activation). Therefore, this result suggests that the dynamics of the vestibulo-ocular and vestibulo-thalamo-cortical pathways might not be the same. This finding is consistent with the timeline of adaptation to electrical stimulation that we have observed in our patients. The rate of decline of the different vestibular signs and symptoms (nystagmus, vertigo) after sudden onset or offset of the baseline stimulation do not seem to follow the same timeline. Furthermore, results are quite variable across patients. These discrepancies might be related to variable central compensation mechanisms, but also to the variability of the populations of afferents that dominate the activation of the different pathways. For example, the angular vestibulo-ocular reflex seems to be primarily driven by regular afferents, while irregular afferents seem to be the dominant input to the vestibulo-collic pathway [63]. Little is known about the population of afferents that drive the vestibulo-thalamo-cortical pathway responsible for conscious perception [63, 64]. The anatomical characteristics of a nerve fundamentally determine its biophysical properties, hence their response to stimulating currents [65, 66]. Therefore, the different distribution of (surviving) regular versus irregular afferents in each pathway might be a factor determining how each subject responds to electrical stimulation, and might determine the optimum stimulation profile required to selectively activate different pathways. This hypothesis could also explain, at least to a certain extent, the significant inter-subject differences observed in this study where S1 and S2 are cases suffering progressive bilateral vestibular loss with deficit durations of more than 10 years, while S3 and S4 are traumatic cases of acute (i.e. traumatic) and recent onset. Note, however, that responses could be elicited in all cases, which suggests that even patients suffering from progressive and/or longstanding pathologies might be good candidates for a vestibular implant, contrasting with assessments put forward by others [67].
Misalignment of the generated eVOR has also been identified as a potential matter of concern in vestibular implant research. Indeed, misaligned responses would not allow good restoration of gaze stabilization abilities. In the most extreme cases they could even cause further impairment. In this study, we observed significant misalignment in some of the tested electrodes (see figure S3). Misalignment of eVOR responses has already been described in animals and humans and is generally attributed to current spread or imprecise electrode placement [7, 30, 68, 69]. In addition, the design of our vestibular implant uses monopolar stimulation with the return electrode placed under the temporalis muscle. With this design more current spread might be expected than with other designs incorporating a return electrode positioned on the common crus [43]. Animal research has shown that misalignment can be reduced by decreasing phase duration and current amplitude, and hence current spread [18]. This phenomenon was not seen in our results, but the significant interactions identified between the main parameters investigated (baseline level, modulation depth, phase duration, and pulse rate) do not allow the identification of the main factor or promising improvement strategies. Different stimulation paradigms have been proposed to minimize misalignment [20–22, 68]. Nevertheless, it is possible that the actual impact of misalignment has been overestimated. Previous research on animals has demonstrated that the important misalignment seen in the early stages of implant activation improves significantly after periods of chronic stimulation [19, 70, 71]. This is consistent with the exceptional adaptation capabilities of the VOR [72–74]. Therefore, the real clinical significance of the misalignment of the eVOR still needs to be demonstrated, especially after periods of chronic stimulation in humans, before optimal mitigation strategies are developed and validated.
The asymmetry of the eVOR responses reported here is in accordance with our previous studies [30] and much smaller than that previously reported in unilaterally implanted monkeys [21]. It has been hypothesized that the use of supranormal baselines could be an efficient way to reduce asymmetry by decreasing the excitatory response while increasing the inhibitory response [46]. It is true that in our experiments we use higher baselines than those used in the above-mentioned animal studies. This could be a plausible explanation of the difference shown in our results. However, in our experiments we investigated three different supranormal baseline levels corresponding to 30%, 50% and 70% of the dynamic range and found no difference between them. Keeping in mind that for patients with a unilateral vestibular loss response asymmetry is generally well compensated [75], a unilateral vestibular implant generating an asymmetric eVOR might be sufficient to restore useful vestibular function [40].
4.1. Experimental design considerations, limitations, and future work
The main limitation of this study concerns the small number of patients included, particularly in view of the high inter-subject and inter-electrode variability. Vestibular implant research is still a novel field and only a very limited number of patients are available for this type of investigation. Furthermore, these experiments are time-consuming and induce significant fatigue to patients. The availability of each patient is also limited. Nevertheless, all subjects showed similar trends and intersubject variability was much smaller than the effects reported here. This strengthens our conclusions and we expect to confirm reproducibility as soon as more implanted patients become available in the coming years.
In our study design, we investigated the effect of a single stimulation parameter (phase duration or pulse rate) while keeping the other constant. This is an effective way of exploring the effect of a single parameter without biasing its effect with that of others. However, the reader must keep in mind that this experimental choice cannot exclude interaction effects outside of the tested range. For example, the results presented here did not show a statistically significant influence of variable PR for biphasic pulses with a 200 µs phase duration. However, our results do not exclude that PR could have a significant influence for shorter phase durations or different pulse shapes.
Our study design did not comprise psychophysical paradigms to compensate for adaptation effects. This choice was based on the fact that experiments were extremely time-consuming and single experimental sessions evaluating one parameter (phase duration or pulse rate) already extended over long periods of 2–3 h. Phase duration and pulse rate experiments were not conducted during the same experimental session to limit fatigue and decrease inattention, which can have detrimental effects on the reproducibility of the results. Implementing special psychophysical paradigms such as an ascending/descending method would have extended the experimental session time even more. In these conditions, we believe the bias induced by increased experimental time would have been greater than that induced by any potential adaptation effects present in this study.
We used a very simplified misalignment calculation method (i.e. axis of the 'theoretical' axis of the SAN and PAN electrodes was considered to be of 90°). This facilitated the comparison across conditions, allowing the evaluation of the effects of the stimulation paradigm, which was the main purpose of this study. The details on misalignment in our population of implanted patients have already been reported in detail before [30].
This study was the first attempt at evaluating the effect of systematic variations of the stimulation paradigm in human patients implanted with the Geneva-Maastricht vestibular implant prototype. We only evaluated the effects of some important parameters of the standard stimulation paradigm used in our previous studies (phase duration, pulse rate, baseline level, modulation depth). However, other promising strategies deserve future investigation. For example, it would be interesting to compare performance between cathodic-first and anodic-first pulses since the latter appear to be more efficient for activating structures further away from the electrode at equal stimulation currents [76]. Other interesting comparisons that should be considered for the future are biphasic vs. triphasic pulses and symmetrical vs. pseudo-monophasic pulses.
Another interesting line of future research would be to extend the exploration of the vestibulo-thalamo-cortical pathways with the use of objective electrophysiological measures such as central vestibular evoked potentials or psychophysical measures such as the perception of simultaneity of concurrent stimuli (e.g. temporal binding of sensory cues). Such research should provide fundamental data regarding how vestibular information is processed at the central relays using the unprecedented experimental paradigms available with the vestibular implant. This research would not only move the vestibular implant field forward, but would also help us to better understand central vestibular syndromes that are difficult to comprehend and study with classical experimental tools.
For the time being, the patients participating in our study only use the vestibular implant during acute testing sessions in our laboratory. The possibility of evaluating patients after chronic stimulation periods would allow us to better understand the actual impact of electrical stimulation on overall vestibular function, and how central adaptation impacts the rehabilitation possibilities offered by the device.
Finally, the reader should keep in mind that in our experiments only one electrode was stimulated at a time. In future studies, we will attempt to evaluate the impact of multi-electrode stimulation and to more clearly identify the different activation patterns that can be achieved with this strategy. This opens new possibilities of interacting with the peripheral vestibular system to improve future vestibular implant outcomes.
5. Conclusions
Our results identified important parametric variations that influence the measured responses. Furthermore, we observed that not all vestibular pathways seem equally sensitive to the electrical stimulus when the electrodes are placed in the semicircular canals and monopolar stimulation is used. This opens the door to evaluating new stimulation strategies for a vestibular implant, and suggests the possibility of selectively activating one vestibular pathway or the other in order to optimize rehabilitation outcomes.
Acknowledgments
The authors thank C Garnham and P Hubner for critical review of this manuscript.