

Abstract
Accurate and reliable dynamic pressure measurements are needed for optimizing performance in modern combustion engines, manufacturing processes and aerospace applications. Besides fast pressure transients, these applications subject dynamic pressure transducers to elevated temperatures. Both of these quantities effect the sensitivity of transducers. Therefore, transducers should be calibrated at conditions that corresponds to the operating environment.
To answer these needs, the National Metrology Institute VTT MIKES has developed its drop weight dynamic pressure primary standard further. Developments include improved control and measurement of the falling weight, extension of the pressure range to combustion engine pressures down to 3 MPa and a heating option for dynamic pressure transducers under calibration. These advances enable traceable calibration of cylinder pressure transducers at conditions relevant to engine applications. The overall uncertainty (k = 2) of calibration is estimated to be around 1.7%. The performance was demonstrated by calibrating a piezoelectric pressure transducer in the pressure and temperature range from 7 MPa to 30 MPa in 20 °C, 120 °C and 180 °C, respectively. As a result, traceable calibrations of dynamic pressure transducers can be performed at conditions relevant for engine applications. This improves the reliability and accuracy of in-cylinder pressure measurements.
Export citation and abstract BibTeX RIS

Original content from this work may be used under the terms of the Creative Commons Attribution 3.0 license. Any further distribution of this work must maintain attribution to the author(s) and the title of the work, journal citation and DOI.
Corrections to the reference list of this paper were made on 10 September 2020.
1. Introduction
There is a growing need to use dynamic pressure transducers in modern combustion engines, process control and aerospace applications to optimize performance. However, the frequency response of dynamic pressure transducers is not well-known [1] due to the lack of dynamic calibration methods [2, 3]. Another major challenge in dynamic pressure calibrations is the wide range of pressures and frequencies to be covered [4].
Within the IND09 Dynamic project of the European Metrology Research Programme EMRP the National Metrology Institute of Finland (VTT MIKES) and several European NMI's started to develop primary dynamic pressure measurement standards. This development has been continuing in the ongoing 17IND07 DynPT-project [5] of the The European Metrology Programme for Innovation and Research (EMPIR). National Physical Laboratory (NPL) and Research Institute of Sweden (RISE) are developing shock tubes [6, 7]. Laboratoire national de métrologie et d'essais/Ecole Nationale Supérieure d'Arts et Métiers (LNE/ENSAM) are developing dynamic pressure standards based on shock tube and fast-opening valve principles [1]. VTT MIKES, The National Metrology Institute of Germany (PTB) and the National Metrology Institute of Turkey (TUBITAK UME) have been developing drop weight devices [3, 8, 9]. The pressure range of these shock tubes is currently up to 7 MPa [10] with a frequency range up to the gigahertz range. Fast opening valves operate in the pressure and frequency range up to 830 MPa and 1 kHz, respectively [11]. Drop weight devices typically operate in the pressure range from 50 MPa to 500 MPa with a frequency range of a few hundred Hertz. To date, at least VTT MIKES and LNE/ENSAM already offer traceable dynamic pressure calibration services [12].
Besides the aforementioned techniques, a solution based on a pistonphone [13] has been proposed. In this approach, a piston squeezes a fluid filled chamber and the movement of the piston is measured. Frequencies up to 10 kHz and pressure up to 1.2 MPa have been demonstrated using this method. In the past, there has also been attempts for realizing dynamic pressure through dynamic force measurements and the drop weight method either through transitional parts [14] and more recently, directly [2] using force transducers. Also wavelength modulation spectroscopy has been proposed for traceable measurement of dynamic pressure [15].
There is an increasing need for lower measurement uncertainty and higher reliability of dynamic pressure measurements, especially in internal combustion engines [5]. The pressure range of interest is from about 1 MPa up to 30 MPa. Currently, there does not exist traceable measurement standards in this pressure range with a frequency response relevant for this application. For these reasons, VTT MIKES developed further its dynamic pressure measurement standard by extending the pressure range down to 3 MPa. The pulse shape of the drop weight measurement standard is similar to pressure pulses in combustion engine [3] making it suitable for calibrating cylinder pressure transducers.
Another issue to be considered is the operating temperature of the cylinder pressure transducer. Surface temperatures inside internal combustion can be up to hundreds of degrees [10]. According to manufacturer's specifications, the temperature sensitivity of piezoelectric dynamic pressure transducers is typically in the order of a percent/(100 °C). Consequently, cylinder pressure transducers need to be calibrated at elevated temperatures to obtain optimum accuracy and reliable readings. In this paper, we present an option of calibrating dynamic pressure transducers at elevated temperatures using the VTT MIKES dynamic pressure measurement standard.
Another relevant metrological challenge is the lack of overlap between pressure ranges of primary dynamic pressure standards, which prevents inter-comparison between primary methods and thus a metrological validation. Extending the range of the VTT MIKES dynamic pressure measurement standard down to 3 MPa will allow a comparison against other primary methods, such as shock tubes, for a first time.
2. VTT MIKES dynamic pressure measurement standard
2.1. Operating principle
The VTT MIKES dynamic pressure primary measurement standard is built on a frame of a commercial AVL B620-type drop weight secondary dynamic pressure calibrator. Instead of using reference transducers, traceable impact pressure is obtained through measurement of impact acceleration, and predetermined impact mass and area of the piston-cylinder assembly.
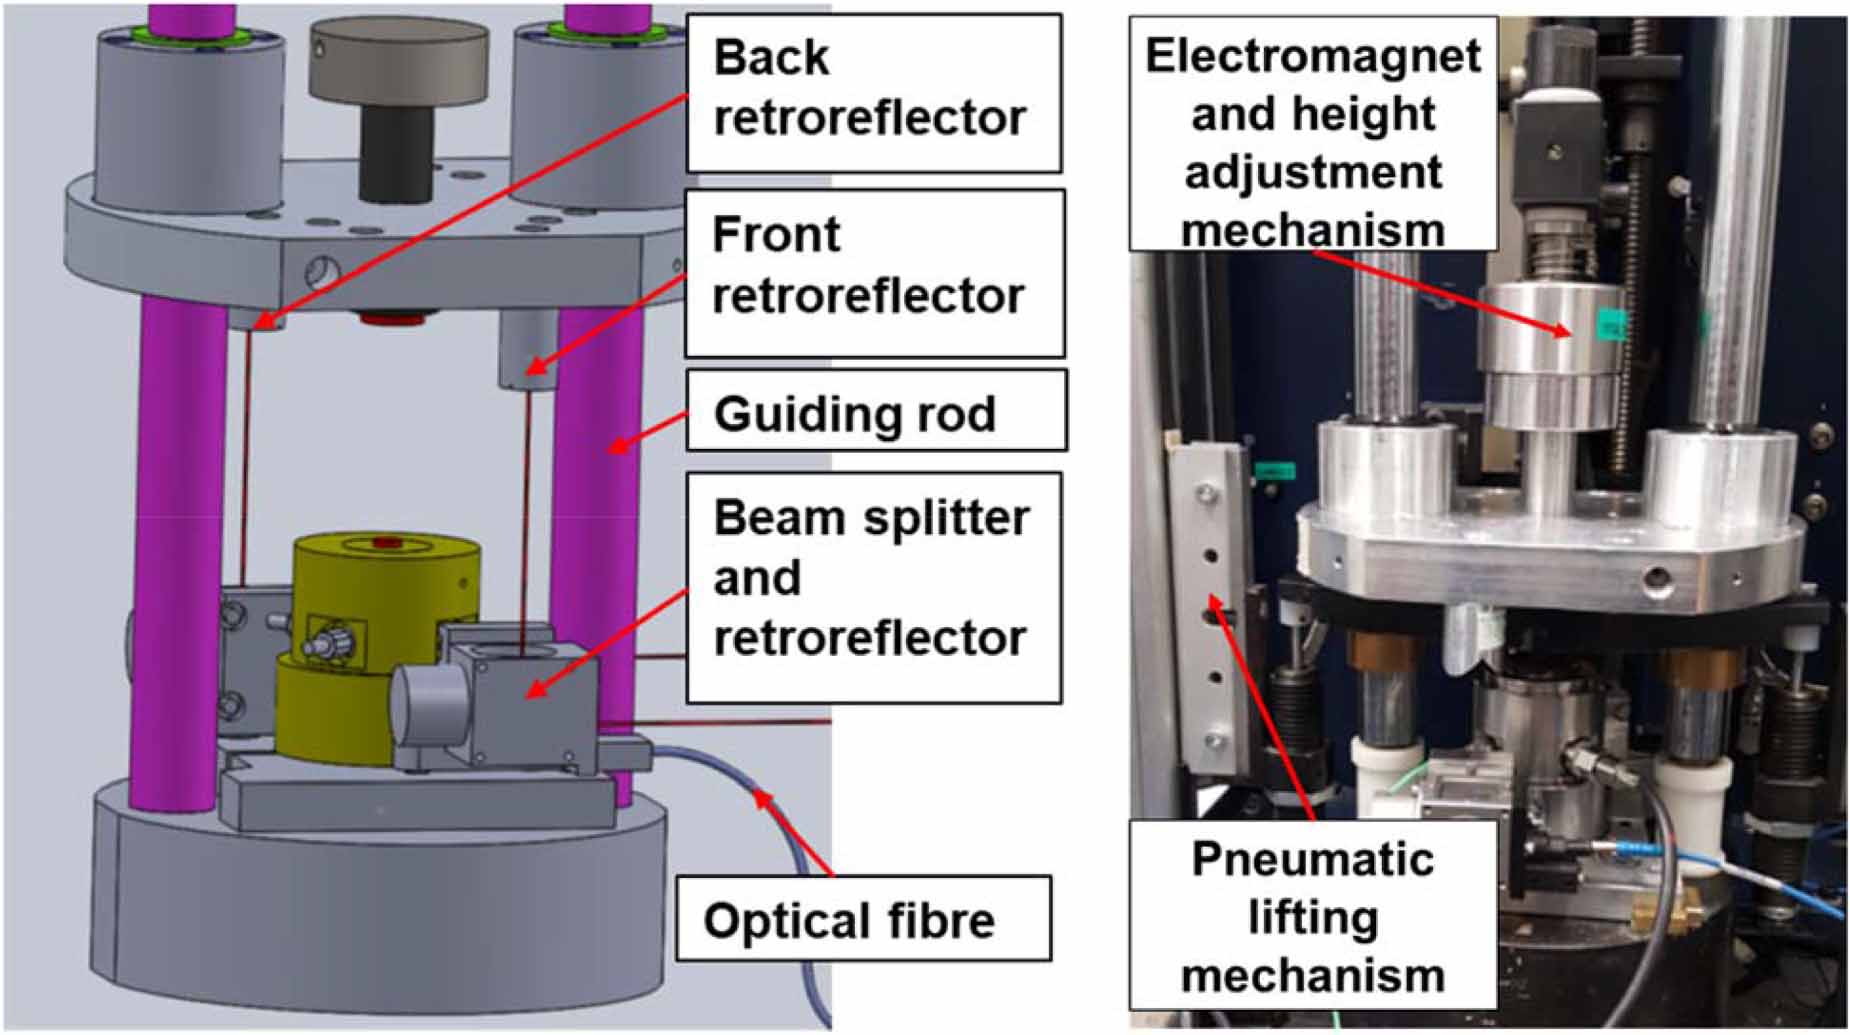
The measurement sequence starts by lifting the drop weight up to a certain height using an electromagnet and a lifting mechanism. This height determines the impact force and thus the amplitude of the pressure pulse. As the drop weight is released, it falls along the guiding rods (figure 1). When the impact hammer of the drop weight (figure 3) hits the piston (figure 4), the liquid inside the fluid cavity (figure 4) is squeezed and a pressure pulse (figure 9) is created. After the pressure pulse, the drop weight jumps off the piston. A pneumatic lifting mechanism (figure 1) lifts the drop weight up until the electromagnet catches the drop weight again.

Figure 1. Schematic and photo of dynamic pressure measurement standard.
Download figure:
Standard image High-resolution image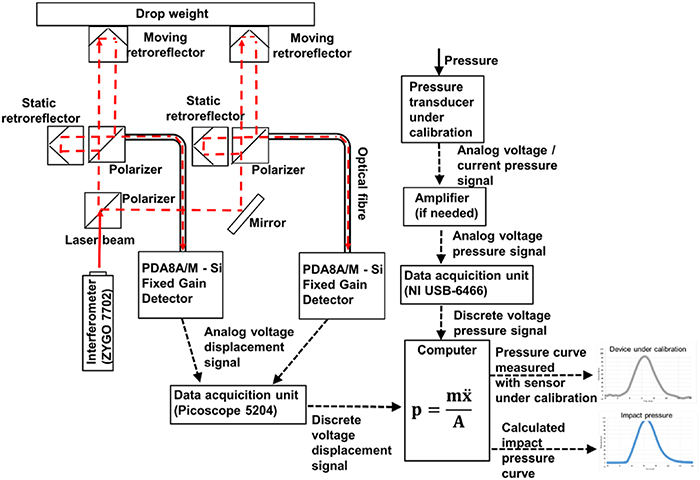
Figure 2. Schematic and signal flow of the MIKES dynamic pressure measurement standard.
Download figure:
Standard image High-resolution image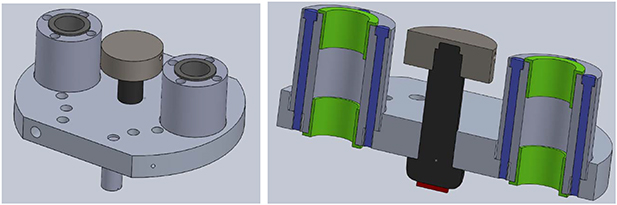
Figure 3. Drop weight, impact hammer (black) and linear guides (green).
Download figure:
Standard image High-resolution image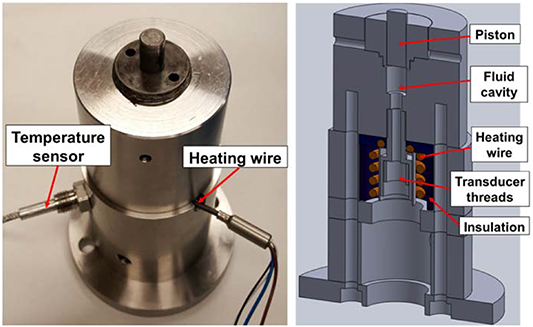
Figure 4. Measurement head with heating option.
Download figure:
Standard image High-resolution image2.2. Interferometric measurement
In figure 2, the design and signal flow chart of the measurement setup is shown. The sampling frequency of the 10 MHz interferometer signal in a heterodyne Michelson type interferometer setup is 250 MHz. In order to limit the amount of analyzed acceleration signal, the collection of the data is triggered when the piston comes in contact with the impact hammer. A couple milliseconds of pre-trigger data is also collected (figure 5). The displacement data measured by the interferometer setup is analyzed in a LabVIEW program. Based on the displacement data, the acceleration of the weight as a function of time is calculated (figures 5–7). Finally, the impact pressure is calculated based on the acceleration, the mass of the drop weight and the effective area of the piston-cylinder assembly. The output signal of the transducer under calibration is converted to a digital signal using a data acquisition unit (DAQ). In some cases, the transducer signal needs to be amplified before the DAQ. The sampling frequencies of dynamic pressure transducers are typically 500 kHz.
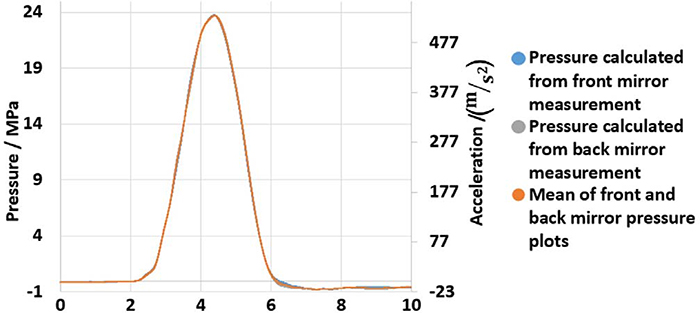
Figure 5. Impact pressure and measured acceleration curve.
Download figure:
Standard image High-resolution image
Figure 6. Maximum pressure and acceleration calculated from front and back mirror measurements.
Download figure:
Standard image High-resolution image
Figure 7. Measurement signal before and after impact.
Download figure:
Standard image High-resolution image2.3. Developments for improving the measurement uncertainty and extending pressure range
As the impact inevitably creates disturbing mechanical vibrations, special care is taken to attach the device firmly. The device is fixed to a granite block which in turn is firmly attached to the laboratory floor. Even though all components are attached with screws, vibrations occur. These vibrations in turn create the main technical challenge for measuring the impact force. In practice, tilting and vibration of the drop weight easily lead to ambiguity of the measured impact force because of changing friction and stick-slip phenomenon, which can be described as a kind of jerking motion between linear guides and guiding rods. Therefore, tilting and vibrations of the drop weight needs to be minimized in order to reliably measure the impact force.
In the previous design of the measurement standard, the displacement was measured at only one point of the drop weight. To develop the dynamic pressure measurement standard further, a new drop weight and an interferometer setup was developed. A dual beam Michelson interferometer setup was applied to enable displacement measurements at two points at opposite corners of the weight (figure 1). As a result, the tilt of drop weight can be monitored during impact.
The new drop weight with a mass of 3.6 kg is lighter than the previous 12.6 kg drop weight in order to extend pressure range downwards. To reduce the vibrations and tilt of the weight, suitable linear guides were machined in the house (marked as green in figure 3). Tightening the linear guide screws (blue screws in figure 3) squeezes the linear guides, and consequently reduces the gap between the linear guides and the guiding rods. In this way, the gap between the guides and the guiding rods can be optimally adjusted. In order to further reduce vibrations and stick-slip phenomenon, 1 mm rubber film (small red plate in figure 3) was installed on top of the impact hammer to reduce vibrations and stick-slip phenomenon.
2.4. Heating option for calibrations at high-temperatures
In order to calibrate transducers at high-temperatures typical for combustion engine-type environments, a heating option for the measurement head was designed at VTT MIKES. It has been estimated [10] that dynamic pressure transducers should be tested in around 200  temperature to imitate temperatures inside a diesel engine. In this design, the fluid near the transducer as well as transducer's sensing element are heated using a resistive heating wire (figure 4). Silicone oil designed for oil baths is used as the working fluid inside the cavity.
3. Calculation of results
The generated maximum pressure is calculated using the relation:
where  is the combined mass of the drop weight, piston and pressurized medium,
  is the maximum acceleration change of the mass during impact (figure 6 and figures 7) and (A) is the effective area of the piston-cylinder assembly. As seen in equation (1), compressibility of the liquid media does not affect the calculation of the generated pressure, owing to the primary method of measuring acceleration, i.e. force, of impact directly. Rigorously speaking, the force in equation (1) is the sum of the product of mass and acceleration for every finite element in the system. This force could, in principle, be calculated by measuring acceleration from the center of the mass of drop weight, piston and pressurized medium. This is however not possible in practice. Measurements are done from two different points of the drop weight (figure 1) instead.
Figure 5 shows a typical pressure pulse created by the drop weight measurement standard. Most of the information content of the pressure pulse is below 400 Hz. To make sure that no amplitude information is lost, typically a 2 kHz low pass filter is used. A practical method to check that no relevant amplitude information is lost due to low pass filtering was introduced in [3]. The method is based on using a range of low-pass filter cut-off values and comparing the results. For example, if the amplitude of the pressure pulse is practically the same between 1.2 kHz and 3 kHz low pass filter cut-off values, it can be assumed that a 2 kHz low-pass filter does not cut amplitude information of the signal. Approaches that resembles this have also been reported elsewhere [16].
In figure 6, the calculated pressure and corresponding measured acceleration is shown. Pressure pulses calculated using acceleration measured from front and back of the drop weight are temporally slightly shifted, and their magnitude differ slightly due to the tilting of the drop weight during impact. Typically, the temporal shift is in the order of a tens of microseconds and the difference in magnitude is around 0.1–0.5%. Both the time shift in the signals and the difference in magnitudes are due to the small tilt in the drop weight during impact. The measurement result is calculated as the mean of the maximum amplitudes. The difference of the maximum measurement results is included in the uncertainty estimation (see figure 6).
Figure 7 shows a close-up of the signal before and after impact. Before impact, a downwards acceleration due to gravity can be seen. Because of the friction between the linear guides and the guiding rods, the acceleration is only around 2.5  instead of freefall acceleration 9.8
  . As seen in figure 6 and figure 7, the amplitude of the dynamic pressure pulse is the difference between the maximum (Δp in figure 6) and the minimum (Δp in figure 7) of the pressure pulse. Negative pressure values in figure 7 are only computational and a result of negative acceleration before and after the impact. After the impact, the drop weight jumps up but is slowed down by vibration induced friction and stick-slip effects. Therefore, downwards acceleration is high and measurements from front mirror and the back mirror start to differ.
4. Validation of the primary measurement standard
The dynamic pressure measurement standard was experimentally validated changing the friction between the linear guides and the guiding rods as well as the mass of the drop weight. Any change in the calibration results of a pressure transducer due to a change in friction or mass of the drop weight, would indicate that there is a problem with the measurement standard or the calculation of the results. In addition to experiments, FEM simulations of the impact were performed to verify the experimental findings and to give a theoretical insight to them.
4.1. Influence of friction
When the screws in the linear guides are tightened, the guides expand such that the gap between the linear guides and the guiding rods decreases. As a result, the friction increases and the acceleration of the drop weight in free fall decreases. Although the friction causes an external force, the calibration results are unaffected. This is due to fact that the impact force is determined based on the change in acceleration caused by impact. A constant additional frictional force will therefore not influence the change in acceleration. Even in the extreme case where the drop weight did not start to slide down on its own, but needed assisted initial velocity, observed changes in the calibration results were less than 0.2%, which is within the experimental repeatability.
If the acceleration before impact is not measured and accounted for, the calibration results will not be reliable. This is especially important in the lower end of the pressure range, where the relative contribution of the frictional forces become significant.
As discussed in [17], at the moment of maximum pressure, eccentric impact between impact hammer and piston creates friction between piston (figure 4) and cylinder (figure 1). This friction reduces the force carried by piston at the moment of maximum pressure. This effect can be observed by changing the placement of measurement head, which changes the point of impact between impact hammer and piston. In case of perfectly positioned impact with no eccentricity, friction between piston and cylinder during maximum pressure is negligible.
4.2. Influence of impact mass deformation
Ideally, the acceleration of the center of mass during impact should be measured, as mentioned before. Similar to [18], the error caused by measuring the acceleration from drop weight was estimated using FEM-simulations (figure 8). Simulations indicate that the error varies from 0.1% to 3.0% depending on the pressurized medium and the construction of the drop weight. Compressibility of the pressurized medium varies between different liquids and depends on the amount of air bubbles in the liquid. This variation in compressibility also changes the duration of impact. The duration of the impact and pressure pulse can vary as much as from 3 ms to 7 ms. As the duration of the impact changes, the amplitudes of different vibration modes changes and the acceleration difference between the center of mass and measurement points changes. By carefully filling the measurement chamber to avoid entrapment of air bubbles, the pressure pulse duration can be well controlled, and it is typically around 4 ms.
Figure 8. FEM simulation of the drop weight and piston acceleration during moment of the maximum impact (left figure) and after the impact (right figure). In this case, compared to the center of mass, mirrors experience + 1% higher acceleration during moment of the maximum impact.
Download figure:
Standard image High-resolution image
Figure 9. Example of calibration results at 120 °C and 7 MPa peak pressure.
Download figure:
Standard image High-resolution imageExperimental studies were performed to investigate the influence of impact mass deformation. The construction of the drop weight was modified for these studies using additional plate weights. This modification not only increased the mass to 17 kg, but also changed the center of mass and made the construction stiffer, and thus rendered the vibrational modes of the weight. Measurements with the additional plate weights resulted in a 2.5% decrease in the measured sensitivity of the transducer. According to simulations, the corresponding value was 2.0%. Simulations indicate that the change in the measurement results is mostly due to the reduced bending of drop weight (figure 8). The stiffer construction implies that, the acceleration of the center of mass and the measured acceleration is practically the same. The half- percent difference between the simulations and experimental measurements is most probably due to the attachment of the plate weight. In simulations, an integral rigid weight was assumed, but in reality, the plate weight was attached with 3 screws.
4.3. Other potential error sources
Currently, glycerol or silicon oil is used as a pressurized medium. Glycerol is used at room temperatures and silicon oil at higher temperatures. No differences in the calibration results have been observed when comparing calibrations performed with different liquids. If differences exists, they are considerably smaller than the spread of measurement results and cannot be detected. Therefore our experience agrees with an argument presented in [17]: Viscous resistance of pressurized medium does not cause considerable pressure losses during moment of maximum pressure because velocity of drop weight, piston and pressurized medium is approximately zero. Consequently, similar to [2], it is assumed that the liquid media does not cause any significant pressure losses at the moment of maximum pressure.
Experiments also support calibration results are not influenced by a small amount of air bubbles in the liquid. Moreover, the dimensions of the cavity are orders of magnitude smaller than the wavelength of the pressure pulse, and thus the pressure inside the cavity is considered uniform. As discussed in [19], aforementioned issues might become a challenge in larger cavity volumes, more compressible transmission media and higher dynamic pressure signal frequencies.
Similarly, negligible changes in calibration results have been observed if the stiffness of the system is decreased by adding more rubber on the impact hammer. In extreme case of 7 mm rubber tip on the impact hammer, around 0.3% change was noticed, which is still within the experimental repeatability. Normally, around 1 mm thick rubber tip is used.
4.4. Measurement uncertainty
The combined relative measurement uncertainty of calibration  can be calculated according to the law of propagation of uncertainties [20] and assuming uncorrelated input quantities as follows:
in which  is the uncertainty of mass including drop weight, piston and pressurized medium,
  is the uncertainty of piston-cylinder effective area, ur(
 ) is the uncertainty in acceleration measurement due bending and deformation of the impact mass, ur(
 ) is the uncertainty in acceleration measurement caused by vibrational noise, ur(
 ) is the uncertainty in acceleration measurement due to tilt of drop weight,
 ) is the uncertainty in acceleration measurement due to friction between piston and cylinder due to eccentric impact and
  ) is the uncertainty in acceleration measurement due to the dispersion of measurement results.
Uncertainty of mass  includes the weighing uncertainty, as well as the ambiguity of mass caused by the trigger electrical cord attached to the drop weight [3]. As the uncertainty of weighing of the drop weight and piston is rather small, their effect can be ignored. The electrical cord of the drop weight swings freely during impact, and thus its effect is hard to estimate. Effect was estimated by swinging the cord on top of the mass balance. However, the mass of the electrical cord is less than 0.1% of the total impact mass and therefore it has only a minimal effect on the overall uncertainty. The uncertainty of mass of the pressurized medium is the largest component related to uncertainty of mass. This is because a small amount of fluid leaks out of the chamber at each impact. Anyhow, the uncertainty of mass is rather small compared to other uncertainty sources (table 1).
Table 1. Uncertainty budget for a dynamic pressure transducer calibration at 7 MPa and 120  .
.
| Uncertainty component | Source of uncertainty | Standard relative uncertainty/% |
 ) ) |
Mass of drop weight, piston, pressurized medium and electrical cord | 0.1 |
 (A) (A) |
Effective area of piston-cylinder | 0.1 |
 ( ( ) ) |
Bending and deformation of drop weight | 0.8 |
 ( ( ) ) |
Vibration induced noise | 0.2 |
 ( ( ) ) |
Tilt of drop weight | 0.1 |
 ( ( ) ) |
Friction between piston and cylinder | 0.4 |
 ( ( ) ) |
Dispersion of transducer output | 0.4 |
| Combined standard uncertainty (k = 1) | 1.0 | |
| Expanded uncertainty (k = 2) | 2.0 | |
Uncertainty of the effective area  of the piston-cylinder assembly includes uncertainties of the dimensional measurements and spatial variations of the piston projected area, as well as the pressure dependency of the effective area. The uncertainty due to these effects is less than 0.05% at room temperature [3]. If heating is applied, the piston-cylinder assembly expands due to increased temperature. As the temperature may vary spatially in the piston-cylinder assembly, it is difficult to exactly estimate the change in the effective area. Therefore, a worst-case estimate of the maximum change is applied and added to the uncertainty budget. Even then, the effect of temperature in the range 20
  —200
—200  is smaller than 0.02%. Thus, the uncertainty of the effective area has only a minor effect on the overall uncertainty (table 1).
The most significant uncertainty sources are related to measurement of the maximum acceleration of the drop weight. These include uncertainty of acceleration due to bending and deformation of the impact mass ur( ), uncertainty caused by vibration induced noise ur(
 ) and uncertainty due to tilt of drop weight ur(
 ). As discussed earlier, deformation of the mass results in an error in the acceleration measurement. This is because the point of measurement does not correspond to the center of mass of the impact weight. The FEM model is used to correct for this error. The uncertainty ur(
 ) of this correction term is the most significant component in the overall measurement uncertainty (see table 1). The uncertainty due to vibration induced noise in the acceleration signal ur(
 ) is estimated as in [3] by plotting the amplitude of the measured maximum acceleration as a function of low-pass filter cut-off frequency and investigating changes in the neighborhood of the applied cut-off frequency (2 kHz). This procedure is applied for both interferometric measurements and the resulting uncertainties are included in the overall standard uncertainty. The uncertainty due to tilting of the drop weight during impact ur(
 ) is roughly estimated based on the difference between the acceleration signals measured from the front and back mirrors (see figure 6). Besides the aforementioned uncertainty sources, the uncertainty due to the coaxial alignment of the laser beam with the piston was also considered. Because of careful alignment of the laser, this uncertainty becomes negligible and is therefore not included in the overall uncertainty [3].
Uncertainty in acceleration measurement due to friction between the piston and the cylinder  ) is created by an eccentric impact between the impact hammer and the piston [17]. The gap between the piston and the cylinder is considered well lubricated and contact length is around 2 cm. However, in our drop weight device, point of impact between the impact hammer and the piston is hard to orient within 1 mm. Therefore, using the formula in [17], uncertainty in acceleration measurement due to friction between the piston and the cylinder is considered conservatively to be around 0.4%. Uncertainty due to dispersion of the measurement results ur(
 ) includes the spread of the peak pressure readings from the measurement standard and transducer under calibration. This uncertainty component will greatly depend on the spread of the transducer outputs under calibration and is typically between 0.2% and 1.2%. Spread from measurement standard is mostly caused by tilt of drop weight during impact and is typically in the order of 0.4%.
5. Example calibration
To demonstrate the operation of the primary measurement standard a piezoelectric transducer designed for use in marine engines was calibrated. The calibration was performed at maximum pressures of 7 MPa, 12 MPa and 30 MPa, which roughly corresponds to maximum cylinder pressures measured inside certain marine engine at typical operational loads of 25%, 50% and 100%.
The output of piezoelectric transducers is known to depend on temperature. The manufacturer of the transducers under calibration stated a temperature sensitivity of ± 0.02%/°C. Consequently, to achieve optimum accuracy, transducers needs to be calibrated at temperatures that correspond actual use. In maritime engines, the cylinder wall temperatures are typically around 200 °C. To investigate the actual temperature sensitivity of the transducers and to ensure traceability of measurements at high temperatures, calibrations were performed at three different temperatures 20 °C, 100 °C and 180 °C.
The transducer sensitivity values reported by the manufacturer were used for calculating the pressure readings. This implies that a calibration correction (measurement standard -transducer) of zero in figure 10 would indicate that the calibration result fully agrees with the sensitivity values reported by the manufacturer. As seen in figure 10 and tables 2 to 4, the sensitivity of the transducer decreases as the pressure and temperature rises. Results show that the temperature sensitivity is about 1%/(100 °C) and it is similar at different pressures. Although the temperature sensitivity is within manufacturers specifications, it will have a significant influence on the response of the transducer at high temperatures. Therefore, calibration of dynamic pressure transducers at temperatures corresponding actual use or exact knowledge about the temperature sensitivity is required for achieving optimum accuracy and traceability of measurements.

Figure 10. Calibration results for a commercial piezoelectric transducer.
Download figure:
Standard image High-resolution image
Table 2. Calibration results for the transducer at 20  .
.
| Measurement standardpeak pressure/MPa | Transducer peak pressure/MPa | Calibration correction/% | Spread of calibration results/% | Uncertainty of calibration(k = 2)/% |
|---|---|---|---|---|
| 6.73 | 6.66 | −1.1 | 0.6 | 1.8 |
| 12.08 | 12.02 | –0.5 | 0.5 | 1.9 |
| 30.10 | 29.71 | 1.3 | 0.3 | 1.7 |
Table 3. Calibration results for the transducer at 120  .
.
| Measurement standardpeak pressure/MPa | Transducer peak pressure/Mpa | Calibration correction/% | Spread of calibration results/% | Uncertainty of calibration (k = 2)/% |
|---|---|---|---|---|
| 6.55 | 6.56 | −0.2 | 0.6 | 1.9 |
| 12.07 | 12.05 | −0.2 | 0.5 | 1.7 |
| 29.85 | 29.25 | 2.0 | 0.3 | 1.6 |
Table 4. Calibration results for the transducer at 180  .
.
| Measurement standardpeak pressure/MPa | Transducer peak pressure/MPa | Calibration correction/% | Spread of calibration results/% | Uncertainty of calibration (k = 2)/% |
|---|---|---|---|---|
| 7.03 | 7.03 | 0.0 | 0.5 | 1.7 |
| 12.08 | 11.95 | 1.0 | 0.3 | 1.6 |
| 29.45 | 28.71 | 2.5 | 0.3 | 1.6 |
6. Discussion
The pressure range of the VTT MIKES primary dynamic pressure measurement standard was extended downwards by replacing the old 12.6 kg drop weight with a lighter one of 3.6 kg. In this way, the applicable calibration range of 3 MPa to 60 MPa was achieved. In principle, the pressure range could be lowered even more by applying an even lighter drop weight and adding some elasticity to the system. For example, putting more rubber on the impact hammer makes the system more elastic, and thus decreases the generated pressure. However, in practice mechanical problems like friction related effects become more dominant when operating with light drop weights and small dropping heights. Also, increasing the system elasticity by using thick rubber pads would increase the duration of the pressure pulse. In our drop weight setup, 3 MPa was the lowest feasible pressure we were able to generate with a few ms duration and a few percent measurement uncertainty.
The bending of the current 3.6 kg drop weight is by far the most dominant uncertainty component and it could be considerably reduced by changing the material from aluminum to steel. Simulations suggests that a more rigid drop weight would simplify calculation of the measurement results and decrease the uncertainty, because no correction terms would be needed.
One of the biggest challenges was to stabilize the drop weight during impact. The gap between the linear guides and the guiding rods is critical for achieving desired stability and acceptable friction. Commercial linear guides were tested, but suitable ones could not be found. Typically, the gap was too large causing strong vibrations during impact as well as unwanted stick-slip effects. Therefore, the linear guides were machined in-house to fine-tune the gap to achieve the optimal performance.
The heating option applied to the measurement head has been working well. Heating the measurement chamber and transducer up to 200  does not influence the performance of the measurement standard. Excessive heat dissipation in the proximity of the interferometer setup would cause misalignment of the laser beam due to thermal expansion of the optical components. This is avoided by applying thick insulation (see figure 4) and minimizing the heated volume. Moreover, the measurement head has a high thermal inertia and thus the measurements are typically completed before the outer parts of the measurement head gets heated.
A major current metrological challenge is a lack of overlap between pressure ranges of primary dynamic pressure standards, which prevents inter-comparison between primary methods and thus the metrological validation. Extending the range of the VTT MIKES dynamic pressure measurement standard down to 3 MPa would allow comparison against other primary methods, such as Shock tube, for a first time.
The extension of the pressure range of the VTT MIKES dynamic pressure measurement standard makes it possible to perform a comparison against shock tubes of other European NMI's in the overlapping pressure range. Although the frequency range of these methods is different, an inter-comparison would still provide valuable information on the primary realizations of dynamic pressure with these two methods. This type of comparison has already been planned to take place in the near future.
7. Conclusions
VTT MIKES has developed further its dynamic pressure measurement standard and extended the measurement range down to 3 MPa. Improvements include a new dual beam Michelson interferometer setup, new guiding rods and drop weight and a modified measuring head with a heating option. These improvements makes it possible to perform traceable calibrations of cylinder pressure transducers in the pressure and temperature range from 3 MPa to 60 MPa and 20 °C to 200 °C, respectively. Based on validation work, including experimental measurements and simulations, the potential uncertainty sources were identified and investigated in detail. As a result, the overall uncertainty (k = 2) of calibration was estimated to be around 1.7%. Furthermore, the performance was demonstrated by calibrating a piezoelectric pressure transducer in the pressure range from 7 MPa to 30 MPa at temperatures of 20 °C, 120 °C and 180°C. These developments enables traceable calibrations of cylinder pressure transducers at conditions relevant for engine applications, and as such, provides improvement in the accuracy and reliability of in-cylinder pressure measurements.
Acknowledgments
This project has received funding from the EMPIR programme co-financed by the Participating States and from the European Union's Horizon 2020 research and innovation programme. We would like to acknowledge Patrick Grahn for his insightful development and verification of FEM-simulations as well as Kari Ojasalo for his skillful development of electronics for measurement standard.