Residual Bond Behavior of Steel Reinforced Recycled Aggregate Concrete After Exposure to Elevated Temperatures
 Zongping Chen1,2*
  Ji Zhou
- 1College of Civil Engineering and Architecture, Guangxi University, Nanning, China
- 2Key Laboratory of Disaster Prevention and Structure Safety of Chinese Ministry of Education, Guangxi University, Nanning, China
As a frequent and serious disaster, fire will cause serious damage to a building's structure when it occurs, so it is very important to study the mechanical properties of structural components after a fire. In this paper, 20 push-out tests of steel reinforced recycled aggregate concrete (SRRAC) columns subjected to a fire were conducted in order to study the bond behavior between I-steel and recycled aggregate concrete (RAC) and the fire exposure was simulated by electrical oven. After this, the change of physical and mechanical properties and the process of mechanical failure of the specimens before and after high temperature exposure were analyzed, and the influence of various parameters on the bond behaviors of SRRAC subjected to elevated temperatures was discussed. At last, the calculation formulas of bond strength were put forward. Test results show that cracks appear on the surface of specimens when the maximum temperature is >400°C, and the higher the temperature is, the more and wider the cracks are. With the increase of temperature, the bond strength of the specimen decreases significantly. When the replacement percentage of RCA is <50%, the bond strength increases continuously, on the contrary, the bond strength decreases, and the bond strength of RAC specimens is larger than that of natural aggregate concrete (NAC) specimens. The comparative analysis of specimens subjected to different temperatures demonstrates that the higher the maximum temperature the slower the development of bond damage is. At the same time, the higher the maximum temperature is, the stronger the energy dissipation capacity is.
Introduction
RAC is deemed to be a green concrete to achieve sustainable development of building resources and environment, which can make waste concrete recyclable and save natural sand and stone, with significant social, economic, and environmental-potential benefits. Therefore, research on RAC has attracted the attention of scholars all over the world (Sagoe-Crentsil et al., 2001; McGinnis et al., 2017). Because recycled coarse aggregate (RCA) is obtained by crushing concrete, its surface is covered with old cement matrix and there are cracks in the process of crushing inside, which is greatly different from natural coarse aggregate (NCA). Numerous research efforts (Topcu and Sengel, 2004; Xiao et al., 2012a,b; Behera et al., 2014; Pedro et al., 2014; Li et al., 2015) at the material level have been made to investigate the mechanical properties of RAC, and the results have demonstrated that the inferior characteristics of RCAs (i.e., brittleness of adhesive old mortar, cracks generated during the crushing process, low particle density, high porosity) increase the probability of decreasing the target performance of RAC when compared to NAC at their same strength grade. In addition, relevant studies show that the mechanical properties and durability of RAC are more inconsistent than that of NAC, and it is also generally considered that the mechanical properties of RAC are slightly worse than that of NAC with the same mix proportion, and different replacement percentages of RCA have different effects on their performance differences (Bairagi et al., 1993; Olorunsogo and Padayachee, 2002). However, pertinent results show that the difference is within 15%. Therefore, many scholars believe that it is feasible to use recycled concrete when engineering structure (Tam et al., 2015; Li et al., 2016).
In order to further improve the mechanical properties of RAC in practical application, some scholars have put forward the concept of a steel-RAC composite structure, such as an SRRAC and RAC-filled steel tube (RACFST), which makes use of the composite effect between steel and RAC, so as to improve its adverse mechanical properties due to the natural defects of RCA. Relevant research results show that SRRAC and RACFST have good bearing capacity, seismic performance, and impact behavior (Qin et al., 2012; Ma et al., 2013, 2015; Li et al., 2015, 2017a,b, 2018). In the composite structure of steel reinforced concrete (SRC), the bonding performance of steel and concrete has a great influence on the mechanical properties of SRC members and structures, such as failure mode, bearing capacity, crack, deformation, and other mechanical characteristics and calculation assumptions (Chen et al., 2014; Yang H. F. et al., 2016), which are the basis of the cooperative work of steel and concrete.
At present, many scholars have been conducting much research on the bond-slip behavior of SRC. Roeder et al. (1999) evaluated dominant factors that affect the bond stress capacity through more than 120 SRC push-out tests; the results showed that the main influencing factors of bond stress included: (i) the thickness of the concrete cover; (ii) the relative size of the encased steel section; (iii) the length of the bond stress region. Yang et al. (2005) and Zheng et al. (2002) carried out standard SRC and solid abdominal SRC push-out tests. Studies had shown that the bond slip behavior of SRC was not only affected by the concrete strength grade, the length of embedded steel section and the thickness of concrete protective layer, but was also affected by the lateral stirrup ratio. With the development of research on RAC structure, researchers start to pay attention to the bond behavior between the interface of section steel and RAC. According to Chen et al. (2014), 11 push-out tests of SRRAC columns were conducted in order to study the bond performance between I-steel and RAC. The authors established the theoretical analytical model for bond shear transmission length in SRRAC columns through theoretical derivation, which can be used for the design of anchorage zones in SRRAC structures. Based on the research results reported in this study, it seemed that the RAC had significant influence on the ultimate bond strength. Then, Zheng et al. (2016) carried out 32 push-out tests of SRRAC columns to discuss the interfacial bond performance between H-shaped steel and RAC. The authors found that the bond strength increased with the replacement percentage of RCA increasing. The increase of the thickness of concrete protective cover will lead to the increase of the ultimate bond and residual bond stresses, because increasing the concrete protective cover thickness can improve the grip action between H-shaped steel and RAC. What's more, it was found that the RCA from the concrete with long serving age had a negative effect on the interfacial bond behavior. Liu et al. (2019) designed 9 SRRAC specimens to investigate the effect of four factors (i.e., the concrete strength, the cover thickness of I-steel, the embedded length of I-steel, the lateral stirrup ratio) on interfacial bond behavior. In the paper, four main factors were considered in formulas which are proposed to calculate bond strength, and the formulas fitted well with the results.
However, the existing research focuses on the interfacial bond behavior of SRRAC at normal temperature worldwide and there is no report on the interfacial bond behavior of SRRAC after exposure to the fire. As we all know, their good interfacial bond behavior is the basic guarantee of whether steel and RAC can work together. Ergün et al. (2016) investigated the influence of material properties on the bond strength between steel bars and concrete after high temperature exposure by using modified pull-out tests. The results showed that the first severe bond strength loss was, respectively, observed for grade S220a and grade S420a/S500a steel bars at the range of 200–400°C and 400–600°C. After different high temperature exposures (i.e., 200, 400, 600, 800°C), the range of the bond strength was 2.02–6.08, 1.45–5.8, 0.6–3.75, and 0.29–1.88 MPa, respectively. (Bingöl and Gül, 2009) studied the effect of cooling systems (i.e., water cooling and natural cooling) on the bond strength of steel bar and concrete after exposure to elevated temperature, and it can be concluded that the effect of cooling systems on bond strength is not obvious. Yang Y. et al. (2016) and Zou et al. (2020) had carried out experimental investigations on the bond behavior between steel bar and RAC after exposure to high temperature. The results indicated that an increment of the heating temperature decreased both the bond strength and the compressive strength of RAC continuously. When the specimens were subjected to thermal exposure of 200, 400, and 600°C, the range of the bond strength was 10.52–12.32, 4.64–9.81, and 1.27–8.53 MPa, respectively. Tao et al. (2011) carried out push-out tests on 64 CFST specimens subjected to elevated temperature. The authors concluded that the bond strength of the specimens generally decreased with 90 min fire exposure time, however, bond strength recovery was found when the fire exposure time was extended to 180 min, and the range of the bond strength was 0.11–2.01 MPa after thermal exposure of 1,000°C. At the same time, Song et al. (2017) found that welding internal rings or shear studs onto the inner surface of the steel tube can effectively retain a portion of the bond strength in fire, and the bond strength of the specimens exposed to 800°C was between 0.005 and 1.03 MPa. In general, a large number of research results have shown that the bond behavior between steel and concrete will degrade significantly after exposure to high temperature. As the core problem is of structural safety after fire, the bond behavior between them has a very significant impact on the safety assessment of SRRAC members after exposure to a fire. Therefore, 20 push-out tests of SRRAC columns subjected to high temperature were carried out in order to investigate the residual bond behavior between I-steel and RAC after fire. It should be noted that the fire exposure is realized by an electrical oven. Compared with real fire conditions (i.e., cellulosic fire or hydrocarbon fire heating), the electrical oven can simulate a constant high temperature environment, so that the overall heating of the specimen is more uniform. Bond behaviors of SRRAC subjected to high temperatures were push-out tested. After that, the degradation law of measured behaviors was discussed, which can provide reference for the bond behavior of an SRRAC composite structure exposed to a fire. This paper describes the first investigation of the bond behavior of SRRAC subjected to a fire. Meanwhile, the calculation formulas of bond strength are put forward.
Experimental Program
Test Specimens
In order to study the bond behavior of SRRAC subjected to elevated temperatures, 20 specimens were designed to carry out the push-out test. Two parameters were considered in this test: (a) replacement percentage of RCA (i.e., 0, 25, 50, 75, 100%); (b) maximum temperature (i.e., 20, 200, 400, 600°C), among them, the specimen experiencing 20°C was the control group, which didn't need to undergo high temperature test and represented the specimen being treated at normal temperature. The anchorage length of all specimens was 400 mm, the section size was 240 mm × 240 mm. When preparing the specimens, a section of 50 mm long I-steel was reserved at one end as the loading end, the other end kept the concrete and the section of I-steel flush as the free end. It should be highlighted that no treatment has been made on the steel surface to ensure compliance with engineering practice in this test. The geometric size and structure of the specimens are shown in Figure 1, and the specific parameters of each specimen are shown in Table 1. In the table, γ, T, and I represent the replacement percentage of RCA, the maximum temperature and mass loss ratio, respectively; the ultimate bond strength (τu) and the residual bond strength (τr) are calculated from peak load (Pu) and residual load (Pr) according to Equation (3) respectively; Ke and η indicate elastic shear bond stiffness and energy dissipation factor of specimens, respectively.
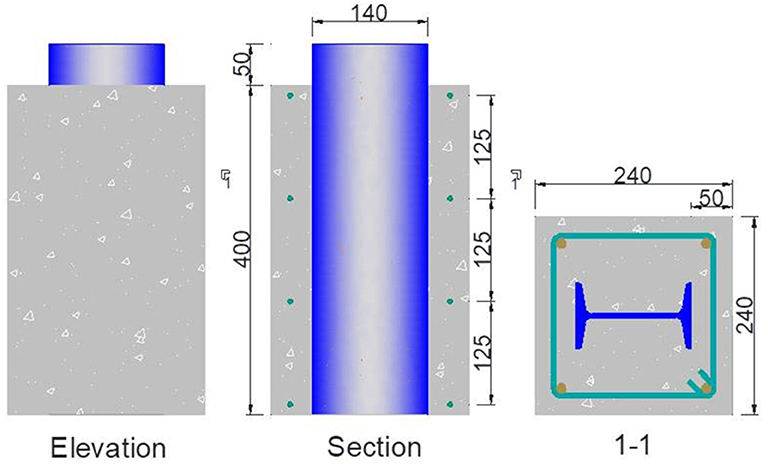
Figure 1. Dimensions and structure of specimens.
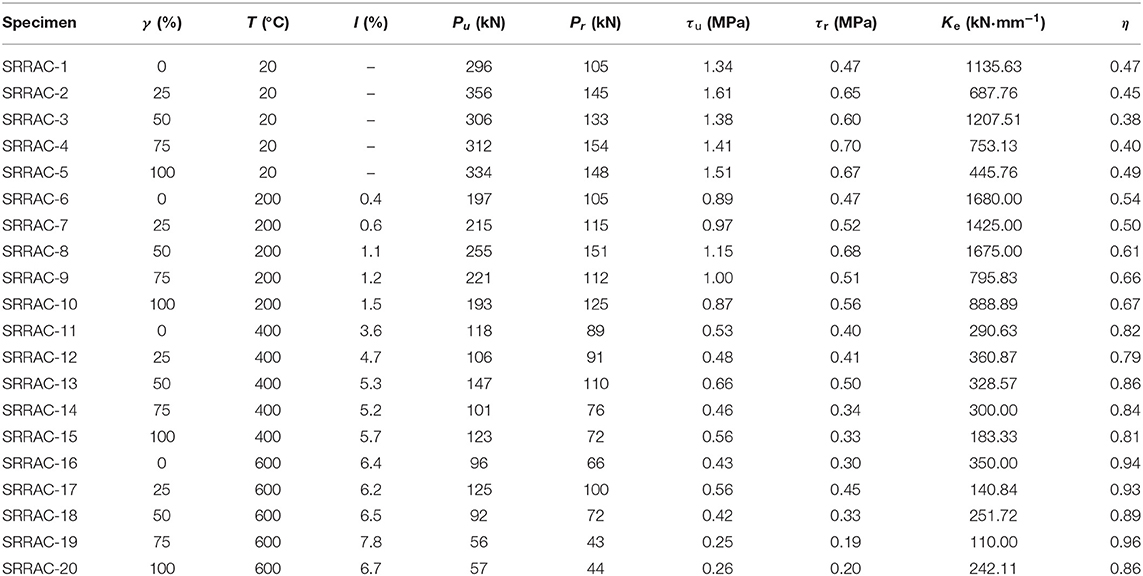
Table 1. Design parameters of specimens and main test results.
RCA Materials and Concrete Mixes
The RCAs were obtained by crushing and sieving the waste concrete specimens in the laboratory. The strength grade of the original concrete was C30, the type of coarse aggregate was gravel, and the used RCA and NCA were all continuous grade with a particle size of 5–31.5 mm. Depending on Chinese standard the Specification of Pebble and Gravel for Building (GB/T14685-2011), the apparent density and bulk density of RCA were 2,614 and 1,270 kg/m3, respectively, while those of NCA were 2,722 and 1,435 kg/m3, respectively. In contrast, the two densities of RCA were smaller. Meanwhile, the water absorption of RCA was 4.38%, while that of NCA was only 0.05%, and the reason was that the outer layer of RCA was wrapped by a large amount of cement matrix. What's more, these were the same as the findings of Vieira et al. (2011). The NCAs and RCAs are presented in Figures 2A,B. It should be noted that the RCAs are not wetted before mixing RAC. In addition, Ordinary Portland cement type 32·5R, well-graded small and medium-size river sand and urban tap water were used in the test. The strength grade of the concrete used in the specimen was C30, and five concrete mix proportions were designed by changing the proportion of RCA (i.e., replacement percentages of RCA: γ = 0, 25, 50, 75, and 100%). Different replacement percentages were achieved by changing the proportion (mass ratio) of RCA and NCA, while keeping other components (cement, water, fine aggregate) unchanged. The concrete mix proportions are given in Table 2.
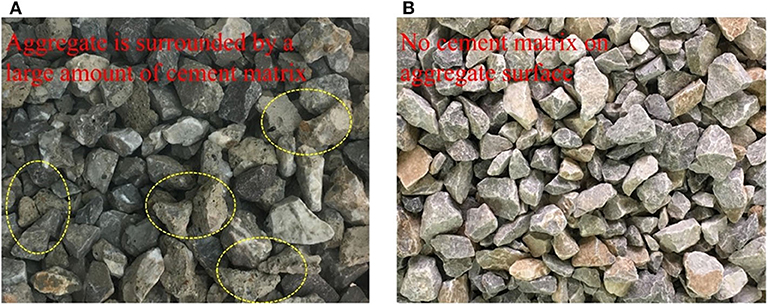
Figure 2. Recycled and natural coarse aggregates: (A) recycled gravel; (B) natural gravel.
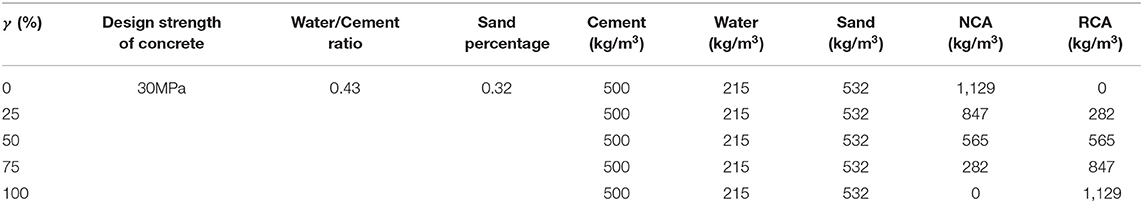
Table 2. Mix proportion of concrete.
Thermal Exposure
The part of the I-steel that was exposed to the air was sealed by A-grade glass wool with high temperature resistance up to 1,000°C in order to avoid direct contact with high temperature, as shown in Figure 3A. The specimens were subjected to a thermal exposure test using an RX3-45-9 box type resistance furnace (shown in Figure 3A) to simulate the fire environment, which had an automated device to control the rising rate of temperature; the maximum temperature can reach 950°C in the resistance furnace. It should be noted that the heating rate used in this test is 10°C/min. After it reached the target temperature for each group specimen, the temperature would be automatically constant. According to Chinese Code for Fire Protection of Building Design (GB 50016-2014), the constant temperature time was set to be 60 min for all specimens heated. It should be emphasized that although the specimen designed in this test size cannot reach the uniform target temperature along the steel section within 60 min holding time according to the heating rate of 10°C/min, the temperature difference is small along the specimen section. Moreover, the cross-section temperature field tended to be uniform after a holding time of 180 min (Zhou, 2013). After the constant temperature time was reached, the thermal exposure test was completed. At this time, the furnace door should be opened to disperse the heat in the furnace, so that the specimens can be cooled to room temperature as soon as possible under natural conditions. Figure 3B shows the measured heating curves in the high temperature furnace. It can be seen from the figure that the temperature in the furnace fluctuates during the heating process. The reason is that as the temperature increases, the water inside specimens evaporates to generate a large amount of water vapor. After the water vapor completely escapes from the gap of the furnace door, the temperature in the furnace tends to be stable, and specimens enter the constant temperature stage.
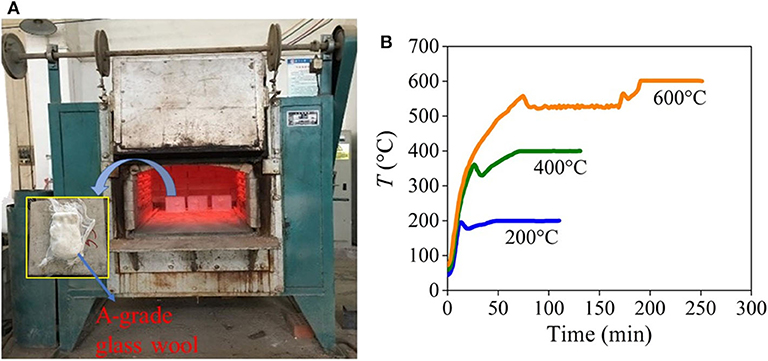
Figure 3. Heating equipment and heating curves: (A) resistance furnace; (B) temperature increase in the furnace.
Test Setup and Loading Process
Static push-out test of specimens subjected to high temperatures was carried out with an RMT-201 rock and concrete mechanics test system. In order to obtain load-slip (P-S) curves of the whole process of loading better, the loading system controlled by displacement was adopted, and the loading rate is 0.002 mm/s. During the load process, one end of the exposed I-steel was used as the loading end, and the other end was padded with a special steel plate as the free end. The special steel plate is cut on the I-shaped groove, and the I-steel flushed with the concrete would slide along the I-shaped groove, and a rectangular side groove was cut on the side of the I-shaped groove for laying the Dial gauge No. 4 to measure the displacement of the free end caused by the compression of the gap between the special steel plate and the specimen at loading time. At the free end, a steel bar was welded on I-steel and Dial gauge No. 3 was arranged on the steel bar, the slip at the free end was the difference between the measured data of Dial gauge No. 3 and Dial gauge No. 4. Meanwhile, Dial gauge No. 1 was placed on the steel plate attached to the top plate of the actuator, Dial gauge No. 2 was placed on the steel sheet attached to the concrete surface of the loading end of the specimen, and the slip at the loading end was the difference between the measured data of Dial gauge No. 1 and Dial gauge No. 2. The diagram of the test setup and components is shown in Figure 4.
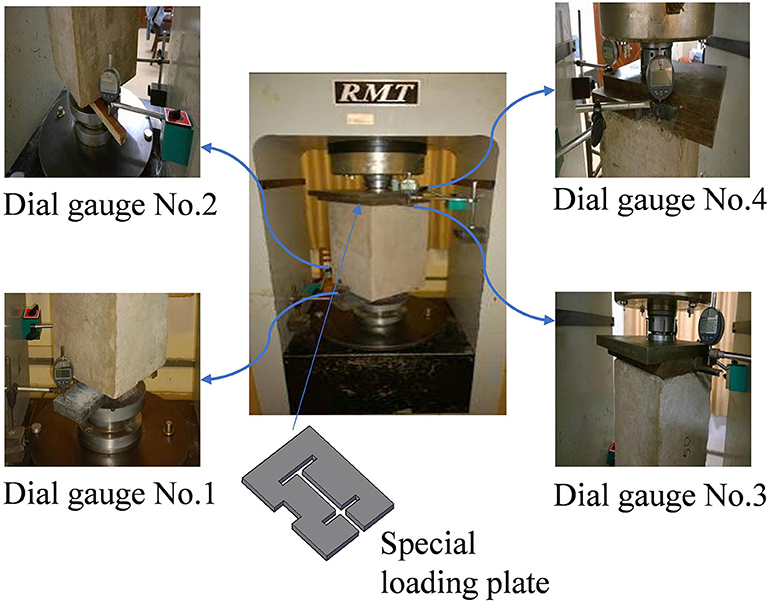
Figure 4. Test setup.
Test Results and Discussion
Change in Appearance
After the thermal exposure test, the surface of the specimen changed significantly. With the increase of maximum temperature, the apparent color of specimens gradually deepened, and cracks appeared and gradually widened. Under normal temperature, the color of specimens was gray white with no cracks on their surface. After 200°C exposure, the color of specimens turned light yellow without cracks on their surface. At 400°C, it turned brown gray with obvious cracks on the surface. And after 600°C exposure, it turned brown red with small network cracks on the surface. According to the results obtained by Zhao et al. (2018), as the heating temperature increased, the microstructure of HSC gradually deteriorated, which was mainly manifested by the continuous deterioration of ettringite and needle-like gel and the increasing pore structure of concrete. There was an objective relationship between the deterioration of the mechanical properties of HSC and changes in the microstructure. Gel molecules and cement hydrates decomposed at high temperature, causing pores and micro cracks on the surface and inside, which was the root cause of the deterioration of macroscopic mechanical properties. At the same time, after exposure to high temperatures, the exposed steel will be oxidized rapidly in the air and produce reddish brown iron oxide. The higher the temperature was, the more noticeable the color was. The apparent shape of specimens exposed to high temperatures is shown in Figure 5A.
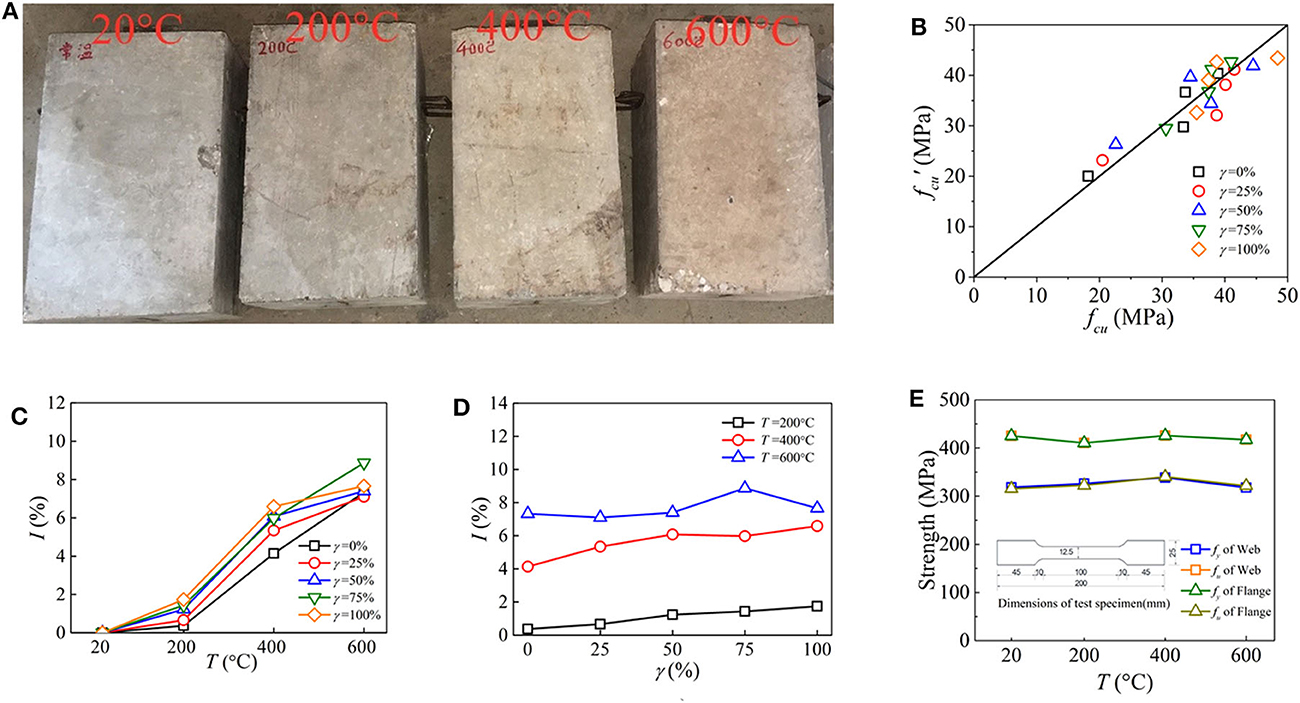
Figure 5. Physical properties of specimens and their materials: (A) change in appearance of specimens; (B) comparison of test and calculation values of concrete strength; (C) measured steel strength; (D) effect of maximum temperature on mass loss ratio; (E) effect of replacement percentage on mass loss ratio.
Material Properties Exposed to Elevated Temperatures
When preparing the specimens, standard cubes (150 mm × 150 mm × 150 mm) were cast, and they were cured and treated at a high temperature under the same conditions as the corresponding SRRAC specimen, then tested to evaluate compressive strength according to the standard test method, and the measured strength is shown in Table 3. It can be seen from the table that the average compressive strength of RAC subjected to high temperatures changed with the maximum temperature and the replacement percentage of RCA, in which the maximum temperature played a decisive role. Based on the analysis of the measured data, considering the combined effect of maximum temperature and the replacement percentage of RCA, the least square method was used to fit the measured data, and the formula of cubic compressive strength of RAC after exposure to high temperatures was obtained.
where fcu(T,γ) is the cubic compressive strength of RAC when the replacement percentage is γ and the maximum temperature is T, fcu is the cubic compressive strength of NAC at room temperature. Equation (1) can be used to estimate the strength of RAC with a different replacement percentage when the maximum temperature is <600°C, and constant temperature duration is 60 min. Figure 5B shows the comparison between the measured compressive strength of the cube test block exposed to elevated temperatures and the results calculated by Equation (1). It can be seen from the figure that the results are in excellent agreement.
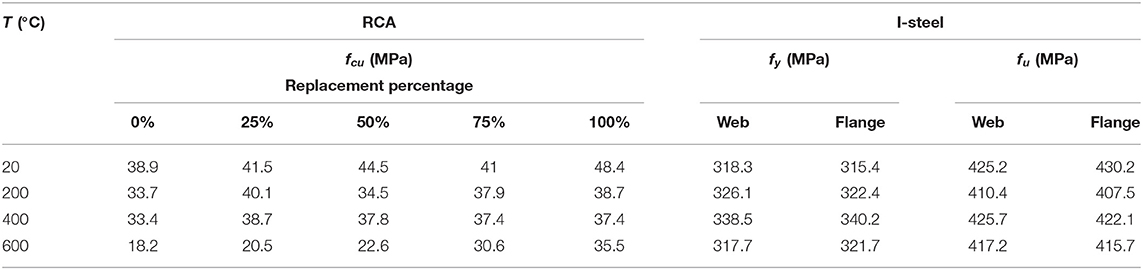
Table 3. Material properties after exposed to high temperatures.
Steel material specimens with length of 200 mm and width of 25 mm were cut from the flange and web of I-steel in the same batch, respectively, and they will be carried out together with SRRAC specimens at high temperature after being processed to the required size in the factory. The exact processing size is shown in Figure 5C. Mechanical properties indexes were tested according to the Chinese standard of Tensile Test for Metallic Materials (GB /T228.1-2010). The change of steel properties with the maximum temperature is shown in Figure 5C and the measured value is shown in Table 3. According to the measured steel properties, when maximum temperature was <600°C, the material properties of steel had little difference with the increase in temperature, and the strength of flange and web of I-steel was basically the same.
Mass Loss Ratio
After exposure to high temperatures, the free water and the combined water in the RAC will largely evaporate. The evaporation of water will decompose the C-S-H gel contained in some cement paste, which will seriously deteriorate the mechanical properties of concrete. Therefore, the mass loss ratio can be defined by using Equation (2). As an important performance indicator, it reflects the changes of the RAC before and after thermal exposure.
where Mb and Ma are the mass of specimens before and after thermal exposure (kg), respectively.
The change trend of mass loss ratio of RAC specimens with the maximum temperature and the replacement percentage of RCA is illustrated in Figures 5D,E. It can be observed in the figure that with the same replacement percentage, the mass loss ratio of the specimen obviously increases with the increase of temperature. At 200°C, the mass loss ratio of the specimen ranges from 0.4 to 1.5%; at 400°C, it ranges from 3.6 to 5.7%; and when the maximum temperature reaches 600°C, it ranges from 6.2 to 7.8%. It can be seen from Figure 5D that when the maximum temperature increases from 200 to 400°C, the mass loss ratio changes the most. The reason is that when the temperature reaches 200°C, a large amount of moisture stored in the concrete will evaporate, which is confirmed by the observation that a large amount of fog will escape from the furnace mouth when the temperature is between 200 and 400°C during the heating process. As shown in Figure 5E, when the maximum temperature is the same, the mass loss ratio gradually increases with the increase of the replacement percentage. The reason is that the surface of RCA is wrapped by the cement matrix, and the water absorption capacity is stronger than that of NCA. Therefore, the specimens with a higher replacement percentage contain a higher total amount of free water, and after thermal exposure test, the free water in the concrete is evaporated, which results in the higher mass loss ratio of the specimen with high replacement percentage.
Failure Pattern
By observing the loading process, it was found that when the load was added to 5–6% Pu (Pu was the ultimate load), slippage first appeared at the loading end of the specimen, and the slippage developed slowly. At this time, there was no slip at the free end. With the increase of load, the slippage at the loading end continued to increase, and the slippage at the free end also appeared. When the load approached 80% Pu, slight cracks began to appear on the surface of the specimen, which was mainly concentrated at the flange of I-steel at the loading end and the free end. When the load was >80% Pu, the cracks on the side near the flange of I-steel gradually developed from both ends to the middle of the specimen, and were slowly connected together with the increase of the load, forming a main crack through the full section height of the specimen, as shown in Figure 6. At the moment of crack penetration, the specimen made a “click” sound, which was caused by the sudden failure of chemical bonding force between I-steel and RAC. After that, the load dropped sharply to 60–70% Pu, and then entered the stable sliding stage. The load remained stable at this stage. After loading, the RAC which was near I-steel of specimens was seriously broken at the free end, and there was obvious slip joint between the I-steel and the RAC.
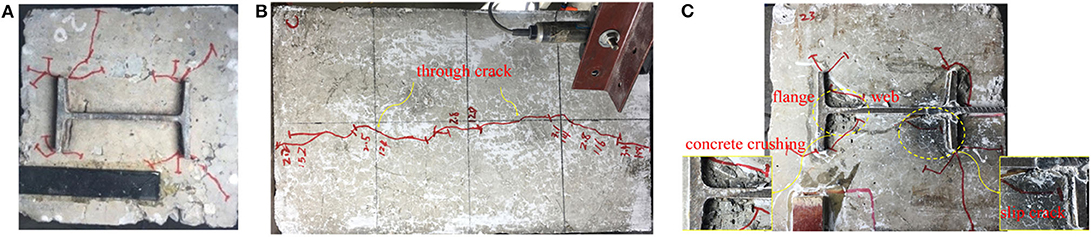
Figure 6. Typical crack form of specimen: (A) loading end; (B) lateral; (C) free end.
P-S Curves
The load-slip (P-S) curve of the loading end and the free end of each specimen is shown in Figure 7. The shape of the P-S curve at both ends is roughly similar. Compared with the slip at the free end, the slip at the loading end occurs earlier, because the load at the load end is smaller when the slip occurs, and the difference between the two curves of some specimens is obvious (i.e., Figures 7D,F,K,Q). Existing research results (Sulaiman et al., 2017; Chen et al., 2018) indicate that the bond stress between steel and concrete is mainly composed of chemical bonding force, grip force and friction force. When there is no slip or the slip is small, the bond stress is mainly provided by chemical bonding force. Then, the bonding force will be completely lost with the increase of slip, while the grip force and friction force begin to play an important role in providing the bond stress. Finally, when the slip is large, the concrete on the interface has been seriously broken, and the bond stress is only provided by the friction force. Based on the above theory, the three stages (i.e., upward stage, downward stage and plateau stage) of P-S curve are analyzed.
(1) Upward stage: before the ultimate load is achieved, the slip of the specimen increases with the increase of the load, and the relationship between them is linear. At the initial stage of loading, the interfacial bonding force of the specimen is mainly provided by the chemical bonding force. With the increase of the load, the slip first occurs at the loading end. When the load reaches 50–70% Pu, the free end appears to slip. With the gradual expansion of the sliding section from the loading end to the free end, the chemical bonding force is gradually lost, and the interfacial bonding force is mainly composed of grip force and friction resistance.
(2) Downward stage: when the load reaches the ultimate load, the downward stage of P-S curve can be divided into two types: a steep drop and slow drop. For specimens whose P-S curves are a steeply falling section, the concrete in the interface layer is further broken, and its extrusion effect on the I-steel increases with the development of an interfacial slip from the loading end to the free end, so the grip force and friction resistance are continuously increased. At the same time, the chemical bonding force of the interface layer is completely lost along the whole length of concrete, whose loss is far greater than the increase of grip force and friction resistance, so there is a steep drop section, such as SRRAC-1–SRRAC-10 specimens. For specimens whose P-S curves are a slowly falling section, the cement colloid in the interface layer is completely shut off, the internal crack of concrete is no longer developed, and the damage degree is basically stable. Although the concrete between the interfaces will continue to be damaged, the degree is slight, and the values of grip force and friction resistance decrease gently, there is a slow drop section, such as SRRAC-11–SRRAC-20 specimens.
(3) Plateau stage: in this stage, the decrease of load obviously slows down. The damage degree of interface layer and the values of grip force and friction resistance tend to be more stable. And as the loading continues, the specimen continues to slip, so the P-S curve presents an obvious plateau stage in this process.
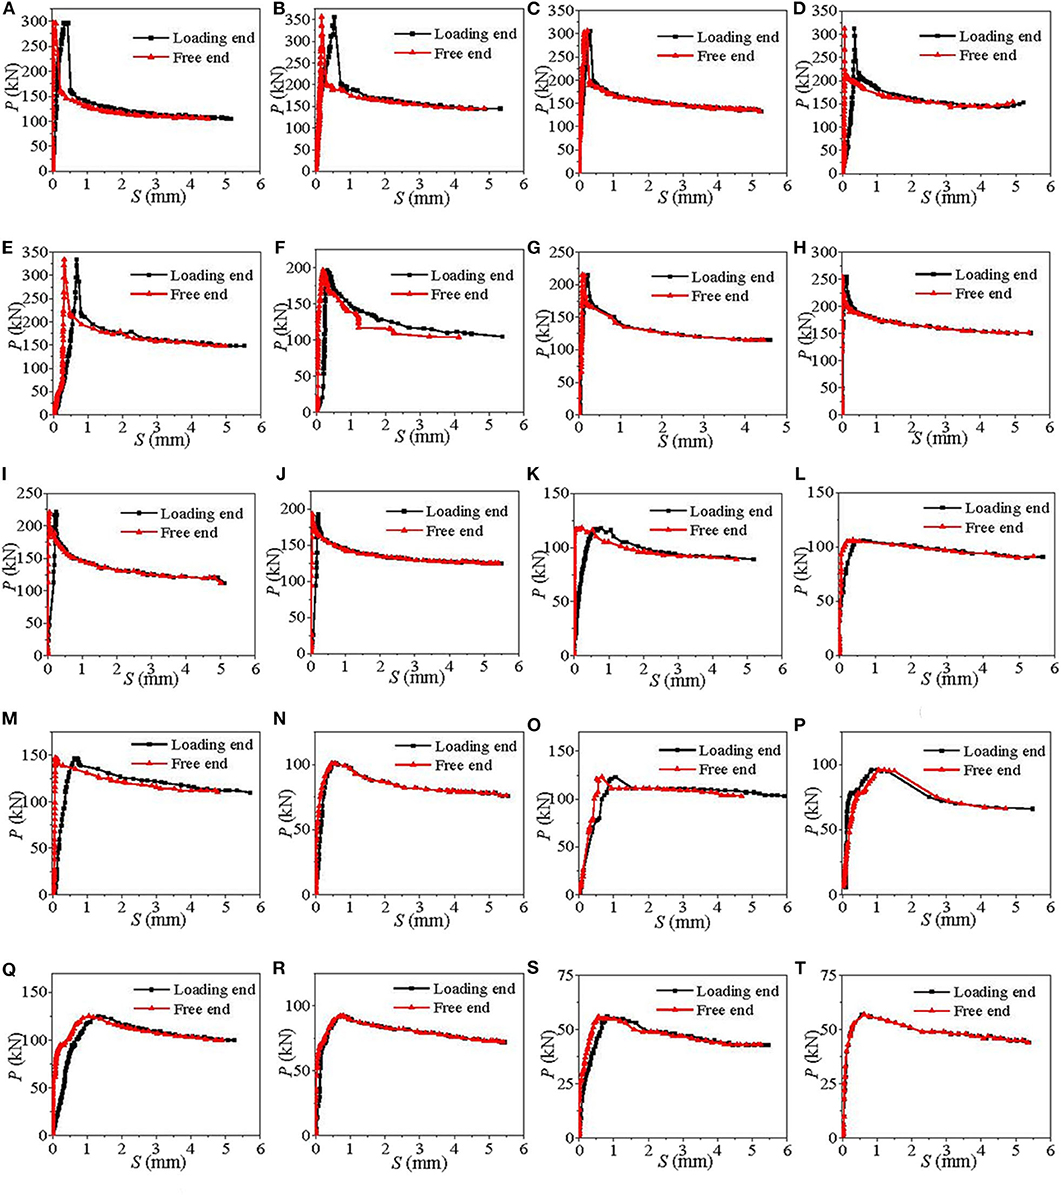
Figure 7. P-S curves of specimens: (A) SRRAC-1; (B) SRRAC-2; (C) SRRAC-3; (D) SRRAC-4; (E) SRRAC-5; (F) SRRAC-6; (G) SRRAC-7; (H) SRRAC-8; (I) SRRAC-9; (J) SRRAC-10; (K) SRRAC-11; (L) SRRAC-12; (M) SRRAC-13; (N) SRRAC-14; (O) SRRAC-15; (P) SRRAC-16; (Q) SRRAC-17; (R) SRRAC-18; (S) SRRAC-19; (T) SRRAC-20.
As shown in Figure 8, all P-S curves at loading end of SSRAC specimens subjected to high temperatures are divided into three types of typical curves, among which the first and third type of curve include OA, AB and BC sections, where the second type of curve only includes OA and AB sections. In particular, the OA section is the upward stage, and the three kinds of curves are obviously rising, but the slope of the first type of curve is greater than the second and the third type of curve. For the AB section, this stage is the downward stage, the first type of curve is the most rapid decline in this stage, and the curve drops sharply after reaching the ultimate load, in which the values of the slippage (Su, Sr) are smaller corresponding to the ultimate load (Pu) and the residual load (Pr), respectively, and this kind of curve mainly appears in the specimen exposed to 20 and 200°C. Section AB and BC of the second type of curve are basically connected, and the slope of section AB is almost zero and in a horizontal state. In this type of curve, the load slightly decreases after passing Pu, and Su is small but Sr is large. It mainly occurs in the specimen exposed to 400°C. In the third type of curve, the AB section is the slow descent section, and the slope of the curve decreases gradually during the descent process. The third type of curve appears in the specimen exposed to 600°C, and Pu is basically below 100 kN. The three kinds of curves fall slowly in BC section and are basically horizontal, so they are treated as plateau stage.
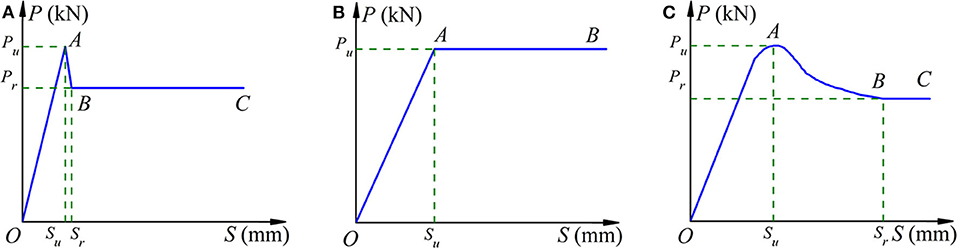
Figure 8. Typical curve classification: (A) first kind of curve; (B) second kind of curve; (C) third kind of curve.
Bond Strength
Table 1 illustrates all specimens' characteristic values of the P-S curve of the specimen at loading end, in which Pu is the ultimate load on the P-S curve and Su is its corresponding slippage. In the later stage of loading, the slip between the loading end and the free end increases continuously. With the increase of the slippage, the change of the load with the increase of the slip tends to be constant, the fluctuation is small (<1 kN) and the load is basically unchanged. It can be considered that the load enters the residual stage of the bond. Based on the accuracy and convenience of analysis, define the load as Pr which fluctuates within 1 kN when the slip at loading end increases by 0.05 mm and Sr is its corresponding slippage. The interfacial shear stress, corresponding to Pu and Pr, respectively, is defined as ultimate bond strength τr and residual bond strength τu, and its value is obtained by Equation (3).
where τ is the bond strength, MPa; P is the value of load, N; s is the perimeter of contact interface, mm; la is the anchorage length, mm. It can be seen from the Equation (3) that the interfacial bond stress of SRRAC specimens is closely related to the anchorage length and the perimeter of contact interface of the specimens. Liu et al. (2019) have confirmed that the bond stress decreases with the increase of the relative anchorage length and increases with the increase of the relative cover thickness, where the relative cover thickness is computed by the ratio of the cover thickness to the profile height of section steel.
In order to facilitate post-disaster assessment, the bond strength measured by the test is compared with the specified limit at ambient temperature in the relevant specifications (i.e., EC 4 and AIJ) to determine whether the interfacial bond behavior of the SRRAC structure after the fire still meets the requirements of the specification. The European code BS 540025 (2005) stipulates that the bond strength should be 0.4 MPa in the anchorage zone, while the Japanese code AIJ (1997) stipulates that the bond strength should be 0.02fc (fc is the design value of concrete compressive strength) and not <0.45 MPa. It can be seen from Table 1 that when the maximum temperature is <200°C, the τu and τr of the specimen are between 0.47 and 1.61 MPa, which meet the requirements of the above two standards on the design value of bond strength. When the maximum temperature is >200°C, the bond strength decreases rapidly to basically lower than the requirements of standards, and decreases with the increase of the replacement percentage of RCA. Based on this, it is suggested that the shear connectors should be appropriately increased to enhance the bond strength of the SRRAC structure, which is likely to suffer in high temperatures exceeding 600°C. At the same time, the bond strength measured in this test is far from that in the existing similar literature mentioned in the introduction, because the bond strength is significantly affected by the steel surface condition (i.e., plain or deformed) and the concrete strength. In addition, the bond strength of specimens exposed to high temperature is also affected by the maximum temperature and the holding time of constant temperature.
Factors Influence on Bond Strength
Maximum Temperature
Figures 9A,B shows the change of interfacial bond strength with the increase of maximum temperature. It can be seen from the figure that at the same replacement percentage of RCA, the bond strength of SRRAC presents a gradual decrease rule with the increase of the maximum temperature. The average bond strength is taken which represents the bond strength of specimens with different replacement percentages at the same maximum temperature. It is found that the average ultimate bond strength of specimens at room temperature is 1.45MPa. Compared with that, the average ultimate bond strength of specimens subjected to 200, 400, and 600°C decreases by 32.8, 62.9, and 79.7%, respectively. The average residual bond strength of the specimens at room temperature is 0.618 MPa, which is 42.6% of the corresponding average ultimate bond strength. Compared with that, the average residual bond strength of the specimens subjected to 200, 400, and 600°C decreases by 11.3, 35.9, and 52.4%, respectively. Why does this happen? On the one hand, the chemical bonding force between I-steel and RCA is greatly reduced after high temperatures exposure. On the other hand, referring to the theory proposed by Chen et al. (2018), once fretting wear behavior emerges on the interface of steel and concrete, steel and the tiny embossments on the surface of concrete will occlude each other, which bring about mechanical interlocking. In the occlusion, the concrete embossments with less strength firstly fail in shear and then fractures, resulting in the gradual decrease of grip force. Therefore, the grip force between I-steel and RAC is also greatly reduced as a result of reduction in the strength of RAC exposed to high temperature. At the same time, it is similar to the rule that the bond strength of SRC changes with temperature after exposure to high temperatures.
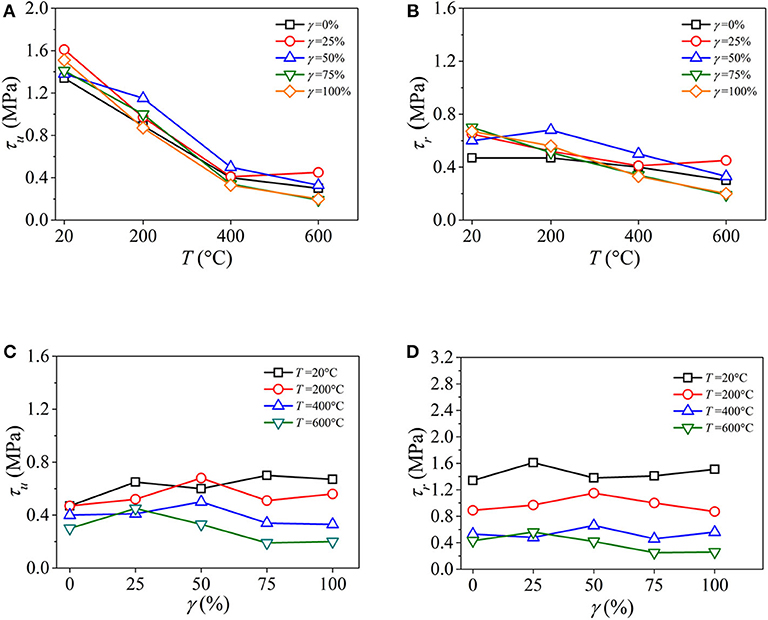
Figure 9. Effect of different parameters on bond strength: (A) change of ultimate bond strength with maximum temperature; (B) change of residual bond strength with maximum temperature; (C) change of ultimate bond strength with replacement percentage; (D) change of residual bond strength with replacement percentage.
Replacement Percentage of RCA
The change of the interfacial bond strength of the specimen with the replacement percentage of RCA is shown in Figures 9C,D. It can be seen from the figure that the bond strength of different specimens has a certain discreteness. In order to eliminate this influence the average bond strength is compared, which is the average value of the bond strength of specimens subjected to different temperatures with the same replacement percentage. The comparison shows that the change rule of the average ultimate bond strength and the average residual bond strength with the replacement percentage is similar. When the replacement percentage of RCA is <50%, the bond strength increases continuously, and when the replacement percentage of RCA is larger than 50%, the bond strength decreases. The bond strength of RAC is larger than that of NAC. The reason is that RCA is obtained by mechanical crushing, and compared with NAC the surface of RCA is rougher and more angular, so the grip force at the surface of I-steel is more sufficient. However, the RCA itself is composed of cement and NCA, and there are original micro cracks in it. The existence of such micro cracks will weaken the grip force between I-steel and concrete. It can be seen from the analysis that when the replacement percentage of RCA is <50%, RCA only accounts for a small part of the whole coarse aggregate of concrete, and the advantage of RCA is more obvious in increasing the grip force between the I-steel and the concrete, so the bond strength is constantly increasing. Nevertheless, when the replacement percentage of RCA is larger than 50%, most of the coarse aggregate of concrete is occupied by RCA. Because there are many original initial cracks in the RCA, the disadvantages are obvious, and the bond strength is reduced. Generally speaking, the bond strength of SRRAC specimens is greater than that of SRC specimens.
Evaluation of Bond Strength of SRRAC Subjected to Elevated Temperatures
In order to discuss the calculation method of interfacial bond strength of SRRAC subjected to elevated temperatures, this paper takes maximum temperature (T), replacement percentage of RCA (γ), concrete strength (fcu) and ratio of height to anchorage length of I-steel (h/la) as the influence parameters of bond strength. According to the measured value of the experiment on bond strength of SRRAC subjected to high temperatures, the regression statistics of ultimate bond strength and residual bond strength are used to analyse the bond strength of SRRAC subjected to high temperatures. The calculation formula is obtained.
Ultimate bond strength:
Residual bond strength:
where T is maximum temperature, the value range is 20–600°C; γ is replacement percentage of RCA, the value range is 0–100%; fcuis cubic concrete compressive strength; lais anchorage length; h is the section height of the I-steel.
As shown in Figure 10, the calculated bond strength τcand the measured bond strength τt are well-matched. For ultimate bond strength, the average ratio of τu, c/τu, t is 1.02 with a standard deviation of 0.135, while for residual bond strength, the average ratio of τr, c/τr, t is 1.02 with a standard deviation of 0.144. In summary, there is a high consistency between the Equation (4)–(5) and the tested results, either ultimate bond strength or residual bond strength.
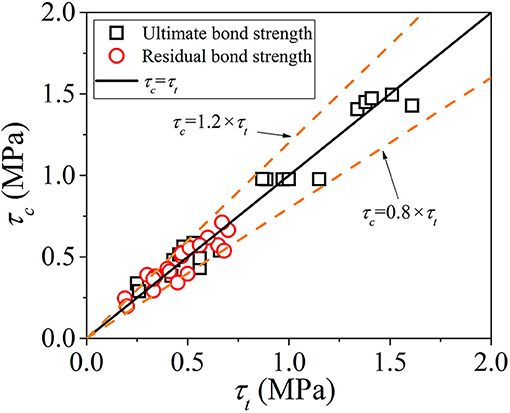
Figure 10. Comparison of test and calculated results.
Influence of Elevated Temperatures on Interfacial Bond Failure
Interfacial Shear Bond Stiffness
Interfacial shear bond stiffness is an index to express the ability to resist the sliding deformation caused by shear stress at the interface between I-steel and RAC. In this paper, when the load on the P-S curve at the loading end is 0.4Pu, the secant slope between the corresponding point and the origin is defined as the elastic shear bond stiffness (Ke) of the specimen. Although there are no specimens with different anchorage length in this paper, the relevant research (Xu et al., 2013) shows that shear bond stiffness will increase significantly with the increase of anchorage length within a certain range. Figure 11A shows the change of the Ke value of each specimen with maximum temperature. It can be seen from the figure that with the increase of the maximum temperature, the Ke value of each specimen first increases, then decreases, and finally tends to be gentle. At the same replacement percentage, when the maximum temperature is lower than 200°C, the Ke value of the specimen increases gradually with the increase of temperature and reaches the maximum at 200°C, and when the temperature is larger than 200°C, the Ke value of the specimen starts to decrease sharply, which indicates that the shear resistance of the specimen starts to decrease significantly at this stage, the reason being that part of the chemical bonding force between I-steel and RAC is lost. Therefore, when the maximum temperature is 400°C, the Ke value of the specimen is generally small. When the temperature is larger than 400°C, the Ke value of the specimen changes slightly and gently, and the difference of Ke value is small between the maximum temperature of 400 and 600°C, which indicates that when the temperature is higher than 400°C, the reduction of the bonding force of the specimen is basically stable, and the shear capacity basically remains unchanged. When the temperature is within 400°C, the shear bond stiffness of high replacement percentage is significantly lower than that of low replacement percentage, because there are more initial micro cracks between I-steel and RAC with high replacement percentage due to the crushing of RAC, resulting in the reduction of a chemical bonding force and grip force.
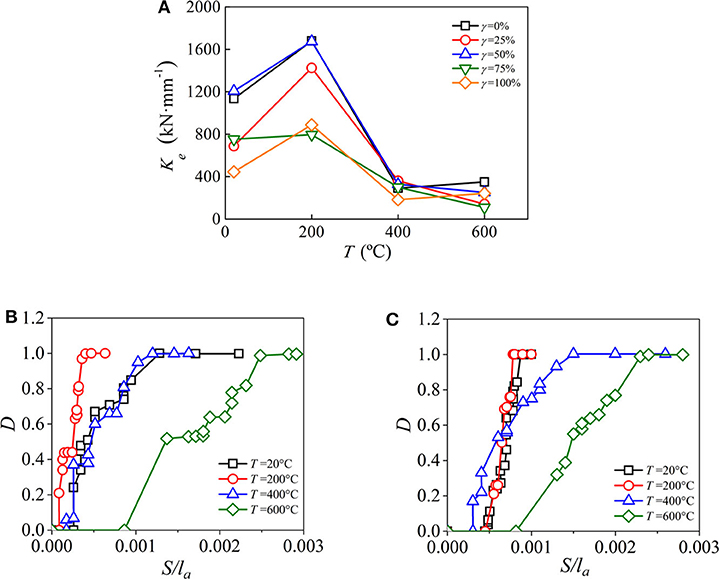
Figure 11. Influence of elevated temperatures on interfacial bond failure: (A) elastic shear bond stiffness; (B) bond damage of specimens with 50% replacement percentage; (C) bond damage of specimens with 100% replacement percentage.
Interfacial Damage
The concept of damage degree proposed in reference (Xu et al., 2013) is used to quantitatively analyze the change of bond shear stiffness of the P-S curve at the loading end. The expression is as follows:
where Kt is the tangent slope of any point in P-S curve at the loading end and Ke is the shear bond stiffness on the elastic stage.
With the development of relative slip (S/la), the change of damage degree (D) of some specimens is shown in Figures 11B,C. When the specimen is just loaded, the D is 0, the interface between I-steel and RAC is in the elastic bonding stage, and there is no damage at this stage. As the loading proceeds, the bonding interface enters the elastic-plastic stage, and at this time the damage appears and begins to develop gradually, and the D varies from 0 to 1. It can be seen from the figure that the S/la value of each specimen is <0.001 when the bonding interface of the specimen starts to appear damaged. Comparing interfacial damage of specimens showed that when the maximum temperature is lower than 400°C, the difference of S/la is small as the specimen starts to damage, and its values are all <0.0005. When the maximum temperature is 600°C, the S/la value is about 0.0009 as the specimen is damaged. Therefore, when the maximum temperature is larger than 400°C, the damage of the specimen appears later, because the high temperature causes the expansion deformation of RAC, and the residual deformation still exists in the RAC after exposure to high temperatures, which causes the extrusion pressure between the I-steel and RAC, and the existence of extrusion pressure makes the gap between the I-steel and RAC smaller, so that the development of damage can be delayed. From the view of damage rate, the damage rate of the specimen exposed to smaller maximum temperature is faster than that of the specimen exposed to larger maximum temperature, which verifies the reason why the upward stage of the P-S curve of the specimen exposed to smaller maximum temperature is relatively fast. With the increase of the replacement percentage of RCA, the rules of relative slip and damage rate are not obvious.
Interfacial Energy Dissipation
In the process of the bonding failure of SRRAC specimens, there is energy absorption and consumption. The bonding interface transforms mechanical energy into its own elastic-plastic deformation energy, and releases energy in other forms. In this paper, the energy dissipation of the interface between the I-steel and RAC subjected to high temperatures is studied, and the energy dissipation factor (η) is defined by the following formula:
where SOBDE is the shadow area in Figure 12A and SOACE is the rectangular area of rectangle OACE.
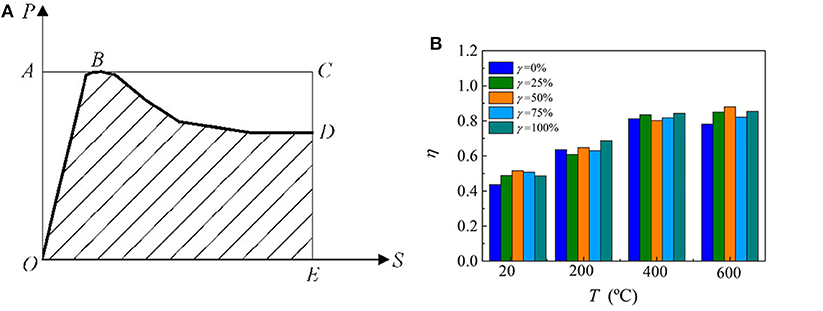
Figure 12. Interfacial energy dissipation: (A) energy dissipation area; (B) energy dissipation factors.
The comparison of η value of each specimen is shown in Figure 12B. It can be seen from the figure that with the increase of the maximum temperature, the η value of the specimen increases gradually, and the η value of the specimen with the temperature of 20°C is the smallest, with the average value of 0.49. When the maximum temperature is larger than 400°C, the η value is between 0.8 and 0.9, about twice of the η value of the specimen with the temperature of 20°C. Therefore, in a certain range of temperature, the energy dissipation capacity of SRRAC can be improved with the increase of temperature. Through the comparison of energy dissipation factors of specimens with different replacement percentages at the same temperature, it is found that the replacement percentage of RCA has little effect on the bonding energy dissipation capacity, and the difference of the η value is small.
Conclusion
In this paper, the bond behavior between the I-steel and RAC after exposure to elevated temperatures was investigated through push-out tests of SRRAC specimens. The following conclusions can be drawn:
(1) The mass loss ratio of SRRAC specimens subjected to elevated temperatures is obviously affected by the maximum temperature and replacement percentage of RCA, and with the increase of maximum temperature or replacement percentage, the mass loss ratio of the specimens increases gradually.
(2) After exposure to high temperatures, the P-S curves of SRRAC specimens have experienced three stages, including upward stage, downward stage and plateau stage. The shape of the P-S curve is similar between the loading end and the free end, and the slip first occurs at the loading end. With the increase of the maximum temperature, the P-S curve of SRRAC specimen is gentler, and the peak load point gradually decreases and shifts to the right.
(3) After exposure to elevated temperatures, the bond strength of SRRAC specimens decrease continuously with the increase of maximum temperature. Compared with the specimen exposed to 20°C, the ultimate bond strength of specimens exposed to 200, 400, and 600°C decreases by 32.8, 62.9, and 79.7%, respectively, and the residual bond strength decreases by 11.3, 35.9, and 52.4% respectively. With the increase of replacement percentage of RCA, when γ is <50%, the bond strength increases continuously, and when γ is larger than 50%, the bond strength decreases, and the bond strength of RAC specimens is larger than that of NAC specimens.
(4) Combined with the existing results, according to the measured data in this paper, the calculation formula of bond strength of SRRAC after exposure to high temperatures is obtained by fitting, and the calculated value is close to the test value, which provides a reference for the numerical simulation analysis of SRRAC structures exposed to high temperatures considering the effect of bond-slip.
(5) After exposure to elevated temperatures, when the maximum temperature is <200°C, the Ke of SRRAC specimens increases gradually with the increase of temperature, and when the maximum temperature is >200°C, the Ke begins to decrease sharply, and the shear capacity of specimens begins to decrease significantly at this stage. In addition, the development of bond damage of SRRAC specimens exposed to elevated temperatures is related to the experienced temperature. The higher the maximum temperature is, the slower the development of bond damage is. At the same time, the higher the maximum temperature is, the stronger the energy dissipation capacity of the specimen is.
Data Availability Statement
All datasets generated for this study are included in the article/supplementary material.
Author Contributions
ZC conceived the experiments. JZ and XW wrote the initial draft of the manuscript. JZ and MB analyzed the data and wrote the final manuscript. All authors contributed to the article and approved the submitted version.
Funding
This research report was financially supported by the National Natural Science Foundation of China (No. 51268004), the Key Project of Natural Science Foundation of Guangxi Province (No. 2016GXNSFDA380032), and Special Fund Project for Bagui Scholars ([2019] No. 79).
Conflict of Interest
The authors declare that the research was conducted in the absence of any commercial or financial relationships that could be construed as a potential conflict of interest.
Acknowledgments
The authors are very grateful for the support of the above project funds.
References
AIJ (1997). Recommendations for Design and Construction of Concrete Filled Steel Tubular Structure. Tokyo: Architectural Institute of Japan (AIJ).
Bairagi, N. K., Ravande, K., and Pareek, V. K. (1993). Behavior of concrete with different proportions of natural and recycled aggregates. Resour. Conserv. Recycl. 9, 109–126. doi: 10.1016/0921-3449(93)90036-F
Behera, M., Bhattacharyya, S. K., Minocha, A. K., Deoliya, R., and Maiti, S. (2014). Recycled aggregate from C&D waste & its use in concrete–a breakthrough towards sustainability in construction sector: a review. Constr. Build. Mater. 68, 501–516. doi: 10.1016/j.conbuildmat.2014.07.003
Bingöl, A. F., and Gül, R. (2009). Residual bond strength between steel bars and concrete after elevated temperatures. Fire Saf. J. 44, 854–859. doi: 10.1016/j.firesaf.2009.04.001
BS 540025 (2005). Steel Concrete and Composite Bridges-Part 5: Code of Practice for the Design of Composite Bridges. British Standard Institute.
Chen, Z. P., Liu, X., and Zhou, W. X. (2018). Residual bond behavior of high strength concrete-filled square steel tube after elevated temperatures. Steel Compos. Struct. 27, 509–523. doi: 10.12989/scs.2018.27.4.509
Chen, Z. P., Xu, J. J., Liang, Y., and Su, Y. S. (2014). Bond behaviors of shape steel embedded in recycled aggregate concrete and recycled aggregate concrete filled in steel tubes. Steel Compos. Struct. 17, 929–949. doi: 10.12989/scs.2014.17.6.929
Ergün, A., Kürklü, G., and Başpinar, M. S. (2016). The effects of material properties on bond strength between reinforcing bar and concrete exposed to high temperature. Constr. Build. Mater. 112, 691–698. doi: 10.1016/j.conbuildmat.2016.02.213
Li, T., Xiao, J., Zhu, C., and Zhong, Z. (2016). Experimental study on mechanical behaviors of concrete with large-size recycled coarse aggregate. Constr. Build. Mater. 120, 321–328. doi: 10.1016/j.conbuildmat.2016.05.110
Li, W., Luo, Z., and Tao, Z. (2017a). Mechanical behavior of recycled aggregate concrete-filled steel tube stub columns after exposure to elevated temperatures. Constr. Build. Mater. 146, 571–581. doi: 10.1016/j.conbuildmat.2017.04.118
Li, W., Luo, Z., and Wu, C. (2017b). Experimental and numerical studies on impact behaviors of recycled aggregate concrete-filled steel tube after exposure to elevated temperature. Mater. Des. 136, 103–118. doi: 10.1016/j.matdes.2017.09.057
Li, W., Luo, Z., and Wu, C. (2018). Impact performances of steel tube-confined recycled aggregate concrete (STCRAC) after exposure to elevated temperatures. Cem. Concr. Compos. 86, 87–97. doi: 10.1016/j.cemconcomp.2017.11.009
Li, W., Xiao, J., and Shi, C. (2015). Structural behaviour of composite members with recycled aggregate concrete—an overview. Adv. Struct. Eng. 18, 919–938. doi: 10.1260/1369-4332.18.6.919
Liu, C., Fan, Z., Chen, X., Zhu, C., Wang, H., and Bai, G. (2019). Experimental study on bond behavior between section steel and RAC under full replacement ratio. KSCE J. Civil Eng. 23, 1159–1170. doi: 10.1007/s12205-019-0702-1
Ma, H., Xue, J., Liu, Y., and Zhang, X. (2015). Cyclic loading tests and shear strength of steel reinforced recycled concrete short columns. Eng. Struct. 92, 55–68. doi: 10.1016/j.engstruct.2015.03.009
Ma, H., Xue, J., Zhang, X., and Luo, D. (2013). Seismic performance of steel-reinforced recycled concrete columns under low cyclic loads. Constr. Build. Mater. 48, 229–237. doi: 10.1016/j.conbuildmat.2013.06.019
McGinnis, M. J., Davis, M., Rosa, A. D. L., Weldon, B. D., and Kurama, Y. C. (2017). Quantified sustainability of recycled concrete aggregates. Mag. Concrete Res. 69, 1203–1211. doi: 10.1680/jmacr.16.00338
Olorunsogo, F. T., and Padayachee, N. (2002). Performance of recycled aggregate concrete monitored by durability indexes. Cem. Concrete Res. 32, 179–185. doi: 10.1016/S0008-8846(01)00653-6
Pedro, D., De Brito, J., and Evangelista, L. (2014). Influence of the use of recycled concrete aggregates from different sources on structural concrete. Constr. Build. Mater. 71, 141–151. doi: 10.1016/j.conbuildmat.2014.08.030
Qin, W. Y., Chen, Y. L., and Chen, Z. P. (2012). Experimental study on flexural behaviors of steel reinforced recycled coarse aggregate concrete beams. Appl. Mech. Mater. 166–169, 1614–1619. doi: 10.4028/www.scientific.net/AMM.166-169.1614
Roeder, C. W., Chmielowski, R., and Brown, C. B. (1999). Shear connector requirements for embedded steel sections. J. Struct. Eng. 125, 142–151. doi: 10.1061/(ASCE)0733-9445(1999)125:2(142)
Sagoe-Crentsil, K. K., Brown, T., and Taylor, A. H. (2001). Performance of concrete made with commercially produced coarse recycled concrete aggregate. Cem. Concrete Res. 31, 707–712. doi: 10.1016/S0008-8846(00)00476-2
Song, T. Y., Tao, Z., and Han, L. H. (2017). Bond behavior of concrete-filled steel tubes at elevated temperatures. J. Struct. Eng. 143:04017147. doi: 10.1061/(ASCE)ST.1943-541X.0001890
Sulaiman, M. F., KhunMa, C., Apandi, N. M., Chin, S., Zawawi, A., Mansur, A. S. A., et al. (2017). A review on bond and anchorage of confined high-strength concrete. Structures 11, 97–109. doi: 10.1016/j.istruc.2017.04.004
Tam, V. W., Kotrayothar, D., and Xiao, J. (2015). Long-term deformation behaviour of recycled aggregate concrete. Constr. Build. Mater. 100, 262–272. doi: 10.1016/j.conbuildmat.2015.10.013
Tao, Z., Han, L. H., and Uy, B. (2011). Post-fire bond between the steel tube and concrete in concrete-filled steel tubular columns. J. Construct. Steel Res. 67, 484–496. doi: 10.1016/j.jcsr.2010.09.006
Topcu, I. B., and Sengel, S. (2004). Properties of concretes produced with waste concrete aggregate. Cem. Concrete Res. 34, 1307–1312. doi: 10.1016/j.cemconres.2003.12.019
Vieira, J. P. B., Correia, J. R., and De Brito, J. (2011). Post-fire residual mechanical properties of concrete made with recycled concrete coarse aggregates. Cem. Concrete Res. 41, 533–541. doi: 10.1016/j.cemconres.2011.02.002
Xiao, J., Li, W., and Fan, Y. (2012b). An overview of study on recycled aggregate concrete in China (1996–2011). Constr. Build. Mater. 31, 364–383. doi: 10.1016/j.conbuildmat.2011.12.074
Xiao, J., Li, W., and Poon, C. (2012a). Recent studies on mechanical properties of recycled aggregate concrete in China—a review. Sci. China Tech. Sci. 55, 1463–1480. doi: 10.1007/s11431-012-4786-9
Xu, J. J., Chen, Z. P., and Xue, J. Y. (2013). Failure mechanism of interface bond behavior between circular steel tube and recycled aggregate concrete by push-out test. J. Build. Struct. 34, 148–157. doi: 10.14006/j.jzjgxb.2013.07.018
Yang, H. F., Lan, W. W., Qin, Y. H., and Wang, J. (2016). Evaluation of bond performance between deformed bars and recycled aggregate concrete after high temperatures exposure. Constr. Build. Mater. 112, 885–891. doi: 10.1016/j.conbuildmat.2016.02.220
Yang, Y., Guo, Z., Xue, J., Zhao, H., and Nie, J. (2005). Experiment study on bond slip behavior between section steel and concrete in SRC structures. J. Build. Struct. 26, 1–9. doi: 10.14006/j.jzjgxb.2005.04.001
Yang, Y., Yu, Y., Guo, Y., Roeder, C. W., Xue, Y., and Shao, Y. (2016). Experimental study on shear performance of partially precast Castellated Steel Reinforced Concrete (CPSRC) beams. Steel Compos. Struct. 21, 289–302. doi: 10.12989/scs.2016.21.2.289
Zhao, D. F., Gao, H. J., Jia, P. H., Wen, H., and Yang, J. H. (2018). Performance degradation of high strength concrete (HSC) after different-high-temperature history. J. Vib. Shock 37, 240–248. doi: 10.1063/1.4992902
Zheng, H., Chen, Z., and Xu, J. (2016). Bond behavior of H-shaped steel embedded in recycled aggregate concrete under push-out loads. Int. J. Steel Struct. 16, 347–360. doi: 10.1007/s13296-016-6008-y
Zheng, S. S., Yang, Y., Xue, J. Y., Yu, M. Y., and Zhao, H. T. (2002). Study on bond-slip performance between steel and concrete in SRC structures. China Civil Eng. J. 35, 47–51. doi: 10.15951/j.tmgcxb.2002.04.009
Zhou, C. H. (2013). Experiment research and theoretical analysis on mechanical behaviors of steel reinforced recycled aggregate concrete column after fire (high temperature) (Ph.D. thesis). Guangxi University, Nanning, China.
Keywords: steel reinforced recycled aggregate concrete, thermal exposure, push-out test, bond strength, bond damage
Citation: Chen Z, Zhou J, Ban M and Wang X (2020) Residual Bond Behavior of Steel Reinforced Recycled Aggregate Concrete After Exposure to Elevated Temperatures. Front. Mater. 7:142. doi: 10.3389/fmats.2020.00142
Received: 19 December 2019; Accepted: 24 April 2020;
Published: 12 June 2020.
Edited by:
Guangming Chen, South China University of Technology, ChinaReviewed by:
Wengui Li, University of Technology Sydney, AustraliaMing Xiang Xiong, Guangzhou University, China
Copyright © 2020 Chen, Zhou, Ban and Wang. This is an open-access article distributed under the terms of the Creative Commons Attribution License (CC BY). The use, distribution or reproduction in other forums is permitted, provided the original author(s) and the copyright owner(s) are credited and that the original publication in this journal is cited, in accordance with accepted academic practice. No use, distribution or reproduction is permitted which does not comply with these terms.
*Correspondence: Zongping Chen, zpchen@gxu.edu.cn