
Abstract
The rapid growth in railway infrastructure and the construction of high-speed heavy-haul rail network, especially on ground that is basically unsuitable, poses challenges for geotechnical engineers because a large part of the money invested in the development of railway lines is often spent on track maintenance. In fact around the world, the mud pumping of subgrade fines is one of the common reasons why track performance deteriorates and track stability is hindered. This article presents a series of laboratory tests to examine following aspects of mud pumping: (1) the mechanisms of subgrade fluidisation under undrained condition, (2) the effects of mud pumping on the engineering characteristics of ballast, and (3) the use of vertical drains to stabilize subgrade under cyclic loads. The undrained cyclic triaxial testing on vulnerable soft subgrade was performed by varying the cyclic stress ratio (CSR) from 0.2 to 1.0 and the loading frequency f from 1.0 to 5.0 Hz. It is seen from the test results that for a specimen compacted at an initial dry density of 1790 kg/m3, the top portion of the specimen fluidises at CSR = 0.5, irrespective of the applied loading frequency. Under cyclic railway loading, the internal redistribution of water at the top of the subgrade layer softens the soil and also reduces its stiffness. In response to these problems, this paper explains how the inclusion of vertical drains in soft subgrade will help to prevent mud pumping by alleviating the build-up of excess pore pressures under moving train loads.
1 Introduction
Over the last few decades the growth of railway infrastructure across the world has been exponential, with massive strides being taken towards the development of high-speed heavy-haul rail networks. However, this rapid advancement in the railway industry often presents geotechnical engineers with challenging ground site conditions. In Australia alone, a major chunk of the money invested is spent on annual track maintenance [1] that stems from the common, and worldwide, problem of mud pumping that has adverse effects on the track substructure and also increases the overall cost of track maintenance [2,3,4]. To illustrate, at present, along the east coast of New South Wales, Australia there are almost 300 active pumping locations where wet cohesive fines have been pumped to the surface [5].
Put simply, mud pumping is the upward migration of subgrade soil fines into the coarser ballast layer. Where the ground-water table is high, subgrade slurry forms at the ballast-subgrade interface, and when this slurry is subjected to repetitive rail loading, it is then pumped up to the surface of the ballast [6]. The extent of mud pumping in ballasted tracks around the world can be seen in the examples shown in Fig. 1. The pumped slurry not only reduces the bearing capacity of the track foundation, it also forms mini-soil volcanoes along the sides of the track. Furthermore, the intrusion of fines into the ballast layer hinders its free draining capacity and also reduces interlocking between the angular ballast particles [7].

Sightings of mud pumping on ballasted rail track in Australia
The term “ballast fouling” is widely used to indicate the deterioration of ballast which has degraded its engineering characteristics. Ballast fouling generally has three sources: (1) ballast abrasion and breakage, (2) external sources such as coal waste and dust, and (3) subgrade fluidisation and infiltration through the subballast and ballast layers. While the mechanism of types (1) and (2) has already been addressed to some degree [8,9,10], existing studies on the fouling mechanism induced by subgrade fluidisation are limited. The following paper addresses the mechanism of subgrade fluidisation induced by high cyclic stresses induced by the railway loading through a series of undrained cyclic triaxial tests. As a consequence of subgrade fluidisation, the performance of the clay-fouled ballast is further investigated through: (1) large-scale permeability tests to assess the hindered drainage capacity and (2) large-scale triaxial tests to evaluate the reduced shear strength and degraded resilient modulus. Additionally, the effectiveness of prefabricated vertical drains (PVDs) in reducing the pore pressure build-up in soft subgrade through field and numerical simulations is presented.
2 Subgrade fluidisation under undrained cyclic triaxial tests
To further improve our understanding of mud pumping under ballasted rail tracks, a detailed geotechnical characterisation of vulnerable subgrade soil was needed. This section describes the various factors that affect subgrade fluidisation, followed by a pertinent discussion on the cyclic response of pumping prone subgrade.
2.1 Factors affecting subgrade fluidisation
-
Atterberg limits
The upper and lower bounds of water content where soil exhibits plastic behaviour are defined as the liquid limit (wLL) and the plastic limit (wPL) respectively [11]. These limits are collectively known as the Atterberg limits. The subgrade soils that were reported to have already pumped are mainly in the low-to-medium plasticity region on the soil plasticity chart [5, 12]. However, several of the mud pumping locations in New South Wales, Australia, are along the east coast, so they consist of low compressible estuarine clays with water levels that are often close to the liquid limit [5]. Therefore, this subgrade soil is in a fully saturated state and the continual passage of trains results in serious deformation followed by the subgrade becoming softer.
-
Presence of fines
Indraratna et al. [13] reported that this problematic subgrade soil has an overall fines fraction (< 75 μm) of about 30%. As well as fines, this soil also has a filter ratio (D15coarse/D85fine, where D15coarse is the diameter that corresponds to 15% finer by weight of coarse particles and D85fine is the diameter at 85% finer by weight of fine particles, respectively) of 5.8, this indicates there is a high susceptibility towards internal instability [14,15,16]. Since these clayey fines have a larger specific surface area, they adsorb more water, whereas other studies reported a large amount of fines in the subgrade [4, 17,18,19].
-
Hydraulic gradient
Subgrade fines cannot migrate unless there is a certain level of hydraulic gradient over the track foundation, but the repeated passage of trains causes a large increase in excess cyclic pore pressure in the saturated subgrade layers. Alobaidi and Hoare [20] carried out finite element simulations to study the pore pressures generated near the top of the subgrade under static loading. As Fig. 2 shows, the pore pressure at the end of the simulated subbase particle dissipated from 10.0 to 0.6 kPa within 0.25 s. This rapid dissipation of pore pressure between the centre and the end of the subbase particles amounts to an equivalent hydraulic gradient of 147; therefore, a high hydraulic gradient is considered to be one of the main forces which drive the migration of subgrade slurry.
Fig. 2 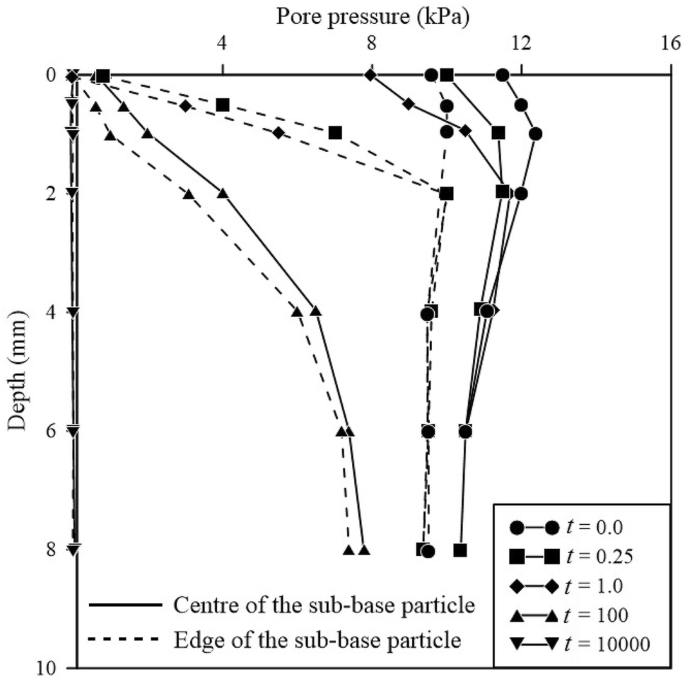
Pore pressure dissipation at different time intervals under the subbase particle (re-analysed after [20])

2.2 Experimental setup
An image of the GDS ELDYN apparatus at the University of Wollongong used for this study is shown in Fig. 3. The major components of the equipment include (1) a dynamic actuator (± 5 kN up to 5.0 Hz), (2) a rigid loading frame, (3) a trixial cell, (4) an inlet for filling the cell, (5) a pore pressure transducer, (6) a pneumatic cell pressure controller (up to 650 kPa), (7) a back pressure controller to saturate the soil specimens, (8) a data logger (10 data points per cycle were recorded), and (9) a computer. One-way stress-controlled tests were carried out in accordance with the ASTM D5311-92 standards. The soil sample was oven-dried and mixed with 15% water by weight and compacted in ten layers using the non-linear under compaction criterion [21]. The specimen was 50 mm in diameter by 100 mm high. Further details of sample preparation can be sought elsewhere [13].

a GDS ELDYN triaxial equipment at University of Wollongong. b Schematic layout of the cyclic triaxial equipment
2.3 Undrained cyclic triaxial testing
To investigate the mechanism of mud pumping, a series of undrained cyclic triaxial tests were carried out on samples of remoulded subgrade soil collected from a track site near Wollongong City, Australia. This particular track had shown frequent signs of previous mud pumping and was subjected to frequent maintenance. The soil was collected from the top of the subgrade layer after the rails, the sleepers, and the ballast and sub-ballast layer had been removed. The soil was then transported to the lab facilities at the University of Wollongong for further classification. The basic geotechnical properties of the soil are listed in Table 1. The soil is classified as low plastic clay; the CL has a plasticity index of 11 and a liquid limit of 26% [22]. Cyclic tests were carried out on remoulded soil specimens compacted at various initial dry densities (ρd) to study the cyclic stress ratio (CSR) and the loading frequency (f) affected the development of cyclic axial strains (εac) and the normalised mean excess pore pressure (EPP). The experimental procedure is summarised in the flowchart, refer to Fig. 4, while the test details are tabulated in Table 2. The present experimental study was carried out to represent the worst case scenario wherein the ballast layer is excessively fouled, either through excessive ballast breakage or by coal particles [5], rendering the subgrade layer below in a near undrained state.

Flowchart of the test scheme adopted for the undrained cyclic triaxial tests
The CSR is defined as the ratio between half of the applied cyclic stress (\(\sigma_{\text{d}}\)) and the effective confining pressure (\(\sigma_{{3{\text{c}}}}^{{\prime }}\)):
Since mud pumping is a shallow surface phenomenon, an effective confining of 15 kPa was used to anisotropically consolidate the specimens (the ratio of horizontal to vertical stress k0 = 0.6). These specimens were subjected to a wide range of CSR (0.2–1.0) and loading frequency (f = 1.0–5.0 Hz) to represent varying magnitudes of axle load and train speeds [13].
2.4 Results and discussion
The pore pressure transducer and linear variable differential transformer (LVDT) were calibrated before each test to ensure the data was measured accurately. The development of excess pore pressure and the accumulated cyclic axial strain (εac) was influenced by the soil properties [e.g. relative compaction (RC)] and the loading conditions (e.g. CSR and f). The following section presents the key results from the undrained cyclic triaxial testing of remoulded subgrade soil specimens.
2.4.1 Critical CSR
As Fig. 5 shows, when the CSR increases from 0.2 to 1.0, there is a critical cyclic stress ratio (CSRc) beyond which the cyclic axial strain (εac) and mean excess pore pressure ratio increase rapidly; this result is similar to those found by previous researchers investigating the threshold cyclic stress ratio [23,24,25]. For example, when the specimen was compacted at an initial dry density of ρd = 1790 kg/m3 and then subjected to a frequency f = 1.0 Hz, the CSRc is between 0.4 and 0.5, but when the specimen was compacted at a lower density (ρd = 1680 kg/m3) the CSRc dropped to between 0.3 and 0.4. The situation where the specimen fluidises when subjected to the critical cyclic stress ratio, including the mechanism, is discussed in detail in further sections.

Variation in the cyclic axial strains and mean excess pore pressure at 1.0 Hz frequency
2.4.2 Loading frequency, f
The loading frequency has a pronounced effect on the cyclic axial strains (Fig. 6), so when the CSR < CSRc and the specimens do not fluidise under cyclic loading, the resulting higher frequency causes a higher cyclic axial strain. For example, Fig. 6 shows that at 1.0 Hz the cyclic axial strain slowly accumulated to 0.25% after 50,000 cycles, but at 5.0 Hz it was as high as 0.9% after the same number of cycles. When the CSR = 0.5 (> CSRc), however, the higher frequency delayed the fluidisation (failure) of the specimen. Similar observations of frequency dependence were made by earlier researchers [26, 27] albeit with different soil and loading characteristics. This means that in the time domain, asmaller frequency imparts a load on the soil specimen for a longer period of time, and this results in higher cyclic axial strains and excess pore pressure.

Effect of loading frequency on subgrade fluidisation
The critical number of cycles Nc can be estimated by the inflection point on the concave plot of strains that were subjected to CSR > CSRc [13]. Figure 7 shows that when CSR > CSRc the relationship between the critical number of cycles Nc and the loading frequency is almost linear, irrespective of the initial dry densities. Moreover, the loading frequency is more prominent at a higher dry density because the critical number of cycles Nc is higher.

Influence of loading frequency on the critical number of cycles and residual axial strain
2.4.3 Relative compaction (RC)
RC (or the degree of compaction) is defined as the ratio between the initial dry density of a specimen and the maximum dry density obtained from the Standard Proctor test [28]. The samples compacted at higher initial dry density, i.e. having a higher RC, tended to resist the applied cyclic stresses better than the loosely compacted specimens. Figure 8 shows that the samples with ρd = 1790 kg/m3 fluidised at a CSR ≥ 0.5, whereas at lower densities (1600 and 1680 kg/m3) the specimens fluidised at CSR = 0.3 and 0.4, respectively. Furthermore, the residual axial strain εar increased from 0.08% to 0.4% when the density decreased from 1790 to 1600 kg/m3. Therefore, increasing the dry density or RC will reduce the void ratio and may help to control the cyclic axial strains and increase the cyclic shear strength of the subgrade soil [13].

Influence of initial dry density on the critical CSRc and Nc
2.5 Mechanism of fluidisation
2.5.1 Based on the physical changes within the specimen
Figure 9a shows a typical specimen which fluidised under cyclic loading (f = 1.0 Hz and CSR = 0.5) where the top portion of the specimen has formed a thick suspension-like slurry. Chawla and Shahu [18] simulated a large-scale physical track model and observed an increment in the water content near the top of the subgrade when mud pumping took place. Similarly, the water content measured at the top of one selected specimen (ρd = 1790 kg/m3, CSR = 0.5, and f = 1.0 Hz) revealed that post-fluidisation was 23.1%, which is close to the liquid limit of the soil. Furthermore, when the particle size distribution curves of specimens that fluidised at high cyclic stress ratios were examined, a significant amount of finer fractions (< 75 μm) had migrated from the central region to the top of the specimen (Fig. 9b). Therefore, under repeated loading, an upward migration of fines and an internal redistribution of the water content fluidised the test specimens. Indraratna et al. [29] measured the liquidity index (LI, which is the ratio of the difference between the current water content and the plastic limit to the plasticity index) of the specimen that have fluidised. It was observed that the fluidised specimens have the LI close to 1.0 at the top part of the specimen (Fig. 10). In other words, the top portion of the fluidised specimen has a water content close to the liquid limit. Thereby, the top portion changes from a solid state to a fluid-like state.

Post-fluidisation analysis of the specimen (modified after [13])

Variation of the liquidity index (LI) of the specimens along the specimen height (modified after [29])
2.5.2 Stiffness degradation
As discussed in earlier sections, when a specimen was subjected to a CSR ≥ CSRc, there was a rapid accumulation of strains. The degradation of these soil specimens was evaluated using the axial dynamic stiffness at a given loading cycle N (i.e., Ed,N) as follows:
where σd,max and σd,min are the maximum and minimum deviatoric stress experienced by the specimen, respectively; and εac,max and εac,min are the maximum and minimum cyclic axial strains for the given loading cycle N, respectively. The stiffness degradation index is computed as follows:
where \(E_{{{\text{d}},1}}\) is the axial dynamic stiffness of the first loading cycle.
As Fig. 11 shows, when the specimen was subjected to CSR = 0.5 it experienced a sudden reduction in its axial dynamic stiffness, so when the specimen had fluidised there was a rapid accumulation of pore pressure and axial strain, and a large reduction in its stiffness.

Variation of the degradation index with number of cycles (ρd = 1790 kg/m3, f = 1.0 Hz)
3 Influence of mud pumping on the performance of ballast
Mud pumping associated with ballast fouled by a fluidised subgrade has adverse effects on the performance of ballasted tracks, which is why it has been comprehensively investigated at the University of Wollongong over the past few years. This adverse influence can be categorised as (1) a reduced drainage capacity, (2) a reduced shear strength and friction angle, (3) a degraded resilient modulus, and (4) substantial track deformation under cyclic loads. The following sections will describe these aspects further by considering the laboratory test data.
3.1 Reduced drainage capacity of ballasted tracks
The permeability associated with the drainage capacity of ballast is one of the primary parameters that are directly and severely affected by mud pumping. The infiltration of fluidised subgrade soil into the ballast reduces its porosity, permeability and drainage capacity, so a series of permeability tests were carried out on fresh ballast mixed with different percentages of clay to investigate the drainage of fouled ballast [30]. Typical Kaolin clay with a liquid limit (wLL) of 52% and a plasticity index (PI) of 26% was used as fouling material. To carry out these tests, a large chamber of 500 mm diameter by 500 mm high was designed to ensure there would be a minimal boundary effect on the hydraulic results (Fig. 12). The specimen had a constant water head flow through it so that the discharge velocity at the outlet could be measured. To evaluate the performance of fouled ballast, a novel void contamination index (VCI) was proposed, through which the volumetric ratio between the fouled material filling the ballast and the initial void of fresh ballast was estimated.

Large scale permeability test for mud pumping fouled ballast [30]
Figure 13 shows how ballast fouled by a clay subgrade will hinder its hydraulic conductivity k; apparently k decreases significantly when the VCI increases. For example, k dropped from about 0.1 m/s when the VCI was less than 10% to only 1 × 10⁻⁶ m/s at VCI = 75%, and k reduced to almost the same value as clay’s when the VCI was more than 95%. In fact when the hydraulic conductivity falls below 1 × 10⁻⁴ m/s (0.36 m/h at VCI = 50%), which is almost the same as that of the nominal silty subgrade soil, it can seriously affect the discharge capacity of the ballast and the track foundations. For example, if we consider a typical rainfall in Australia of 150 mm/h [31], this would result in a critical flow rate Qc of 2 × 10⁻⁴ m3/s for a unit length of the rail track, so if the actual drainage capacity of the track Qa is less than Qc, the track can be considered as having poor drainage. Where k = 1 × 10⁻⁴ m/s at VCI = 50% and the average ballast thickness is about 0.3 m, Qa is about 0.3 × 10⁻⁴ m/s which is much less than the estimated Qc, and this would lead to very poor drainage and track that requires constant maintenance. Obviously, this is a rough estimate that only considers vertical drainage, and actual field conditions can be far more complex and involve horizontal flows and non-uniform ballast fouling.

Reduced hydraulic conductivity of ballast with increasing void contamination index [30]
3.2 Reduced shear strength and friction angle of ballast
A series of large-scale triaxial tests using the unique in-house equipment at University of Wollongong [32] were carried out on fouled ballast (Fig. 14). In this investigation the VCI ranged from 10% to 80% and the confining pressures varied from 10 to 60 kPa. Kaolin was mixed with fresh ballast inside a concrete mixer and then placed into the chamber in layers. The specimens were then compacted with a vibrating plate until they attained a final height of 600 mm. The test took place under fully drained conditions as a strain rate of 5.5 mm/min was applied onto the specimens.

Large-scale triaxial test on fouled ballast [32]
Figure 15 shows that the shear strength of ballast decreases as the fouling level VCI increases. It is apparent that the deviator stress q has dropped significantly, for example, from 475 kPa at a confining pressure where pc = 60 kPa to about 350 kPa when the VCI increases to 50%. Note that a VCI of 50% is a critical fouling level, as indicated by the permeability testing shown in the previous section. However, increasing the VCI from 50% did not reduce q very much, so there is a critical threshold of clay fouling where any change within this range will have an adverse influence on the shear behaviour. This degradation was accompanied by a reduction in the friction angle of ballast such that the friction angle decreased to less than 40° when the VCI reached 80% at a confining pressure of 60 kPa. Interestingly, the larger the confining pressure, the lower the friction angle when the same level of ballast fouling is considered.

Adverse effects of clay mud pumping on the shear strength of ballast: a reduced deviator stress, and b reduced friction angle [33]
An empirical equation was proposed to estimate how the peak of q (i.e., qpeak) decreases with the VCI:
where \(q_{\text{peak,f}}\) and \(q_{\text{peak,b}}\) are the peak of q in fresh and fouled ballast, respectively; \(\beta\) is an empirical parameter which varies with different confining pressures pc. For example, \(\beta\) = 0.094, 0.047, and 0.05 when pc changes from 10 to 30 and 60 kPa, respectively. The prediction using the above equation is shown in Fig. 15a as a comparison with the experimental data. The results show a good agreement between the proposed model and the experimental data.
3.3 Degraded resilient modulus
To understand how mud pumping affects the resilient modulus (Mr) of ballast [10], a series of cyclic tests were carried out using the large-scale model, as shown in Fig. 14. A similar methodology was used in this investigation and a cyclic load that mimicked real time loading behaviour induced by train passage was applied. Specifically, a frequency f = 20 Hz and a confining pressure of 10 kPa were used. The change of the resilient modulus Mr over the number of loading cycles (N) was estimated at different levels of fouled ballast. Figure 16 shows that Mr increased linearly with VCI when N < 4000; for example, Mr decreased from about 120 MPa to almost 100 MPa at N = 1000. This reduction of Mr became more severe when N exceeded 10,000 cycles. Specifically, Mr decreased from 190 to 120 MPa at N = 100,000, and moreover, when N is greater than 10,000 cycles, the increment of Mr becomes less significant while N continues to increase; in fact Mr is almost unchanged when N increases from 10,000 to 100,000 cycles when the VCI = 80%.

Variation of resilient modulus with VCI over number of cycles N [10]
3.4 Substantial track deformation
It was apparent that increasing the amount of slurry (i.e., mud pumping) inside the ballast reduced its friction and bearing capacity, as shown in the previous sections, and this led to an increase in the deformation of ballast track. The experimental results based on the large-scale cyclic triaxial tests shown in Sect. 3.3 indicate that the axial strain increased significantly when the VCI rises (Fig. 17). For example, the axial strain increased from 9% to 17% when the VCI increased to 80%; therefore, the larger the number of cycles, the more the axial strain. Note also that the excess pore pressure increased rapidly when the VCI increased from 50% to 80%, especially when N > 100. This is because when the percentage of clay reached a certain high degree, the permeability of the clay-ballast mixture decreased dramatically, which caused a large build-up of excess pore pressure. This study clearly indicates that when mud pumping develops to a certain level, it can lead to severe deformation of rail tracks.

Effect of mud pumping on ballast deformation under cyclic load: a axial strain and b excess pore pressure
4 Role of vertical drains in alleviating cyclic excess pore pressure
4.1 Laboratory investigation
Prefabricated vertical drains (PVDs) are commonly used to stabilise deposits of soft soil by applying a surcharge with or without vacuum preloading. The ability of PVDs to dissipate cyclic excess pore pressure has already been discussed by Indraratna et al. [34]. A large-scale cyclic triaxial apparatus fabricated at the University of Wollongong, Australia was used to evaluate the efficacy of vertical drain inclusions on specimens 300 mm in diameter by 600 mm high. The installation of PVD for the large-scale triaxial testing was carried out by scaling down the size of the vertical drain to represent the unit cell. The ratio between the radius of the unit cell and the PVD was kept the same as in the field, thus eliminating any boundary effects. Further details of the scaling down of the vertical drain can be found elsewhere [34]. The cyclic excess pore pressure was measured through the bottom of the triaxial cell by miniature pore pressure transducers installed at prescribed locations in the subgrade sample. These tests took place at frequencies 5.0–10.0 Hz to simulate train speeds between 60 and 100 km/h and axle loads of 25–30 t. Figure 18 shows that the excess pore pressure ratio increased rapidly to 0.9 in about 100 cycles, which resulted in undrained shear failure. Without the inclusion of PVD, an anisotropically consolidated undrained testing (CK0U) caused large strains and excess pore pressure to develop after about 400 cycles, but with PVDs installed, the axial strain stabilised after 1000 cycles and the cyclic excess pore pressure within the sample was regulated. These results indicated that PVDs can reduce the magnitude of excess pore pressure induced by cyclic loading and it can better resist the cyclic stresses arising from railway loading.

Efficiency of PVDs in regulating excess pore pressure and axial strain development (redrawn after [34], with permission from ASCE)
4.2 Field investigation
PVDs approximately 8.0 m long were installed at Sandgate, Australia in that part of the track that passes over 30 m deep soft estuarine clays. This track stabilisation using relatively short vertical drains was carried out with no additional preloading, but by the passage of trains at low speeds (40 km/h). This site investigation included six boreholes, fourteen piezometric cone penetration tests (CPTU), two in situ vane shear tests, and two test pits. The soil profile is shown in Fig. 19 and its properties can be sought elsewhere [35]. The water content of these layers of soil was close to their liquid limits, and its unit weight varied between 14 and 16 kN/m3. Field monitoring included settlement plates, inclinometers, and vibrating wire piezometers to ensure that no adverse movements would hamper track stability.

Soil profile at the Sandgate Rail grade separation project [35] (with permission from ASCE)
4.3 Numerical predictions
Indraratna et al. [34] performed finite element (FE) simulations that incorporated the properties of soil taken from Sandgate and then made Class A predictions for the track stabilised with 8.0 m long vertical drains. Class A predictions enable all the design considerations to be identified and discussed prior to construction [36]. The FE analysis is based on the soft soil model and the Mohr–Coulomb model incorporated in the finite-element package PLAXIS, while the 2D plane strain FE analysis considered triangular elements with six displacement nodes and three pore pressure nodes. An equivalent plane strain converted from axisymmetric to 2D was adopted based on equivalent plane strain unit geometry [33]. As Fig. 20 shows, the inclusion of PVDs at 1.5 m spacing helped to dissipate excess pore-water pressure rapidly and stabilise the soft clay. In fact almost 90% of the excess pore pressure dissipated within 50 days when PVDs were installed, whereas without PVDs the excess pore pressure was still close to zero after more than 10 years (Fig. 20a). These PVDs also control lateral displacement at the toe of the embankment while the numerical predictions agree with the field data (Fig. 20b). This study indicates how efficiently the PVDs reduced the build-up of excess pore pressure in soft subgrade under cyclic loading, and therefore proves that installing vertical drains is a viable alternative for delaying the onset of subgrade fluidisation.

a Prediction of excess pore pressure 2.0 m below the subgrade and along the centre line of the track. b Profile of lateral displacement at the rail toe embankment at 180 days [35] (with permission from ASCE)
5 Conclusion
This paper discussed the results obtained from large-scale laboratory testing as well as investigations carried out on the subgrade fluidisation under undrained cyclic triaxial loading. The salient findings from this study are as follows:
The soil plasticity, fines content and the hydraulic gradient generated by the cyclic excess pore pressure plays a crucial role in the pumping of subgrade soil. In general, soils having low-to-medium plasticity are susceptible to mud pumping.
Track performance is affected severely when soft subgrade is pumped into the ballast layer. The large-scale permeability tests revealed that as the void contamination index (VCI) increases, there was a significant reduction in the hydraulic conductivity of ballast fouled with kaolin.
The peak strength of fouled ballast can be expressed as a function of the VCI by using one empirical parameter which depends on the effective confining pressure. Moreover, the resilient modulus Mr varied linearly with the VCI (when the number of cycles N < 4000).
The soil plasticity, fines content, and the hydraulic gradient play a crucial role in pumping subgrade fines, and soil with low-to-medium plasticity are generally more prone to mud pumping.
At a high cyclic stress ratio (≥ CSRc), the internal redistribution of water and the migration of fines under cyclic loading caused the laboratory specimens to become fluidised; this was accompanied with the softening of the soil and significant drop in the stiffness degradation index.
The inclusion of prefabricated vertical drains can help delay the onset of subgrade fluidisation by reducing the magnitude of cyclic excess pore pressure that will accumulate in the saturated subgrade.
References
Hussaini SKK, Indraratna B, Vinod JS (2012) Performance of geosynthetically-reinforced rail ballast in direct shear conditions. In: Paper presented at the 11th Australia-New Zealand conference on geomechanics: ground engineering in a changing world, Australia, pp 1268–1273
Aw ES (2007) Low cost monitoring system to diagnose problematic rail bed: case study at a mud pumping site. Massachusetts Institute of Technology, Cambridge
Indraratna B, Nimbalkar S, Rujikiatkamjorn C (2012) Future of Australian rail tracks capturing higher speeds with heavier freight. Int J Railw Technol 1(1):195–219
Trinh VN, Tang AM, Cui Y-J, Dupla J-C, Canou J, Calon N, Lambert L, Robinet A, Schoen O (2012) Mechanical characterisation of the fouled ballast in ancient railway track substructure by large-scale triaxial tests. Soil Found Jpn Geotech Soc 52(3):511–523
Nguyen TT, Indraratna B, Kelly R, Phan NM, Haryono F (2019) Mud pumping under railtracks: mechanisms, assessments and solutions. Aust Geomech J 54(4):59–80
Li D, Selig ET (1995) Evaluation of railway subgrade problems. Transportation Res Rec No 1489 Transportation Research Board, Washington, D.C., pp 17–25
Tennakoon N (2012) Geotechnical study of engineering behaviour of fouled ballast. Dissertation, University of Wollongong, Wollongong, NSW, Australia
Feldman F, Nissen D (2002) Alternative testing method for the measurement of ballast fouling: percentage void contamination. In; CORE: cost efficient railways through engineering, p 101
Huang H, Tutumluer E, Dombrow W (2009) Laboratory characterization of fouled railroad ballast behavior. Transp Res Rec 2117(1):93–101
Tennakoon N, Indraratna B (2014) Behaviour of clay-fouled ballast under cyclic loading. Géotechnique 64(6):502–506
Knappett J, Craig RF (2012) Craig’s soil mechanics. CRC Press LLC, London
Singh M, Indraratna B, Rujikiatkamjorn C (2019) Use of geosynthetics in mitigating the effects of mud pumping: a railway perspective. In: Sundaram R, Shahu J, Havanagi V (eds) Geotechnics for transportation infrastructure. Lecture Notes in Civil Engineering, vol 29. Springer, Singapore
Indraratna B, Singh M, Nguyen TT, Leroueil S, Abeywickrama A, Kelly R, Neville T (2020) A laboratory study on subgrade fluidisation under undrained cyclic triaxial loading. Can Geotech J. https://doi.org/10.1139/cgj-2019-0350
Skempton A, Brogan J (1994) Experiments on piping in sandy gravels. Géotechnique 44(3):449–460
Locke M, Indraratna B (2002) Filtration of broadly graded soils: the reduced PSD method. Géotechnique 52(4):285–287
Kézdi Á (2013) Soil physics: selected topics, vol 25. Elsevier, Amsterdam
Duong TV, Cui Y-J, Tang AM, Dupla J-C, Canou J, Calon N, Robinet A, Chabot B, De Laure E (2014) Physical model for studying the migration of fine particles in the railway substructure. Geotech Test J 37(5):1–12
Chawla S, Shahu JT (2016) Reinforcement and mud-pumping benefits of geosynthetics in railway tracks: model tests. Geotext Geomembr 44:366–380
Kuo C, Hsu C, Wu C, Liu P, Chen D (2017) Study on the Piping Path and Mechanism of Mud-pumping in Railway Subgrade. In: The 19th international conference on soil mechanics and geotechnical engineering, Seoul, South Korea
Alobaidi I, Hoare DJ (1996) The development of pore water pressure at the subgrade–subbase interface of a highway pavement and its effect on pumping of fines. Geotext Geomembr 14(2):111–135
Jiang MJ, Konrad JM, Leroueil S (2003) An efficient technique for generating homogeneous specimens for DEM studies. Comput Geotech 30:579–597
ASTM D2487–17 (2017) Standard practice for classification of soils for engineering purposes (unified soil classification system). ASTM International, West Conshohocken
Larew HG, Leonards GA (1962) A strength criterion for repeated loads. Highw Res Board Proc 41:529–556
Sangrey DA, Henkel DJ, Esrig MI (1969) The effective response of a saturated clay soil to repeated loading. Can Geotech J 6(3):241–252
Ansal AM, Erken A (1989) Undrained behaviour of clay under cyclic shear stresses. J Geotech Eng 115(7):968–983
Zhou J, Gong X (2001) Strain degradation of saturated clay under cyclic loading. Can Geotech J 38:208–212
Dash HK, Sitharam TG (2016) Effect of frequency of cyclic loading on liquefaction and dynamic properties of saturated sand. Int J Geotech Eng 10(5):487–492. https://doi.org/10.1080/19386362.2016.1171951
ASTM D698-12e2 (2012) Standard test methods for laboratory compaction characteristics of soil using standard effort (12 400 ft-lbf/ft3 (600 kN-m/m3)), ASTM International, West Conshohocken, PA. https://www.astm.org
Indraratna B, Korkitsuntornsan W, Nguyen TT (2020) Influence of kaolin content on the cyclic loading response of railway subgrade. Transp Geotech 22:100319. https://doi.org/10.1016/j.trgeo.2020.100319
Tennakoon N, Indraratna B, Rujikiatkamjorn C, Nimbalkar S, Neville T (2012) The role of ballast-fouling characteristics on the drainage capacity of rail substructure. Geotech Test J 35(4):629–640
Pilgrim DH (1997) Australian rainfall and runoff: a guide to flood estimation. Institution of Engineers, Australia
Indraratna B, Tennakoon N, Nimbalkar S, Rujikiatkamjorn C (2013) Behaviour of clay-fouled ballast under drained triaxial testing. Géotechnique 63(5):410–419. https://doi.org/10.1680/geot.11.P.086
Indraratna B, Rujikiatkamjorn C, Sathananthan I (2005) Analytical and numerical solutions for a single vertical drain including the effects of vacuum preloading. Can Geotech J 42(4):994–1014
Indraratna B, Attya A, Rujikiatkamjorn C (2009) Experimental investigation on effectiveness of a vertical drain under cyclic loads. J Geotech Geoenviron Eng 135(6):835–839
Indraratna B, Rujikiatkamjorn C, Ewers B, Adams M (2010) Class A prediction of the behaviour of soft estuarine soil foundation stabilized by short vertical drains beneath a rail track. J Geotech Geoenviron Eng 136(5):686–696
Lambe T (1973) Predictions in soil engineering. Géotechnique 23(2):151–202
Acknowledgements
This research was supported by the Australian Government through the Australian Research Council’s Linkage Projects funding scheme (Project LP160101254) and the Industrial Transformation Training Centre for Advanced Technologies in Rail Track Infrastructure (ITTC), University of Wollongong. The financial and technical support from SMEC-Australia and ARTC (Australian Rail Track Corporation) is acknowledged. The authors also acknowledge the assistance of Mr Bill Clayton (Clayton writing services) for the copy editing for English.
Author information
Authors and Affiliations
Corresponding author
Rights and permissions
Open Access This article is licensed under a Creative Commons Attribution 4.0 International License, which permits use, sharing, adaptation, distribution and reproduction in any medium or format, as long as you give appropriate credit to the original author(s) and the source, provide a link to the Creative Commons licence, and indicate if changes were made. The images or other third party material in this article are included in the article’s Creative Commons licence, unless indicated otherwise in a credit line to the material. If material is not included in the article’s Creative Commons licence and your intended use is not permitted by statutory regulation or exceeds the permitted use, you will need to obtain permission directly from the copyright holder. To view a copy of this licence, visit http://creativecommons.org/licenses/by/4.0/.
About this article

Cite this article
Indraratna, B., Singh, M. & Nguyen, T.T. The mechanism and effects of subgrade fluidisation under ballasted railway tracks. Rail. Eng. Science 28, 113–128 (2020). https://doi.org/10.1007/s40534-020-00210-1
Received:
Revised:
Accepted:
Published:
Issue Date:
DOI: https://doi.org/10.1007/s40534-020-00210-1