- Research article
- Open access
- Published:
Improving collapsibility robustness of an EPS-CD by means of simulation and six sigma
Advanced Modeling and Simulation in Engineering Sciences volume 7, Article number: 7 (2020)
Abstract
Steering columns for column assist Electric Steering are one of the main elements of the passive safety restraint system in a passenger vehicle. It is designed to collapse applying an optimized ride down force to reduce chest and head injuries of the driver during a frontal crash event, making this requirement one of the most important ones for its development. The system crash response is generated by several elements and interfaces due to the fact of many other different product requirements that a steering column must fulfill. This could lead into a complex validation process throughout the development, as it is needed to integrate the product into the vehicle in order to meet the passive safety requirements. As part of ZF lean Validation approach a new method has been developed to improve the system robustness in ZF Active safety division by means of virtual simulation and six sigma disciplines. This resultant method is also applicable for a model based development process and also contributes to improve frontloading development techniques. An analysis of variance has been done using a correlated virtual model for crash simulation, where the main parameters of the system are known (normally the case when same product generation is reused in a new vehicle). Obtaining as a result of the analysis the regression equation of the system response. This equation defines and quantifies the importance of each factor, and consequently is defining the component contribution and how to develop a column from bottom to top. Moreover, as a second step, a Monte Carlo analysis has been applied using the equation obtained generating statistical results for a number of cases (based in the design tolerances) not manageable from the hardware testing perspective neither from the finite elements methods. In that project Monte Carlo analysis has been applied for 100,000 cases generating response confident intervals instead of the classic FEM deterministic response where only the nominal case is considered.
Introduction
Electrically powered steering column drive (EPS-CD) is a technology used to provide assist torque, as well as new steering features, for A to D segment vehicles. The main advantages of that technology is to support CO2 reduction, fuel economy and automated driving (Fig. 1).

Example EPS-CD product
This product is divided mainly in two assemblies:
- 1.
Steering column assembly responsible for comfort adjustment features, static and dynamic loading requirements, as well as passive safety requirements.
- 2.
Power unit assembly consisting in an electrical motor, engine control unit, software and gearbox responsible to create the assist and new steering functions
The following paper is focused in the passive safety requirement for an EPS-CD product.
The steering column products is one of the main elements of the passive safety restraint system in a passenger vehicle. The columns are designed to collapse in a frontal crash event generating an optimized ride down force to reduce chest and head injuries of the driver. This is a driver requirement when developing a new steering column design.
The steering column crash response is normally generated by several elements and interfaces, where many of them have also requirements in other functionalities in addition to passive safety. That results in a complex validation scenario of fusible and deformable elements, friction force contributors, all of them made of different materials (plastics, greased steel, casted aluminium components).
That multiple sources of variability is reducing the confidence in classic finite elements approach where normally the nominal and few best–worst case conditions are considered for analysis, as well as from the real hardware testing side where that variability generates extra effort at the end of projects with a huge impact in the project costs and time (when few number of prototype parts are available). It is known that reality, especially when we are talking in the manufacturing field, there is a huge variability, and in that scenario the pass-fail criteria changes from a target value to a range of performance. This has been the main motivation when defining the scope of the project, “to bring manufacturing variability in the design process”.
As part of ZF lean validation strategy a new method has been developed to improve the system robustness in ZF Active safety division by means of virtual simulation and six sigma disciplines. The results obtained applying this new method are also applicable for a model based development process and democratization.
In a nutshell the method starts with an analysis of variance of crash system response using a correlated virtual model, where the main parameters affecting the crash response are known (normally applicable after any new core development process). As a result of the analysis, it is obtained the regression equations of the system response.
As a second step, a Monte Carlo simulation had been applied using the equation obtained generating statistical results for a number of cases (based in the design tolerances) not manageable from the hardware testing perspective, neither from the finite elements methods. In that project, the Monte Carlo simulation has been applied for 100,000 load cases generating probabilistic response instead of “deterministic response” (one geometry, one result).
With these two steps we have been able to create the manufacturing variability response for a destructive test in a highly cost and time effective approach.
In addition, these equations have three more benefits equally or even more beneficial:
- 1.
The equations define and quantify the importance of each factor, and consequently they can be used to generate a validation plan from component to system and enables to generate adequate component requirements as per a model based development procedure.
- 2.
Democratization, the regression equation can be forwarded to designing team (or PLM tool), giving them an analytical tool for quick verification of main crash contributors.
- 3.
Building customer confidence, as part of the democratization, the equation can be used during the requirement elicitation phase with customers generating confidence in the acceptance criteria.
Results and discussion
Problem definition: How to evaluate system response in the most efficient way. Crash collapse for an EPS-CD
Generally in the automotive field the manufacturing variability is not fully considered, or in some cases neglected, when going through a new product development phase (due to the tight project time constraints). The usual approach to validate a design is to have test rounds with a very limited number of prototypes (mainly due to cost and procurement time) than in best cases will reach over 100 units when the design is getting close to final production parts. Even in that case, that number might not be enough to cover the variability from a production of hundreds of thousand parts per year like in the case of an EPS-CD product. Another option used is to use simulation tools, but also in that case it will not be manageable to run test plans able to cover manufacturing variation due to the huge number of load cases to be analysed (running time, pre and post processing, data storage).
That limitation is even more evident when we are talking about a destructive test, where the numbers of parts to be tested is reduced significantly. For instance, the crash system robustness evaluation is also complicated during the development phase. Due to costs and lead times for prototype procurements, it is usual that in one validation cycle there is a number of prototypes below 20 parts, where in addition it is intended to test some slight design differences between them.
The main motivation in that project has been to develop a method to address system robustness, able to predict the product response considering the manufacturing variability, as well as, to be able to be used during the development phase to evaluate the robustness of a design. The solution that has been found has taken the benefits of finite elements methods and six sigma techniques.
EPS-CD collapse function description
The test case selected to develop the method has been a quasi-static collapse requirement for a manual EPS-CD system (these columns are characterized by a manually steering wheel adjustment by action of a lever). Steering column collapsibility is one of the main, and most used, features to reduce head and chest injuries for the driver in a frontal crash. In that case it is required that the column is not only requested not to go into the direction of the driver, is even needed that the column collapses (or reduces its axial length) to prevent the intrusion of the steering wheel in the cockpit. In addition, it is needed that the collapse must produce a defined collapse load. That collapse length and load are the key characteristics to integrate that element in the full vehicle restraint system (where airbags, seatbelt, steering wheel and steering column are tuned to minimize the injuries of the driver) (Fig. 2).

EPS-CD position in the vehicle
In a steering column development there are several crash load cases to develop the system, a quasi-static case to understand the way the system works (engagement, activation and deactivation time of each contributor), mass drop tests (to check the structural integrity of the system and impact speed and angle dependency) and finally body-block and sled tests (as initial steps for column integration in the full restraint system). In order to simplify the method development the quasi-static load case was selected. In the following picture it is represented an example of a result of a quasi-static EPS-CD test (Fig. 3).

Quasi-static simulation result with target response and corridor
Focusing on the product, in general, we can classify the main force contributors in two groups which build the final column collapsibility force: tuneable and friction driven elements.
The tuneable elements are the ones introduced in the column specifically designed for crash performance. Normally they can be also classified in regard of the moment of activation: we have the ones which help to create the breakaway force (the initial peak of force that it is needed to initiate the column collapsibility, examples of these elements can be plastic or steel pins that have to be shear at the beginning of the collapse): and energy absorption elements that are activated after the breakaway event and are applying force during the rest of the ride down (for example, different geometries of metallic straps which are plastically deformed, in some cases they also create force through friction).
The friction driven elements are the ones which are a consequence of other system requirements and to guide the moving part of the system during the collapse. The main example is the force generated by telescopic mechanisms implemented in the column to provide the reach and collapsibility features, in some cases some other friction elements are needed to guide the column during the ride down (depending in the column architecture). A special characteristic of these elements compared to the ones above (that also can create force through friction) is that these elements are angle dependent (if the driver sets a different rake adjust, the generated force varies).
In the picture below it is described the main force contributors of the selected product for the project (Fig. 4).

Main crash contributors in a EPS-CD
Problem approach
As described in the point one, the motivation of this method development was to overcome the difficulties of an extensive CAE analysis of variability or an extremely expensive hardware test approach. The idea was to combine the classic finite element calculation benefits:
understanding of main force contributors: specific part thicknesses, friction coefficients…
easiness how to generate a defined prototype: generate models with specific values for parameters like thicknesses, friction coefficients than in real life could be extremely expensive or even impossible.
with the benefits of six sigma analysis:
design of experiments
analysis of variance
model response generation.
Taking these factors into account the steps followed in the process were.
- 1.
Simulation model correlation
- 2.
Design of experiments to evaluate factors contribution
- 3.
Monte Carlo simulation.
Following the description of each step.
Method step 1: Simulation model correlation, parameters description
As part of the simulation work, correlation is the main task in order to have a predictable model able to generate valuable results for understanding and evaluating the influence of changes. In that case, and to reduce the project effort and cost, the steering column selected had been one system which is already in production, and that it has gone through a complete validation process. That had the benefit of a well-known finite element crash model with a proper understanding of the main contributors of the system, with the limitations already discussed in the point 1 (mainly nominal conditions, not being able to model all tests variance).
Based in the classification of the point 2 of this document, following it will be briefly described all contributors which are identified to generate the ride down force:
Tuneable elements:
Energy absorption strap: This element is creating force by means of plastic deformation and friction when unrolling against a fix angle.
Strap thickness
Mechanical properties variation inside the material norm
Friction coefficient between the strap and the anvil (Fig. 5).
Fig. 5 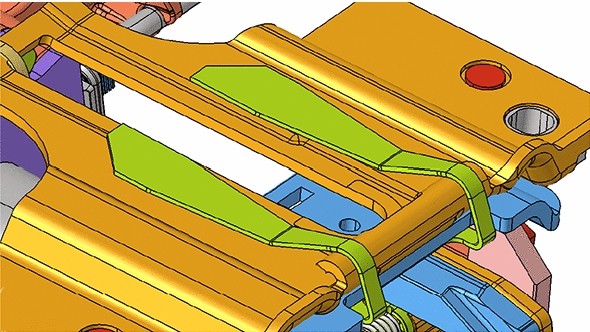
Energy absorption strap
Injected plastic shear pins: These are elements which has to be sheared in order to initiate the ride down movement of the column.
Shear force
Friction coefficient in the injected pins area at the beginning of the crash (Fig. 6).
Fig. 6 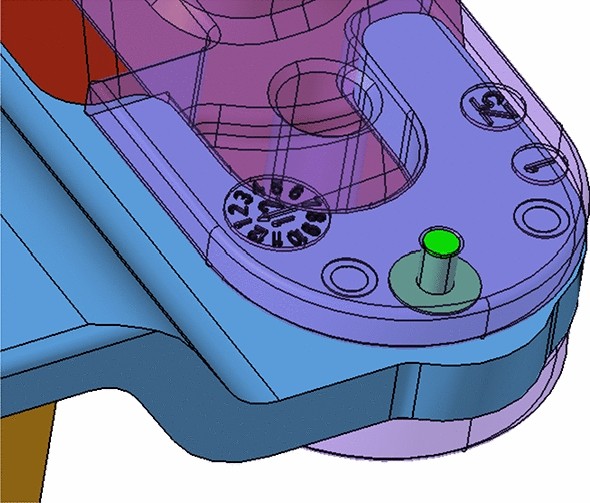
Injected plastic shear pins
Friction elements:
Main tubes friction: The collapsibility function of the column is provided by two main tubes which are also mainly responsible for the stiffness of the column under static and dynamic loads. This telescopic function is also responsible for the reach column adjustment.
Static tube in tube friction
Dynamic tube in tube friction
Clamp force to fix the column after comfort adjustment (Fig. 7).
Fig. 7 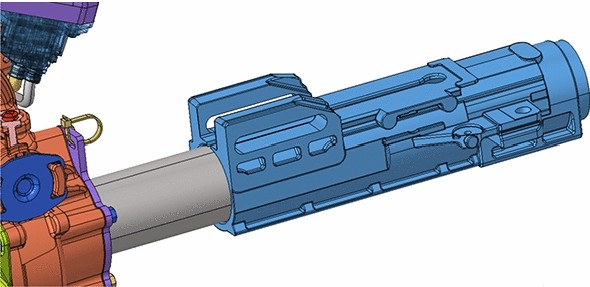
Main tube in tube friction
Torque transmission shafts friction: Inside the main tubes structure there is also a chain of shafts, also to allow the collapsibility of the column (as well as other functions like torque/angle measurements), so there is also friction created there. Nevertheless, the contribution from this element is lower than the previous one because the clamping force is not acting in that interface.
Dynamic friction (Fig. 8)
Fig. 8 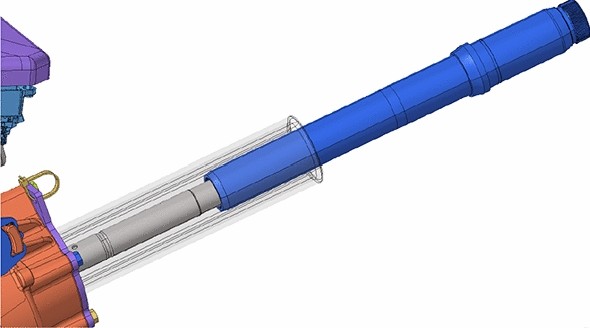
Torque transmission shafts
Top hat washer area: to guide the moving part during the collapse, as well as to bring some better dynamic response, there is a pretensioned bolt which press a washer improving the contact area and guiding the system.
Top hat washer pretension
Top hat washer friction
Mounting plate friction (Fig. 9).
Fig. 9 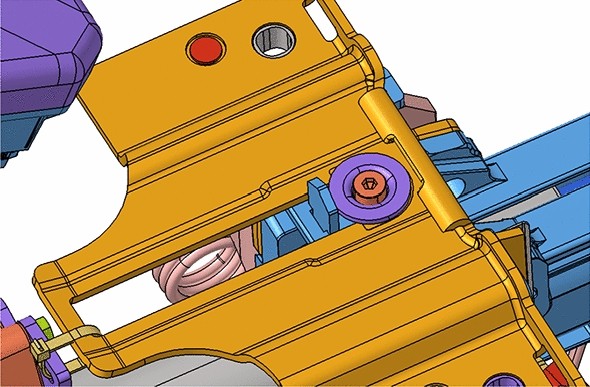
Top hat washer


These are the main contributors of the system, and below it is shown the model correlation with all the contributions discussed (Fig. 10).

FEM model correlation and resultant force contribution
Method step 2: Design of experiments to evaluate factors contribution
In the previous point it has been shown how the model is correlated and how the force is built up by the different contributors. In this step now we will focus in how the contribution of each of them has been quantified. For this, six sigma principles were applied with the use of the design of experiments and the finite element simulation model as the tool based on statistical methods and principles to describe a process.
The starting point was the definition of the response of the system in context of a design of experiment. The crash response is a transient function so the response can be defined in several ways:
How each element contributes in the maximum peak of force?
How each element contributes in the average force generated?
How each element contributes in the correlation of the energy absorbed (integration of the force generated versus displacement).
How each element contributes to the force generated at specific displacement.
Due to the fact that in crash response, max. peak of force, energy absorbed, force level during the collapse are equally relevant and important for the driver injuries, it was selected the last option as response of the system. But this approach was applied for several regions of the crash response curve: 1.95, 15, 19.5 and 25 mm of collapse.
In the Figure 11 it can be seen where the responses where measured, trying to capture the breakaway load, transition area as well as rest of the ride down. As explained in the point 4 some elements are just “working” in the breakaway event till the ones acting in the rest of the collapse are activated (energy absorption strap).

Graph with the difference responses, and points of response
Once the response was already defined, the second step in the design of experiments was to identify the main factors and their conditions (settings). This level of variation definition had been one of the main assumptions taken while doing the project. This assumption has been made out of the experience in the product and in agreement with all teams involved in the development. In order to help the understanding of the factors they have been grouped in super factors. For confidence reasons, values are not shown in the Table (Table 1).
The next step was to select the design. Here the aim was to select a design that allowed to examine the main effects and their interactions based on defined number of factors with the required resolution for the current state of knowledge at the point of time when the selection was done. Half-fractional factorial design was selected and applied for the study with six “super factors” at two factorial conditions.
Based on initial analysis four displacements where the response was going to be measured were divided into two models of response. This division was grounded in the fact mentioned above of the different times of contributors activation. These were the two models and hypothesis assumed.
In order to support the understanding of crash performance experiment was divided conceptually into 2 main phases:
For confidence reasons, values are not shown in the Table (Table 2).
Of course, before analysis technical restrictions for the project were identified and evaluated in terms of:
No repeatability error considered,
No failures events considered (model accuracy is not good enough to capture failures),
Accuracy of the parameters range (as mentioned above),
Complete column fixation (clamping),
Data processing (filtering).
Experiments designed for “super factors” produced results satisfactory for the project conceptual assumptions. The obtained models were highly precise and accurate. The explanatory power of regression models were at the level of 98% (for all R-square; R-square adjusted and R-square predicted) which means that the model accounts for almost all of the variation of crash performance.
DoE Super Factors—Outcome of half fractional factorial design analysis (Figs 12, 13, 14, 15).

Summary report for 1.95 mm collapse

Summary report for 15 mm collapse

Summary report for 19.5 mm collapse

Summary report for 25 mm collapse
Based on the results described above it was decided to dive deeper in the factors identified in phase 1. The analysis continued applying response surface method for further studies.
The assumptions and study pre-requisites from fractional factorial experiment were reviewed and revalidated.
As mentioned four displacements where the response was going to be measured were identified. This division was grounded in the fact mentioned above of the different times of contributors activation and therefore different factors were selected.
Groups 2; 3 and 4 consisted of the same five factors at the same factor conditions. Group 1 consisted of 6 factors.
The analysis operated using half fractional central composite design allowing for polynomial terms and curvature modelling. As the assumption on the factors operational range was one of fundaments of the study face centered design was selected.
After the preparation and execution of the runs with the required input definition, each force measurement at each specific displacement defined in the response was taken for analysis.
Central composite designs produced results satisfactory for the project conceptual assumptions. The obtained models were highly precise and accurate. The explanatory power of regression models were at the level of 98% (for all R-square; R-square adjusted and R-square predicted) which means that the model accounts for almost all of the variation of crash performance for Groups 2; 3 and 4.
Though, the most interesting piece of knowledge lies in the initial collapse distance where the model fit was 90%.
The outcome of this study brought new perspective and knowledge into experience on crash behaviour.
The summary of the results are presented below, as an example only the full set of statistical results is given for the response at 19.5 mm (Figs. 16, 17, 18, 19 and Tables 3, 4, 5).

Normal standardized effects

Main effects

Interaction

Contour plot interaction
Monte Carlo simulation
In that step we have already concluded the work on the field of finite elements methods, we have obtained from it a proper understanding of the system and a tool to evaluate the contribution of each factor in order to generate a polynomial equations in function of the main parameters.
These equations out of the analysis of variance are the ones used to run a Monte Carlo simulation where we can submit an experiment of 100,000 runs. Which as described at the beginning of the document will be extremely costly to obtain by means of real hardware and even still in the finite element side (100,000 analysis with an specific set of inputs)
But with the use of that equation any basic statistical software tool is able to execute and analyse the results obtained in an hour and with very low effort.
In that step a software statistical tool has been used to generate the 100,000 load case. And here is when the second main compromise has been taken, in that part of the method we can decide about the distribution of the factor: normal, logistic, Weibull or any that would be appropriate. Though, in this case normal distribution has been assumed to generate all load cases (Fig. 20).

Probabilistic response calculated for EPS-CD quasi-static load case
After the load case generation the same statistical tool has used the formulas to calculate the response. The results below show how with this method we can convert the usual nominal (or best and worst case) finite element response into a probabilistic response where we even have the chance to modify the distribution and values of the factors (Fig. 21).

Probabilistic response calculated for the EPS-CD quasi-static load case considering capability study
This is a very remarkable achievement as it can help the designers at very early stages of design concepts or future issues of manufacturing.
Applied case
As in the case of the finite element field, a good and needed practice is to validate the model. In that section we will go through the results of a validation exercise. Keeping in consideration for that exercise the limitations when it comes to perform a real hardware or finite element experiment with these population numbers.
For this correlation exercise we will use the results of a value capture idea of one of the force contributors factors. In the course of the project it was proposed to perform four quasi-static hardware tests where the coating of one of the tubes was removed, as well as the clamping force of the tubes was updated.
In that case, to validate the model, the same exercise as in “Monte Carlo simulation” section was done with the update of the two factors: clamping force set to an specific value, level ranges of the tube in tube friction coefficients were increased. The correlation shown in the picture below was created from the regression equations with no finite element method work done. Again the results were prepared in a very short time (Fig. 22).

Probabilistic response correlation
Correlation results are good for the intermediate responses, acceptable for the break-away area, and with a small deviation in the last displacement considered. Nevertheless, it should be stressed again that the model has been developed under the following assumptions:
Model generated from a virtual simulation model and compared to real hardware tests.
Factor levels, as well as, underlying distributions for the factors are coming out assumption.
Taking this into account and compared to the effort needed to generate the response, the correlation can be considered sufficient.
Conclusions
In this document it has been described a method which is meant to estimate production (and also design variability) in an efficient way in terms of overcome testing costs and time delays from other classical ways of testing (real hardware testing, finite element modelling), and that it is even more effective when the requirement of study is a destructive test.
Obtaining the regression equations to estimate the response of a system is giving one powerful tool to the engineering department, as mentioned through the use of them you can address the following targets:
- 1.
Model based development: The equations provide the response of which components are the biggest contributors, as well as, their interactions. With this information a validation plan can be prepared from bottom to top level in the design architecture, and in addition, for each component and interaction identified it is possible to set a pass/fail or acceptance criteria. In that specific case, defining the load to be generated by each factor in a quasi-static component testing or de-contained column testing for the estimation of a contributor interaction.
- 2.
Frontloading or democratization, once the equations are generated they can be uploaded in a PLM tool to be used by the design team. With a proper script and interface definition, a PLM tool can request the designer for the factor values and level ranges to get a first estimation of a modification or design change through a background analysis which provided the statistical results of the response. Always considering that the changes applied must be in line with respect the product architecture used to generate the equations. In that case, material, thickness, surface ending of the energy absorption strap will be acceptable, as well as clamping force, tubes and shafts surface endings….
- 3.
Build customer confidence. This is an specific application of the previous point, as this evaluation can be used in a requirement elicitation phase. Using that equations it can be proved to a customer that the offered product can fulfil their requirements in a reliable way, even capturing final production variability (running a Monte Carlo simulation). And in case the equations are dropping a non-conformity, out of the function it is already easy to identify which components or interactions may need to be modified.
- 4.
Robustness calculation for requirement analysis as described in the document. Again with the use of a Monte Carlo simulation with the obtained regression equations. It is especially useful in case of destructive requirements or when part procurement is complicated.
Availability of data and materials
The datasets generated and/or analysed during the current study are not publicly available due to company privacy policy but are available from the corresponding author on reasonable request.
Abbreviations
- EPS-CD:
-
Electrically powered steering column drive (EPS-CD
- PLM:
-
Product lifecycle management
- FEM:
-
Finite element method
- ANOVA:
-
Analysis of variance
- EAs:
-
Energy absorption strap
- THW:
-
Top hat washer
- TinT:
-
Tube in tube
- OVM:
-
Overmould
Acknowledgements
Not applicable.
Funding
This study has been carried out as part of the development activities in ZF group Division A Engineering.
Author information
Authors and Affiliations
Contributions
DCM set up the project scope as well as the project objectives. Simulation work and major contributor in writing the manuscript was performed by DCM, and MM focused in the statistical portion setting up the statistical studies, statistical data analysis and Monte-carlo simulation. Both authors read and approved the final manuscript.
Corresponding author
Ethics declarations
Competing interests
The authors declare that they have no competing interests.
Additional information
Publisher's Note
Springer Nature remains neutral with regard to jurisdictional claims in published maps and institutional affiliations.
Rights and permissions
Open Access This article is licensed under a Creative Commons Attribution 4.0 International License, which permits use, sharing, adaptation, distribution and reproduction in any medium or format, as long as you give appropriate credit to the original author(s) and the source, provide a link to the Creative Commons licence, and indicate if changes were made. The images or other third party material in this article are included in the article's Creative Commons licence, unless indicated otherwise in a credit line to the material. If material is not included in the article's Creative Commons licence and your intended use is not permitted by statutory regulation or exceeds the permitted use, you will need to obtain permission directly from the copyright holder. To view a copy of this licence, visit http://creativecommons.org/licenses/by/4.0/.
About this article

Cite this article
Costas Muñoz, D., Majzel, M. Improving collapsibility robustness of an EPS-CD by means of simulation and six sigma. Adv. Model. and Simul. in Eng. Sci. 7, 7 (2020). https://doi.org/10.1186/s40323-020-0144-9
Received:
Accepted:
Published:
DOI: https://doi.org/10.1186/s40323-020-0144-9