


INTRODUCTION
The geologic record shows that large, abrupt, and widespread climate changes occurred repeatedly and on various time scales throughout Earth's history (Gupta et al., Reference Gupta, Anderson and Overpeck2003). In particular, climate changes that occurred during the Holocene are considered of great importance, as they are crucial for predicting future climatic, natural, and environmental changes (An et al., Reference An, Porter, Kutzbach, Wu, Wang, Liu, Li and Zhou2000; Umbanhowar et al., Reference Umbanhowar, Camill, Geiss and Teed2006), particularly within the context of global warming. Many studies have suggested that the Holocene was characterized by an unstable climate with several significant centennial- and millennial-scale cooling events (Bond et al., Reference Bond, Showers, Cheseby, Lotti, Almasi, deMenocal, Priore, Cullen, Hajdas and Bonani1997; deMenocal et al., Reference deMenocal, Ortiz, Guilderson and Sarnthein2000; Gupta et al., Reference Gupta, Anderson and Overpeck2003).
The East Asian monsoon (EAM) is an integral part of the global climatic system that is formed as a result of thermal differences between the Asian landmass and the Pacific Ocean (Huang et al., Reference Huang, Wei, Li and Liu2018). Extreme events associated with the EAM cause floods and droughts that impact some of the most densely populated regions on Earth. In addition, the interactions of the EAM with El Niño−Southern Oscillation (ENSO) and the midlatitude circulation affect climate at the global scale (Wang et al., Reference Wang, Wu and Lau2001). Changes of the EAM throughout the Holocene were identified in the EAM region based on multiple proxies from various geological archives, including loess (Porter and An, Reference Porter and An2005), ice cores (Thompson et al., Reference Thompson, Thompson, Davis, Bolzan, Dai, Yao, Gundestrup, Wu, Klein and Xie1989), marine and lacustrine sediments (Nan et al., Reference Nan, Li, Chen, Rajiv, Yu, Xu and Yang2014; Huang et al., Reference Huang, Wei, Li and Liu2018), peat deposits (Zheng et al., Reference Zheng, Singarayer, Cheng, Yu, Liu, Valdes and Pancost2014), and stalagmites (Wang et al., Reference Wang, Cheng, Edwards, He, Kong, An, Wu, Kelly, Dykoski and Li2005; Hu et al., Reference Hu, Henderson, Huang, Xie, Sun and Johnson2008).
Subaqueous delta fronts on continental shelves provide ideal sites for studying climate records on decadal to millennial time scales due to their high sedimentation rates and preservation potential (Zhou et al., Reference Zhou, Yin, Harrison and Lee2012). The Yangtze River is one of the world's largest rivers in terms of water discharge (900 km3/yr) and sediment load (500 Mt/yr before decline) (Milliman and Farnsworth, Reference Milliman and Farnsworth2011). The system is strongly influenced by the East Asian summer monsoon (EASM), with approximately 70% of its annual water discharge and 87% of its sediment load occurring during the flood season from May to October (Hori et al., Reference Hori, Saito, Zhao and Wang2002). Over the last 7000 years, more than half of the Yangtze River–derived sediment has been stored in the deltaic area, whereas the remaining sediment has been transported southward to form a “mud belt” on the inner shelf along the coast of the Zhejiang and Fujian Provinces (Liu et al., Reference Liu, Xu, Li, Milliman, Velozzi, Xiao and Yang2007, Reference Liu, Saito, Kong, Wang, Xiang, Wen and Nakashima2010). The sediments deposited at the river mouth have formed a series of sandbars showing typical seaward migration associated with the deltaic progradation (Milliman et al., Reference Milliman, Shen, Yang and Mead1985).
Stratigraphic, morphologic, and sedimentological studies examining the evolution and modern processes of the Yangtze River delta have been carried out since the late 1970s (Delta Research Group, Department of Marine Geology, Tongji University, 1978; Li et al., Reference Li, Guo, Xu, Wang and Li1979). The resulting model, which was widely accepted in a number of studies (Chen et al., Reference Chen, Zhu, Dong and Sun1985; Chen and Stanley, Reference Chen and Stanley1993a, Reference Chen and Stanley1993b; Li et al., Reference Li, Chen, Zhang, Yang and Fan2000a, Reference Li, Wang, Fan, Dang and Li2000b, Reference Li, Wang, Sun, Zhang, Fan and Deng2002), highlights a step-like seaward migration of the river-mouth sandbars controlled primarily by tidal currents and the Coriolis force (Fig. 1b). According to these previous studies, the development of river-mouth sandbars from Zhenjiang to the present delta-front area is characterized by the following six stages: Hongqiao stage (7.5–6.0 14C ka BP), Huangqiao stage (6.5–4.0 14C ka BP), Jinsha stage (4.5–2.0 14C ka BP), Haimen stage (2.5–1.2 14C ka BP), Chongming stage (1.7–0.2 14C ka BP), and Changxing stage (0.7 14C ka BP to the present) (Fig. 1b). However, the time of formation of these sandbars is still debated and not entirely constrained. In addition, although some researchers consider the effect of the EASM on the evolution of the Yangtze River delta (Wang et al., Reference Wang, Saito, Zhan, Nian, Pan, Wang, Chen, Xie, Li and Jiang2018; Nian et al., Reference Nian, Zhang, Qiu, Qin, Wang, Sun, Chen, Chen and Liu2019), the role of the EASM in the formation of the sandbars has not been taken into account.
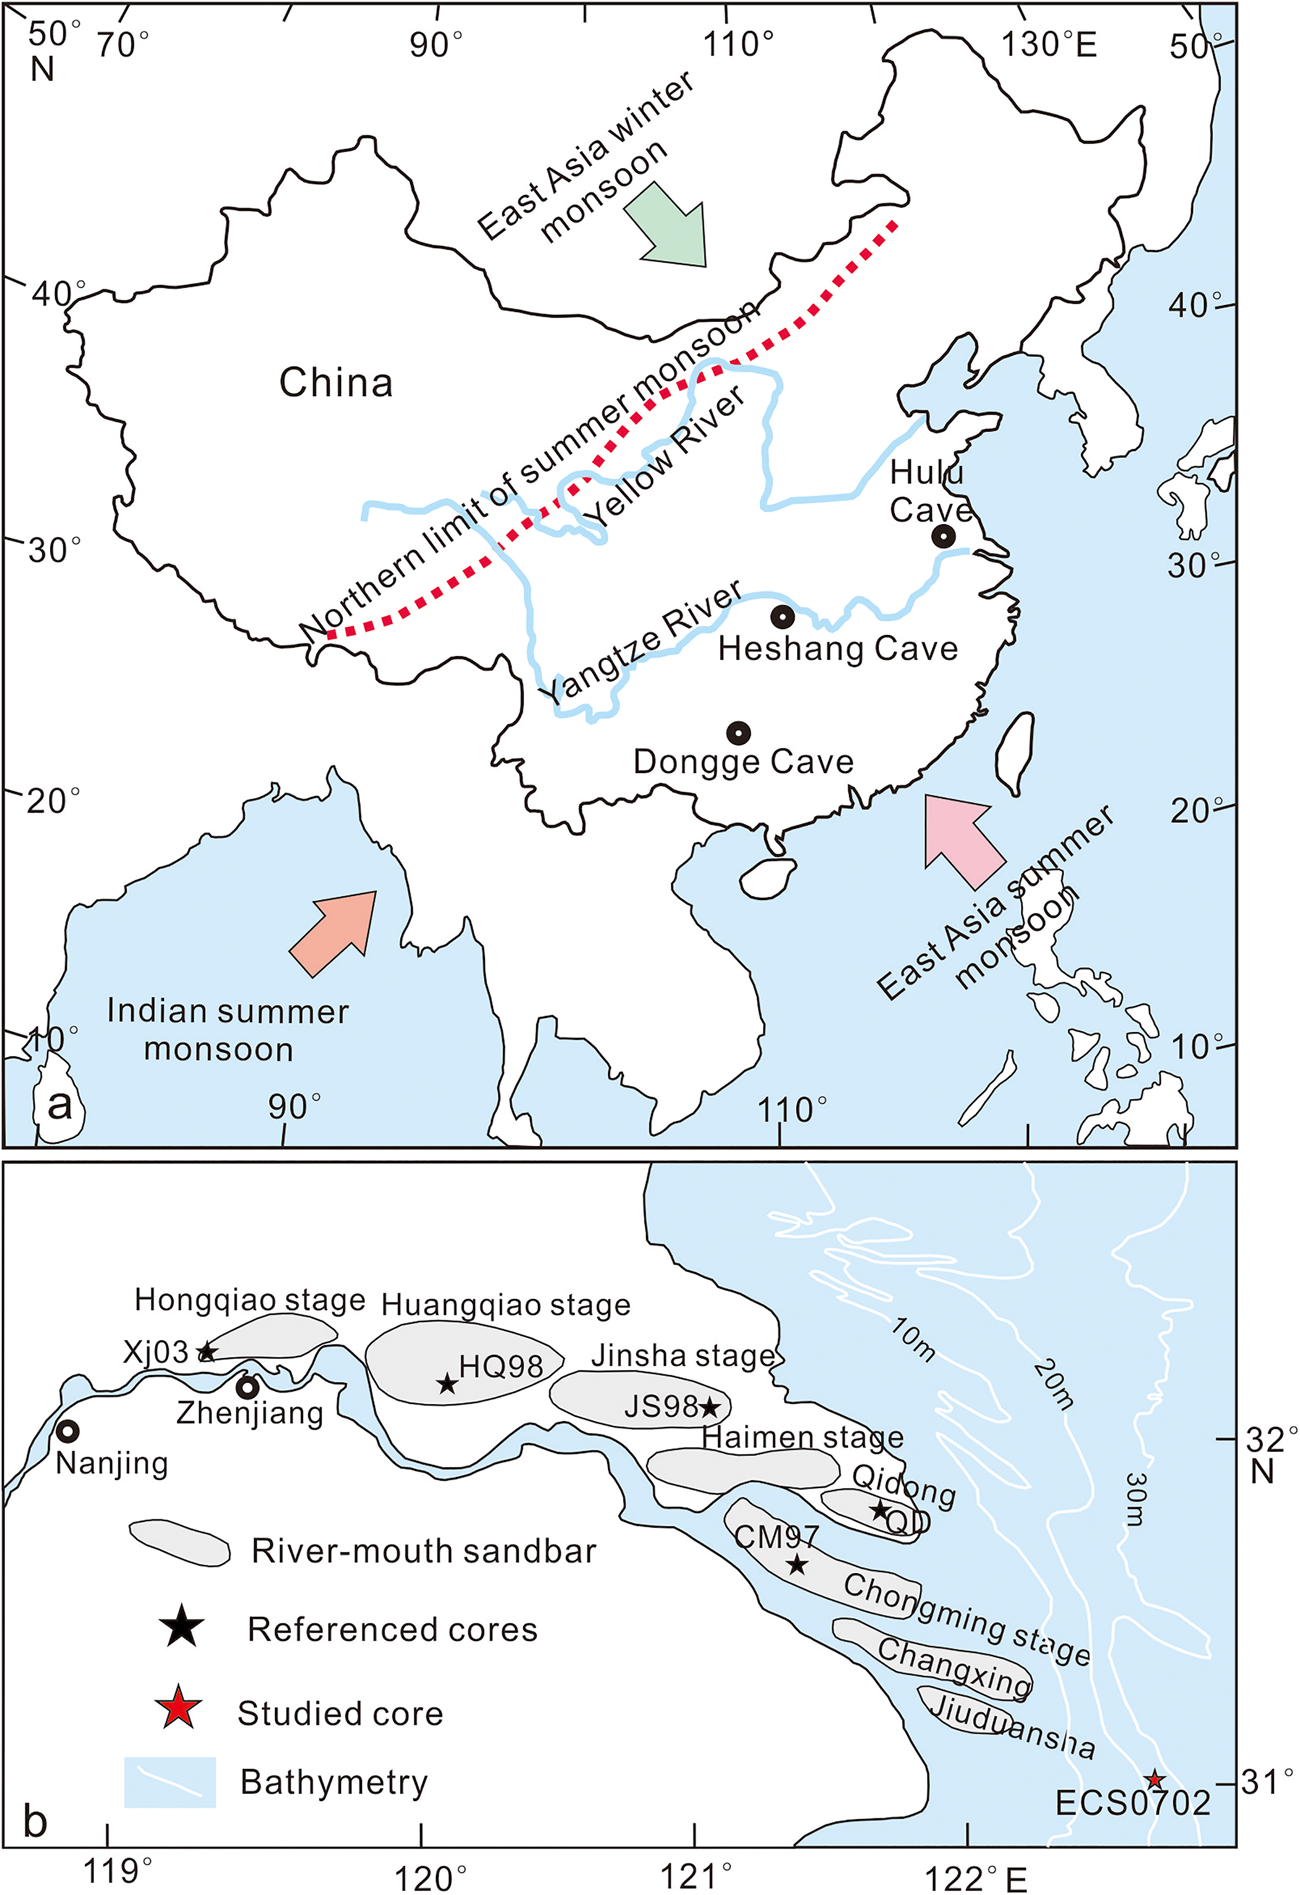
Figure 1. (color online) (a) Map of the current monsoonal climatic system in China with the river course of the Yangtze and Yellow Rivers and locations of the referenced caves Hulu, Heshang, and Dongge. (b) Evolution model for the Yangtze River delta (Delta Research Group, Department of Marine Geology, Tongji University, 1978; Hori et al., Reference Hori, Saito, Zhao, Cheng, Wang, Sato and Li2001) with locations of the studied core ECS0702 and referenced cores Xj03 (Song et al., Reference Song, Li, Saito, Okuno, Li, Lu, Hua, Li, Li and Nakashima2013), HQ98 (Hori et al., Reference Hori, Saito, Zhao, Cheng, Wang, Sato and Li2001; Yi et al., Reference Yi, Saito, Zhao and Wang2003), JS98 (Hori et al., Reference Hori, Saito, Zhao, Cheng, Wang, Sato and Li2001), QD (Liu et al., Reference Liu, Sun and Jiang1992), and CM97 (Hori et al., Reference Hori, Saito, Zhao, Cheng, Wang, Sato and Li2001; Yi et al., Reference Yi, Saito, Zhao and Wang2003).
This paper aims to fill that gap by examining core ECS0702 using high-resolution 14C dating of representative elements, grain size, and weathering indexes. These data, combined with previous work, constrain the main Holocene climate events and the formation time of Yangtze River-mouth sandbars. In addition, the evolution model of the Yangtze River delta since the early Holocene was also reviewed based on the relationships between the development of river-mouth sandbars and EASM fluctuation. Our results are of great significance for enriching both the record of Holocene climate change in the Yangtze River basin and knowledge about the formation and evolution progress of the deltas located in monsoon regions.
MATERIALS AND METHODS
This study is based on a new borehole core (ECS0702) located on the Yangtze River subaqueous delta front, about 90 km southeast of the present river mouth (latitude 31°0.004′N, longitude 122°40.011′E) and at 22 m water depth (Fig. 1b). The 35.6-m-long core was recovered by the rigging method with an average recovery of 90%. In the laboratory, the sediment core was split, described, and sampled. Sampling at 5 to 15 cm (253 samples) and 100- to 120-cm (24 samples) intervals were carried out for grain-size and geochemical analyses, respectively. Seventeen samples for 14C dating (plant fragments and molluscan shells) were picked out manually. The experimental process of grain-size analysis, geochemical analysis, and 14C dating were described in detail by Liu et al. (Reference Liu, Saito, Kong, Wang, Xiang, Wen and Nakashima2010). In addition, the sediment core description, vertical distribution characteristics of element/Al ratios, and the chronology frame were also reported by Liu et al. (Reference Liu, Saito, Kong, Wang, Xiang, Wen and Nakashima2010). However, the chemical weathering indexes and sensitive grain-size populations used in this paper were not reported.
The chemical weathering intensity of the sediments can be deduced by a quantitative estimation of the chemical weathering of silicates, such as the chemical index of alteration (CIA) (Nesbitt and Young, Reference Nesbitt and Young1982). The CIA is defined as Al2O3/(Al2O3+CaO*+Na2O+ K2O) × 100 (in molar concentrations, and CaO* is the CaO concentration in the silicate fraction of the sample). In this study, the method from McLennan (Reference McLennan1993) was adopted to correct the CaO* content with an assumed specific molar ratio of CaO/Na2O in the silicate mineral; when the molar ratio of CaO/Na2O was greater than 1, Na2O content was substituted for CaO content in the CIA calculation.
RESULTS
Element concentration and representative element ratios
The concentrations of major elements analyzed in sediment core ECS0702 are shown in Figure 2. The concentration range was 13.67% to 17.26% (with an average of 16.04 ± 1.03%) for Al2O3, 2.54% to 3.10% (with an average of 2.86 ± 0.17%) for MgO, 1.20% to 1.75% (with an average of 1.42 ± 0.13%) for Na2O, 2.53% to 3.32% (with an average of 3.05 ± 0.21%) for K2O, 0.760% to 0.863% (with an average of 0.822 ± 0.325%) for TiO2, and 2.34% to 4.75% (with an average of 3.28 ± 0.80%) for CaO, respectively. The values of representative element ratios in the studied sediment core ranged from 4.73 to 5.26 (average 4.95 ± 0.14) for Al/Mg, from 1.73 to 2.87 (average 2.43 ± 0.30) for K/Na, and from 0.37 to 0.56 (average 0.47 ± 0.05) for Ti/Na. The CIA value ranged from 61.02 to 72.56 (average 67.64 ± 3.28).

Figure 2. (color online) Vertical variations of major element concentrations in sediment core ECS0702.
Chronological framework
The chronology of core ECS0702 according to the accelerator mass spectrometry 14C data has been published by Liu et al. (Reference Liu, Saito, Kong, Wang, Xiang, Wen and Nakashima2010).The dating points are plotted against the original depths as shown in Figure 3a. The studied sediment core accumulated since ~9000 cal yr BP. The sedimentation rate ranged from 0.16 cm/yr to 4.98 cm/yr and showed a marked increase since ~2000 cal yr BP, especially since ~500 cal yr BP (Fig. 3b).

Figure 3. (color online) Chronological framework (a) and linear sedimentation rate (b) of sediment core ECS0702 and vertical distribution of calcite (c) and sediment type based on classification of Folk and Ward (Reference Folk and Ward1957) (d).
We divided the core into two depositional units (DU1 and DU2, in descending order) representing the postglacial sedimentary sequence during the last ~9000 yr based on the results of Liu et al. (Reference Liu, Saito, Kong, Wang, Xiang, Wen and Nakashima2010; Fig. 3c and d). DU2 is a nearshore, subtidal environment upward to the near-shore shelf, with tidal influence in response to the postglacial sea-level rise during ~9000–7900 cal yr BP; its main sediment type is coarse-grained sandy silt. DU1 is a tide-affected, nearshore, shallow-sea environment on the delta front of the Yangtze River, when the delta was actively prograding during the last ~7900 cal yr BP; its main sediment type is fine-grained silt. In this region, a high percentage of calcite in detrital mineral assemblages is diagnostic of sediments from the Yellow River (Liu et al., Reference Liu, Saito, Kong, Wang, Xiang, Wen and Nakashima2010). As shown in Figure 3c, the content of calcite notably increased at ~500 cal yr BP, indicating that a large amount of Yellow River detritus was introduced. Therefore, the DU1 is also divided into two depositional subunits (DU1-1 and DU1-2) based on the change in sediment sources. The source change at ~500 cal yr BP poses the question: What is the key factor controlling the deposition of DU1-1 with its much higher depositional rate?
Grain-size characteristics
In this study, the method of plotting grain size versus standard deviation to partition grain-size populations is used to infer the sensitive grain-size populations that are related to paleoclimate evolution. First, the sensitive grain-size populations were extracted based on all sediment samples (253 sediment samples) from core ECS0702. As shown in Figure 4, three sensitive grain-size populations were identified in the samples from the studied sediment core: fine sand population (2.5–2.75ϕ), medium silt population (5.25–5.5ϕ), and very fine silt population (7.25–7.5ϕ). As shown in Figure 3c, DU1-1 is notably influenced by detritus from the Yellow River. To eliminate the impact of the Yellow River, the sensitive grain-size populations were extracted based on sediment samples (184 sediment samples) from DU2 and DU1-2, and these results also showed three sensitive grain-size populations: fine sand population (2.5–2.75ϕ), medium silt population (5.2–5.25ϕ), and very fine silt population (7.2–7.5ϕ) (Fig. 4). From the results of these two extractions (Fig. 4), it can be seen that the sensitive grain-size populations of fine sand are identical, which suggests that the fine sand population is the most effective indicator of climatic environment and is less affected by provenance changes.

Figure 4. (color online) Grain size vs. standard deviation based all sediment samples (253 sediment samples) and sediment samples only affected by the Yangtze River (184 sediment samples), respectively.
Size–frequency curves (Fig. 5a–g) show that sediment samples generally have similar characteristics, with a sharp peak in the fine section and a less obviously secondary peak in coarse grains. The cumulative probability curves (Fig. 5a–g) for these samples also show similar characteristics, with higher suspension, secondary saltating components, and a small roll component. However, the sample collected at depth 24.35 m is obviously different from the overlying samples. It has a sharp peak in the coarse section and a distinct secondary peak in the fine section. Its grain size is mainly composed of saltating components (Fig. 5h). The sample collected at a depth 16.05 m only has a single sharp peak in the fine section, and its grain size is mainly composed of suspended components (Fig. 5i).

Figure 5. Grain-size distribution curves (red lines) and cumulative probability curves (blue lines) of representative samples in core ECS0702, sample at depth 7.43 m (a), sample at depth 11.13 m (b), sample at depth 12.85 m (c), sample at depth 13.80 m (d), sample at depth 14.56 m (e), sample at depth 15.36 m (f), sample at depth 19.26 m (g), sample at depth 24.35 m (h), and sample at depth 16.05 m (i). (For interpretation of the references to color in this figure legend, the reader is referred to the web version of this article.)
DISCUSSION
Sedimentary record of EASM fluctuation
Chemical weathering products are the main parts of fluvial sediment load. Therefore, selected special elemental ratios in river-derived sediments, which record information about the variations of elemental concentrations, can be used as chemical weathering indexes to capture climatic changes in a river's catchment (Nesbitt and Young, Reference Nesbitt and Young1982; Wei et al., Reference Wei, Li, Liu, Shao and Liang2006). Elemental behaviors are distinctly different during the chemical weathering process (Nath et al., Reference Nath, Kunzendorf and Plüger2000). In general, alkalis and alkaline earth elements are easily removed from primary minerals during chemical weathering. In contrast, some major elements, such as Al and Ti, tend to be combined in secondary minerals and thus are retained in the chemical weathering products (Nesbitt and Markovics, Reference Nesbitt and Markovics1997). In addition, it can be seen that the vertical variations of CIA and element ratios are not controlled by the mean grain size (Fig. 6a–e), sand-sized component, silt-sized component, and clay-sized component (Liu et al., Reference Liu, Saito, Kong, Wang, Xiang, Wen and Nakashima2010). Therefore, the CIA and Al/Mg, K/Na, and Ti/Na ratios can be used as effective chemical weathering substitution indexes in this study.

Figure 6. (color online) Climate conditions in Yangtze River basin since the early Holocene inferred from mean grain size (Mz) (a), chemical weathering index CIA (b), Al/Mg (c), K/Na (d), and Ti/Na (e) in core ECS0702; observed ENSO variability from foraminiferal δ18O (Koutavas and Joanides, Reference Koutavas and Joanides2012) (f); Picea and Pinus pollen record at Lake Zhuyeze in arid China (Chen et al., Reference Chen, Cheng, Zhao, Zhu and Madsen2006) (g); hopanoid accumulation rate in Dajiuhu peatland, for which high (low) accumulation rates correlate with dry (wet) intervals (Zhu et al., Reference Zhu, Feinberg, Xie, Bourne, Huang, Hu and Cheng2017) (h); and the summer monsoon proxy of stalagmite δ18O at Dongge Cave (Wang et al., Reference Wang, Cheng, Edwards, He, Kong, An, Wu, Kelly, Dykoski and Li2005) (i) and Heshang Cave (Hu et al., Reference Hu, Henderson, Huang, Xie, Sun and Johnson2008) (j).
The provenance analysis of core ECS0702 suggested that the Yangtze River-derived sediments were the main sources of sediment to the area off the Yangtze estuary until AD 1949, and the source was influenced by Yellow River material only since AD 1950 (Liu et al., Reference Liu, Saito, Kong, Wang, Xiang, Wen and Nakashima2010). Therefore, the general variation trends of chemical weathering indexes in DU2 and DU1-2 could reflect an overall change of weathering conditions during the Holocene in the Yangtze River basin. The sources of DU1-1 are controlled by both the Yangtze River and Yellow River; therefore, the chemical weathering intensity for DU1-1 is not discussed in this study.
The degree of chemical weathering is primarily controlled by climatic conditions. Warm and humid climatic conditions may favor intense chemical weathering, with humidity playing a particularly significant role (West et al., Reference West, Galy and Bickle2005; Gabet et al., Reference Gabet, Edelman and Langner2006). The Yangtze River basin is currently in a humid subtropical climate that is strongly influenced by the EASM (Zhao et al., Reference Zhao, Zou, Gao and Wang2016), hence proxies for chemical weathering intensity in core ECS0702 could indicate EASM variations. As shown in Figure 6b–e, a striking feature of our analysis is that all chemical weathering proxies, including CIA, Al/Mg, K/Na, and Ti/Na values generally display similar variations throughout the core, with higher values from 9630–9427 to 8504–8326 cal yr BP, 7743–7583 to 7108–6945 cal yr BP, 4427–4226 to 1392–1240 cal yr BP, and 815–662 to 648–503 cal yr BP. Except for these periods, the weathering indexes are relatively low. As mentioned earlier, the higher indexes showed that the EASM intensity gradually increased in the Holocene, reaching a maximum in the early Holocene (~7000 cal yr BP) and then becoming relatively weak in the middle Holocene. In the late Holocene (~4000 to ~500 cal yr BP), the EASM generally strengthened again, but it appears to have been weaker than during the early Holocene.
It is notable that a Holocene optimum in the early Holocene existed in the Yangtze River basin based on the change trend of the EASM proxy indexes in core ECS0702 (Fig. 6). A Holocene optimum in the early Holocene is also evidenced by a high-resolution record of pollen assemblages from Lake Zhuyeze in arid China (Chen et al., Reference Chen, Cheng, Zhao, Zhu and Madsen2006; Fig. 6g) and the peat organic carbon isotope record from northeast China (Hong et al., Reference Hong, Hong, Lin, Zhu, Shibata, Hirota, Uchida, Leng, Jiang, Xu, Wang and Yi2003) as well as pollen assemblages (Song et al., Reference Song, Li, Lu, Mao, Saito, Yi and Lim2017) and the oxygen isotope record from Heshang Cave (Hu et al., Reference Hu, Henderson, Huang, Xie, Sun and Johnson2008) in central China. In addition, many reports, including desert (Yang, Reference Yang2000), lake sediments (Chen et al., Reference Chen, Lan, Lou and Chen2003), and hopanoid accumulation rates in Dajiuhu peatland (Zhu et al., Reference Zhu, Feinberg, Xie, Bourne, Huang, Hu and Cheng2017; Fig. 6h) also indicate the EASM was relatively strong in the early Holocene before 7000 cal yr BP and that a dry climate existed during the middle Holocene in northwest China. Some research suggests that the EASM was much reduced during the middle Holocene in southern China (Zhou et al., Reference Zhou, Yu, Jull, Burr, Xiao, Lu and Xian2004). Atmospheric methane concentrations reached a maximum in the early Holocene and subsequently decreased to a minimum during the middle Holocene, also suggesting that the Holocene optimum occurred in the early Holocene (Zheng et al., Reference Zheng, Singarayer, Cheng, Yu, Liu, Valdes and Pancost2014). It has been proposed that evolution in the intensity of the EASM is closely linked to the strength of the ENSO (Li et al., Reference Li, Zhai and Cai2011), especially the El Niño events (Jiang et al., Reference Jiang, Zhang, Zhu and Wu2006). Our record of weathering indexes appears to be consistent with paleo-ENSO proxies available for the Holocene (Fig. 6b–f). These results, together with our data, support an early Holocene optimum in China.
After the middle Holocene until ~500 cal yr BP, our results show that the EASM intensity generally increased in the Yangtze River basin (Fig. 6b–e). This trend agrees well with the moisture changes indicated by the aerobic microbial biomarkers in the Dajiuhu peat and the environmental magnetism record from Heshang Cave during this interval (Xie et al., Reference Xie, Evershed, Huang, Zhu, Pancost, Meyers and Gong2013). The carbon isotope composition of the soil-derived acid-soluble organic matter in the HS4 stalagmite also detected a wet period during the late Holocene (Li et al., Reference Liu, Lu, Wen, Otto-Bliesner, Timmermann and Cobb2014). In the China, chemical weathering intensity from Poyang Lake also showed an overall enhanced trend during the last 4000 yr, suggesting an ongoing humid climatic condition. Additionally, the increasing storm frequency inferred from the magnetic records in Heshang Cave provided additional support for the humid climatic conditions over the late Holocene (Zhu et al., Reference Zhu, Feinberg, Xie, Bourne, Huang, Hu and Cheng2017).
The δ18O record of Dongge Cave (Fig. 1a) showed some similarity of structure with Heshang Cave (Dykoski et al., Reference Dykoski, Edwards, Cheng, Yuan, Cai, Zhang, Lin, Qing, An and Revenaugh2005; Hu et al., Reference Hu, Henderson, Huang, Xie, Sun and Johnson2008), indicating that it could also reflect the EASM variation in Yangtze River basin. High-resolution Dongge Cave δ18O data suggested that the EASM was punctuated by some weak EASM events during the Holocene, each lasting ~1 to 5 centuries. Among these cooling events, the ~8.2 cal ka BP (8.4 to 8.1 cal ka BP) and ~4.4 cal ka BP (4.5 to 4.0 ka BP) cooling events were longer in duration and larger in magnitude (Wang et al., Reference Wang, Cheng, Edwards, He, Kong, An, Wu, Kelly, Dykoski and Li2005).
These two noticeable cooling events were also documented by core ECS0702. Our study displays that the EASM intensity is weak during the period of 8504–8326 to 7743–7583 cal yr BP. The weathering indexes begin to decrease at 8504–8326 cal yr BP (Fig. 6b–e), coinciding with the beginning of the ~8.2 cal ka BP cooling event (Neff et al., Reference Neff, Burns, Mangini, Mudelsee, Fleitmann and Matter2001; Gupta et al., Reference Gupta, Anderson and Overpeck2003). However, the decreasing trend of weathering indexes did not stop until 7743–7583 cal yr BP (Fig. 6b–e). The end of this cold period was consistent with the ~7.7 cal ka BP cooling event (7780–7600 cal yr BP) recorded in a sediment core from the upper region of the Yangtze River delta plain (Song et al., Reference Song, Li, Lu, Mao, Saito, Yi and Lim2017). In other words, the weak EASM period (8504–8326 to 7743–7583 cal yr BP) in this study not only documents the ~8.2 cal ka BP cooling event but also the ~7.7 cal ka BP cooling event. The distinction between these two cooling events has not been recognized in ECS0702 due to low sample resolution. Another major ~4.4 cal ka BP cooling event ending at 4427–4226 cal yr BP in this study also coincides with previous reports (Wang et al., Reference Wang, Cheng, Edwards, He, Kong, An, Wu, Kelly, Dykoski and Li2005; Hong et al., Reference Hong, Hong, Lin, Zhu, Shibata, Hirota, Uchida, Leng, Jiang, Xu, Wang and Yi2003; Fig. 6b–e). In addition to the above two cooling events, other weak EASM events centered at ~5.5 and ~6.3 cal ka BP also showed sedimentary imprinting in our studied core ECS0702 (Fig. 6b–e). Core ECS0702 also records a ~0.7 yr BP cooling event (Fig. 6b–e), which was also found in the δ18O record of Dongge Cave (Wang et al., Reference Wang, Cheng, Edwards, He, Kong, An, Wu, Kelly, Dykoski and Li2005).
Sedimentary record of flood caused by EASM
Grain-size analysis is widely used to reconstruct depositional environments (Owen, 2005) and reveal ancient flood events (Brown et al., Reference Brown, Bierman and Andrea2000; Nan et al., Reference Nan, Li, Chen, Rajiv, Yu, Xu and Yang2014). In river-mouth deposits, an abrupt increase of coarser-grained sediment with little or no fine-grained sediment is usually associated with conditions of high river discharge associated with floods (Holz et al., Reference Holz, Stuut, Henrich and Meggers2007; Dinakaran and Krishnayya, Reference Dinakaran and Krishnayya2011). In general, high precipitation rates enhance soil erosion over the river basin (Zong et al., Reference Zong, Yu, Huang, Lloyd and Yim2010) and increase the transport capacity of rivers, leading to coarser-grained sediment being available for river transport (Nan et al., Reference Nan, Li, Chen, Rajiv, Yu, Xu and Yang2014). Several studies have showed that sediment grain size and sorting coefficient increase during strong monsoon rainfalls (Zhan et al., Reference Zhan, Yang, Liu, Li and Choi2010). Peak values of coarser sensitive grain-size populations and sorting coefficient were recorded at 543–413, 1567–1403, 2404–2217, 2552–2334, 3900–3694, 5354–5162, and 7622–7465 cal yr BP in core ECS0702 (Fig. 7). The size–frequency curves (Fig. 5a–g) and cumulative probability curves (Fig. 5a–g) of those samples mainly formed in nearshore shallow-sea environments (Liu et al., Reference Liu, Saito, Kong, Wang, Xiang, Wen and Nakashima2010) show similar characteristics to estuarine–inner shelf sediments produced by Yangtze River floods (Zhao et al., Reference Zhao, Zou, Gao and Wang2016). The sample collected at a depth of 16.05 m also mainly formed in a nearshore shallow-sea environment (Liu et al., Reference Liu, Saito, Kong, Wang, Xiang, Wen and Nakashima2010); however, its size–frequency and cumulative probability curves are different from the adjacent samples, as it was mainly deposited from suspension corresponding to the sedimentary characteristics of a low-energy subaqueous delta-front environment. The size–frequency and cumulative probability curves of the sample collected at a depth of 24.35 m show evidence of strong hydrodynamic conditions corresponding to the sample being deposited in a nearshore, subtidal environment (Liu et al., Reference Liu, Saito, Kong, Wang, Xiang, Wen and Nakashima2010). Therefore, the grain-size characteristics of sediments deposited at 543–413, 1567–1403, 2404–2217, 2552–2334, 3900–3694, 5354–5162, and 7622–7465 cal yr BP were mainly caused by Yangtze River floods.
The geophysical parameter IRMsoft-flux represents the flux of soil-derived magnetic minerals preserved in stalagmite Heshang4 from Zhu et al. (Reference Zhu, Feinberg, Xie, Bourne, Huang, Hu and Cheng2017), which correlates with rainfall amount and intensity (Fig. 7f). As shown in Figure 7, it is notable that the flooding events recorded in core ECS0702 correspond with the strong rainfall events. Previous studies have suggested that the EASM was strongly influenced by ENSO during the Holocene (Marchitto et al., Reference Marchitto, Muscheler, Ortiz, Carriquiry and van Geen2010; Zhu et al., Reference Zhu, Feinberg, Xie, Bourne, Huang, Hu and Cheng2017). The strong ENSO activity during the early and late Holocene is roughly consistent with the humid period indicated by the chemical weathering proxies from core ECS0702 (Fig. 6b–f). This suggests that a stronger ENSO can trigger plentiful precipitation in the Yangtze River basin. During the middle Holocene, the ENSO intensity was significantly reduced (Cobb et al., Reference Cobb, Westphal, Sayani, Watson, Di, Cheng, Edwards and Charles2013; Carré et al., Reference Carré, Sachs, Purca, Schauer, Braconnot, Falcón, Julien and Lavallée2014), resulting in fewer El Niño–related flood events in the Yangtze River basin (Fig. 7b–f). Increased frequency of ENSO-related storms during the late Holocene caused a corresponding increase of flooding events in the Yangtze River Basin (Fig. 7b–f). Based on our data and data from the literature, generally, it was found that seven flooding periods caused by strong EASM were documented in core ECS0702.

Figure 7. (color online) The Yangtze River mouth sandbar development time since the early Holocene (a), the vertical trends of sensitive grain size 2.5–2.75ϕ content (b), sorting coefficient (c), representative dominant grain size D84 (d), content of grain size 1–5ϕ (e), precipitation inferred from IRMsoft-flux since the early Holocene in central China (Zhu et al., Reference Zhu, Feinberg, Xie, Bourne, Huang, Hu and Cheng2017) (f), and the EASM intensity fluctuation inferred from the δ18O record of Dongge Cave (Wang et al., Reference Wang, Cheng, Edwards, He, Kong, An, Wu, Kelly, Dykoski and Li2005) (g).
Development of the river-mouth sandbar
River-mouth sandbars are fundamental morphological units of a delta, and their formation is typically controlled by the balance between upstream fluvial energy and downstream marine energy (Galloway, Reference Galloway1975). According to Edmonds and Slingerland (Reference Edmonds and Slingerland2007), river-mouth sandbar formation is due to the reduction of the sediment transport capacity and the decrease in the jet momentum flux when the flow expands into a standing body of water. More specifically, the decrease in the jet momentum flux is responsible for the formation of river-mouth sandbars (Edmonds and Slingerland, Reference Edmonds and Slingerland2007). Recent progress has been made through the use of physical (Hoyal and Sheets, Reference Hoyal and Sheets2009; Martin et al., Reference Martin, Sheets, Paola and Hoyal2009) and numerical (Edmonds and Slingerland, Reference Edmonds and Slingerland2010; Geleynse et al., Reference Geleynse, Storms, Walstra, Jagers, Wang and Stive2011) experiments of delta formation, suggesting that grain size exerts a significant control on deltaic processes (Orton and Reading, Reference Orton and Reading1993). A report from Caldwell and Edmonds (Reference Caldwell and Edmonds2014) showed that grain-size effect on deltaic processes is evident in the presence of both waves and tides, indicating that sediment properties may exert a stronger control than previously thought and the effect of sediment properties on deltaic processes may be a first-order control. A delta with a representative dominant grain size D84 = 0.04–0.4 mm is mainly dominated by the process of river-mouth sandbar construction (Caldwell and Edmonds, Reference Caldwell and Edmonds2014).
As discussed in the previous section, the floods were characterized by more coarse-grained sediments and a larger representative dominant grain size D84. During flood periods, the increased river discharge led to coarse-grained materials being available for river transport and subsequent deposition in the river mouth (Nan et al., Reference Nan, Li, Chen, Rajiv, Yu, Xu and Yang2014). The Yangtze River mouth is characterized by a trumpet shape, and this shape could decrease the river jet momentum flux. Therefore, at the Yangtze River estuary, the coarse-grained materials carried by the flood have a fast enough settling velocity to encourage sediment deposition near the channel mouth (Caldwell and Edmonds, Reference Caldwell and Edmonds2014). In addition, during flood periods, although the Yangtze River mouth is dominated by the fluvial condition, tides enhance jet spreading, which in turn promotes lateral residual currents that facilitate the formation of bifurcating channels (Leonardi et al., Reference Leonardi, Canestrelli, Sun and Fagherazzi2013). This factor finally caused river-mouth sandbars to occur at the Yangtze River mouth. Therefore, the floods that occurred at 543–413, 1567–1403, 2404–2217, 2552–2334, 3900–3694, 5354–5162, and 7622–7465 cal yr BP easily formed river-mouth sandbars corresponding to development of the Hongqiao, Huangqiao, Jinsha, Haimen, Qidong, Chongming, and Changxing sandbars, respectively, as shown in Figure 7.
It is interesting that the sensitive grain-size populations 2.5–2.75ϕ, as well as representative dominant D84 grain sizes, gradually increase from the Hongqiao to Chongming stages and then gradually decrease from the Chongming to Changxing stages. This phenomenon corresponds to the trend of the Yangtze River mouth gradually migrating from north to south since the early Holocene (Fig. 1b). Except during the Chongming stage, the location of core ECS0702 was far from the Yangtze River mouth, and the gravity differentiation sedimentation of sand carried by the floods caused few coarser grains to be transported to the location of core ECS0702. During the Chongming stage, the ECS0702 was located in the main channel of the Yangtze River to the sea, so each indicator presents its maximum value in the Chongming stage (Figs. 1b and 7b–e).
Our results show that the Haimen sandbar and Hongqiao sandbar initiated at 2552–2334 cal yr BP and 7622–7465 cal yr BP, respectively, which is comparable with previous results (Li et al., Reference Li, Guo, Xu, Wang and Li1979). Core Xj03, located on the Hongqiao sandbar, showed that there was an abrupt change in the clay-sized component at ~7500 cal yr BP (Song et al., Reference Song, Li, Saito, Okuno, Li, Lu, Hua, Li, Li and Nakashima2013; Fig. 8a), which confirms our hypothesis is reasonable. As discussed earlier, the EASM was much weaker due to reduction in ENSO intensity during the middle Holocene. In addition, the precipitation inferred from IRMsoft-flux during the middle Holocene in central China was also much lower (Zhu et al., Reference Zhu, Feinberg, Xie, Bourne, Huang, Hu and Cheng2017; Fig. 7h). Specially, the ~4.5 cal ka BP cooling recorded in ECS0702 is the start of the ~4.4 cal ka BP extreme cooling event (Wang et al., Reference Wang, Cheng, Edwards, He, Kong, An, Wu, Kelly, Dykoski and Li2005). There were no conditions for forming river-mouth sandbars in the middle Holocene, especially at ~4500 14C yr BP. It should be pointed out that at 5354–5162 cal yr BP, there was a flood period that could be verified by a strong rainfall inferred from IRMsoft-flux (Zhu et al., Reference Zhu, Feinberg, Xie, Bourne, Huang, Hu and Cheng2017; Fig. 7h). And this flood period caused the start of development of the Hungqiao sandbar, which could be also verified by the vertical variation of sediment grain size in core HQ98 (Hori et al., Reference Hori, Saito, Zhao, Cheng, Wang, Sato and Li2001; Yi et al., Reference Yi, Saito, Zhao and Wang2003; Fig. 8b).
The strong ENSO activity during the late Holocene could have triggered plentiful precipitation in the Yangtze River basin (Marchitto et al., Reference Marchitto, Muscheler, Ortiz, Carriquiry and van Geen2010; Zhu et al., Reference Zhu, Feinberg, Xie, Bourne, Huang, Hu and Cheng2017) and caused floods to frequently occur (Fig. 7f). Therefore, many river-mouth sandbars started to develop from the middle Holocene, such as the Jinsha sandbar (3900–3694 cal yr BP), the Haimen sandbar (2552–2334 cal yr BP), the Qidong sandbar (2404–2217 cal yr BP), the Chongming Sandbar (1567–1403 cal yr BP), and the Changxing sandbar (543–413 cal yr BP). The start of development of the Jinsha, Qidong, and Chongming sandbars can also be verified by cores JS98 (Hori et al., Reference Hori, Saito, Zhao, Cheng, Wang, Sato and Li2001; Yi et al., Reference Yi, Saito, Zhao and Wang2003; Fig. 8c), QD (Liu et al., Reference Liu, Sun and Jiang1992; Zhao et al., Reference Zhao, Yan, Wang, Shi, Chen, Xie, Chen, He, Zhan and Li2018; Fig. 8d) and CM97 (Hori et al., Reference Hori, Saito, Zhao, Cheng, Wang, Sato and Li2001; Yi et al., Reference Yi, Saito, Zhao and Wang2003; Zhao et al., Reference Zhao, Yan, Wang, Shi, Chen, Xie, Chen, He, Zhan and Li2018; Fig. 8e), respectively. In summary, our results suggest that the Yangtze River-mouth sandbars mainly started to develop during stronger EASM periods with warm and humid environments.

Figure 8. (color online) The vertical characteristics of lithology and mud content as well as the chronological framework of cores Xj03 (modified after Song et al., Reference Song, Li, Saito, Okuno, Li, Lu, Hua, Li, Li and Nakashima2013) (a), HQ98 (modified after Hori et al., Reference Hori, Saito, Zhao, Cheng, Wang, Sato and Li2001; Yi et al., Reference Yi, Saito, Zhao and Wang2003; Feng et al., Reference Feng, Liu, Zhao, Li, Jiang and Si2016) (b), JS98 (c) (modified after Hori et al., Reference Hori, Saito, Zhao, Cheng, Wang, Sato and Li2001; Yi et al., Reference Yi, Saito, Zhao and Wang2003; Feng et al., Reference Feng, Liu, Zhao, Li, Jiang and Si2016), QD (modified after Liu et al., Reference Liu, Sun and Jiang1992; Zhao et al., Reference Zhao, Yan, Wang, Shi, Chen, Xie, Chen, He, Zhan and Li2018) (d), and CM97 (modified after Hori et al., Reference Hori, Saito, Zhao, Cheng, Wang, Sato and Li2001; Yi et al., Reference Yi, Saito, Zhao and Wang2003; Zhao et al., Reference Zhao, Yan, Wang, Shi, Chen, Xie, Chen, He, Zhan and Li2018) (e).
It was previously suggested that the Yangtze River-mouth sandbar shifting from north to south during the Holocene was mainly caused by the action of tidal currents and the Coriolis force (Delta Research Group, Department of Marine Geology, Tongji University, 1978; Li et al., Reference Li, Guo, Xu, Wang and Li1979; Fig. 1b). However, we believe that this phenomenon, while being affected by tidal currents and the Coriolis force, is more importantly influenced by the EASM. The discussion presented here has made clear that the floods have caused the river-mouth sandbars to develop during the stronger EASM periods. After the flood periods, the river discharge decreased and its estuary was mainly dominated by tidal currents. At low tide, even an incipient river-mouth bar became an obstacle to the flow. As a result, more materials were deposited on the river-mouth sandbar, speeding up its initial development. Once the two bifurcating channels were emplaced, strong ebb flows became established at low tide. These fast, shallow flows transported large quantities of sediments around the sandbar (Leonardi et al., Reference Leonardi, Canestrelli, Sun and Fagherazzi2013). During the weaker EASM period, the water depth over the sandbar was shallow enough to create an upstream fluid pressure that was capable of forcing the water around the sandbar rather than over the sandbar (Edmonds and Slingerland, Reference Edmonds and Slingerland2007; Zhu et al., Reference Zhu, Feinberg, Xie, Bourne, Huang, Hu and Cheng2017). Therefore, the earlier-formed sandbar stopped aggradation and emerged from the water in this period. In addition, the Coriolis force caused the early-formation sandbar to mainly prograde southward, which, combined with the decreased water discharge, finally led to the southward migration of the main channel of the Yangtze River. In the following flood period, another river-mouth sandbar started to develop in the newly migrated southern river channel. Based on this evolution model, the Yangtze River-mouth sandbars shifted from north to south as they formed.
CONCLUSIONS
Based on multiproxy criteria, a relative high-resolution EASM record since the early Holocene was established for the Yangtze River basin: an early Holocene optimum EASM (~9.5 to ~7.0 cal ka BP), a weak EASM in the middle Holocene (~7.0 to ~ 4.0 cal ka BP), and a generally strong EASM in the late Holocene (since ~4.0 cal ka BP). Our borehole provides a good record of the ~8.2 and ~4.4 cal ka BP cold events with longer durations and larger magnitudes, as well as other cold events. The grain-size parameters suggest that flooding events in the Yangtze River basin were mainly caused by a stronger EASM. The representative dominant grain size D84, sensitive grain-size populations, and sorting coefficients, indicate that the development of Yangtze River-mouth sandbars since the early Holocene were mainly controlled by the floods. Floods that occurred at 543–413, 1567–1403, 2404–2217, 2552–2334, 3900–3694, 5354–5162, and 7622–7465 cal yr BP correspond to development of the Hongqiao, Huangqiao, Jinsha, Haimen, Qidong, Chongming, and Changxing sandbars, respectively. While the Yangtze River mouth sandbars since the early Holocene shifted from north to south, affected by tidal currents and the Coriolis force, they were more importantly controlled by the EASM.
ACKNOWLEDGMENTS
We sincerely appreciate the constructive comments from the editor Derek Booth, Aleeya Rahman, the reviewer Brian G. Jones, and one anonymous reviewer for improving the final article. Financial support for this study was primarily provided by the National Natural Science Foundation of China (grant nos. 41330964, 41406078, and 41676052) and the Marine Safeguard Project (grant no. GZH201200506). In addition, this study was also funded by the Taishan Scholars Program of Shandong Province, China (grant no. ts201511077).


