


1. Introduction
1.1 The language of wine experts
Everyone begins as a novice, but through training and practice, one can obtain comprehensive and authoritative knowledge (i.e., epistemic expertise), and become more skilled in performing certain acts (i.e., performative expertise), and as such, become an expert (Weinstein Reference Weinstein1993; Caley et al. Reference Caley, O’Leary, Fisher, Low-Choy, Johnson and Mengersen2014). Studies of expertise range from classic work on chess masters (de Groot Reference De Groot1946) and chicken sexers (Biederman and Shiffrar Reference Biederman and Shiffrar1987) to studies of professional musicians (Mitchell and MacDonald Reference Mitchell and MacDonald2011), sailors (Pluijms et al. Reference Pluijms, Cañal-Bruland, Bergman Tiest, Mulder and Savelsbergh2015), and Japanese incense masters (Fujii et al. Reference Fujii, Abla, Kudo, Hihara, Okanoya and Iriki2007).
Chess expertise, with its standardized levels of performance (i.e., the Elo rating system, named after its creator Arpad Elo), has been studied extensively and has informed models for how expertise is acquired more generally (de Groot Reference De Groot1946; De Groot Reference de Groot1978; De Groot et al. Reference De Groot, Gobet and Jongman1996; Ericsson et al. 2018). In domains other than chess, experts have also been found to perform better on various cognitive tasks. For example, expert radiologists are better at detecting low-contrast features in X-ray images (Sowden, Davies and Roling Reference Sowden, Davies and Roling2000; Ericsson et al. Reference Ericsson, Prietula and Cokely2007). Likewise, expert musicians are able to identify relationships between tones, that is, relative pitch (Levitin and Rogers Reference Levitin and Rogers2005), imagine musical pieces from musical notations (Brodsky et al. Reference Brodsky, Henik, Rubinstein and Zorman2003), and recall musical pieces more consistently than novices (Halpern and Bower Reference Halpern and Bower1982).
Similar effects have been shown with respect to linguistic skills too. When computer experts and novices are asked to describe pictures of complex visual scenes containing computer or other electronic equipment, experts’ descriptions contain more references to salient details about the computer equipment (Humphrey and Underwood Reference Humphrey and Underwood2011). In line with this, when bird and dog experts are asked to list features of birds and dogs, they list more specific features for stimuli in their domain of expertise (Tanaka and Taylor Reference Tanaka and Taylor1991), suggesting more detailed conceptual representations.
The few studies investigating expertise effects on language have primarily done so using stimuli from the auditory or visual domain, but rarely investigated smells. It has been claimed that smell might be “ineffable” (Levinson and Majid Reference Levinson and Majid2014), without dedicated vocabulary across the worlds languages (Sperber Reference Sperber1975), and experimental studies suggest odors are difficult to name (Cain Reference Cain1979; Engen Reference Engen1987; Cain et al. Reference Cain, de Wijk, Lulejian, Schiet and See1998); for reviews, see (Yeshurun and Sobel Reference Yeshurun and Sobel2010; Olofsson and Gottfried Reference Olofsson and Gottfried2015). The basis of this limitation is sought in our biological infrastructure: the words for smells may simply be inaccessible (Rivlin and Gravelle Reference Rivlin and Gravelle1984; Lorig Reference Lorig1999), or the odor percept information may arrive relatively unprocessed to cortical areas responsible for language (Olofsson and Gottfried Reference Olofsson and Gottfried2015). However, recent studies question whether poor odor naming is truly universal, showing that some populations are more eloquent when it comes to smells (Burenhult and Majid Reference Burenhult and Majid2011; Majid and Burenhult Reference Majid and Burenhult2014; Wnuk and Majid Reference Wnuk and Majid2014; Majid Reference Majid2015; Croijmans and Majid Reference Croijmans and Majid2016; O’Meara and Majid Reference O’Meara and Majid2016; San Roque et al. Reference San Roque, Kendrick, Norcliffe, Brown, Defina, Dingemanse, Dirksmeyer, Enfield, Floyd, Hammond, Rossi, Tufvesson, Van Putten and Majid2015; De Valk et al. Reference De Valk, Wnuk, Huisman and Majid2017; Majid et al. Reference Majid, Roberts, Cilissen, Emmorey, Nicodemus and Levinson2018). Instead of universality, cultural factors, for example, subsistence, can shape how eloquent one is when it comes to naming smells (Majid and Kruspe Reference Majid and Kruspe2018). Together, this research suggests that both across cultures and within sub-cultures, specific experience may be an important factor in how smells are talked about.
Wine experts—such as vinologists, sommeliers, and wine journalists—are an interesting group to study in this regard. Wine experts work with wines on a daily basis and communicate about the smell and flavor of wine in conversations among themselves and with consumers during wine tastings, as well as when writing tasting notes (Herdenstam et al. Reference Herdenstam, Hammarén, Ahlström and Wiktorsson2009). In these tasting notes and reviews, wines are often described following a set script: first the appearance of the wine is described, followed by smell (i.e., orthonasal olfaction), then flavor, and finally mouthfeel (Paradis and Eeg-Olofsson Reference Paradis and Eeg-Olofsson2013). Flavor is defined as the combination of taste, smell (i.e., retronasal olfaction), trigeminal activation, and tactile sensation in the mouth (Auvray and Spence Reference Auvray and Spence2008; Smith Reference Smith2012; Spence Reference Spence2015b; Boesveldt and de Graaf Reference Boesveldt and de Graaf2017), with olfaction playing the major role in the experience of flavor (Shepherd Reference Shepherd2006; Reference SpenceSpence 2015a). This underscores the importance of both olfaction and language in wine expertise (Royet et al. Reference Royet, Plailly, Saive, Veyrac and Delon-Martin2013).
1.2 Wine reviews: Intentional gibberish or consistent prose?
Even though language features heavily in their expertise, wine experts often complain of its lack. In the words of wine journalist Malcolm Gluck (Reference Gluck, Aitchison and Lewis2003):
We wine writers are the worst qualified of critical experts. This is largely, though not exclusively, because we are the most poorly equipped. The most important tool at our disposal is inadequate for the job. That tool is the English language. (Gluck Reference Gluck, Aitchison and Lewis2003, p. 107)
Scholars have suggested wine reviews are useless at informing readers about the flavor of wines. For example, Quandt (Reference Quandt2007) claims “the wine trade is intrinsically bullshit-prone and therefore attracts bullshit artists” (Quandt Reference Quandt2007, p. 135). Similarly, Shesgreen (Reference Shesgreen2003) states wine reviews are “mystifying babble used by writers whose prose is deeply disconnected from the beverage they pretend to describe” (Shesgreen Reference Shesgreen2003, p. 1). Finally, Silverstein (Reference Silverstein2006) has suggested that “wine-talk” says as much about the speaker, as it does about the wine. In line with this line of critique, an experimental study by Lawless (Reference Lawless1984) found that descriptions written by wine experts were highly idiosyncratic, with most terms only used once by one expert (Lawless Reference Lawless1984).
This raises the question of whether experts really can describe smells and flavors in a consistent way. The previous literature does not provide a satisfactory answer. Solomon (Reference Solomon1990) examined whether experts and novices could match wine reviews produced by other experts and novices to the original wines. Novices were no better than chance at matching descriptions from experts, suggesting reviews produced by those experts were not particularly informative. In contrast, Gawel (Reference Gawel1997), using a similar paradigm, found both experts and novices correctly matched descriptions to wines significantly above chance when the descriptions were produced by experts.
A previous computational linguistics study also suggests wine reviews can be considered consistent (Hendrickx et al. Reference Hendrickx, Lefever, Croijmans, Majid and van den Bosch2016). Hendrickx et al. (Reference Hendrickx, Lefever, Croijmans, Majid and van den Bosch2016) used the text of wine reviews written by experts to predict the color, grape variety, origin, and price of wines. They found that there was enough consistency in terminology used by wine experts that information in the review text could distinguish classes of wine. Although promising, this study had some drawbacks. For example, wine reviews differ by authors’ personal vocabulary preferences. Just like other writers (Zheng et al. Reference Zheng, Li, Chen and Huang2006; Juola Reference Juola2008); Kestemont et al. (Reference Kestemont, Luyckx, Daelemans and Crombez2012a,b), wine experts have been found to differ in their idiolectal use of lexical and syntactic features (Brochet and Dubourdieu Reference Brochet and Dubourdieu2001); Sauvageot, Urdapilleta and Peyron (Reference Sauvageot, Urdapilleta and Peyron2006); (Parr et al. Reference Parr, Mouret, Blackmore, Pelquest-Hunt and Urdapilleta2011). The corpus used by Hendrickx et al. (Reference Hendrickx, Lefever, Croijmans, Majid and van den Bosch2016) contained reviews from several authors but not an equal number of reviews per author. In fact, one author contributed almost 20 times as many reviews as the author who wrote the least. This skewing means that a single author consistent in their own description may have inflated the apparent consistency across writers. As such, a more rigorous test is required to establish whether wine reviews are consistent, in contrast to the view outlined above. We develop and evaluate this proposal here.
1.3 Domain-specific language in wine reviews
When wine experts talk about wines, they convey the smell and flavor of wine using various strategies. Wine experts famously employ metaphors in wine descriptions (Suárez Toste Reference Suárez Toste2007; Caballero and Suárez-Toste Reference Caballero and Suárez-Toste2010; Paradis and Eeg-Olofsson Reference Paradis and Eeg-Olofsson2013). In addition, they use a set of conventionalized descriptors. Croijmans and Majid (Reference Croijmans and Majid2016) found that wine experts use more source descriptions (e.g., red fruit, vanilla) for describing the smell and flavor of wine than novices, whereas novices used more evaluative terms (e.g., nice, lovely). Other studies suggest experts use more specific, concrete words; for example, they say blackberry instead of fruit (Lawless Reference Lawless1984; Solomon Reference Solomon1990; Gawel Reference Gawel1997). Experts are also said to use more words for grape type and terroir (i.e., the origin of a wine) than novices (Parr et al. Reference Parr, Mouret, Blackmore, Pelquest-Hunt and Urdapilleta2011).
To help budding wine enthusiasts to learn about wine, and enable description of wine flavors, expert tools have been developed that display lists of words deemed helpful. These words are often hierarchically ordered by their specificity and category—so-called “wine wheels” (Noble et al. Reference Noble, Arnold, Masuda, Pecore, Schmidt and Stern1984; Lehrer Reference Lehrer2009). Various wine vocabularies exist, ranging from the wheel first created by Noble and colleagues (Noble et al. Reference Noble, Arnold, Masuda, Pecore, Schmidt and Stern1984, Reference Noble, Arnold, Buechsenstein, Leach, Schmidt and Stern1987) to wheels specific for red, white, or fortified wine, or wine from specific countries (e.g., wines from Germany). Other lists zoom in on specific aspects of wine flavor, such as the mouthfeel wheel (Gawel, Oberholster and Francis Reference Gawel, Oberholster and Francis2000), or are composed by a specific author (Parker Reference Parker2017). The wide range of wine vocabulary lists again suggests wine vocabulary is diverse, which raises the question of whether these lists capture the terminology employed by a broad range of experts in actual language use. If this is not the case, learning to become an expert using these lists might not be as effective as it could be. Therefore, in this study, we examined the specific terminology employed in wine reviews, so that the outcome of our method could potentially enhance or lead to the adaptation of current expert tools.
1.4 The present study
To test whether reviews provide consistent information about wines (i.e., they are not bullshit; cf. Quandt Reference Quandt2007), an automatic classifier was trained with reviews from one set of authors and then used to predict properties of a new set of wine reviews written by a different author. By taking training data from one set of authors and testing on data from a different author, it was possible to establish description consistency between authors.
In a second set of analyses, we employed Termhood analysis to establish what words were used by each author to describe wine compared to a standard corpus of English. The words ranked high on Termhood were then analyzed using principal component analysis (PCA) to further establish whether there was consistency in language use across authors. Finally, the set of words ranked highest on Termhood was compared to previously established word lists of wine vocabulary (Noble et al. Reference Noble, Arnold, Masuda, Pecore, Schmidt and Stern1984; Lehrer Reference Lehrer2009; Lenoir Reference Lenoir2011; Parker Reference Parker2017), to explore what similarities and differences exist in wine language tools.
2. Predicting wine properties and author differences
2.1 Methods
2.1.1 Corpus description
A total of 76,410 wine reviews were collected from the internetFootnote a and assembled into a corpus. According to the source website:
All tastings reported in the Buying Guide are performed blind. Typically, products are tasted in peer-group flights of 5–8 samples. Reviewers may know general information about a flight to provide context—vintage, variety or appellation—but never the producer or retail price of any given selection.
The corpus contained structured information, that is, metadata about each wine, that is, price, designation, grape variety, appellation region, producer, alcohol content, production size, bottle size, category, importer, and when the wine was reviewed. In addition, each entry also contained a rating (range 80–100)Footnote b and a compact review describing the wine (on average approximately 40 words per review).
As prediction scores are affected by the amount of data used as input, only authors who had reviewed more than 1000 wines were considered, resulting in a selection of 13 authors. The contributions of these authors were not evenly distributed, with some authors producing around 1000–2000 reviews while the most prolific reviewer (later referred to as Author 1) contributed around 19,000 reviews, that is, 26% of all the reviews in the corpus. Altogether, a corpus of 73,329 reviews for these 13 authors was compiled. We did not further downsample or weigh the uneven contributions of the authors in order to stay as close as possible to the real distribution as found “in the wild.”
2.1.2 Data preprocessing
The review texts were first preprocessed by means of the Stanford CoreNLP toolkit (Manning et al. Reference Manning, Surdeanu, Bauer, Finkel, Bethard and McClosky2014) which added linguistic information to reviews. The following steps were taken:
(1) Tokenization: split review text into tokens (i.e., words, punctuation, numbers, etc.)
(2) Part-of-speech tagging: assign grammatical category to tokens (e.g., noun, verb, etc.)
(3) Lemmatization: provide lemma for tokens (nouns, adjectives: singular form; verbs: infinitive form)
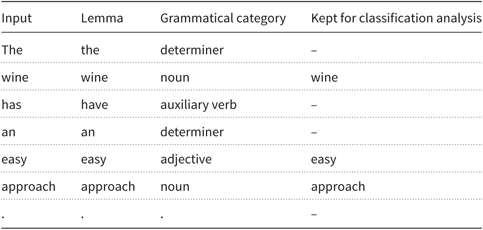
Table 1 shows an example for the review sentence: “The wine has an easy approach.” We used this linguistic information to reduce texts to a vector of content words. To this end, we selected all single words with the grammatical labels noun, verb, adjective, and adverb and used their lowercased lemma for the classification studies. For this example sentence, the terms “wine,” “easy,” and “approach” were included in the vector representation of this sentence. For the experiments, these vectors were transformed into a new vector containing binary features, indicating whether a content word is present (feature value: “1”) or absent (value: “0”) in the review text.
Table 1. Example output of preprocessing for the classification analysis
2.1.3 Classification tasks
Several different classification tasks were executed based on the metadata available: color, grape variety, and origins. For color, three class labels were distinguished: red, white, and rosé. Wine reviews with the metadata color “unknown” ( $n = 5105$
) were excluded. The words red, white, rose, and any variants thereof (i.e., red, reds, white, whites, rosè, rosé, rose) were removed from the wine reviews, so the classification could not be based on these terms.
$n = 5105$
) were excluded. The words red, white, rose, and any variants thereof (i.e., red, reds, white, whites, rosè, rosé, rose) were removed from the wine reviews, so the classification could not be based on these terms.
For grape variety, only wines produced from a single grape were considered; blends were excluded. Different names used for the same grape in the metadata were normalized to get a consistent label for grape varieties for the classifier (but not in reviews): for example, pinot gris and pinot grigio were normalized into pinot gris. Only those grape class labels for which there were at least 200 reviews were included, resulting in 30 class labels: aglianico, albarino, barbera, cabernet franc, cabernet sauvignon, carmenère, chardonnay, chenin blanc, gamay, glera, grenache, gruner veltliner, malbec, merlot, muscat, nebbiolo, nero d’avola, petite sirah, pinot blanc, pinot gris, pinot noir, riesling, sangiovese, sauvignon blanc, syrah, tempranillo, torrontes, traminer, viognier, and zinfandel.
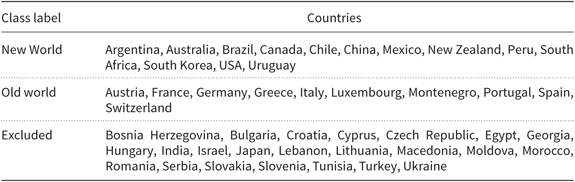
The wines had diverse origins: that is, 47 countries and over 1400 regions. We investigated the classification of origin using a coarse distinction, namely old versus new world (Remaud and Couderc Reference Remaud and Couderc2006; Banks and Overton Reference Banks and Overton2010). Broadly speaking, old world wines (e.g., France, Germany, Spain, and Italy) are “tradition-driven”: producers aim to make a high-quality product that can age well using traditional methods and terroir standards. In contrast, new world wines (e.g., USA, New Zealand, and Australia) are often produced with the latest production methods, and producers aim to make a good “consumer-driven” product in reasonable volumes that are valued by diverse consumer markets. Countries were categorized and labeled with the class labels “old” and “new” world based on country of origin. Reviews where the status was ambiguous (e.g., Eastern European countries) were excluded from consideration (see Table 2).
Table 2. List of countries considered new world, old world, or that were excluded from the origin task
The machine learning classifier used in this study was support vector machines (SVMs) which performs particularly well on text classification tasks (Joachims Reference Joachims2002). The implementation LIBSVM (Library for Support Vector Machines) of SVM was used with the linear kernel (Chang and Lin Reference Chang and Lin2011). The hyperparameter C, which controls the trade-off between setting a larger margin and lowering the misclassification rate, was optimized by means of a grid search on 10000 randomly selected instances of the training set. This optimization resulted in a cost value (C) of 0.125 for all three classification tasks.
The corpus contained reviews by 13 different wine experts. For all experiments per classification task (color, grape variety, and origin), we performed 13 leave-one-author-out iterations, such that a training sample contained reviews for 12 authors, after which the classifier was tested on the reviews of the remaining author. This setup was repeated 13 times. We calculated precision, recall, and F-score (Van Rijsbergen Reference Van Rijsbergen1979) to measure the performance on all class labels.
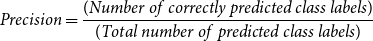
For each class label, precision was computed as:
 \begin{equation}
Precision=\frac{(Number\ of\ correctly\ predicted\ class\ labels)}{(Total\ number\ of\ predicted\ class\ labels)}
\label{eqn1}
\end{equation}
\begin{equation}
Precision=\frac{(Number\ of\ correctly\ predicted\ class\ labels)}{(Total\ number\ of\ predicted\ class\ labels)}
\label{eqn1}
\end{equation}
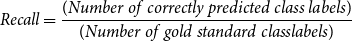
Recall was computed as:
 \begin{equation}
Recall=\frac{(Number\ of\ correctly\ predicted\ class\ labels)}{(Number\ of\ gold\ standard\
class labels)}
\label{eqn2}
\end{equation}
\begin{equation}
Recall=\frac{(Number\ of\ correctly\ predicted\ class\ labels)}{(Number\ of\ gold\ standard\
class labels)}
\label{eqn2}
\end{equation}
Finally, F-scores were calculated as follows:
 \begin{equation}
F=(2 \times \frac{(Precision*Recall)}{(Precision+Recall)}
\label{eqn3}
\end{equation}
\begin{equation}
F=(2 \times \frac{(Precision*Recall)}{(Precision+Recall)}
\label{eqn3}
\end{equation}
To arrive at an overall F-score per author, we aggregate the precision and recall scores per class label for all reviews for the held-out author, that is, computed at the level of individual classifications. In the same way, by aggregating all individual classification over all held-out authors, we compute the overall F-score for one experiment (color, grape variety, or origin).
To estimate the predictive value of a classifier, F-scores were compared to an F-score majority baseline resulting from guessing the most frequent class label in that task (i.e., color, grape variety, and origin). For example, in the color classification task (with a total of 68224 reviews), the class label red was most frequent, with 36,466 reviews describing a red wine. If the classifier categorized each review as “red,” it would achieve a baseline F-score of 65.8%. Achieving this or a lower F-score would indicate that reviews are not consistently written.
2.2 Results
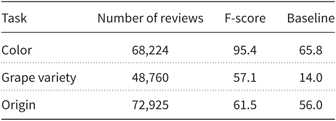
Table 3 lists the overall F-scores of the three classification tasks compared to their respective baselines. While the color task and grape variety task perform well above their respective majority baseline scores, the origin task appears to be the harder of the three. We discuss the performance on each task in more detail next and zoom in on the confusion matrices for each of the classification tasks.
Table 3. Overall F-scores on each of the three different classification tasks across the 13 authors
For the color task, the classifier was able to predict the color of red and white wines well, suggesting there was consistency in the reviews produced by different authors. Recall that all reviews in the training set were written by authors different from those in the test set, due to the leave-one-author-out setup. Table 4 lists the F-scores per author. F-scores for the red and white colors are high and close to the mean for all authors. For rosé, we observe markedly lower F-scores for all authors and a somewhat larger variation in scores. To provide further insight on the distribution of the classifications over class labels against the true labels, we present the confusion matrix for the color classification task in Figure 1. Note this confusion matrix counts labels aggregated over all authors.
Table 4. Number of reviews and F-scores per author, per class label and aggregated over the three class labels of the wine color task
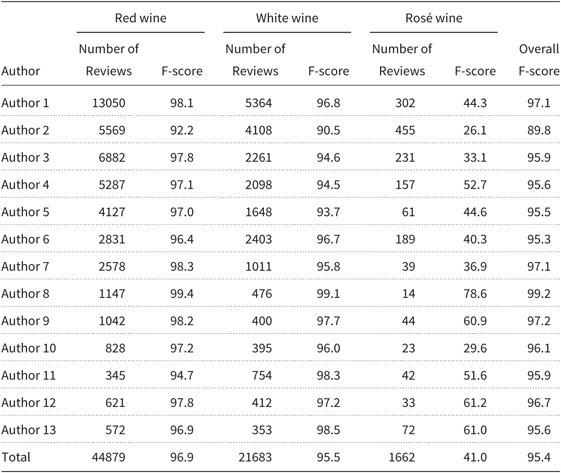
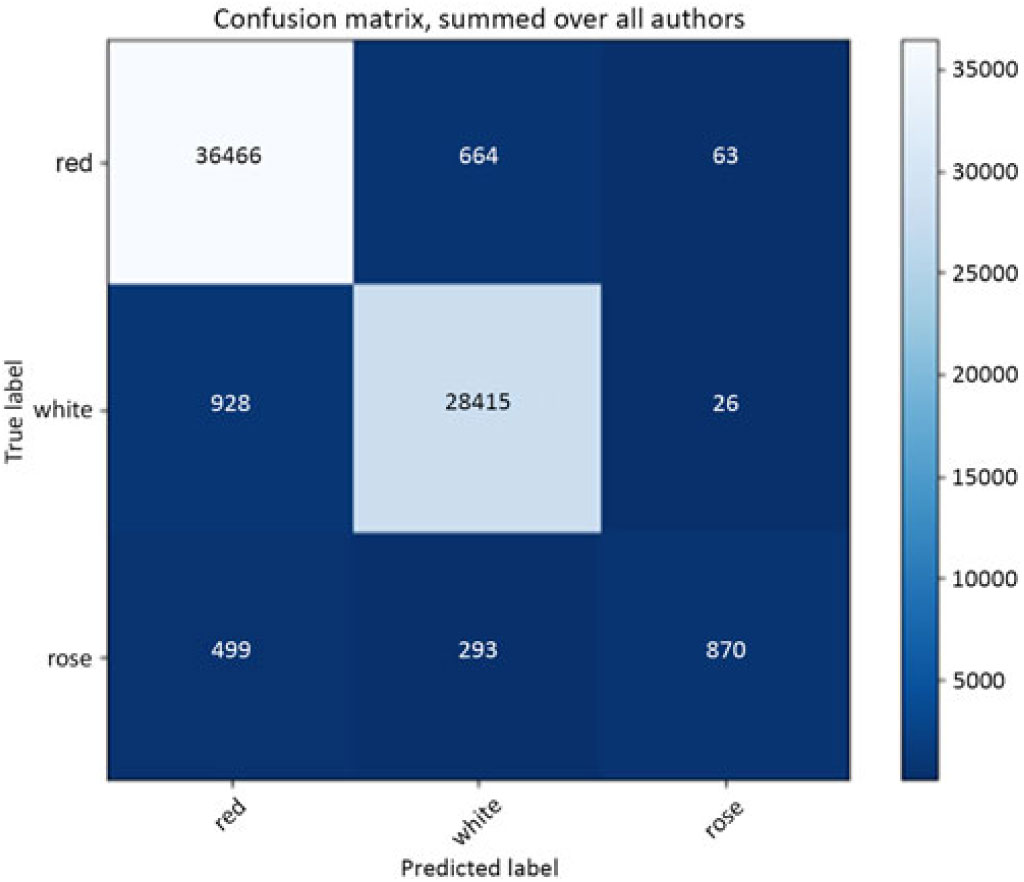
Figure 1. Confusion matrix for the wine color classification task. Color shading indicates the relative number of individual classifications per cell with more classifications indicated by lighter cells.
As Figure 1 shows, the two class labels red and white dominate both the true distribution and the predicted distribution. The relatively problematic third minority class label, rosé, is predicted correctly only 870 times. Rosé is most often misclassified as red wine (499 cases, that is, 63% of the misclassifications), and less often as white (293 cases, 37%). Therefore, the recall for the rosé class label is only 52. We compute the recall by dividing the number of correct predictions, 870 by the total number of times that it should have been predicted, that is, the sum of cell counts of the bottom row,  $499 + 93 + 870 = 1662$
. To calculate precision for rosé, 870 correct classifications were divided by the total of
$499 + 93 + 870 = 1662$
. To calculate precision for rosé, 870 correct classifications were divided by the total of  $ (63 + 26 + 870 = ) 959$
rosé class label predictions, which amounts to a precision of 91. The F-score for the rosé class label is 66. Precision and recall scores for the other two color class labels are markedly higher; for red, precision is 96 and recall is 98, and for white, both precision and recall are 96.
$ (63 + 26 + 870 = ) 959$
rosé class label predictions, which amounts to a precision of 91. The F-score for the rosé class label is 66. Precision and recall scores for the other two color class labels are markedly higher; for red, precision is 96 and recall is 98, and for white, both precision and recall are 96.
For grape variety, a random classifier would, on average, score no higher than 3% accuracy, and the majority baseline classifier (i.e., always predicts the most frequent class label; in this case chardonnay) would not achieve higher than 14% accuracy. The classifier, in fact, performed well above this baseline for all authors, as shown in Table 5.
Table 5. Number of reviews and F-score for each author for grape variety
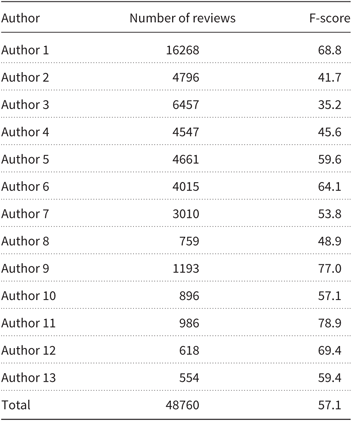
Figure 2 displays the confusion matrix for the grape variety experiment, summed over all authors. Correct classifications are again visible as lighter cells populating the diagonal. The figure shows that classification of the chardonnay and pinot noir varieties was particularly good. For example, pinot noir is correctly recognized 5171 times out of 6667 instances. If we look at grape types that are most often confused with pinot noir, we observe that these are all red grape types. The label pinot noir is confused with cabernet sauvignon (486 times), syrah (393 times), sangiovese (182 times), and chardonnay (only 99 times). Chardonnay is also the most frequent white grape type label in the whole set.
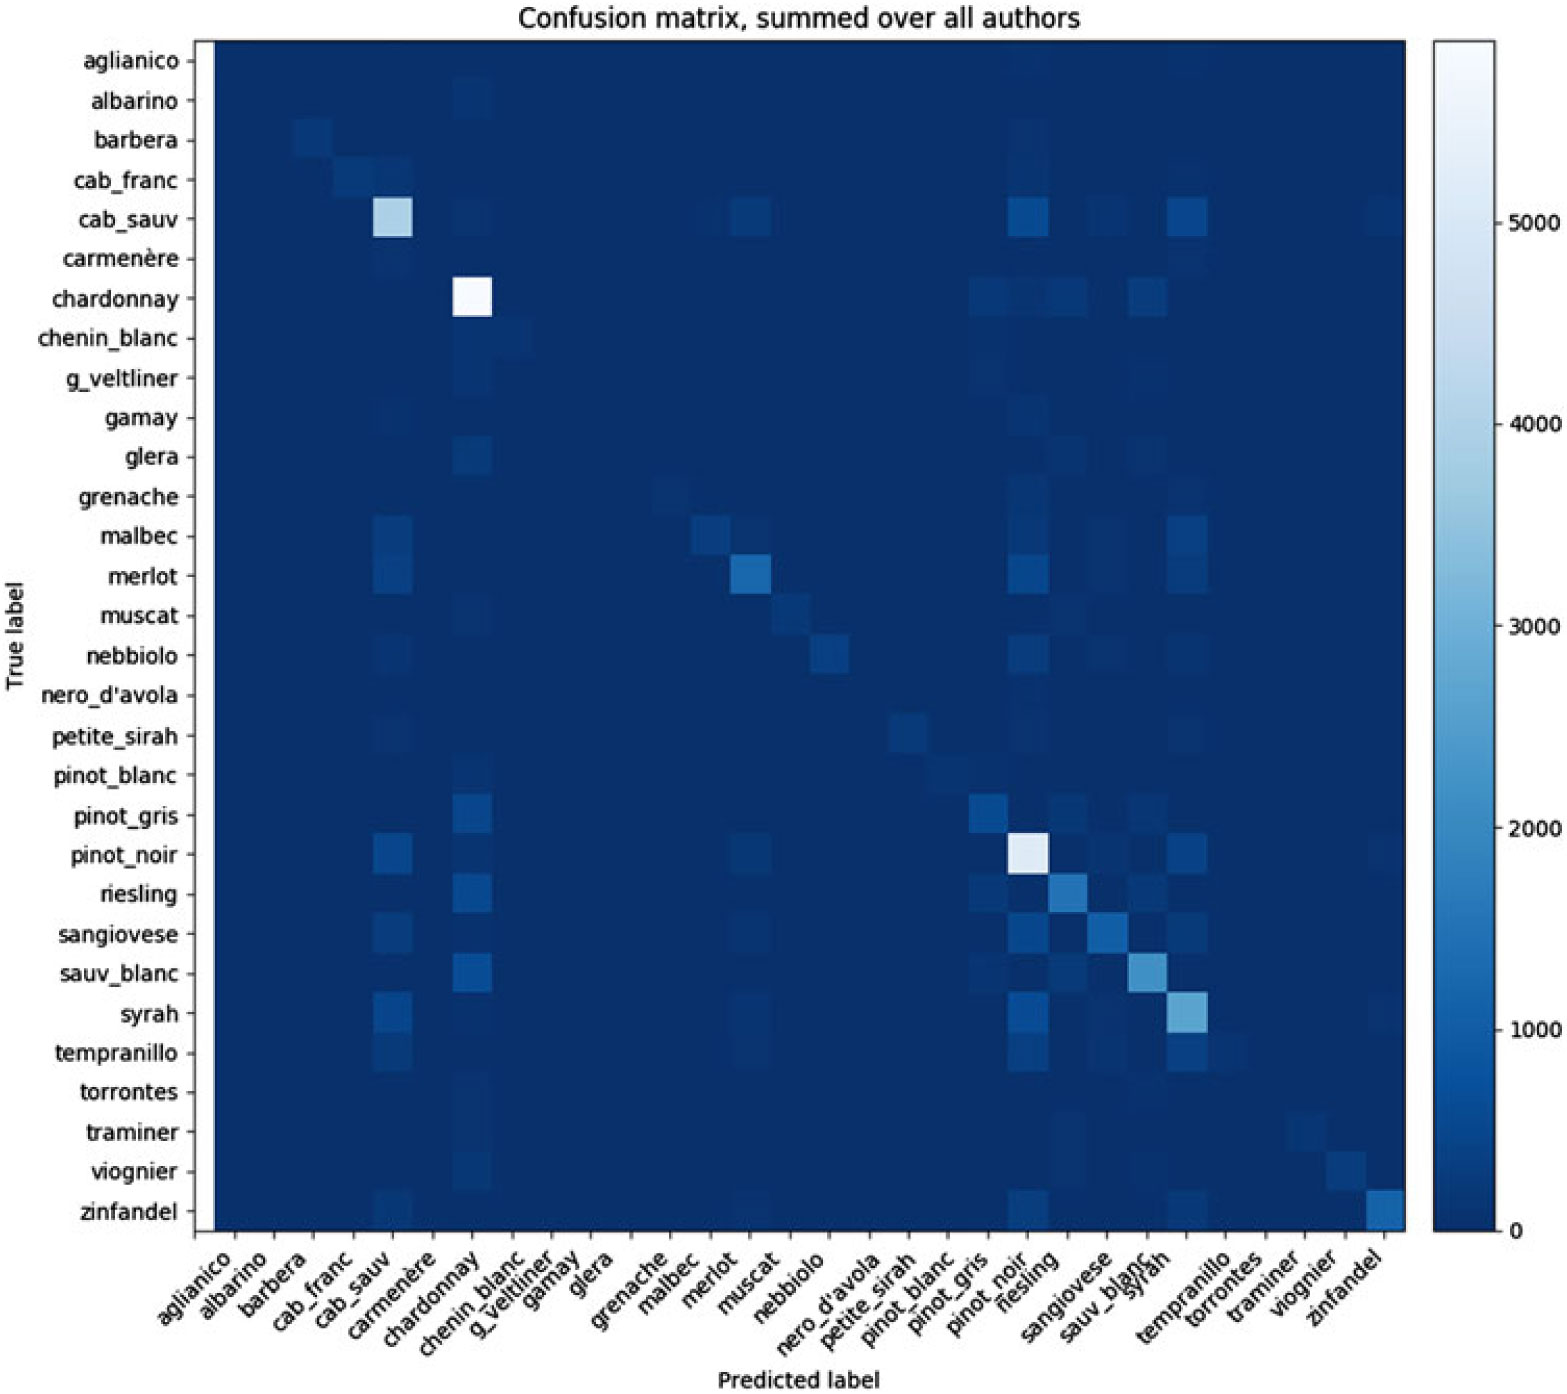
Figure 2. Confusion matrix for the grape variety classification task. Color shading indicates the relative number of individual classifications per cell with more classifications indicated by lighter cells.
As an example of a class label with an intermediate frequency, we examined the riesling label. Riesling is classified correctly in 1515 out of 2646 reviews with this label. It is most often confused with chardonnay (554 times), followed by sauvignon blanc (199), and pinot gris (186)—all white grape types—and only 44 times with pinot noir (a high frequent class, but red grape type).
For the origin classification, the majority baseline would predict the most frequent label to be new world (i.e., an F-score of 56.0 as shown in Table 3). The results showed an overall F-score of 61.5% which is a mere 5.5% above the majority baseline (Table 6). This could be because authors often show specialization for wines from a specific part of the world. For example, Authors 4 and 8 only reviewed wines from the old world, while Author 9 only reviewed wines from the new world. The classifier was able to predict origin above baseline for some authors (e.g., Authors 1, 9, and 10) but not for other authors (e.g., Author 2). The overall low score relative to baseline is unexpected and suggests authors do not describe new world wines distinctly from old world wines.
Table 6. Results per author for the new world versus old world wine classification task
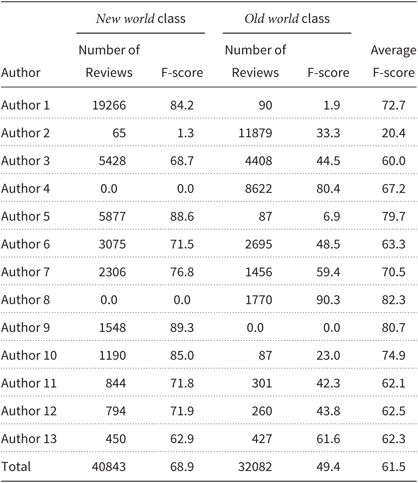
Figure 3 reflects the observations made on the basis of Table 5 regarding the performance of the classifier for distinguishing old world and new world wines. When summed over all authors, the classifier misclassifies more than half of the cases (18916) of old world wines (out of a total of 32082) as new world wines, yielding a recall of only 41 and a precision of 59.
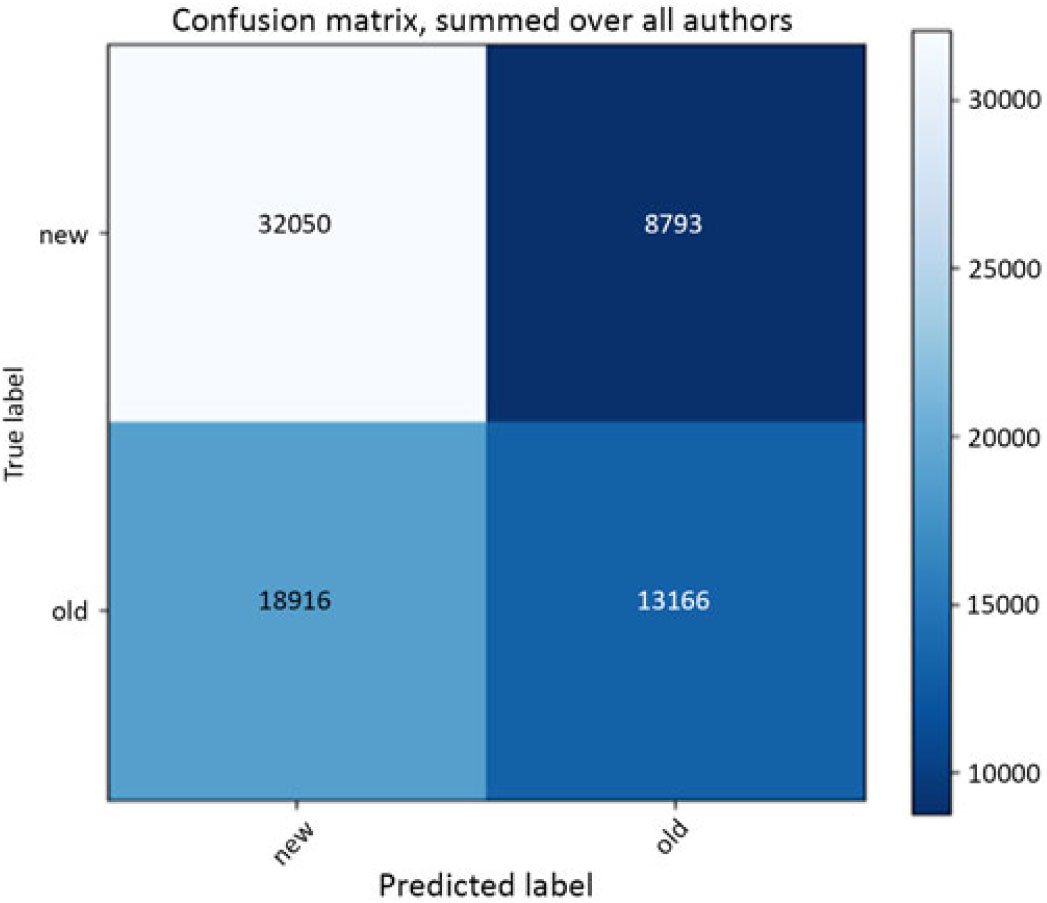
Figure 3. Confusion matrix for the old world—new world wine classification task. Color shading indicates the relative number of individual classifications per cell with more classifications indicated by lighter cells.
Overall, these results show it is possible to predict color and grape variety from wine reviews, even when the classifier is trained using data written by authors other than that used as test data. This suggests experts describe wines in a predictable manner, and are consistent with other experts. Personal vocabulary idiosyncrasies do not seem to adversely impact the ability to assign wines into clearly meaningful classes.
3. The use of domain-specific language in wine reviews
3.1 Methods
The earlier analysis shows that authors are using consistent terminology to distinguish classes of wine, but it does not reveal the terminology itself. We therefore sought to understand better what, if any, domain-specific vocabulary is used distinctively by wine experts, and if any such vocabulary was used consistently across authors. In order to do this, we examined Termhood, a key concept of terminology research, which refers to the degree that a linguistic unit is related to (or more straightforwardly represents) domain-specific concepts (Kageura and Umino Reference Kageura and Umino1996). The intuition is that Termhood expresses how much more frequent a word or word n-gram (i.e., a consecutive sequence of n words) is in the domain-specific wine corpus compared to a general corpus of English. The higher the Termhood value of a specific word, the more specialized that word is in comparison to its use in standard language use.
To extract terms belonging to domain-specific wine vocabulary, we used TExSIS, Terminology Extraction for Semantic Interoperability and Standardization (Macken, Lefever and Hoste Reference Macken, Lefever and Hoste2013), a hybrid terminology extraction pipeline that combines linguistic and statistical information to extract domain-specific terms, that is, word n-grams, from a text corpus.
In a first step, a list of candidate terms was generated from the corpus of wine reviews using part-of-speech pattern selection (i.e., nouns, adjectives, and verbs were included). Second, this list of terms was pruned by means of the Termhood weighting measure as implemented by Vintar (Reference Vintar2010), such that the frequency of the candidate term was aligned with the frequency of that term in a background corpus: the Web 1T 5-gram v1 corpus. This corpus, made available by Google Inc., contains approximately one trillion word tokens from publicly accessible web pages (Brants and Franz Reference Brants and Franz2006). The Termhood (T) term weighting measure of Vintar is computed as follows:
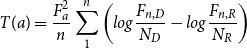 \begin{equation}
T(a) = \frac{F^2_a}{n} \sum_1^n \left( log \frac{F_{n,D}}{N_D} - log \frac{F_{n,R}}{N_R} \right)
\label{eqn4}
\end{equation}
\begin{equation}
T(a) = \frac{F^2_a}{n} \sum_1^n \left( log \frac{F_{n,D}}{N_D} - log \frac{F_{n,R}}{N_R} \right)
\label{eqn4}
\end{equation}
in which  $F_a$
is the absolute frequency of the candidate term a in the (specialized) extraction corpus,
$F_a$
is the absolute frequency of the candidate term a in the (specialized) extraction corpus,  $F_{n,D}$
and
$F_{n,D}$
and  $F_{n,R}$
are the frequencies of each word in the extraction and in the general reference corpus, respectively, and
$F_{n,R}$
are the frequencies of each word in the extraction and in the general reference corpus, respectively, and  $N_D$
and
$N_D$
and  $N_R$
are the sizes of these two corpora expressed in the number of tokens.
$N_R$
are the sizes of these two corpora expressed in the number of tokens.
The 1000 word n-grams or terms ranked highest by Termhood values for each author were concatenated into a single list of 13000 terms, and Termhood values were added for each author where possible, resulting in a 13000 term by 13 author matrix. Using 1000 words for each author gives greater opportunity for the lists of most frequent domain-specific terms to overlap, thus possibly inflating the rate of agreement. So, the same analysis was performed with only the first 100 terms ranked by Termhood values for each author. Most terms in both matrices were single words, but some bigrams also occurred (e.g., green apple, dried fruit).
The resulting matrices were used as input for PCA using R packagesFootnote c FactoMineR (Lê et al. Reference Lê, Josse and Husson2008) and factoextra (Kassambara and Mundt Reference Kassambara and Mundt2016). PCA is a technique that can be used to summarize and visualize (highly) multivariate data. This is done by maximizing the explained variance in the data from a number of variables and summarizing the data into components (Ringnér Reference Ringnér2008). These components can subsequently be plotted in n-dimensional space using a visualization method, which here was the R package factoextra. For the current study, the different lists of unique terms per author with the Termhood values belonging to these terms are used as input for the PCA analysis. These lists may be different per author, or they may show overlap. The more inconsistent the descriptions of wines, the more different these Termhood lists would be per author, and the resulting PCA would produce a solution with many factors explaining the variance (i.e., potentially as many as the number of authors, i.e., 13). In contrast, if authors are consistent with their expert peers, the words in the Termhood ranked lists are expected to be very similar across authors, resulting in a solution with few or only a single factor.
3.2 Results
3.2.1 Domain-specific wine vocabulary
Duplicate terms were removed from the concatenated list of 13,000 words, leaving 7853 unique terms. There was approximately 79.2% overlap in the terms used, with 5147 terms used frequently by at least two different authors.
A scaled dual-factor PCA was performed over the 7853 unique terms by 13 author matrix. A scree plot, where factors are plotted according to the amount of variance they explain, was used to determine the amount of relevant factors. Scree plots normally give a distinct break between factors explaining a large part of the variance, and thus should be retained, and factors that do not explain a significant part of the variance (i.e., the scree, or rubbish; (Cattell Reference Cattell1966)). Inspection of the scree plot supported retaining a two-factor solution, although the eigenvalues suggested only the first factor was sufficient (eigenvalues: factor  $1 = 6.51$
; factor
$1 = 6.51$
; factor  $2 = 0.91$
; factor
$2 = 0.91$
; factor  $3 =
0.80)$
. To ease interpretation, the first two factors were retained. The first dimension explained 48.5% of the variance, and the second dimension 7.0%. All authors loaded positively on the first dimension (see Figure 4), suggesting consistency of term usage. According to the term loadings, the first dimension distinguished more general terms (e.g., flavors, aroma, palate), from more specific terms (e.g., spice, vanilla, plum, lemon). Authors seemed to be distinguished by the second dimension, with Author 8 and Author 5 being the most distinct from each other (see Figure 4). The second dimension also differentiated aroma terms from flavor terms; for example, terms like plum and spice loaded positively toward aromas, whereas words like acidity and tannic loaded negatively toward flavors.
$3 =
0.80)$
. To ease interpretation, the first two factors were retained. The first dimension explained 48.5% of the variance, and the second dimension 7.0%. All authors loaded positively on the first dimension (see Figure 4), suggesting consistency of term usage. According to the term loadings, the first dimension distinguished more general terms (e.g., flavors, aroma, palate), from more specific terms (e.g., spice, vanilla, plum, lemon). Authors seemed to be distinguished by the second dimension, with Author 8 and Author 5 being the most distinct from each other (see Figure 4). The second dimension also differentiated aroma terms from flavor terms; for example, terms like plum and spice loaded positively toward aromas, whereas words like acidity and tannic loaded negatively toward flavors.

Figure 4. Biplot of PCA analysis conducted on the Termhood weighted wordlists ( $n = 1000$
) for each author. Terms are shown as cases, grey-scaled by their relative contribution toward the solution (cos2 weighed; (Abdi and Williams Reference Abdi and Williams2010)), and authors are shown in red. Red vectors indicate the correlation between both dimensions for each author. To ease interpretation, only the 50 most influential terms in the solution are plotted in this graph.
$n = 1000$
) for each author. Terms are shown as cases, grey-scaled by their relative contribution toward the solution (cos2 weighed; (Abdi and Williams Reference Abdi and Williams2010)), and authors are shown in red. Red vectors indicate the correlation between both dimensions for each author. To ease interpretation, only the 50 most influential terms in the solution are plotted in this graph.
To summarize, the solution was highly unidimensional, and all authors loaded positively on the first dimension. This suggests high consistency between authors in their language use. The authors nevertheless differed somewhat on the second dimension, suggesting some subtle differences in the use of aroma versus flavor terms.
The same analysis was repeated with the first 100 terms ranked highest on Termhood for each author. There were 573 unique terms, with 96.4% of the terms used by at least two authors, and 146 terms used by all authors, that is, 146 terms were found to be used more frequently by every author compared to the reference corpus, as was indicated by the fact these terms had a positive Termhood value for these authors. One could conclude that there are 146 “wine terms,” that is, they are used distinctly (compared to the use of those terms in Standard English) and conventionally (used across wine writers).
The result of this second PCA was similar to the first. The eigenvalues (eigenvalues: factor  $1 = 6.57$
; factor
$1 = 6.57$
; factor  $2 = 1.05$
; factor
$2 = 1.05$
; factor  $3 =
0.85$
) and scree plot suggested a two-factorial solution. The first dimension explained 50.5% of the data, and the second dimension 8.0% (Figure 5). Authors loaded positively and with comparable influence on the first dimension (shown by the red vectors in Figure 5). The first dimension ranged roughly from specific words (peach, crisp, vanilla, pinot noir) to more general words (flavors, fruit, palate, aromas). The second dimension was reversed with respect to the first PCA analysis, that is, ranged from flavors to aromas, but as the scale of PCA factors is arbitrarily determined, it is comparable to the first analysis. The authors showed some dispersion on this second dimension, with positive loadings for Author 1 and negative loadings for Author 8, on the extremes.
$3 =
0.85$
) and scree plot suggested a two-factorial solution. The first dimension explained 50.5% of the data, and the second dimension 8.0% (Figure 5). Authors loaded positively and with comparable influence on the first dimension (shown by the red vectors in Figure 5). The first dimension ranged roughly from specific words (peach, crisp, vanilla, pinot noir) to more general words (flavors, fruit, palate, aromas). The second dimension was reversed with respect to the first PCA analysis, that is, ranged from flavors to aromas, but as the scale of PCA factors is arbitrarily determined, it is comparable to the first analysis. The authors showed some dispersion on this second dimension, with positive loadings for Author 1 and negative loadings for Author 8, on the extremes.
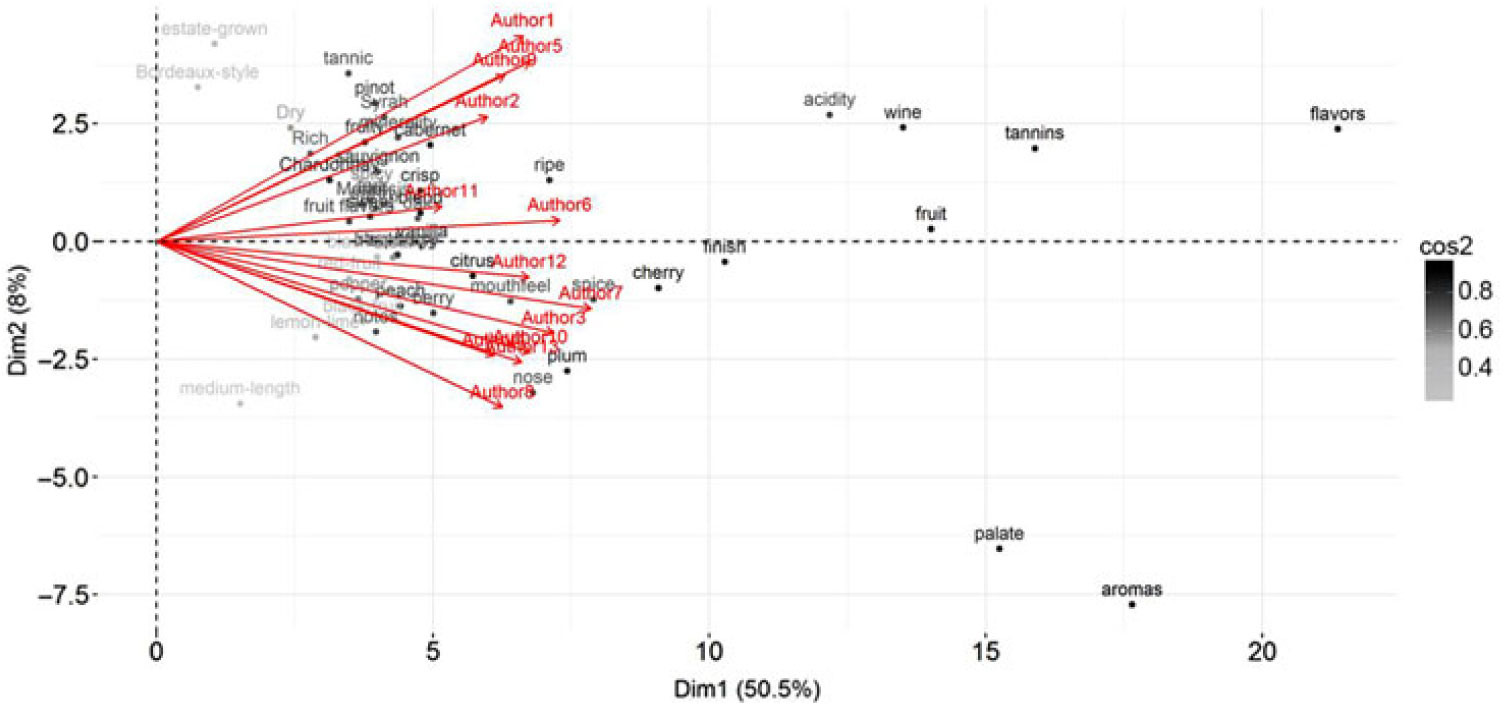
Figure 5. Biplot of PCA analysis conducted on the Termhood weighed wordlists ( $n = 100$
) for each author. Terms are shown as cases, colored by their relative contribution toward the solution (cos2 weighed; (Abdi and Williams Reference Abdi and Williams2010)), and authors are shown in red. Red vectors indicate the relative correlation both dimensions for each author. To ease interpretation, only the 50 most influential terms in the solution are plotted in this graph.
$n = 100$
) for each author. Terms are shown as cases, colored by their relative contribution toward the solution (cos2 weighed; (Abdi and Williams Reference Abdi and Williams2010)), and authors are shown in red. Red vectors indicate the relative correlation both dimensions for each author. To ease interpretation, only the 50 most influential terms in the solution are plotted in this graph.
To summarize, the PCA analyses further confirmed that authors are generally consistent with each other in their descriptions. The first dimension of the PCA solution revealed consensus between authors, and ranged from specific to general terms. The second dimension showed some dispersion between authors. However, the variance explained by this dimension was small. Terms used to indicate flavors, including aspects such as taste, or grape type loaded highly on one end of the second dimension, while source terms referring to aromas such as plum loaded on the other end of this dimension. This suggests that while authors were remarkably consistent overall, authors differed somewhat in their strategy to describe wines by taking either a more flavor-driven approach, for example, Author 1 and Author 5, or a more aroma-driven approach exemplified by Author 8.
3.2.2 Comparison of wine vocabulary
Previously, scholars have compiled lists of wine vocabulary. Notably, Lehrer (Reference Lehrer2009) describes three wine wheels, that is, the aroma wheel (Noble et al. Reference Noble, Arnold, Masuda, Pecore, Schmidt and Stern1984, Reference Noble, Arnold, Buechsenstein, Leach, Schmidt and Stern1987), the sparkling wine wheel (Noble and Howe Reference Noble and Howe1990), and the mouthfeel terminology wheel (see Figure 6; Gawel et al. (Reference Gawel, Oberholster and Francis2000)). As introduced before, a wine wheel is a list of terms that can be used to describe a wine, organized by specificity: the most general terms are listed on the middle tier, and more specific words are listed on outer tiers (see Figure 6, for example). We compiled words from these three classic wine wheels which resulted in a single list of 244 unique terms. In addition, two other vocabulary lists: (i) Robert Parkers’ glossary of 117 wine terms (Parker Reference Parker2017), and (ii) the 61 references used in the Le Nez du Vin wine aroma kit (Lenoir Reference Lenoir2011) were collated. The Le Nez du Vin Masterkit contains 54 labeled smells. These were supplemented with the 12 reference terms from the New Oak kit. After removal of duplicate terms that occurred in both kits, 61 terms remained. These existing lists of wine vocabulary were compared to the domain-specific vocabulary that was found in the current corpus of wine reviews.
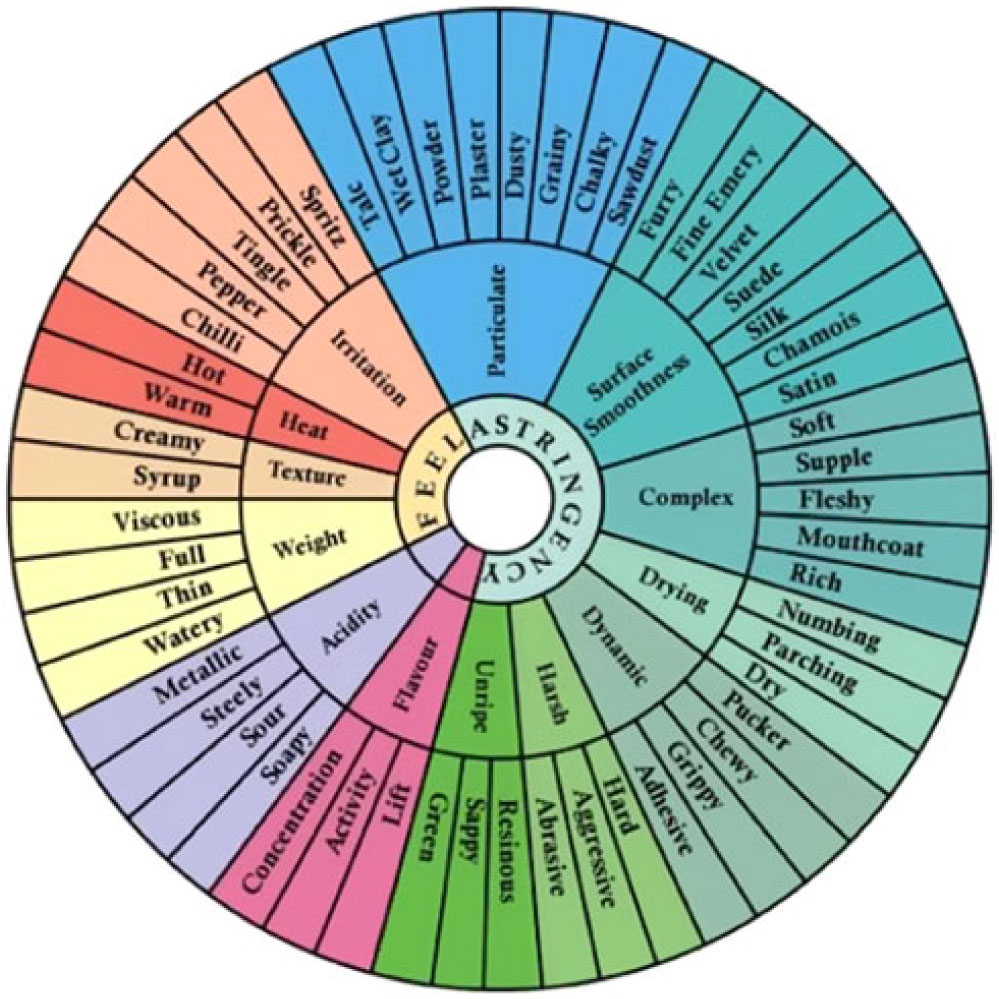
Figure 6. Mouthfeel terminology wheel showing a hierarchical representation of terms used to describe the mouthfeel of red wine. Adapted with permission from Gawel et al. (Reference Gawel, Oberholster and Francis2000).
Before comparing the vocabularies in the various wheels and lists, we first built our own wine wheel—the Text-Based Wine Wheel—which visualized the terms we extracted from our wine corpus in a completely bottom-up manner (see Figure 7). To construct our wheel, the 146 unique terms extracted using TExSIS were organized on a wine wheel using the XLStat Sensory Wheel function. After minimal preprocessing (e.g., spice and spicy were combined into one entry), the automatically extracted terms of the outer ring were manually classified into 3 overarching categories and 12 subcategories that are depicted on the inner rings: aromas (fruit; spices; food; non-food), taste/texture (technical tasting; taste proper; texture), and technical vocabulary (grape varieties; modifiers; occasion; vinification; other).

Figure 7. The Text-Based Wine Wheel, based on the terms automatically extracted from our corpus of wine expert reviews (outer ring), and grouped into categories (inner rings).
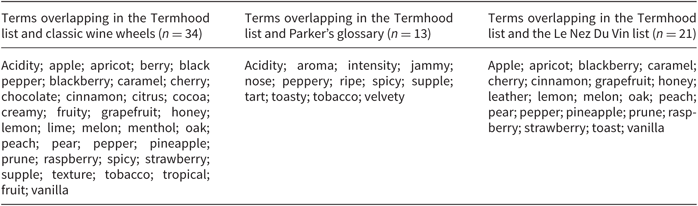
We then compared the wine vocabularies from the various sources. First, the terms in each list (the 244 terms from classic wine wheels, 117 terms from Robert Parker’s glossary, and 61 references from the Le Nez du Vin Masterkit, in addition to the list of 146 terms uncovered from the present corpus: our Termhood list) were further processed. Spelling variants were standardized. Some lemmas had multiple entries, for example, the singular fruit and plural fruits, and were collapsed. Adverbial phrasings such as fruity possibly apply to more distinct smells than fruit, so these were kept separate, as was cherry flavors, which possibly covers more flavors than cherry alone. Also, drying and dry were kept as unique entries. Next, the vocabulary from the classic wine wheels was examined qualitatively to determine the amount of overlap (Table 7). Out of the 244 terms that occurred in at least one of the three classic wine wheels, 34 also appeared in our list (i.e., 13.9% overlap); 13 terms occurred in both Parker’s glossary and our list (i.e., 11.1%), while 21 overlapped in the Le Nez du Vin reference list and ours (almost 30% of the 61 terms on the Le Nez du Vin list). In total, 45 terms occurred in all lists. Not only does this suggests some overlap, but also that there are many words listed in wine vocabulary lists that are not frequently used in actual wine descriptions (at least in our data). One possibility is that the words not attested in our corpus of wine reviews denote very specific aromas and flavors not commonly found across a range of wines. Nevertheless, both novices and experts may also benefit from a list of the more common vocabulary from wine reviews. The new Text-Based Wine Wheel provides just such a tool.
Table 7. Words occurring both in the Termhood highest ranked list and in the established wine vocabulary list
Of further interest are the unique terms in the Termhood list. These 89 terms are used often in online wine reviews; in fact, they were used by all 13 authors, and all with higher frequency than there are likely to occur in everyday English; yet, these terms are not included in reference word lists such as the Noble wine wheel and Parker’s glossary. These were aroma terms such as black cherry, blueberry, cassis, cherries, cocoa, fruit, lime, mocha, red berry, red fruit, ripe fruit, smoke, spice, stone fruit, tannins, wood, zest. Some of these words were adjectives, that is, bright, creamy, crisp, delicious, dense, firm, juicy, minty, racy, smooth, zesty; while other terms picked out intensity or complexity, such as accents, layers, hint, notes, plenty, richness, scents. Other terms indicated the location or modality in which the flavor was perceived, that is, finish, midpalate, mouth, mouthfeel, palate, sweet, structure, touch. In addition, a number of terms can be considered technical language about grape types, vinification methods, and comments on how to enjoy the wine best, for example, blend, cabernet sauvignon, merlot, riesling, viognier, vineyard, minerality, aperitif, dishes (see Supplementary materials S1 for full lists).
4. Discussion
Controversy surrounds expert descriptions of wine. On the one hand, tasting notes are criticized, and described as uninformative (Shesgreen Reference Shesgreen2003; Quandt Reference Quandt2007) and highly idiosyncratic (Lawless Reference Lawless1984). The current results contradict these proposals. Wine reviews were found to consistently distinguish global properties of wine, such as color and grape variety. The fact that reviewers—despite their individual vocabulary preferences—distinguish categories of wines consistently is impressive. Wine experts are able to write in their individual styles while at the same time giving consistent descriptions of wine.
Solomon (Reference Solomon1997) proposed that when novices become wine experts, they undergo a conceptual shift, that is, their knowledge structures become more refined, and the conceptual categories become more specific (Carey Reference Carey2000). He further hypothesized that wine expert knowledge is organized by grape type. Later studies have shown wine experts indeed consistently sort wines by grape type, while novices use other (more haphazard) strategies (Solomon Reference Solomon1997; Ballester et al. Reference Ballester, Patris, Symoneaux and Valentin2008; Urdapilleta et al. Reference Urdapilleta, Parr, Dacremont and Green2011). The current study shows expert language also distinguishes grape varieties distinctively, further corroborating the hypothesis that wine knowledge is structured by grape variety.
Wine is highly multidimensional. In addition to grape variety, the color of wine affects how experts describe wines (Morrot, Brochet and Dubourdieu Reference Brochet and Dubourdieu2001; Parr, White and Heatherbell Reference Parr, White and Heatherbell2003) and color can influence how sweet a wine is perceived to be (Pangborn, Berg and Hansen Reference Pangborn, Berg and Hansen1963). When experts do not taste wines blind, their perception and descriptions are influenced by what they see (Auvray and Spence Reference Auvray and Spence2008; Smith Reference Smith2012; Spence Reference Spence2015b). In the current study, the color of wine was also reflected in descriptions from experts, further underlining the importance of color, and vision in general, in flavor perception (Auvray and Spence Reference Auvray and Spence2008; Christensen Reference Christensen1983).
We hypothesized wine experts would also vary their descriptions of wines by origin. A recent study suggested terroir, that is, the place where wine is made, has a bigger influence on the smell of a wine than grape type (Foroni et al. Reference Foroni, Vignando, Aiello, Parma, Paoletti, Squartini and Rumiati2017). In the current study, we investigated a coarse-grained distinction by examining whether reviews distinguished wine made in the old or new world. This distinction is often made by wine experts (Remaud and Couderc Reference Remaud and Couderc2006), but has received criticism too (Remaud and Couderc Reference Remaud and Couderc2006; Banks and Overton Reference Banks and Overton2010). In line with this criticism, the classification task did not yield reliable results, which may indicate the old versus new world distinction is not consistently reflected in wine experts’ descriptions, and further suggests experts might not think about wines along this dimension. Nevertheless, a more fine-grained distinction, on the level of country of origin, or even at the level of the specific wine region, may be important and is worthy of further examination.
Wine writers write not only for other experts but also for less knowledgeable consumers. There is little relationship between price and quality for wines (Cardebat and Livat Reference Cardebat and Livat2016; Oczkowski and Doucouliagos Reference Oczkowski and Doucouliagos2015), so reviews can provide important guides for the less experienced. In order to become a wine expert, students have to practice naming the aromas and flavors that can be encountered in a wine. A structured list of words, such as the Wine wheel (Noble et al. Reference Noble, Arnold, Masuda, Pecore, Schmidt and Stern1984), can be a useful tool to help budding wine enthusiasts to develop their ability to describe wines. In fact, wine wheels such as those from Noble et al. (Reference Noble, Arnold, Buechsenstein, Leach, Schmidt and Stern1987), as well as the vocabulary used by Robert Parker, have changed the way wines are described dramatically over the last 50 years (James Reference James2018). At the same time, there is criticism of the use of these vocabulary lists. Most of the terms are not exclusive to the domain of olfaction and are essentially metaphors from other domains. Novices, lacking appropriate background, may struggle to understand what is meant by a descriptor from these lists (Lawless Reference Lawless1984; James Reference James2018). Nevertheless, conventionalized vocabulary may help professionals to standardize their descriptions, improve communicative efficacy, and may also aid in tailoring descriptions for less knowledgeable consumers (Gawel et al. Reference Gawel, Oberholster and Francis2000). In line with the suggestion of Gawel et al. (Reference Gawel, Oberholster and Francis2000), that wine vocabularies should be frequently revisited and updated, we show that many words used by wine experts were not present on these lists. This suggests there is still room for improvement.
Nevertheless, the current list of words has caveats too. One striking observation is that most words are positive, and none of the words can be considered negative. This contrasts the wine vocabulary of Robert Parker, for example, where many words such as dumb, closed, and off can be used to describe wines more negatively. The data that were used here to obtain the vocabulary could explain why most of the found terms were positive: negative reviews are rarely published on the source website, and all wines in the database scored above 75 out of 100 points. Future follow-up investigations may consider texts obtained from naming experiments done with experts, with a broad qualitative range of wines, which includes wines with wine faults (Lawless Reference Lawless1984; Solomon Reference Solomon1990; Melcher and Schooler Reference Melcher and Schooler1996; Solomon Reference Solomon1997; Croijmans and Majid Reference Croijmans and Majid2016). Although this approach would result in a significantly smaller data set, it may nevertheless be a valuable supplement to the wine vocabulary found here, and in other existing wine vocabularies.
To conclude, in other expertise domains, such as dog breeding and bird watching (Tanaka and Taylor Reference Tanaka and Taylor1991), computer maintenance (Humphrey and Underwood Reference Humphrey and Underwood2011), and the visual arts (Cialone et al. Reference Cialone, Tenbrink and Spiers2018), expertise has been shown to affect the use of visual and spatial language. The current results show that even in a domain that is incredibly difficult to talk about for the general population—that is, olfaction—expertise can shape language use. Wines were described using domain-specific language in a consistent and distinct manner. This shows wine experts can overcome the limitations of their language (Levinson and Majid Reference Levinson and Majid2014) and convey experiences of smell and flavor with verve.
Acknowledgements
This work was funded by The Netherlands Organization for Scientific Research: NWO VICI grant “Human olfaction at the intersection of language, culture and biology” to A. Majid [grant number 277-70-011]. Thanks to Chris van der Lee for processing the corpus data, and Laura Speed and Artin Arshamian for comments on an earlier draft of the manuscript. We would like to thank three anonymous reviewers for their thoughtful comments and suggestions on two earlier drafts of this manuscript.


 Open access