Economic Analysis of Renewable Energy in the Electricity Marketization Framework: A Case Study in Guangdong, China
 Wenfeng Liu
 Xingping Zhang1,2,3*
 - 1School of Economics and Management, North China Electric Power University, Beijing, China
- 2Beijing Key Laboratory of New Energy and Low-Carbon Development, North China Electric Power University, Beijing, China
- 3Research Center for Beijing Energy Development, Beijing, China
Along with China's rapid advancement of electricity market reform, market-oriented policies in promoting renewable energy development and accommodation are foreseeing. Assessing the economics of renewable energy under electricity marketization is an important issue worthy of study. In this paper, we firstly employ merit order method to establish an electricity market clearing model of the electricity trading by modeling 48 hypothetical scenarios. Then we simulate the market clearing prices at 15-min intervals to discuss the economics of renewable energy in a benchmark feed-in tariff (FIT) scenario and a market-oriented scenario with the historical data of Guangdong, China. Further, the study exams the economic interrelationship between the outputs of wind and solar power in different load scenarios. The results demonstrate that the consumption of renewable energy is greatly improved in the market-oriented situation. However, in this scenario, renewable energy generation is unprofitable and uneconomic compared with in the benchmark FIT scenario. In the high-load scenarios, the changes in wind power output have a negative impact on the economics of solar power, while the mixed effects exist in the low-load scenarios. Based on these findings, conclusions and policy implications are drawn at the end of the paper.
Introduction
As an alternative to mitigating climate change, developing renewable energy has become a general consensus all over the world (Liu W. et al., 2019). Developing renewable energy sector and upgrading energy structure have strategically important role in China's commitments against climate changes (Ji and Zhang, 2019). The ambitious development plan of renewable energy and significant progress have been achieved in recent years in China. With the large-scale expansion of renewable energy, the cost of renewable energy has dropped considerably. China is accelerating the reform of electricity market which was started in Guangdong Province as a crucial pilot. Government plays a large role in facilitating progress in developing renewable energy (Jia et al., 2019; Wang et al., 2020). In the electricity market situation, units with low marginal cost are dominant in the bidding process. It is conducive to promote the accommodation of renewable energy and alleviate the curtailment of wind and solar power. In addition, there emerges a new opportunity for the evolution of renewable energy and it is possible to achieve the transition from a benchmark feed-in tariff (FIT) mechanism to a market-oriented one in the future. Thus, it is of great practical significance to assess the economics of renewable energy in China under the electricity market situation.
In March 2015, the Chinese Communist Party Central Committee and the State Council jointly issued “Document No. 9 – Opinions on Further Deepening the Reform of the Power System” (Zeng et al., 2016). In the following years, a series of companion documents were issued by relevant central government agencies to flesh out an action plan of the reform. Provincial governments developed implementation plans according to the central policy. Eight provinces have moved into pilot runs of wholesale spot markets (Yu, 2020). Because of regional disparity and convergence of electricity consumption in China (Cheong et al., 2019), generation scheduling and dispatch rules have been revised to better incorporate renewable generators into electricity markets. Previous researches have studied Chinese electricity reform from different perspectives. The first perspective is a comprehensive review of Chinese electricity reform. Wang and Chen (Wang and Chen, 2012) discussed China's electricity market-oriented reform from an absolute to a relative monopoly perspective. Ngan (2010) analyzed the three main stages of China's reform in order to trace out the main characteristics of reform measures including those for power investment financing, separation of government and enterprise, and the division between power generation firms and power grids. In addition, poor renewable energy integration is posing a huge challenge to China's electricity sector. Zhang et al. (2018) examined the extent to which China's power sector reforms will assist renewable energy integration, and issues to effective implementation. The policy suggestions to promote the integration of renewable energy in the power market were concluded. The second is the specific study of typical provinces. Liu S. et al. (2019) analyzed the progress of Yunnan electric power market reform, resource allocation and renewable energy integration. The main contributions of this paper lie in the extension of the existing understanding of electricity reforms in Yunnan and China. Cheng (2018) reviewed four elements in the reformed market architecture including market pricing rules, transitional quantity controls, the generation rights market, and inter-provincial trade in Yunnan and concluded on six insights regarding the role of the grid operator, security checks on trade, integration of cascade hydropower, the inclusion of renewables in the generation rights market, price controls, and market participant price uncertainty. In general, market is playing an increasingly significant role in China's electricity industry.
With respect to the economic evaluation of renewable energy, it is generally analyzed and presented in three related indicators: the per watt capital cost of renewable energy modules (typically expressed as CNY/W), the levelized cost of electricity (LCOE) (typically expressed as CNY/kWh), and the concept of “grid parity” (Bazilian et al., 2013). The indicator of per watt capital cost has the disadvantages that module costs do not translate automatically into full installed system costs. While LCOE is a popular metric which is widely used as a metric to rank the competitiveness of power generation technologies (Limmanee et al., 2017; Tran and Smith, 2018; Sarasa-Maestro et al., 2019). Many literatures have studied the application of traditional LCOE calculation methods. Firstly, some of them aim to evaluate the LCOE of specific energy technologies and analyze the factors affecting the cost of renewable energy. For example, Mulligan et al. (2015) provided the first commercial-scale LCOE estimates for organic photovoltaics (OPVs) by integrating OPV-specific measured and calculated data into the estimates. Abdelhady et al. (2018) attempted to estimate the energy production and LCOE of biomass power plant fed with rice straw in Egypt. Lerch et al. (2018) performed a sensitivity analysis on the LCOE for floating offshore wind farms to obtain maximum and minimum LCOE variation limits and possible cost reduction potentials. Secondly, some of them apply LCOE to compare projects. Zang et al. (2018) provided a techno-economic comparative analysis of biomass integrated gasification combined cycles with and without CO2 capture through LCOE evaluation. Luo et al. (2017) discussed sensitivity factors of LCOE to capture the impacts of solar multiple on the performance of direct steam generation solar power tower plant with integrated thermal storage. Thirdly, some studies extend the calculation method of LCOE or revise the traditional LCOE calculation approach. Said et al. (2015) presented improved modeling and analysis of the LCOE associated with photovoltaic (PV) power plants in Egypt. The presented model considers the effective lifetime of various PV technologies rather than the usual use of the financial lifetime and the result show that the effective lifetime has a significant impact on the LCOE. Bruck et al. (2018) developed a new cost model to evaluate the LCOE from a wind power source under a Power Purchase Agreement (PPA) contract. The developed cost model can be used as a basis for setting appropriate PPA terms, such as a price schedule and performance metrics. Ling-zhi et al. (2018) developed a new revised LCOE mathematical model based on NPV and discounted cash flows techniques, and analyzes the cost-benefit evolution of concentrated solar power (CSP) technologies by taking the CSP industry of China as an example. Aldersey-williams et al. (2019) developed a new approach and methodology, which uses the United Kingdom (UK) “audited” data published in company accounts, to determine more accurate LCOE estimates. Geissmann (2017) set forth a novel approach to calculate the LCOE using a probabilistic model that accounts for endogenous input parameters. Branker et al. (2011) reviewed the methodology of properly calculating the LCOE for solar PV, correcting the misconceptions made in the assumptions found throughout the literature.
Furthermore, the concept of “grid parity” has emerged as a key competitiveness indicator to evaluate the economics of renewable energy. It refers to the price intersection of renewable and conventional electricity. For example, Bhandari and Stadler (2009) computed the LCOE of a PV power generation system in Germany and compares them to the respective local electricity prices, which gave a suggestion that grid parity will be reached between 2013 and 2014. Li et al. (2016) explored the LCOE of wind, PV and coal power on the utility's transmission and distribution grids. Finding that wind power is approaching the utility cost in 2020 and achieves the grid parity in provinces with favorable wind resources and unfavorable coal electricity costs. Distributed PV stations can reach the grid parity on the retail level for business or even industrial consumers.
In the existing literature, scholars have presented various methods to provide economic analysis for renewable energy. However, the dynamics of economic analysis of renewable energy in market conditions are complex. Most of the literature either examine the economic analysis through the indicator of LCOE on renewable energy, or compare the LCOEs with static local electricity prices to verify the grid parity. Few examples assess the economics of renewable energy between LCOEs and dynamic market clearing prices in a market situation, especially in China. Thus, our goal is to fill this gap. In this paper, the economics of renewable energy is done by comparing the calculation result – the LCOE – with the market clearing price under the electricity marketization background. As one of the first pilot province in the retail electricity market reform process, Guangdong is also one of the developed provinces in China. Therefore, this paper selects Guangdong Province as the case. To the best of our knowledge, this is the first paper to systematically compare the LCOE of renewable energy with market clearing price under the electricity marketization background in Guangdong Province, China. The contributions of this paper are 2-fold. Firstly, the paper not only clearly calculates the LCOEs of renewable energy in Guangdong but also reveals the simulation process of market clearing prices at 15-min intervals through merit order method and the unit commitment constraints. Secondly, the paper studies the economic interrelationship between wind and solar power in different load conditions. The models proposed in this paper can provide a reference for scholars to study the economics of the renewable energy in the electricity marketization framework. Furthermore, it is conducive to facilitating an understanding of the renewable energy power's long-term sustainable development pattern under free market conditions in the future, and helping to provide references for policy-making institutions.
The paper is organized as follows. Section Methodology introduces the Methodology. Section Economic assessment of renewable energy generation: the case of Guangdong Province in China presents the economic calculation of renewable energy generation in Guangdong. The discussion is presented in section Discussion. Section Conclusions and Policy Implications presents the study's conclusions and policy implications.
Methodology
Generating Unit Commitment Model
The ideal power market is dispatched by the method of merit order according to the principle of increasing marginal cost of the power system. In the idealized situation, the clearing result of the power system at a moment must be able to minimize the marginal cost of the system. Therefore, in this paper, the minimum marginal cost of the power system during the study period is taken as the objective function of the unit commitment in the market-oriented situation, which is written as follows:
where OCit is operating cost of unit i at time t, SUCit is start-up cost, and SDCit is shutdown cost.
In the process of electric power dispatching, a series of constraint conditions require to be considered, mainly including power balance constraints, operational standby requirements, unit maximum and minimum output constraints, climbing constraints, start and stop constraints (Geng et al., 2009; Qiuna et al., 2012; Lu et al., 2019).
Power balance constraint:
where Pit is the power supply of unit i at time t, Dt is system load and Lt is line loss at time t.
Operational standby requirement:
where Rit is operating reserve of unit i at time t, Rt is minimum operational standby requirements at time t.
Unit maximum and minimum output constraint:
where Pi is the minimum power supply, is the maximum power supply, uit is running state of unit i at time t.
Climbing constraint:
where is the downhill climbing constraint of unit i, is the upward climbing constraint of unit i.
Start and stop constraint:
where is cumulative start-up time, and is cumulative shutdown duration of unit i as of time t. is minimum start-up duration, is minimum shutdown duration of unit i.
Economic Assessment Model
LCOE is a common metric for comparing power generating technologies, which measures the economic lifetime electric production and cost. This metric allows comparing the generation costs of conventional plants with variable renewable sources like wind and solar PV, despite their different cost structures (Ueckerdt et al., 2013). The method used to evaluate the economic analysis of renewable energy is to calculate the net economic value of unit electric energy provided by the generation resources through the difference between the average electricity price and LCOE, which is shown in Equation (7).
where, NV is the net value of unit electric energy. P is the annual average electricity price, which is the annual average market clearing price. A(CAPEX) is the annual levelized capital expenditure, A(OM) is the annual value of operating maintenance costs, A(F) is the annual value of fuel costs, A(T) is the annual value of tax, and A(E) is the expected annual value of on-grid electricity.
Economic Assessment of Renewable Energy Generation: the Case of Guangdong Province in China
As one of the first pilot province in the retail electricity market reform process, Guangdong is also one of the developed provinces in China. Therefore, this paper selects Guangdong Province as the case and economically assesses the renewable energy in Benchmark pricing scenario and market-oriented scenario.
Benchmark FIT Scenario
In the case of benchmark FIT scenario, 100 MW wind power units and 50 MW solar power units in Guangdong are taken as the sample1. Since the marginal cost of wind and solar power is negligible, its marginal contribution is approximately equal to its benchmark FIT. In this paper, we prioritize the dispatch of renewable energy and fulfill the remaining load with coal power by adjusting its output level. Based on the data of 2017, the economic values of wind and solar power in Guangdong Province are calculated under benchmark FIT scenario, as shown in Table 12.
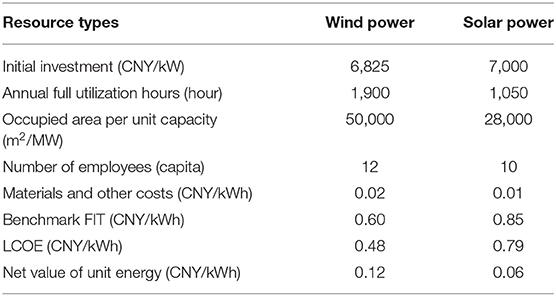
Table 1. Parameters setting and LCOEs for wind and solar power generation.
As can be seen in Table 1, no significant differences were found between wind power and solar power for the indicators of initial investment, the number of employees, and materials and other costs. The difference in occupied area per unit capacity, which has a significant impact on the value of tax, between the wind and solar groups was significant. Annual full utilization hours also has a significant impact on the value of on-grid electricity. As a result, the LCOE of solar power is 0.31 CNY/kWh higher than that of wind power. Therefore, the net value of unit energy created by wind power and solar power in the benchmark FIT scenario is positive, and the economic value of wind power is 0.06 CNY/kWh higher than that of solar power. The economics of wind power and solar power generation are positively significant under the support of benchmark FIT.
Market-Oriented Scenario
Overview of Power Generation Capacity in Guangdong
Based on the National Electric Power Industry Statistics Express[R] (2017); Renewable Energy Data Sheet[R] (2017), and partial actual survey data of Guangdong, the installed power capacity of Guangdong Province is shown in Appendix Table A1. Including indicators of integrated auxiliary power rate, maximum load rate and maximum power supply. In addition, the minimum technical output of coal-fired power units needs to be considered according to the type and scale of the single unit, which is listed separately in Appendix Table A2.
The surrounding provinces of Guangdong are rich in hydropower resources, from which Guangdong will imports a large amount of hydropower. Based on the statistics of China Southern Power Grid, inter-provincial transaction hydropower accounted for 24.53% of the whole electricity consumption in Guangdong Province at the end of the “Twelfth Five-Year Plan” period. Therefore, the impact of external hydropower is considered in the output model of this paper. We assume that the external hydropower import is flexible and can be adjusted according to the power load of Guangdong Province. That is, increasing the import output at the peak of electricity consumption and reducing the import output at the valley of power consumption. Due to the principle of increasing marginal cost and uniform clearing price rules, the electricity price changes with the load in the market-oriented situation.
Market Rules in Guangdong Province
According to the Interim measures for the preparation of priority electricity purchase plans for priority Generation issued by the State Development and Reform Commission, and combined with the actual situation in Guangdong Province, the dispatch order of priority generators is as follows: 1. Wind, solar, and biomass power generation. 2. External hydropower. 3. Runoff hydropower. 4. Nuclear power. 5. Comprehensive utilization unit. Since there is no mandatory requirement for people's livelihood heating in Guangdong Province, cogeneration is dispatched with the principle of increasing short-term marginal cost along with conventional coal-fired power, pumped-storage power generation and natural gas power generation. In addition, the FIT is determined by the uniform clearing price, which is derived from the cost of the marginal generator unit that meets Guangdong's power demand in the market-oriented power system. If the electricity market has already been cleared in a priority generator unit, the unit quoted price with the lowest marginal cost of participation in market bidding is the current clearing price.
Wind and Solar Power Output Characteristics
Based on the historical data of wind power output surveyed in Guangdong Province, the wind power output characteristics are divided into four categories: strong breeze day, moderate breeze day, light breeze day and windless day. The simulation curve of wind typical daily output of Guangdong in 2017 is presented in Figure 1. It can be found that the variations and uncertainties occurred in intermittent wind power generation. Specifically, daily wind output ranges from 2013 to 3,168 MW in strong breeze day, from 573 to 2,686 MW in moderate breeze day and from 0 to 12,05 MW in light breeze day.
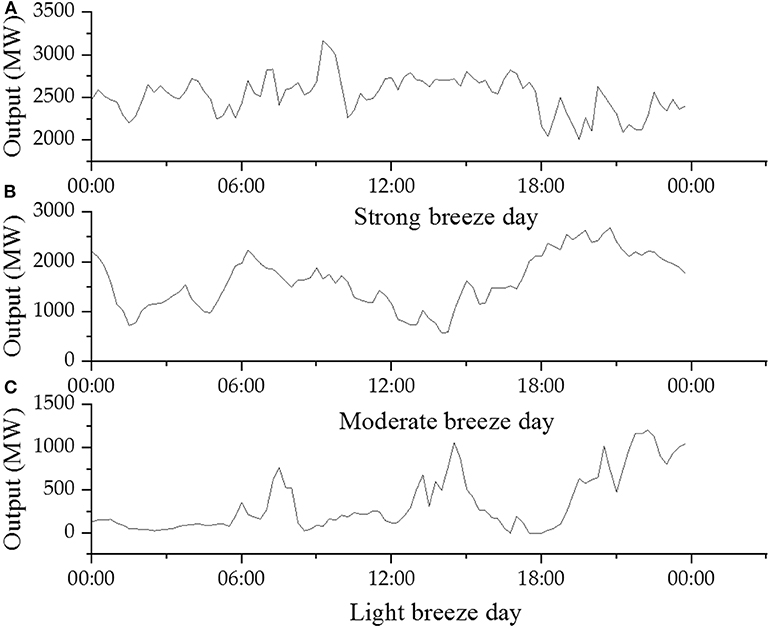
Figure 1. Simulation curve of wind typical daily output of Guangdong in 2017.
Solar power generation is significantly correlated with seasons and light intensity. Referring to the output data of roof photovoltaic in Guangdong, it is found that the output curve of solar power is roughly the shape of a downward parabola, and reaches the peak of 1 day at about 12:30. The output time in summer is about at 5: 00–20: 00, spring and autumn at 6: 00–19: 00, winter at 7: 00–18: 00. Combined with the annual photovoltaic power generation of 13,147 MWh (Su et al., 2013) and the solar power generation of 2 million MWh in Guangdong province in 2017, the real-time output curves of solar power generation in different seasons of Guangdong Province in 2017 are simulated (Figure 2). The maximum output of solar power will reach 1,643 MW in summer, 1,170 MW in spring and autumn, and 637 MW in winter.
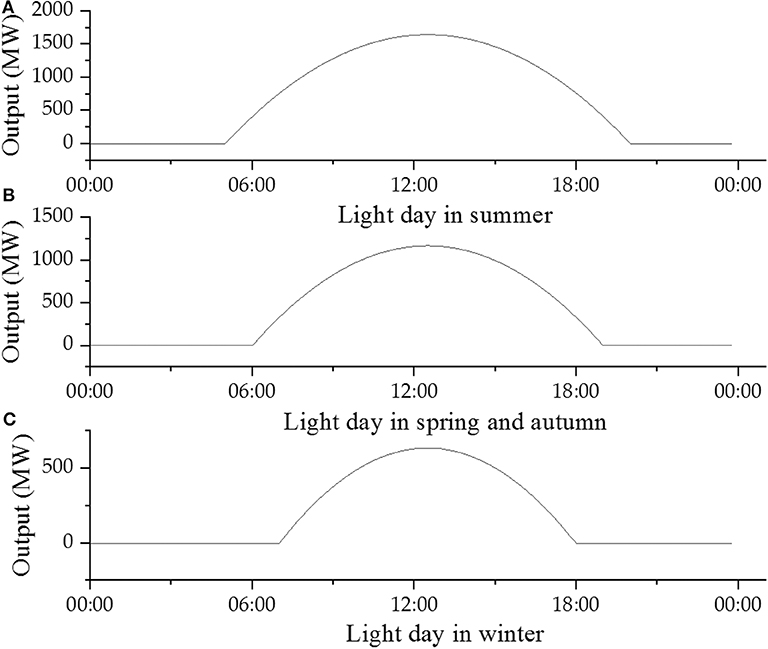
Figure 2. Simulation curve of the solar typical daily output of Guangdong in 2017.
Furthermore, the proportion of light days and no light days is also an important factor in solar power generation. According to Figure 2, there are 15 h of light a day in summer, 13 h in spring and autumn, and 11 h in winter. Combined with the annual solar irradiation time of 2,200 h in Guangdong Province, the annual light days of Guangdong Province is about 160.98 days. Hence, the proportion of light days and no light days in 1 year in Guangdong Province is about 160.98: 204.02.
Generating Unit Commitment Constraint in Guangdong
Considering the data availability and the low level of renewable energy penetration in Guangdong Province, the marketization situation has little effect on the climbing and start-stop of the units. Therefore, to simplify, this paper does not consider the climbing and start-stop constraints and its related costs. Operating cost is the main factor in calculating the marginal cost of the coal-fired power unit. Since the fuel cost accounts for a dominant proportion in the operating cost of the coal-fired power unit, the unit's marginal cost is simply replaced by the unit's fuel supply cost.
The line loss rate of Guangdong Power Grid Enterprise was 3.25% in 20163. In the market simulation, the power load should be converted into power supply load according to this ratio, and then generator sets are dispatched in combination with power system operation standby requirements. In consideration of the large scale power system of Guangdong, the operating reserve is considered as 5% of the maximum daily power supply load. The maximum power generation resources are determined by the installed capacity, the maximum load rate, and the integrated auxiliary power rate. The minimum power generation mainly considers the minimum technical output of power units, which is assumed to be 45% of installed capacity for the conventional coal power unit and the comprehensive utilization unit, and 50% of installed capacity for the cogeneration unit.
The power balance constraint is based on the 2017 actual electricity load data of Guangdong4. The electricity load data on January 28, October 23 and August 9 represent the electricity demand situation in winter weekends, spring and autumn weekdays, and summer weekdays in Guangdong, respectively5. According to the electricity load data on October 22 and 25, the corresponding daily electricity consumption in Guangdong is calculated, and the conclusion that the weekends' electricity load in Guangdong is about 0.88 times of the weekdays' electricity load is obtained. Thus, the above typical daily load curves are extended to six situations presented in Figure 3: (a) weekdays in winter, (b) weekends in winter, (c) weekdays in spring and autumn, (d) weekends in spring and autumn, (e) weekdays in summer, (f) weekends in summer.
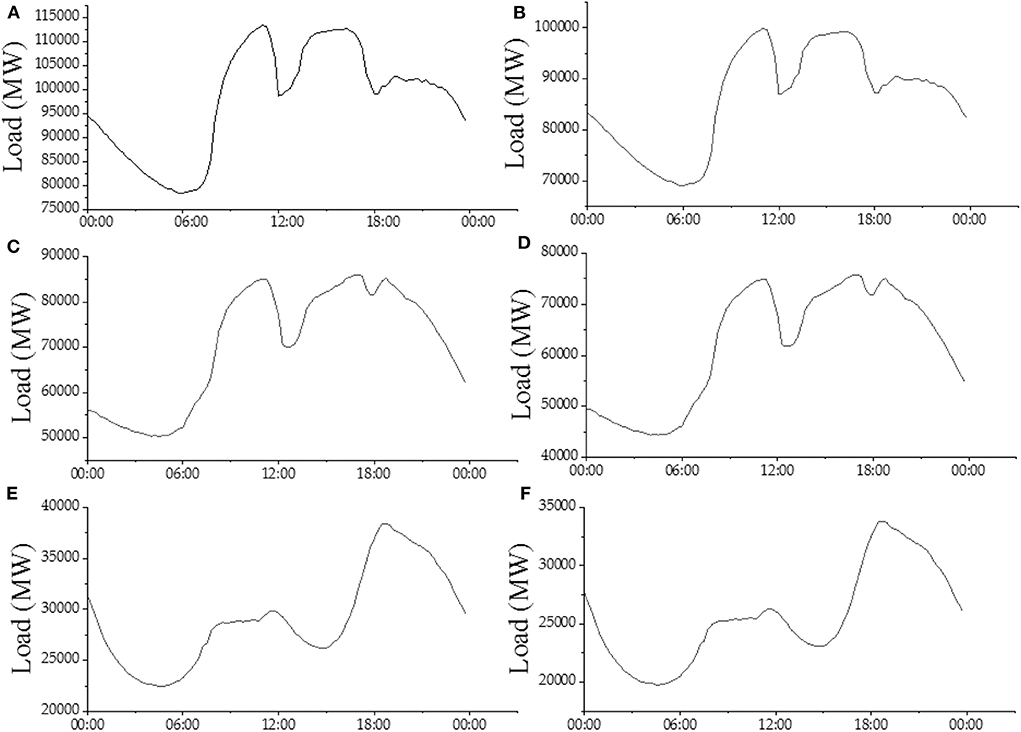
Figure 3. Typical daily load curve of Guangdong in 2017. (A) Weekdays in winter. (B) Weekends in winter. (C) Weekdays in spring and autumn. (D) Weekends in spring and autumn. (E) Weekdays in summer. (F) Weekends in summer.
It can be seen from Figure 3 that the typical daily load curve in Guangdong is roughly the trend of “three peaks and three valleys.” According to the criteria for the four seasons of Guangdong and ratio of working days to weekends at 5:2, the annual sustained load curve of Guangdong Province is obtained, as shown in Figure 4. It can be seen that the duration of the load of 103,092 MW is only 32.59 h, and the duration of the load that no < 17,955 MW is 8,760 h.
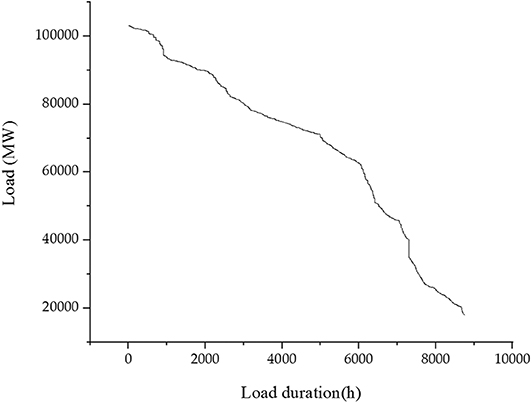
Figure 4. Annual sustained load curve of Guangdong.
In addition, considering the typical daily load curve, the annual electricity consumption in Guangdong Province is calculated to be 595 billion kWh, which is very close to the actual electricity consumption (595.9 billion kWh) in 20176. It is further verified the rationality of the selected typical daily load curve and the relative simulation hypothesis.
Power Supply Curve in Guangdong Province
Under the principle of marginal cost increment, the key to simulate the power supply curve in Guangdong is to dispatch the units participating in the market bidding according to the marginal cost. The marginal cost of the coal-fired power supply is determined by coal consumption and coal price. Additionally, the coal consumption of power supply is related to the output of the units. According to the “Guangdong Power Grid Coal Consumption Online Monitoring System Monthly Report (January 2017),” the coal consumption of coal-fired power plants at 80% and 90% load rate is presented, and the power supply of coal-fired power units in Guangdong under various load rates is calculated. In 2017, the coal price index in Guangdong Province ranges from 600.26 to 641.20 CNY/t7, which is equivalent to 841.00–898.35 CNY/t of standard coal. According to the maximum and minimum coal-fired price in 2017, the high and low coal prices are set, and the coal-fired power generation in Guangdong is used to calculate the marginal power supply cost of the coal-fired power units in Guangdong under various load rates, which are shown in Table A3.
Since September 1, 2017, the gas price of Guangdong Natural Gas Pipeline Company has been cut to 2.32 CNY/m3. Assuming that one unit (1 m3) natural gas will generate 5.18 kWh electricity, combined with the natural gas power generation comprehensive auxiliary power consumption rate of 2.02%, and the marginal cost of natural gas power supply is about 457.11 CNY/MWh.
In ideal circumstances, it is assumed that the pumped storage power station will obtain relevant information about electricity price in a timely and accurate manner, and accordingly make pumping or power generation decisions. So as to minimize the pumping cost and increase the economic benefits of power generation.
According to the market rules described in 3.2.2, wind and solar power output characteristics, the marginal cost above-mentioned resources, and combined with the typical daily load curve of Guangdong Province, the power generation resources of Guangdong are simulated in Figure 5. For the sake of simplicity, the season uses S1, S2, S3 instead of summer, spring and autumn, and winter, respectively. Weekdays and weekends are represented by W1 and W2, respectively. WD0, WD1, WD2, and WD3, respectively indicate windless day, light breeze day, moderate breeze day, and strong breeze day. L0 and L1, respectively indicate no light day and light day. We use short-term simulation at 15-min intervals as market clearing results. The power supply curve was obtained in 48 cases of a random combination of the above factors. Figure 5 shows the power supply curve and the clearing electricity price in the case of S1W1WD2L1, and the others are available on request.
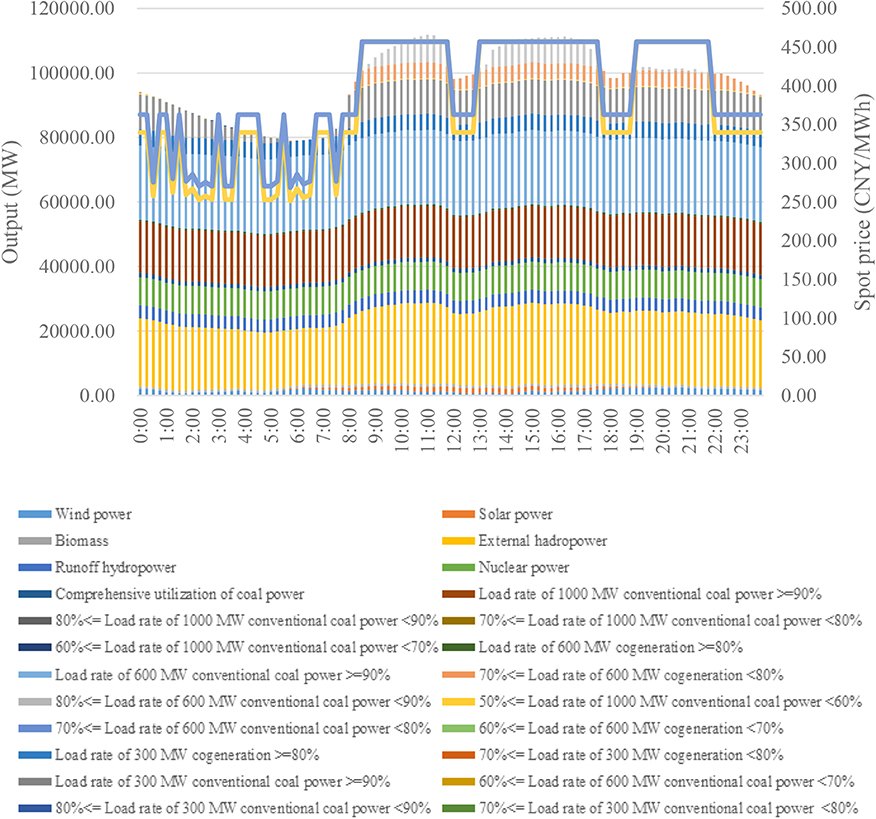
Figure 5. Guangdong power supply curve and clearing electricity price in S1W1WD2L1 scenario.
In Figure 5, the dispatch order of resource power supply is shown in bottom-up order. Specifically, the order of dispatch is wind power, solar power, biomass power, external hydropower, runoff hydropower, nuclear power and comprehensive utilization of coal power. The generation resources with lower dispatch order are coal generating units with high marginal cost of power supply, pumped storage generation and natural gas power generation. It can be found that due to the high-load in summer weekdays, the natural gas power generation unit is the clearing unit in most cases, the pumped-storage power generation unit in several cases, and the coal-fired power generation price only a few times. In other seasons, the price of coal-fired power plants is mainly cleared, but the electricity price of pumped storage power is cleared in a few cases.
Interestingly, when the natural gas power generation unit is used as the marginal clearing unit, the electricity price curves in the cases of high and low coal prices are coincident. Indicating that the coal price only affects clearing price when coal-fired power and pumped-storage power generation as marginal clearing units. While it will not affect the clearing price when natural gas power generation as marginal clearing units. A possible explanation lies in the fact, that the pumped-storage power station pumps water at the valley price of electricity and generate electricity at a rate of 3/4. While the valley price of electricity is mostly cleared in coal-fired power generation. Hence, the marginal cost of pumped storage power supply will be affected by the coal price.
Economic Analysis of RE Power Generation in Guangdong
According to the simulation results of the power market in Guangdong Province, the daily return of wind and solar power in Guangdong under 48 scenarios are obtained, and shown in Table 2.
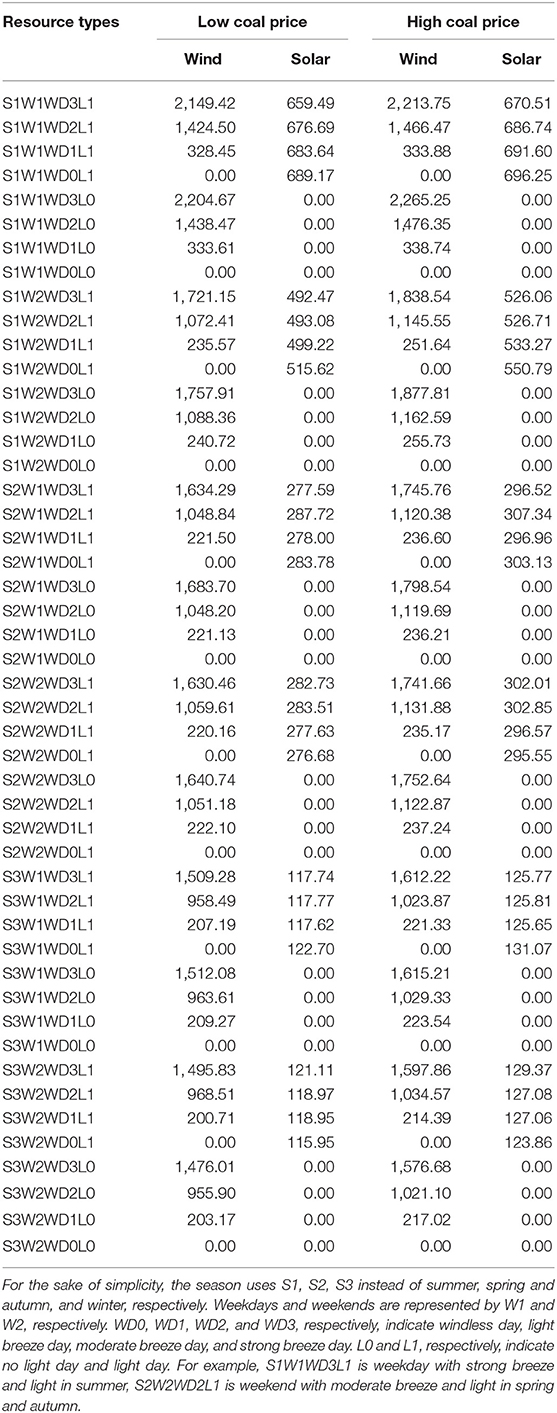
Table 2. Typical daily return of wind and solar power generation under the market condition in Guangdong Unit: 10,000 CNY/day.
Generally speaking, the market clearing price is determined by the coal-fired power units in most cases and determined by pumped storage and gas power in a few cases. It can be seen from Table 2 that the coal price affects the income level of wind and solar power. In the scenario of high coal price, the return of wind power and solar power generation is generally higher than that of low coal price. Reasons for the different effects lie in the different power supply marginal cost of the coal-fired power units which significantly affected by coal prices.
There is an interaction between wind and solar power, and the interaction will change with the load variation. In summer, for the scenarios of S1L1, the higher output level of wind power is, the higher profits it will earn. This is because of the low level of renewable energy penetration in Guangdong, renewable energy generation revenue is positively related to its output. In short, the higher output level of wind power is, the higher income it will get, and vice versa. While the income level of solar power generation decreases with the increase of wind power output. This is due to the increase in wind power output, which will lead the power system to use lower marginal cost generators as clearing units, thus decreasing the clearing price. Hence, in the case of a certain solar power generation, the market income of solar power will decrease. For the scenarios of S1WD3, S1WD2, and S1WD1, wind power has a higher income in the case of no light day than light day. That is the decline in solar power output will cause a higher clearing price. Hence, in the case of a certain wind power generation, the market income of wind power is increased.
However, the above conclusions may not be concluded in spring, autumn, and winter scenarios, where the load is relatively low. For example, in S3W2L1 scenarios, the income level of solar power generation decreases with the reduction of wind power output. In S3W2WD3 scenarios, wind power has a higher income in the case of light day than no light day. This is due to the fact that coal-electricity are generally used as marginal clearing units in the power system during the period of low-load scenario. The reduction of wind power output will increase the load rate of coal-fired power units. As a result, the coal consumption and the marginal power supply cost of coal-fired power units are reduced, leading to the reduction of clearing price. Further, the market revenue of solar power generation (or wind power generation) decreased, resulting in its economic deterioration. Therefore, the economic benefits of wind power (or solar power) is dependent on the combined effect of load and wind power (or solar power) output.
In order to better show the economics of wind and solar power between the high and low coal prices, we calculate the economic value of wind and solar power generation based on the economic analysis of resource power generation under the market condition and the simulation results of the power market in Guangdong, as shown in Table 3.
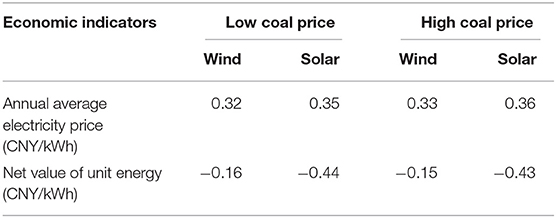
Table 3. Economic value of wind and solar power generation in guangdong province under the market condition.
As can be seen from Table 3, the annual average electricity price of solar power is higher than that of wind power. This is due to the positive correlation between solar power output and load, while the random output of wind power. In the case of light day, the peak of solar power output corresponds to the peak of the load, and the price of electricity is also at its peak. While the output of wind power is uncertain, and even in most cases the output is low. Therefore, the annual average electricity price of solar power is slightly higher than that of wind power. However, since the LCOE of solar power is significantly higher than wind power, under market-oriented condition, the net economic value of unit wind power is higher than that of solar power.
Table 3 also shows that the net value of unit energy of wind and solar power are both negative in the market-oriented scenario. Even if the wind and solar power are all consumed in priority dispatching, they are still uneconomic. Because in most cases, the clearing unit is coal-fired, and occasionally it is gas, in which the cost of wind and solar power are much higher than the clearing price. Indicating that the market benefits of wind and solar power generation are not enough to make up for their fixed costs. However, the utilization level of low marginal cost units has been greatly improved due to the economic dispatching principle adopted in the market-oriented scenario, in which the wind and solar curtailment can be eliminated approximately. According to the comparison between Tables 1, 3, in the market-oriented scenario, the net value of unit energy of wind and solar power is obviously lower than that of the benchmark FIT scenario. With the advancement of retreat subsidy policy, the cost of renewable energy has dropped significantly, the wind and solar power present good economic result under the benchmark FIT scenario. Therefore, to ensure the better economics of renewable energy in the market-oriented scenario, it is essential to adjust policies and measures to promote the survival and development of renewable energy in the context of electricity market reform. One of alternative policy selection for China is to change from FIT to feed-in premium (FIP) gradually. In addition, there is a 0.01 CNY/ kWh difference in the net economic value of unit energy between the cases of high and low coal prices, indicating that the coal price level has a positive impact on the market returns of wind and solar power.
Discussion
The Impact of Load Growth on the Economics of Renewable Energy Generation
With the economic growth of Guangdong Province, its power load will increase significantly. Based on this, this section carries out the following counterfactual simulation: assuming that the electricity load in Guangdong Province increased 10%, while the power installed capacity, wind and solar resources status and other unit commitment constraints remain unchanged. This paper evaluates the impact of load growth on the economics of renewable energy generation in Guangdong Province.
The scarcity pricing rules need to be considered in the counterfactual simulations. When the available power supply fails to meet the system load and 5% operational standby requirements, part of the load needed to be unloaded and an administrative pricing mechanism needed to be implemented. Since there is no scarcity pricing rule in China, it is assumed that the administrative price of 2 CNY/kWh will be implemented at the appointed time.
Based on the economic analysis of the resource generation under the market-oriented condition in part 2.2 and the results of electricity market simulation in Guangdong Province, the market value of wind and solar power generation is obtained in the counterfactual simulation that the electricity load is 10% higher than the current situation, as shown in Table 4.
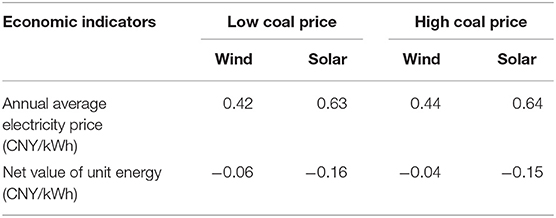
Table 4. Economic value of wind and solar power generation when the electricity load increased 10% in Guangdong Province under the market condition.
As can be seen from Tables 3, 4, although the market value of wind and solar power is still negative when the electricity load increases 10%, there has been an improvement significantly. Specifically, the annual average electricity price of wind power increases about 0.1 CNY/ kWh, and the annual average electricity price of solar power increases about 0.28 CNY/ kWh. The annual average electricity price of solar power generation has increased by a large margin compared with wind power. The reason might due to the positive correlation between solar power output and load, which will be simulated and verified in section 3.2.6.3. This paper assumes that administrative pricing is implemented at the peak of power consumption, which emphasizes the scarcity value of peak electricity consumption, thus greatly increasing the market revenue of solar power generation.
According to the results of the counterfactual simulation, it can be foreseen that, with the electricity load growth and the rationalization of electricity scarcity pricing in Guangdong, the subsidies required for renewable energy development will decrease gradually and achieve “zero subsidy” possibly. That is to say, the economic feasibility of renewable energy generation projects can be guaranteed only by the complete market mechanism.
Correlation Between Power Generation Output and Load
This section examines the correlation between power output and load through Monte Carlo simulation. We assume a uniform distribution of wind and solar resources. Firstly, according to the proportion of strong breeze day, moderate breeze day, light breeze day and windless day in Guangdong Province, the cumulative probability distribution map of wind resource condition is obtained, which is shown in Figure 6A. The cumulative probability distribution of solar resource condition is shown in Figure 6B according to the proportion of light days and days without light.
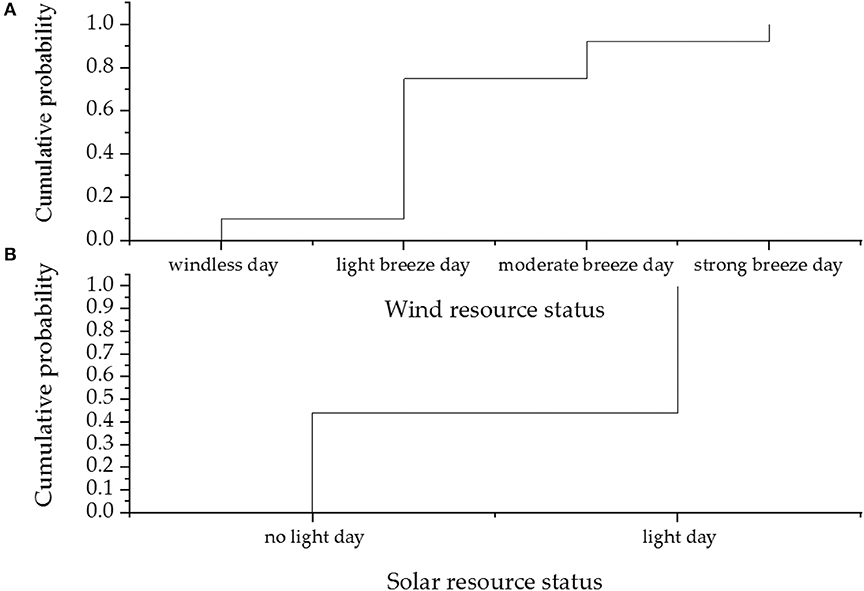
Figure 6. Cumulative probability distribution map of wind and solar resources.
Secondly, two random numbers with uniform distribution from 0 to 1 are generated separately as random values of the cumulative probability of wind and solar resources. Based on the cumulative probability distribution of wind and solar resources, the wind and solar resources of a certain day were determined. Thirdly, according to the typical daily output curve of wind and solar power generation, combined with the division standard of four seasons in Guangdong Province, the output of wind power and solar power generation is obtained 1 day. Finally, this paper repeats the above process until a year of wind and solar output are simulated. We further calculate the correlation coefficient between power output and load. Simulation results are shown in Figures 7, 8.
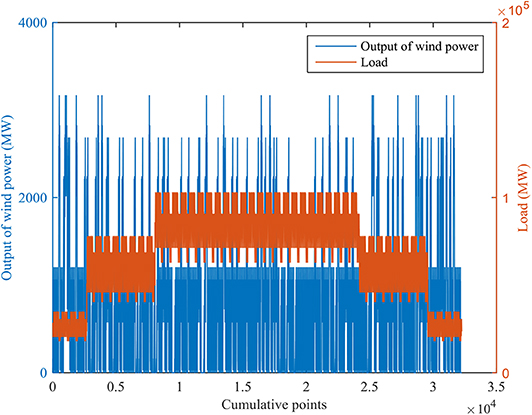
Figure 7. Relationship between Wind Power output and load.
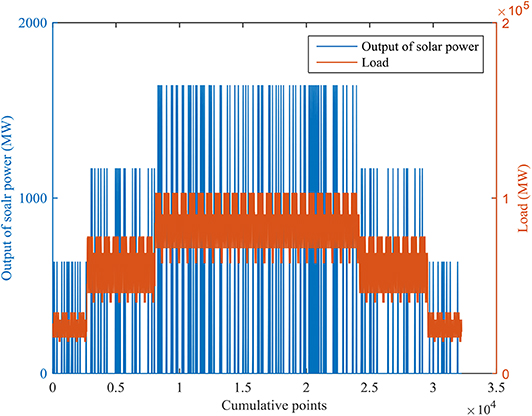
Figure 8. Relationship between Solar Power output and load.
Simulation results in Figures 7, 8 show that the correlation coefficient between wind power output and load is −0.05, and the correlation coefficient between solar power output and load is 0.29. Indicates that there is a slightly negative correlation between wind power output and load, while the solar power output is positively correlated with the load. This is due to the high output of wind power at night and the low output during the day. While the solar power generation reached the peak output at noon, which is consistent with the peak of the power load. Therefore, the peak shaving effect of solar energy has certain guiding significance for maintaining the safe and stable operation of the power system.
Conclusions and Policy Implications
This paper constructs an electricity market clearing model through the merit order method based on the short-term marginal cost increment principle and the generating unit commitment constraints. Further, the historical data in Guangdong is used to simulate different scenarios in a market-oriented situation to discuss the economics of wind and solar power.
The paper found that under market condition, it effectively promote accommodation of wind and solar energy, and significantly mitigate the serious problem of wind and solar curtailment. However, due to local conditions, coal power is cleared in most cases, and gas power is cleared in a few cases. The LCOE of renewable energy is much higher than the marginal cost of coal power. In such market clearing prices, renewable energy is unprofitable and uneconomic in market scenario compared to the benchmark FIT scenario. Hence, when the clearing price is settled, wind and solar power cannot recover the cost, resulting in the uneconomic results. This is due to the high cost of renewable energy on the one hand, and the lack of subsidy policy support under market conditions on the other hand. Therefore, the continued support policy is required to make renewable energy competitive in the energy market. On the one hand, it is of glorious significance to transfer FIT to FIP. For FIP, the fixed premium subsidies or floating premium subsidies should be implemented according to the technological development maturity. Specifically, it is recommended to adopt a fixed premium subsidy for renewable energy generation with relatively mature technologies such as solar photovoltaic and onshore wind power, while floating premium subsidies are recommended for emerging power generation technologies such as offshore wind power. On the other hand, measures needed to be taken to reduce renewable energy costs from technological and non-technological aspects. First, it is imperative to accelerate technological innovations of renewable energy due to its fundamental role in the long-term reduction of cost. Second, an inventory of non-technological costs should be formulated to regulate related operations and control total cost. The non-technological costs are the investment except the part into facilities, which is expected to be the key source of cost reduction for renewable energy in the future. It is necessary to clarify the management body, the division of responsibilities and related standards for non-technical costs, to provide a legal system for the development of renewable energy. Currently, the government is supposed to clearly define the category of the land occupied by wind farms or solar stations as soon as possible, along with the corresponding standards of land acquisition compensation and taxes, which should be strictly enforced under effective supervision.
In addition, the results show that the economics of renewable energy generation is closely related to the change of coal price and power load under the condition of marketization. Both the coal price and power load have a positive effect on the economics of renewable energy generation. The main reason is that the increase in coal price and load will raise the market's clearing price, which will enhance the economic efficiency of renewable energy generation. In particular, the influence of coal price on the economics of wind power is more significant than that of solar energy. The effect of power load on the economics of solar power is more significant compared to wind power.
Data Availability Statement
All datasets generated for this study are included in the article/Supplementary Material.
Author Contributions
WL designed this research and wrote this paper. XZ and YW conducted the simulation. SF prepared data and revised this paper.
Funding
This study was funded by National Planning Office of Philosophy and Social Science (Grant No. 15ZDB165).
Conflict of Interest
The authors declare that the research was conducted in the absence of any commercial or financial relationships that could be construed as a potential conflict of interest.
Acknowledgments
The authors would like to thank the referees and the editor of this journal for valuable comments.
Supplementary Material
The Supplementary Material for this article can be found online at: https://www.frontiersin.org/articles/10.3389/fenrg.2020.00098/full#supplementary-material
Footnotes
1. ^The 100 MW wind power units and 50 MW solar power units are mainstreams of renewable energy installation in Guangdong Province.
2. ^Detailed calculation data are provided upon request. This is true for all results presented in this paper.
3. ^Data Sources: National Electricity Price Supervision Report[R] (2016).
4. ^Data sources: China Southern Power Grid.
5. ^There is no seasonal difference between spring and autumn seasons in Guangdong. In addition, the electricity load and consumption of the spring and autumn are basically similar according to the statistics. Therefore, seasonal factors are divided into three categories: spring and autumn, summer, winter.
6. ^Data Sources: National Electric Power Industry Statistics Express (2017).
7. ^National Development and Reform Commission Price Monitoring Center: http://jgjc.ndrc.gov.cn/zgdmjgzs.aspx?clmId=syjgzs6
References
Abdelhady, S., Borello, D., and Shaban, A. (2018). Techno-economic assessment of biomass power plant fed with rice straw : sensitivity and parametric analysis of the performance and the LCOE. Renew. Energy 115, 1026–1034. doi: 10.1016/j.renene.2017.09.040
Aldersey-williams, J., Broadbent, I. D., and Strachan, P. A. (2019). Better estimates of LCOE from audited accounts – a new methodology with examples from United Kingdom o ff shore wind and CCGT. Energy Policy 128, 25–35. doi: 10.1016/j.enpol.2018.12.044
Bazilian, M., Onyeji, I., Liebreich, M., MacGill, I., Chase, J., Shah, J., et al. (2013). Re-considering the economics of photovoltaic power. Renew. Energy 53, 329–338. doi: 10.1016/j.renene.2012.11.029
Bhandari, R., and Stadler, I. (2009). Grid parity analysis of solar photovoltaic systems in Germany using experience curves. Sol. Energy 83, 1634–1644. doi: 10.1016/j.solener.2009.06.001
Branker, K. M., Pathak, J. M., and Pearce, J. M. (2011). A review of solar photovoltaic levelized cost of electricity. Renew. Sustain. Energy Rev. 15, 4470–4482. doi: 10.1016/j.rser.2011.07.104
Bruck, M., Sandborn, P., and Goudarzi, N. (2018). A levelized cost of energy (LCOE) model for wind farms that include power purchase agreements (PPAs). Renew. Energy 122, 131–139. doi: 10.1016/j.renene.2017.12.100
Cheng, C. (2018). Reform and renewables in China : the architecture of Yunnan's hydropower dominated electricity market. Renew. Sustain. Energy Rev. 94, 682–693. doi: 10.1016/j.rser.2018.06.033
Cheong, T. S., Li, V. J., and Shi, X. (2019). Regional disparity and convergence of electricity consumption in China: a distribution dynamics approach. China Econ. Rev. 58:101154. doi: 10.1016/j.chieco.2018.02.003
Geissmann, T. (2017). A probabilistic approach to the computation of the levelized cost of electricity. Energy 124, 372–381. doi: 10.1016/j.energy.2017.02.078
Geng, J., Xu, F., Yao, J., Gao, Z., Ding, Q., Yang, Z., et al. (2009). Performance analysis of mixed-integer programming based algorithm for security constrained unit commitment. Autom. Electr. Power Syst. 33, 24–27. doi: 10.7500/AEPS200906096
Ji, Q., and Zhang, D. (2019). How much does financial development contribute to renewable energy growth and upgrading of energy structure in China? Energy Policy 128, 114–124. doi: 10.1016/j.enpol.2018.12.047
Jia, L., Dayong, Z., Jing, C., and John, D. (2019). Legal systems, national governance and renewable energy investment: evidence from around the world. Br. Manag. J. 1–32. doi: 10.1111/1467-8551.12377
Lerch, M., De-prada-gil, M., Molins, C., and Benveniste, G. (2018). Sensitivity analysis on the levelized cost of energy for fl oating o ff shore wind farms. Sustain. Energy Technol. Assessments 30, 77–90. doi: 10.1016/j.seta.2018.09.005
Li, H., Yu, Y., Xie, Y., and Zhang, J. (2016). Could wind and PV energies achieve the grid parity in China until 2020? Filomat 30, 4173–4189. doi: 10.2298/FIL1615173L
Limmanee, A., Songtrai, S., and Udomdachanut, N. (2017). Degradation analysis of photovoltaic modules under tropical climatic conditions and its impacts on LCOE. Renew. Energy 102, 199–204. doi: 10.1016/j.renene.2016.10.052
Ling-zhi, R., Xin-gang, Y., Xin-xuan, Z., and Yu-zhuo, Z. (2018). Cost-benefit evolution for concentrated solar power in China. J. Clean Prod. 190, 471–482. doi: 10.1016/j.jclepro.2018.04.059
Liu, S., Yang, Q., Cai, H., Yan, M., Zhang, M., and Wu, D. (2019). Market reform of yunnan electricity in southwestern China : practice, challenges and implications. Renew. Sustain. Energy Rev. 113:109265. doi: 10.1016/j.rser.2019.109265
Liu, W., Zhang, X., and Feng, S. (2019). Does renewable energy policy work? Evidence from a panel data analysis. Renew. Energy 135, 635–642. doi: 10.1016/j.renene.2018.12.037
Lu, S.-D., Wang, M.-H., Kuo, M.-T., Tsou, M.-C., and Liao, R.-M. (2019). optimal unit commitment by considering high penetration of renewable energy and ramp rate of thermal units-A case study in Taiwan. Appl. Sci. 9:421. doi: 10.3390/app9030421
Luo, Y., Du, X., Yang, L., Xu, C., and Amjad, M. (2017). Impacts of solar multiple on the performance of direct steam generation solar power tower plant with integrated thermal storage. Front. Energy 11, 461–471. doi: 10.1007/s11708-017-0503-5
Mulligan, C. J., Bilen, C., Zhou, X., Belcher, W. J., and Dastoor, P. C. (2015). Levelised cost of electricity for organic photovoltaics. Sol. Energy Mater. Sol. Cells 133, 26–31. doi: 10.1016/j.solmat.2014.10.043
Ngan, H. W. (2010). Electricity regulation and electricity market reforms in China. Energy Policy 38, 2142–2148. doi: 10.1016/j.enpol.2009.06.044
Qiuna, C., Fushuan, W., Yusheng, X., and Jianbo, X. (2012). An SCUC-based optimization approach for power system dispatching with plug-in hybrid electric vehicles. Autom. Electr. Power Syst. 36, 38–46. doi: 10.3969/j.issn.1000-1026.2012.01.008
Said, M., EL-Shimy, M., and Abdelraheem, M. A. (2015). Photovoltaics energy: improved modeling and analysis of the levelized cost of energy (LCOE) and grid parity - Egypt case study. Sustain. Energy Technol. Assessments 9, 37–48. doi: 10.1016/j.seta.2014.11.003
Sarasa-Maestro, C., Dufo-López, R., and Bernal-Agustín, J. (2019). Evaluating the effect of financing costs on PV grid parity by applying a probabilistic methodology. Appl. Sci. 9:425. doi: 10.3390/app9030425
Su, J., Zhou, L., and Li, R. (2013). Cost-benefit analysis of distributed grid-connected photovoltaic power generation. Zhongguo Dianji Gongcheng Xuebao/Proc. Chin. Soc. Electr. Eng. 33, 50–57. doi: 10.13334/j.0258-8013.pcsee.2013.34.001
Tran, T. T., and Smith, A. D. (2018). Incorporating performance-based global sensitivity and uncertainty analysis into LCOE calculations for emerging renewable energy technologies. Appl. Energy 216, 157–171. doi: 10.1016/j.apenergy.2018.02.024
Ueckerdt, F., Hirth, L., Luderer, G., and Edenhofer, O. (2013). System LCOE: what are the costs of variable renewables? Energy 63, 61–75. doi: 10.1016/j.energy.2013.10.072
Wang, Q., and Chen, X. (2012). China's electricity market-oriented reform : from an absolute to a relative monopoly. Energy Policy 51, 143–148. doi: 10.1016/j.enpol.2012.08.039
Wang, Y., Zhang, D., Ji, Q., and Shi, X. (2020). Regional renewable energy development in China: a multidimensional assessment. Renew. Sustain. Energy Rev. 124:109797. doi: 10.1016/j.rser.2020.109797
Yu, Z. (2020). Beyond the state / market dichotomy : institutional innovations in China's electricity industry reform. J. Environ. Manage. 264:110306. doi: 10.1016/j.jenvman.2020.110306
Zang, G., Jia, J., Tejasvi, S., Ratner, A., and Silva, E. (2018). International journal of greenhouse gas control techno-economic comparative analysis of biomass integrated gasi fi cation combined cycles with and without CO 2 capture. Int. J. Greenh. Gas Control 78, 73–84. doi: 10.1016/j.ijggc.2018.07.023
Zeng, M., Yang, Y., Wang, L., and Sun, J. (2016). The power industry reform in China 2015 : policies, evaluations and solutions. Renew. Sustain. Energy Rev. 57, 94–110. doi: 10.1016/j.rser.2015.12.203
Keywords: renewable energy, marketization, clearing price, LCOE, economic analysis
Citation: Liu W, Zhang X, Wu Y and Feng S (2020) Economic Analysis of Renewable Energy in the Electricity Marketization Framework: A Case Study in Guangdong, China. Front. Energy Res. 8:98. doi: 10.3389/fenrg.2020.00098
Received: 31 December 2019; Accepted: 05 May 2020;
Published: 10 June 2020.
Edited by:
Dayong Zhang, Southwestern University of Finance and Economics, ChinaReviewed by:
Jiangbo Geng, Zhongnan University of Economics and Law, ChinaJiasha Fu, Southwestern University of Finance and Economics, China
Copyright © 2020 Liu, Zhang, Wu and Feng. This is an open-access article distributed under the terms of the Creative Commons Attribution License (CC BY). The use, distribution or reproduction in other forums is permitted, provided the original author(s) and the copyright owner(s) are credited and that the original publication in this journal is cited, in accordance with accepted academic practice. No use, distribution or reproduction is permitted which does not comply with these terms.
*Correspondence: Xingping Zhang, zxp@ncepu.edu.cn