Active Tectonics and Earthquake Geology Along the Pallatanga Fault, Central Andes of Ecuador
 Stéphane Baize1*
  Laurence Audin2
  Alexandra Alvarado3
  Hervé Jomard1 Mathilde Bablon4,5
  Johann Champenois1
  Pedro Espin3
  Pablo Samaniego6
  Xavier Quidelleur4
  Jean-Luc Le Pennec6
- 1BERSSIN, Institut de Radioprotection et de Sûreté Nucléaire, Fontenay-aux-Roses, France
- 2ISTerre, IRD-CNRS-OSUG, Université de Grenoble, Saint-Martin-d’Hères, France
- 3Instituto de Geofísica, Escuela Politécnica Nacional, Quito, Ecuador
- 4GEOPS, Université Paris-Sud, CNRS, Université Paris-Saclay, Orsay, France
- 5Géoazur, IRD-CNRS-OCA, Université Côte d’Azur, Sophia Antipolis, France
- 6Laboratoire Magmas et Volcans, IRD-CNRS-OPGC, Université Clermont Auvergne, Clermont-Ferrand, France
Based on new geological data and the analysis of a 4 m spatial resolution Digital Elevation Model (DEM), we provide a detailed and comprehensive description of section of the Chingual Cosanga Pallatanga Puna Fault System, a major active fault system in Ecuador. This work allows estimating new slip rates and large earthquakes parameters (displacement, recurrence) along a ∼100 km-long section of the continental-scale dextral shear zone that accommodates the extrusion of the North Andean Sliver with respect to the South America continental Plate. We focus on the NE-SW Pallatanga strike-slip fault zone and related contractional and transcurrent features that extend to the north in the Inter-Andean valley and the Cordillera Real, respectively. The detailed analysis of the available DEM allowed mapping a series of lineaments at the regional scale and along the entire fault system. Field studies on key areas show valley deflections, aligned and elongated hills of Tertiary or Quaternary sediments, as well as faulted Holocene deposits and even preserved coseismic free-face ruptures in some places. Such morphological anomalies strongly suggest that those landscape scars represent long-living (Holocene to historical times) earthquake faults. Altogether, these new data confirm that very large crustal earthquakes (M∼7.5) have been generated along the fault system, probably during multiple segment ruptures. This conclusion agrees with reports of large earthquakes during historical times (post-1532 CE) in 1698, 1797, and 1949. They all occurred in the vicinity of the Pallatanga fault, causing catastrophic effects on environmental and cultural features. Based on new sample dating of both soils and volcanic series, we infer that the NE-SW dextral Pallatanga fault slips at rates ranging from ∼2 to 6 mm/yr for southern and central strands of the studied area, respectively. Further north, surface faulting is distributed and the deformation appears to be partitioned between sub-meridian fault-related folds (∼2 mm/yr) and NE-SW strike-slip fault(s), like the ∼1 mm/yr Pisayambo Fault that ruptured the surface in 2010. All this information offers the opportunity to size the earthquake sources for further seismic hazard analyses.
Introduction
Earthquake hazard analyses in continental areas, especially those with sustained seismic activity, are based on fault models supported by detailed studies of active faults (e.g., Field et al., 2014). Those studies classically use fault maps improved after field surveys and paleoseismological data to delineate the active structures and their complexities, the size and recurrence of earthquakes, and the long-term rate of fault slip. Where data is sufficiently reported, it is possible to determine the fault segmentation, i.e., fault sections that behave more or less as independent earthquake sources and that can be treated as such in seismic hazard analyses (DuRoss et al., 2016). In Central Ecuador, the geological knowledge is not achieved yet to support such an approach for hazard purposes, and faults have to be considered as homogenous sources in terms of earthquake production. To date, Beauval et al. (2018) produced the hazard calculation for the entire country, defining a fault model with first-order fault geometries and earthquake parameters. In fact, they only considered two distinct simplified source faults (Pallatanga and Latacunga faults), named according to the surrounding cities (Figure 1) settled in between the Western Cordillera and the Eastern Cordillera. In this work, their slip rates were derived from Global Navigation Satellite System (GNSS) velocity field (Nocquet et al., 2014). In their model, a massive part of the relative motion between the North Andean Sliver and the South American Plate is accommodated by the Pallatanga fault (PF) to which a ∼7 mm/yr slip rate is assigned, when field data only provide ∼2–5 mm/yr (Winter et al., 1993; Baize et al., 2015, respectively). This approach is relevant for national scale hazard estimation, but it could be significantly misleading for site-specific approaches nearby the fault sources.
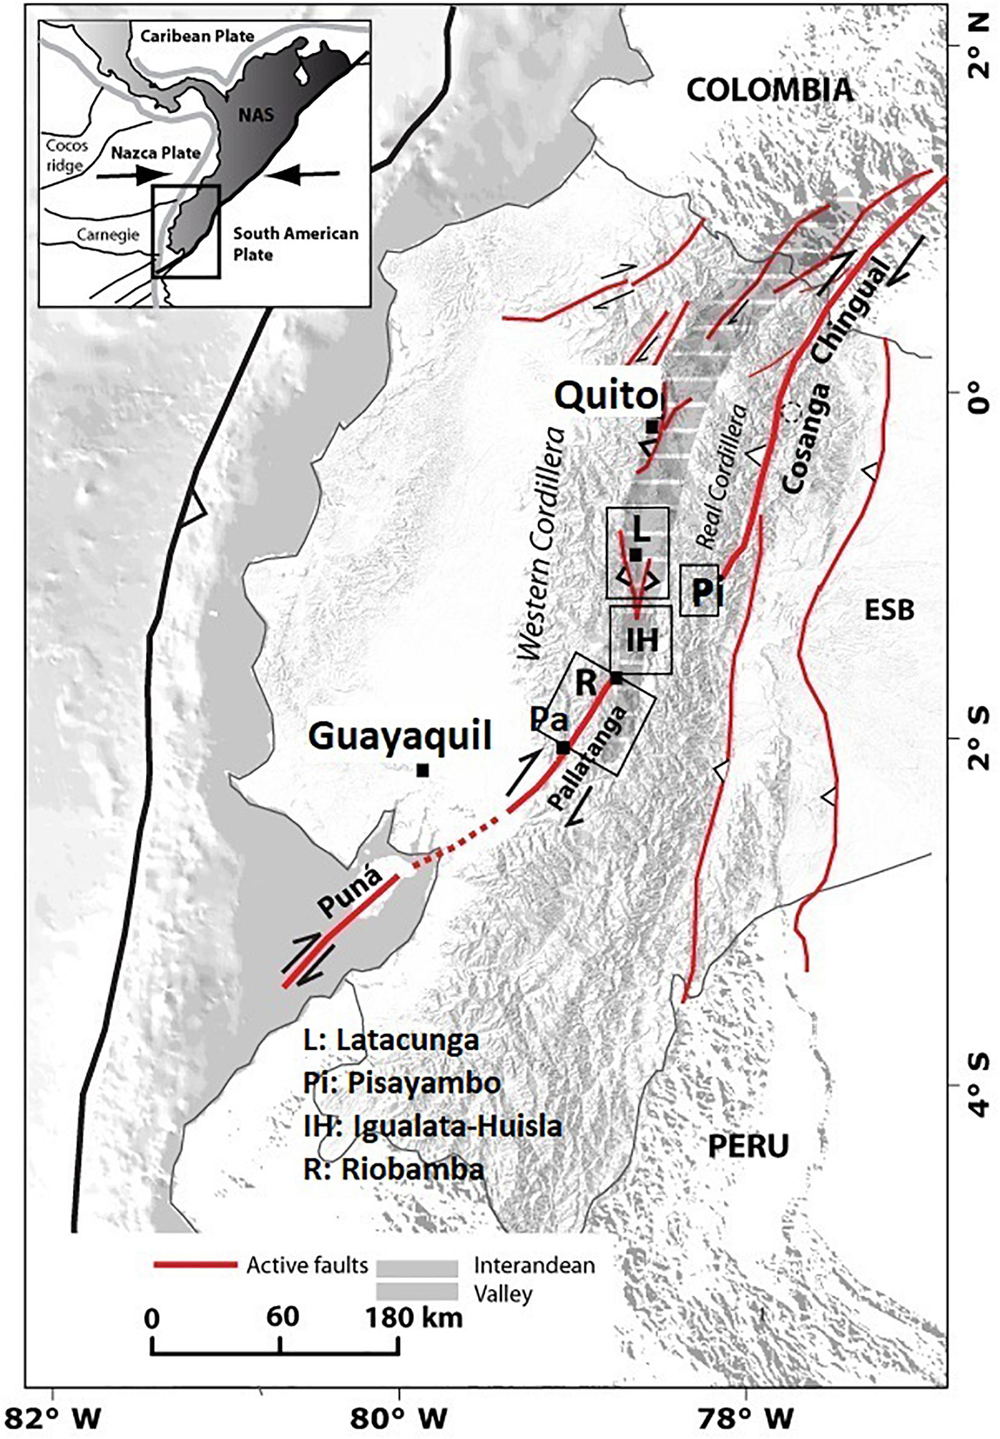
Figure 1. Location of the investigated area in its tectonic context. Upper left inset gives a general geodynamic overview illustrating the major role of the CCPP (Chingual Cosanga Pallatanga Puna) fault zone acting as a boundary between the South America Plate and the North Andean Sliver (NAS) (Modified from Alvarado et al., 2016) in gray. The major active faults are the bold red lines; the investigated sectors are the Pallatanga fault north of Pallatanga (Pa) and south of Riobamba (R), the fault segments cutting the Igualata and Huisla volcanoes (IH) and the fault continuation around the Laguna Pisayambo (Pi) and the fault-related folds nearby Latacunga (L). (I) is Ibarra. The offshore bold line represents the subduction trench location, more than 100 km west of the Puna segment fault. ESB: Eastern Subandean Belt.
The aim of this contribution is to provide an updated active tectonics and earthquake geology knowledge in the Central Ecuador Andes, which could be used in an ad hoc approach of fault modeling in order to cover a range of earthquake ruptures scenarios (e.g., Chartier et al., 2019). We focused on a 100 km-long and ∼20 km-wide area covering a section of the fault zone that delineates the eastern margin of the NNE-moving North Andean Sliver (Figure 1) and which has been defined as the Chingual Cosanga Pallatanga Puna Fault System (CCPP; Nocquet et al., 2014; Alvarado et al., 2016; Yepes et al., 2016) between Colombia to the Pacific Ocean. The new evidences of earthquake ruptures are supported by morphological and geological observations performed during five field campaigns around the Riobamba region (Central Ecuador; Figure 1). In the frame of the geodynamics and active tectonics of the Northern Andes of Ecuador, we present our major findings based on morphological analysis of a 4 m-high resolution Digital Elevation Model (DEM) and field investigations. We propose a revised fault map and derive our observations in terms of slip rates (dislocation of dated features or separation of landscape features), earthquake recurrences and magnitudes, which are crucial parameters of geological-based seismic hazard analyses. Here, we will particularly focus on the Riobamba area (R), the Igualata-Huisla volcanoes (IH), the Pisayambo region (P), and the Latacunga zone (L) (Figure 1).
General Background
Crustal Structure
Imaging the crust in Ecuador has been challenging for years. A new model has been recently proposed for the whole country (Font et al., 2013; Araujo, 2016; Vaca et al., 2019), and allowed relocation of earthquake events, including at depth. Based on an inversion of arrival times of more than 45,000 seismic events spanning more than 20 years of seismicity, Araujo (2016) proposes a new seismic tomography imaging the subducted slab and the overriding crust. The Andean Cordilleras are characterized by an over-thickened crust above a Moho discontinuity that is imaged between 50 and 60 km deep. The intense crustal seismic activity in the last 20 years is focused around the active volcanoes, as well as the active tectonic structures such as the Quito-Latacunga fault-related fold system and the CCPP shear zone (Figure 1). This seismicity is clustered in the first 20–30 km according to Araujo (2016) and, consistently, the analysis of seismicity depth from the Beauval et al. (2013) catalog document, 90% of the seismicity surrounding the PF and the Quito-Latacunga fold system (in a 20 km radius) is located between 0 and 30 km at depth.
Bedrock and Quaternary Geology
The study area is part of the Ecuadorian Andes that extends north-south between the coast and the Amazon lowlands. From west to east, it covers various geological units: (1) the Western Cordillera that corresponds to oceanic terranes and its related sediments, which have been accreted during phases of Caribbean Plateau and South America Plate convergence (Cretaceous-Eocene; Hughes and Pilatasig, 2002; Vallejo et al., 2006; Jaillard et al., 2009; Pindell and Kennan, 2009); (2) a narrow (max. 30 km) and 300 km long NS structural depression at 2,000–3,000 m of elevation (IAV) where part of the volcanic arc is lying and where Miocene to Holocene deposits are accumulated (Hall et al., 2008; Jaillard et al., 2009; Bablon et al., 2019), and (3) the Cordillera Real, culminating at ∼4,500 m a.s.l, a sequence of Paleozoic to Cretaceous basement rocks of the South America Plate (Aspden and Litherland, 1992; Spikings and Crowhurst, 2004). These large-scale structural units are obliquely cut by the CCPP, which initiates in the Guayaquil Gulf and the coastal plain, penetrates the Western Cordillera, then cuts the IAV and the Cordillera Real to finally merge the CF (Figure 1).
The various active and potentially active volcanic centers of Central Ecuador are mainly andesitic. Most of them are located along the margins of the IAV, either on the Western one (e.g., Chimborazo, Iliniza, Guagua Pichincha) or the Eastern one (e.g., Tungurahua, Cotopaxi, Antisana, Cayambe). Few are lying within the IAV (e.g., Igualata, Huisla, Imbabura). The highest areas of the Andes, including volcanic peaks, have hosted ice glaciers during the Quaternary. During the Late Glacial Maximum, roughly between 33 and 14 ka (e.g., Clapperton, 1990), the large expansion of the glaciers from the Chimborazo and Carihuairazo volcanoes toward the valleys left moraines down to an elevation of 3400–3600 m above sea level. During the very late cold phase (Younger Dryas, around 10–12 ka), the glaciers did not reach these relative low elevations and preserved moraines are found at around ∼4000 m (Samaniego et al., 2012). During the Holocene, thick organic soils, referred as andisols, have developed.
Seismicity and Geodynamical Setting
Seismotectonic activity in Ecuador is dominated by the subduction of the Nazca plate below the South American plate. Subduction-related megathrust earthquakes, such as the April 2016 Mw = 7.8 Pedernales event, constitute the most frequent and significant contribution to the seismic hazard, in terms of expected seismic ground motion. However, severe shallow and crustal earthquakes destroyed large cities of Ecuador around the CCPP, and especially the PF (Figure 3), according to Beauval et al. (2010). The most significant event occurred in 1797 close to the current location of Riobamba, causing the collapse of most of the buildings, widespread, landsliding, ground fissuring and probably surface faulting (see Baize et al., 2015 and evidences in this paper). Epicentral intensity (Io) is estimated to XI degree, MSK scale, and equivalent moment magnitude calculated from macroseismic data to Mw = 7.6 (Beauval et al., 2013). One century earlier (1698), the city of Ambato and surroundings were ravaged (Io = IX MSK; Mw = 7.2; Beauval et al., 2013), with huge landslides along the Carihuairazo slopes. The third big event in the case study area hit the city of Pelileo in 1949 close to the PF trace (Io = X; Mw = 6.4; Beauval et al., 2013), with extensive landsliding as well. During those catastrophic three events (each causing thousands of fatalities), the cities were razed to the ground, and displaced further.
Until the late 1970s, the seismicity of Ecuador has been monitored by international networks. Then, the national network (RENSIG) was developed, acquiring its actual level of sensitivity in 2011. Recently, Font et al. (2013) and Araujo (2016) relocated events for the 19882016 period, pointing out the following characteristics of the CCPP fault system. Seismicity is mainly concentrated in the first 20–30 km of the continental crust, although some earthquakes also occur as deep as 60 km within the over-thickened crust of the Andes. The surficial trace of the CCPP is highlighted by the recorded seismicity, despite several sections have few events only. The area also encompasses clusters of persistent seismicity like the Pisayambo swarm. The 06/03/1987 Reventador earthquake sequence includes the largest crustal earthquake recorded in Ecuador (Mw = 7.1) that occurred within a restraining bend of the CCPP (Tibaldi et al., 1995). Besides, very few events of M > 4 were recorded along the CCPP and, according to Araujo (2016), the Pisayambo cluster is actually the major source of seismic energy release, with its strongest event being the Mw∼5.0 (26/3/2010) which caused a surface rupture on a CCPP segment (Champenois et al., 2017).
Vaca et al. (2019) provide new focal mechanisms of earthquakes within the 2009–2015 time span, based on seismic velocity structure and data from the Ecuadorian broadband seismic network. In the area comprised between Pallatanga (Pa) and the Pisayambo (Pi) area (Figure 1), focal mechanisms of low-moderate magnitude (Mw 3.3–5.4) events cover a range of transcurrent and thrust motions, confirmed for the two largest events of the region (1949 Pelileo, 1987 Reventador) (Figure 3). This transpressive regime deduced from earthquakes is coherent with the mean horizontal strain tensor that they determined from the GPS velocity field. In their calculation, the principal compressional stress is N°70E oriented, in agreement with long-term (Pleistocene-Holocene) fault kinematics (Alvarado et al., 2016). In Figure 3, we provide the GPS data available for the enlarged area of interest (Nocquet et al., 2014), illustrating the right-lateral transcurrent regime around the CCPP.
The CCPP Fault System may have started to be active after 3 Ma according to offshore data in the Guayaquil Gulf (Deniaud et al., 1999; Dumont et al., 2005a, b; Witt et al., 2006), cutting obliquely across the accreted terranes and related N-S structures of the Ecuadorian Andes (Alvarado et al., 2016). Transpressive deformation regime accompanies a north-eastward motion of North Andean Sliver along the CCPP. The obliquity between the Nazca Plate and the South America Plate convergence vector (6 cm/yr according to Kendrick et al., 2003) and the trench direction is thought to be the reason of the deformation partitioning and inland shearing along the CCPP (Alvarado et al., 2016). GNSS measurements show that this wide and large shear zone accommodates around 7–9 mm/yr between the North Andean Sliver and the stable South America Plate (Nocquet et al., 2014). In their tectonic model, Alvarado et al. (2016) describe a Quito-Latacunga Microblock in the IAV with diffuse active faults and seismic activity west of the merging of the NNE-SSW-striking Pallatanga fault (PF) and N-S striking Cosanga fault (CF; Figure 1).
Materials and Methods
The active shallow structures of concern have been first investigated as soon as the 1990s (e.g., Soulas et al., 1991; Winter et al., 1993; Lavenu et al., 1995). These pioneer studies came out with significant slip rates (>1 mm/yr), raising questions on the seismic hazard they pose to the region. During the last decade, the franco-ecuadorian team (“Laboratoire Mixte International Séismes et Volcans des Andes du Nord”)1 launched new research that combine seismology, geodesy and geology (e.g., Font et al., 2013; Alvarado et al., 2014, 2016; Champenois et al., 2014, 2017; Nocquet et al., 2014, 2016; Baize et al., 2015) and consolidated the seismotectonic model (Yepes et al., 2016) at the national scale.
In this paper, we present the results of a part of this broad project, after developing geomorphological and geological data from DEM analysis and field observations. This work provides an accurate map of active faults and in places yields hints on slip rate values. Starting from the neotectonic map (Alvarado, 2012), we developed our efforts in the area covering the fault zone between 0.8 and 1.8°S along a ∼20 km-wide and NE-SW-striking band (Figure 3), where the tectonic map is almost “blank” (R, IH, P sectors; Figure 1), and where strain is suspected to split between both dominantly NE-SW to NNE-SSW strike-slip strands and N-S compressional fault-related folds. The study area extends between the cities of Pallatanga to the South and Latacunga to the North. In the Ecuadorian Andes, mapping of active faults and folds is a difficult task because of morphoclimatic conditions, especially at low elevations (below c. 2500 m a.s.l.), where steep slopes and rainfall favor dense forest and gravitational instability. At high elevation, where farming is absent (>3800 m a.s.l.), morphologic features are often well preserved and can be revealed by DEM and field analyses, but their accessibility can be limited because of rare tracks and toughness of hiking over large distances at high elevations. To obtain the most complete picture over the 1000 km2 zone, we performed the morphotectonic analysis of a 4 m pixel-resolution DEM (Proyecto SIGTIERRAS)2 draped over the geological maps (Longo and Baldock, 1982). Field data were acquired during five 2 weeks campaigns between 2009 and 2016 at key areas.
Like in classical preliminary analyses, we looked for morphological features, their alignment and continuity of lineaments to delineate fault strands. The fault portions could be traced and characterized thanks to a wide panel of features that constitute the classic landform assemblage of active strike–slip faults (McCalpin, 2009), such as pressure or shutter ridges, sag-ponds, terrace risers or entrenched thalweg deflections, cumulative scarps that cause vertical shifts of regular surfaces (lava flows, alluvial terraces, hillslopes, etc…), and free-face scarps.
Potential active fault portions were defined based on the continuity, proximity and coherence of the morphological clues, which are, within the IAV, developed in (mostly) volcanic products accumulated in this high-elevation and intra-mountainous basin during the last 800 kyr (Bablon et al., 2019). During the field campaigns, we could check that most of such lineaments were associated with brittle structures in volcanic formations. As an iconic case, we provide the hillshade image of the DEM in the area of the 2009 trenches which revealed the correlation between morphologic features and active faulting (Baize et al., 2015; Figure 2). Other examples are described hereafter.
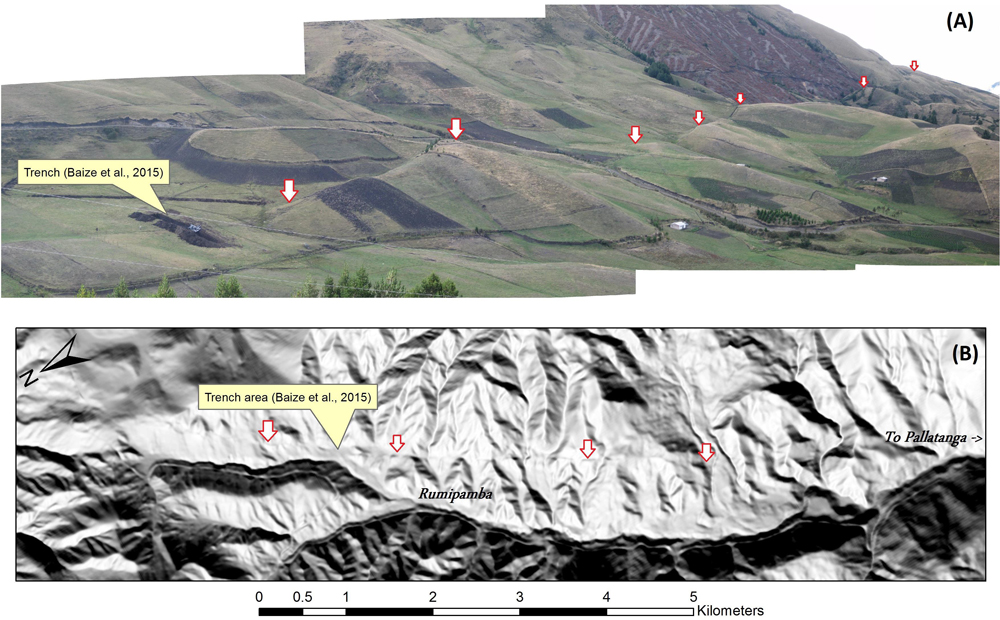
Figure 2. Illustration of the signature of an active portion of the Pallatanga fault on a field panorama (A) and on the corresponding 4 m resolution DEM (B). On the left of the photo in (A), one can observe one of the trenches dug in 2009–2010 and presented in Baize et al. (2015). The fault trace is easily inferred from an uphill-facing and counter-slope scarp, matching a deflection in perpendicular morphological features (channel incisions, ridges). See Figure 3 and Supplementary Figure S8 for location.
The CCPP onset seems to have occurred during the Pliocene – Early Pleistocene (Lavenu et al., 1995). Therefore, we argue that describing the tectonic deformation features within the ubiquitous young (less than 1 Ma old) volcanic material, sedimentary deposits and soils is a proper approach to analyze the Pallatanga fault active tectonics.
Results
Five sectors were investigated along the PF and its transition toward both the CF and the QLF, in terms of long-term (Quaternary) and recent (Holocene to historical earthquake surface ruptures) activity. Those are Rumipamba (R), Riobamba and Igualata/Huisla volcanoes, as well as the Patate river valley (IH), Laguna Pisayambo (P), and Salcedo/Latacunga (L) (Figures 1, 3). Our new mapping in IH area completes and improves those of Baize et al. (2015) and Champenois et al. (2017) on the Rumipamba and Pisayambo areas, respectively. In Supplementary Material, we provide five maps featuring the fault strands layered over the 4 m spatial resolution DEM (Supplementary Figures S6–S11).
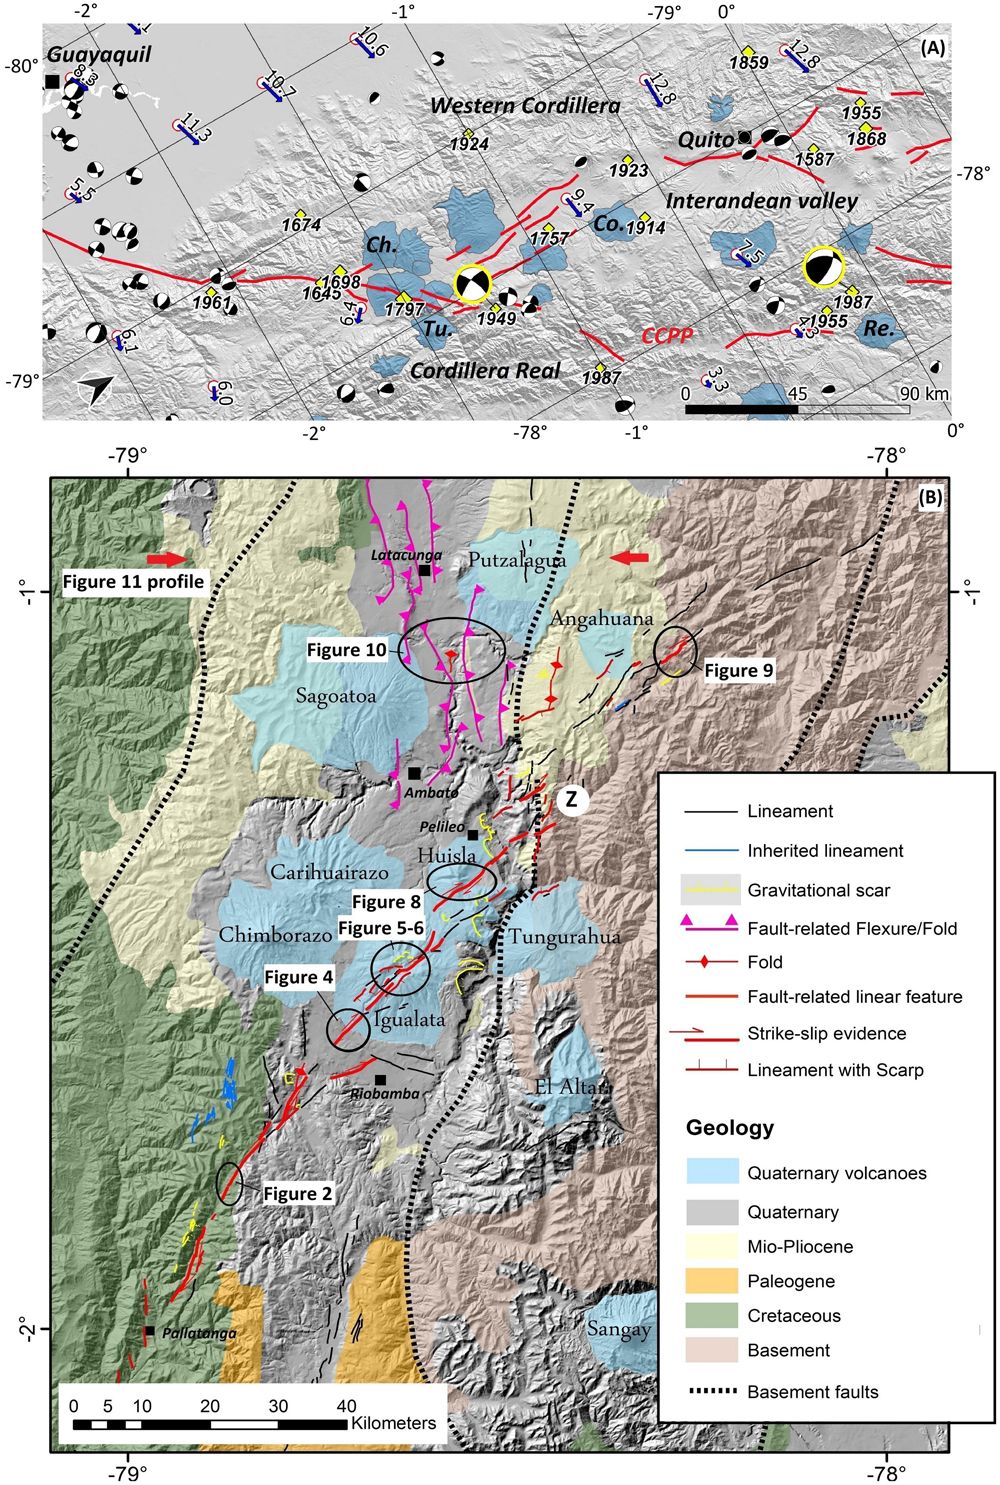
Figure 3. (A) Overview of the seismicity (white dots, epicenters of earthquakes with magnitude above 6, from Beauval et al., 2010) and GPS velocities (blue arrows, from Nocquet et al., 2014) in the area of interest around the CCPP fault segments and IAV fault-related folds (simplified mapping, red lines). Blue footprints are active volcanoes from Bernard and Andrade (2016): Ch., Chimborazo; Tu., Tungurahua; Co., Cotopaxi; Re., Reventador. Focal mechanisms are from Vaca et al. (2019) (magnitude range 3.3–5.4), and focal mechanisms of Ms = 6.8 1949 Pelileo and Mw = 7.2 Reventador earthquakes (circled in yellow) are from Woodward and Clyde Consultant (1981) and Barberi et al. (1988), respectively [reported in Tibaldi et al. (1995)]. (B) Morphotectonic map resulting from the DEM and field work analyses. We define various categories of morphological lineaments: (1) Lineament with scarps are morphological features with a clear recent signature with a vertical separation of the ground surface in Quaternary deposits; (2) Strike-slip evidence are lineaments for which field (or rarely DEM) analysis has shown up the lateral displacement of a recent morphological feature; (3) Pressure ridge are elongated hills that disturb the local morphology, associated with deflection of morphological features; they are suspected to correspond to surface expression of transpressive pop-up structures due to strike-slip faulting at depth; (4) Folds are symmetrical and large-wavelength elongated disturbances of the ground surface and young sediments; (5) Fault-related flexures are asymmetrical disturbances of the surface revealing relative uplifting and subsiding blocks and then potentially corresponding to buried reverse faults. Flexure scarps are locally topped by to symmetrical folds in some places, potentially relating to a lateral component; (6) undistinguished lineaments inferred from DEM are suspected to relate to active faulting but without clear evidence of recent displacement; (7) inherited lineaments are clearly associated with basement structures (shear planes, bedding); major gravitational scars are arcuate features associated with landslides mostly located in the deeply incised Patate and Chambo Rivers’ valleys, some of them having been caused by the 1949 Pelileo earthquake (label Z); others are features associated with deep-seated gravitational slope deformation features. The simplified geological map has been digitized from the National Geological Map of Ecuador (Longo and Baldock, 1982); volcano footprints are from Bernard and Andrade (2016). White boxes locate the zoom-in figures in this paper.
From Pallatanga to Riobamba
All along the 75 km of the fault zone in the Western Cordillera, it is possible to map pervasive NE-SW stepping structural lineaments, defining a rather simple albeit large and well-defined fault trace (Alvarado et al., 2016; Figure 3 and Supplementary Figure S7). While gaining in elevation to the north from the coastal flat zone, morphotectonic features are still very clear. The southernmost trace of our detailed investigation, south of Pallatanga city, is underlined by a series of right-stepping 2–5 km long lineaments with east-facing ∼10 m high scarps (Supplementary Figure S1). North of the city and its wide topographic depression, a continuous trace defines a quite continuous fault section, and the 4 m DEM starts to highlight continuous clues of strike-slip faulting north to the Rumipamba area (Supplementary Figure S8). Note that the area also encompasses remarkable signs of deep-seated gravitational slope deformations at the range crests and many landslide scars (Figure 3). The Rumipamba area reveals the best morphologic features of active strike-slip faulting along the PF (Figure 2 and pictures 2009-1 to 2009-16&17, 2010-18 to 2010-19-2 in Supplementary Material). This is where the first active tectonics investigations were engaged in Central Ecuador, evidencing horizontally and vertically displaced crests and thalwegs, sagponds (Winter et al., 1993), and traces of paleoearthquakes (Baize et al., 2015). Further north, while entering the IAV, the unique and NE-SW fault trace in Rumipamba zone intersects volcanic and volcano-sedimentary Quaternary deposits (Figure 3), and splits into a series of lineaments striking between WSW-ENE and NNE-SSW. Markers suggesting a strike-slip motion encompass pressure ridges, displaced creeks (pictures 2010-56 and 2010-63-1&2, Supplementary Material), and dislocated volcanic deposits within a 2 km-wide band (pictures 2015-56-1&2, Supplementary Material). The traces of fault lines have slightly been revised after Baize et al. (2015) study, to account for later observations (Figure 3 and Supplementary Figure S8).
The Igualata Volcano Area
Previously unknown fault strands are mapped across the Igualata edifice, from its southwest foothills (Figure 4 and pictures 2015-54 to 2015-65-2 in Supplementary Material) to its summit part (Figures 5, 6; pictures 2015-2 to 13), and across the northeast slope toward the Huisla volcano area (Figures 7, 8; picture 2015-41 in Supplementary Material). When looking carefully at the hummocky surface of the Chimborazo-related debris avalanche deposits, south the Igualata volcano and nearby San Andres village, some features present aligned-to-fault strikes, as well as vertical or lateral separations. It is for instance possible to document a NE-SW ridge, perpendicular to the avalanche flow, along which creeks and valley slopes incised in the avalanche deposits are dextrally deflected (e.g., labels A and B, Figure 4) between 60 and 160 m. The Guano lava flow (Figure 4), which is embedded in the San Andres valley, incised in the debris avalanche deposits, is bumped and show apparent vertical and lateral separation in San Andres village. Interestingly, the general course of the deflected creek (at label A, Figure 4) presents a smaller-scale deflection of about 10 m close to a site where we found brittle deformation in sands and soils deposited on the avalanche deposits. We speculate that this latter 10 m offset could be due to the most recent earthquake surface rupture (see hereafter the observations on top of the Igualata volcano). At that specific site, the walls of a mill were damaged (see picture 2015-54 in Supplementary Material). We dated charcoal samples embedded in the mortar of the repairs at 145 ± 30 and 185 ± 30 BP, suggesting that the mill has potentially been damaged then fixed after the M∼7–7.5 1694 or 1797 earthquakes, whose epicenters were close (Beauval et al., 2010).
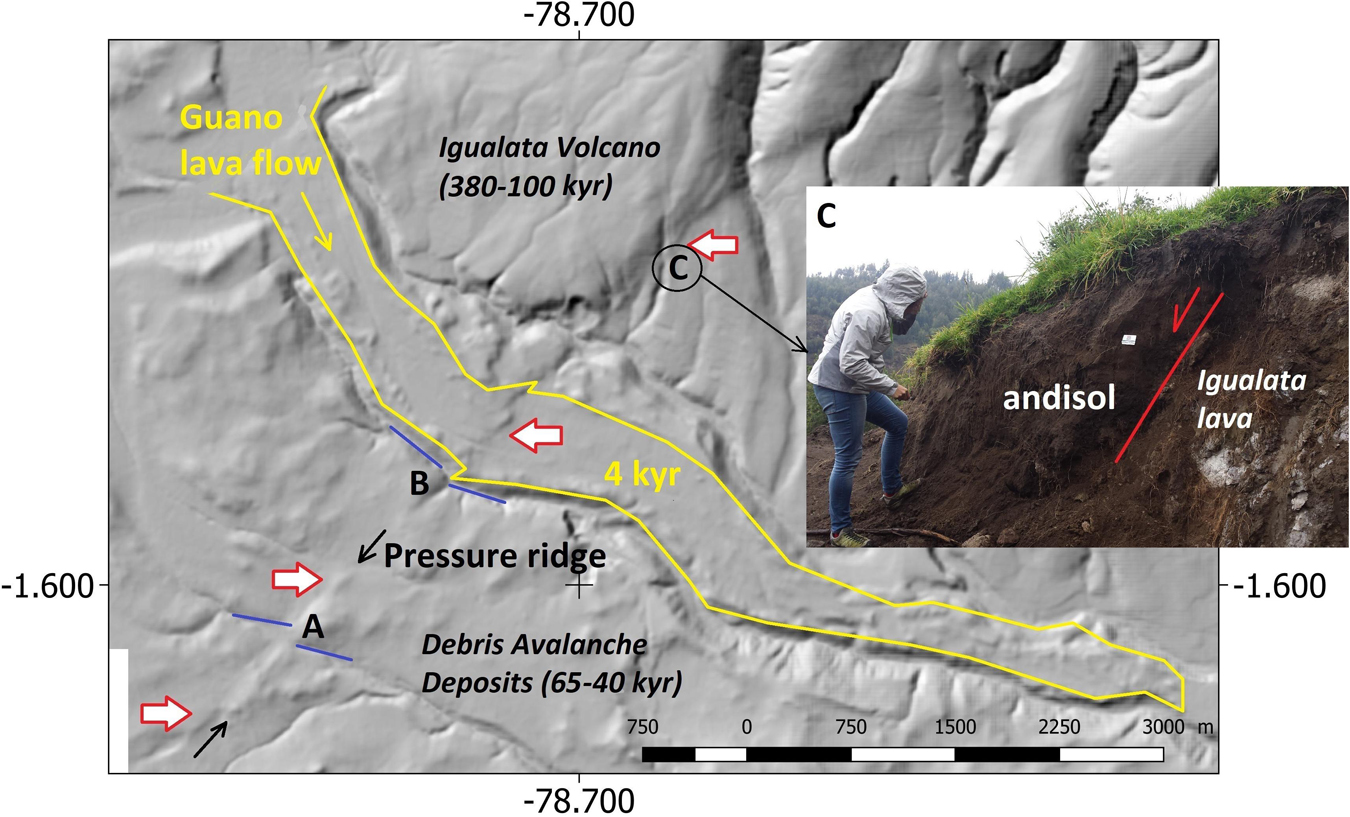
Figure 4. Zoom-in in the San Andres village area. The fault intersects the Pleistocene and Holocene volcanic deposits of the Riobamba basin. From the SW to the NE, we observe first a pressure ridge within the Chimborazo Avalanche Deposits (age poorly constrained, probably around 45 ky) collocated with a lateral deflection (60–120 m) of a incised channel (label A). Second, the San Andres valley, within which the 4 ky old Guano lava flow is emplaced, is also dextrally displaced (label B, 60 m). Finally, the fault trace is inferred by the bumps on top of the Guano lava flow before it cuts the Igualata volcano slopes. Along the volcano slope, there are several places where we can observe horizontal deflections of incised streams and evidences of Holocene soil deformation (label C and insert C; plus pictures 2015-64&65.jpg in Supplementary Material).

Figure 5. Zoom-in of the Igualata center area. The figure highlights several sharp scarps and deflecting lineaments across the covered area, along the red arrows. The figure focuses on the lineament that includes the Figure 6 features and that seems to cause the 160 m right lateral deflection of the major incision (underlined in yellow).
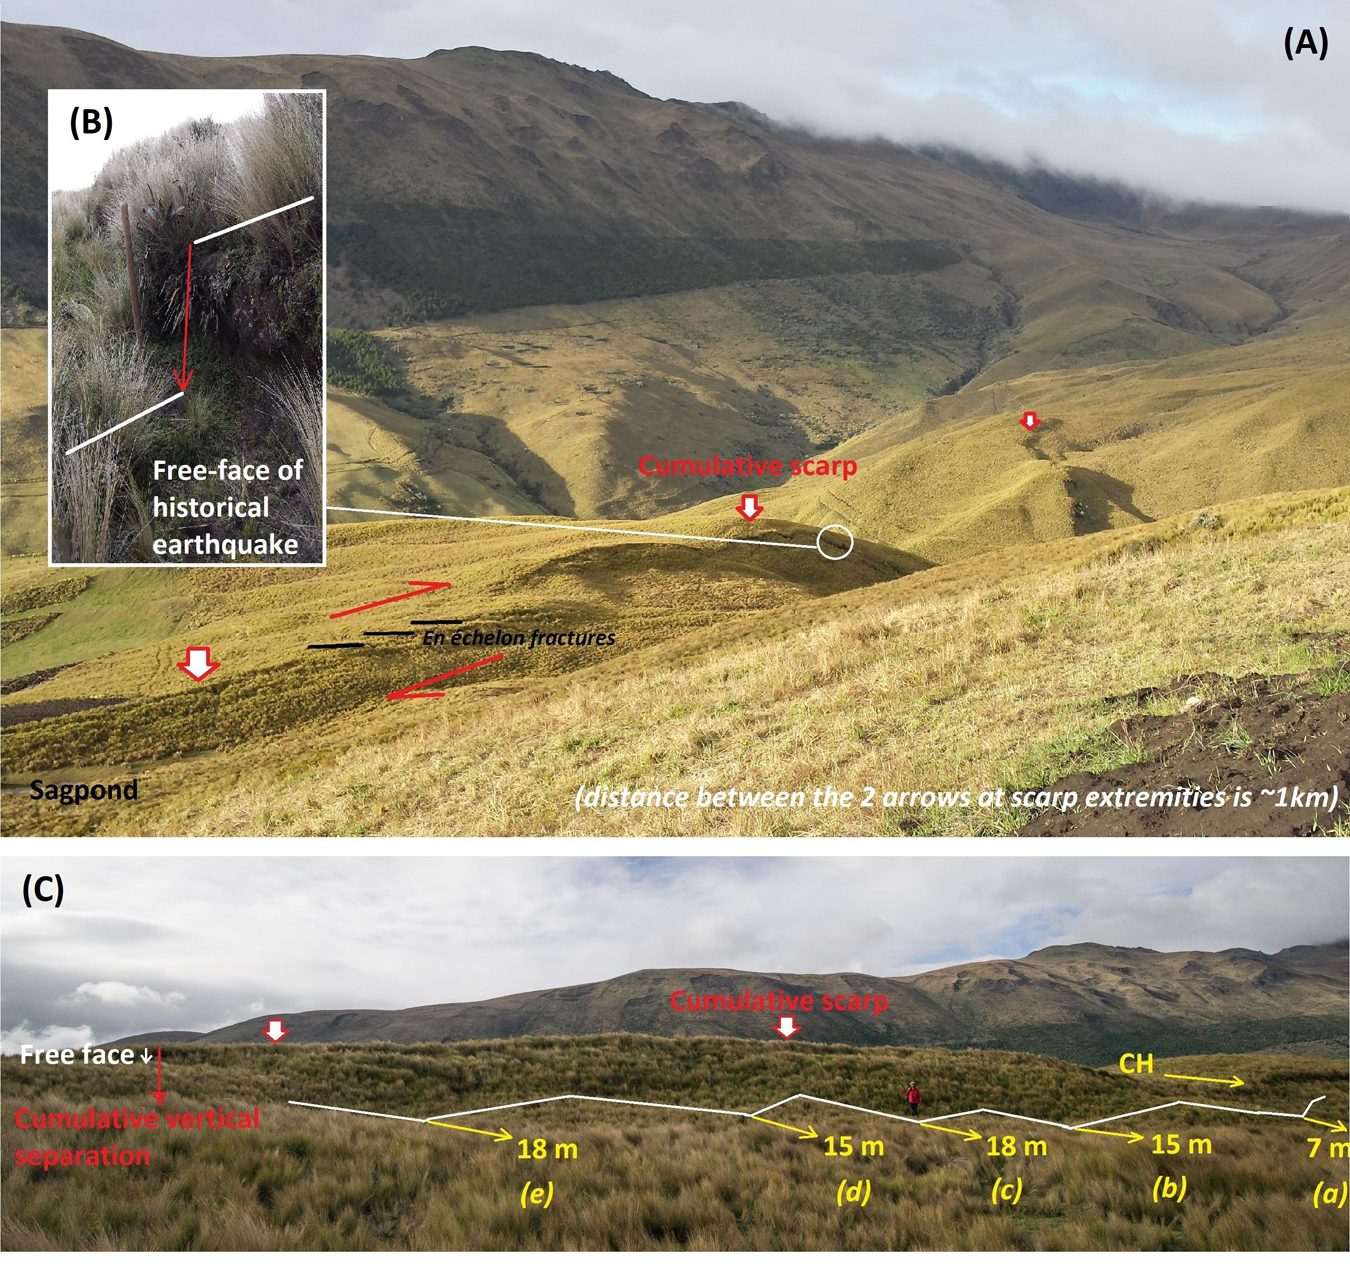
Figure 6. Field observations along the main DEM lineament, which clearly corresponds to a cumulative uphill-facing counter scarp that offsets morphological features (A). A focus on the top of this scarp allows to document a fresh free face scarp (B) that is proposed to correspond to the last historical earthquake of the area (M7.6 1797 Riobamba earthquake); en echelon open fractures could be related to this event as well. Picture (C) nicely illustrates the successive right-lateral offsets of a small incision feature at the base of the cumulative scarp; those offsets seem too high to be associated with one single event and this could reveal the discontinuous incision of the feature as well.
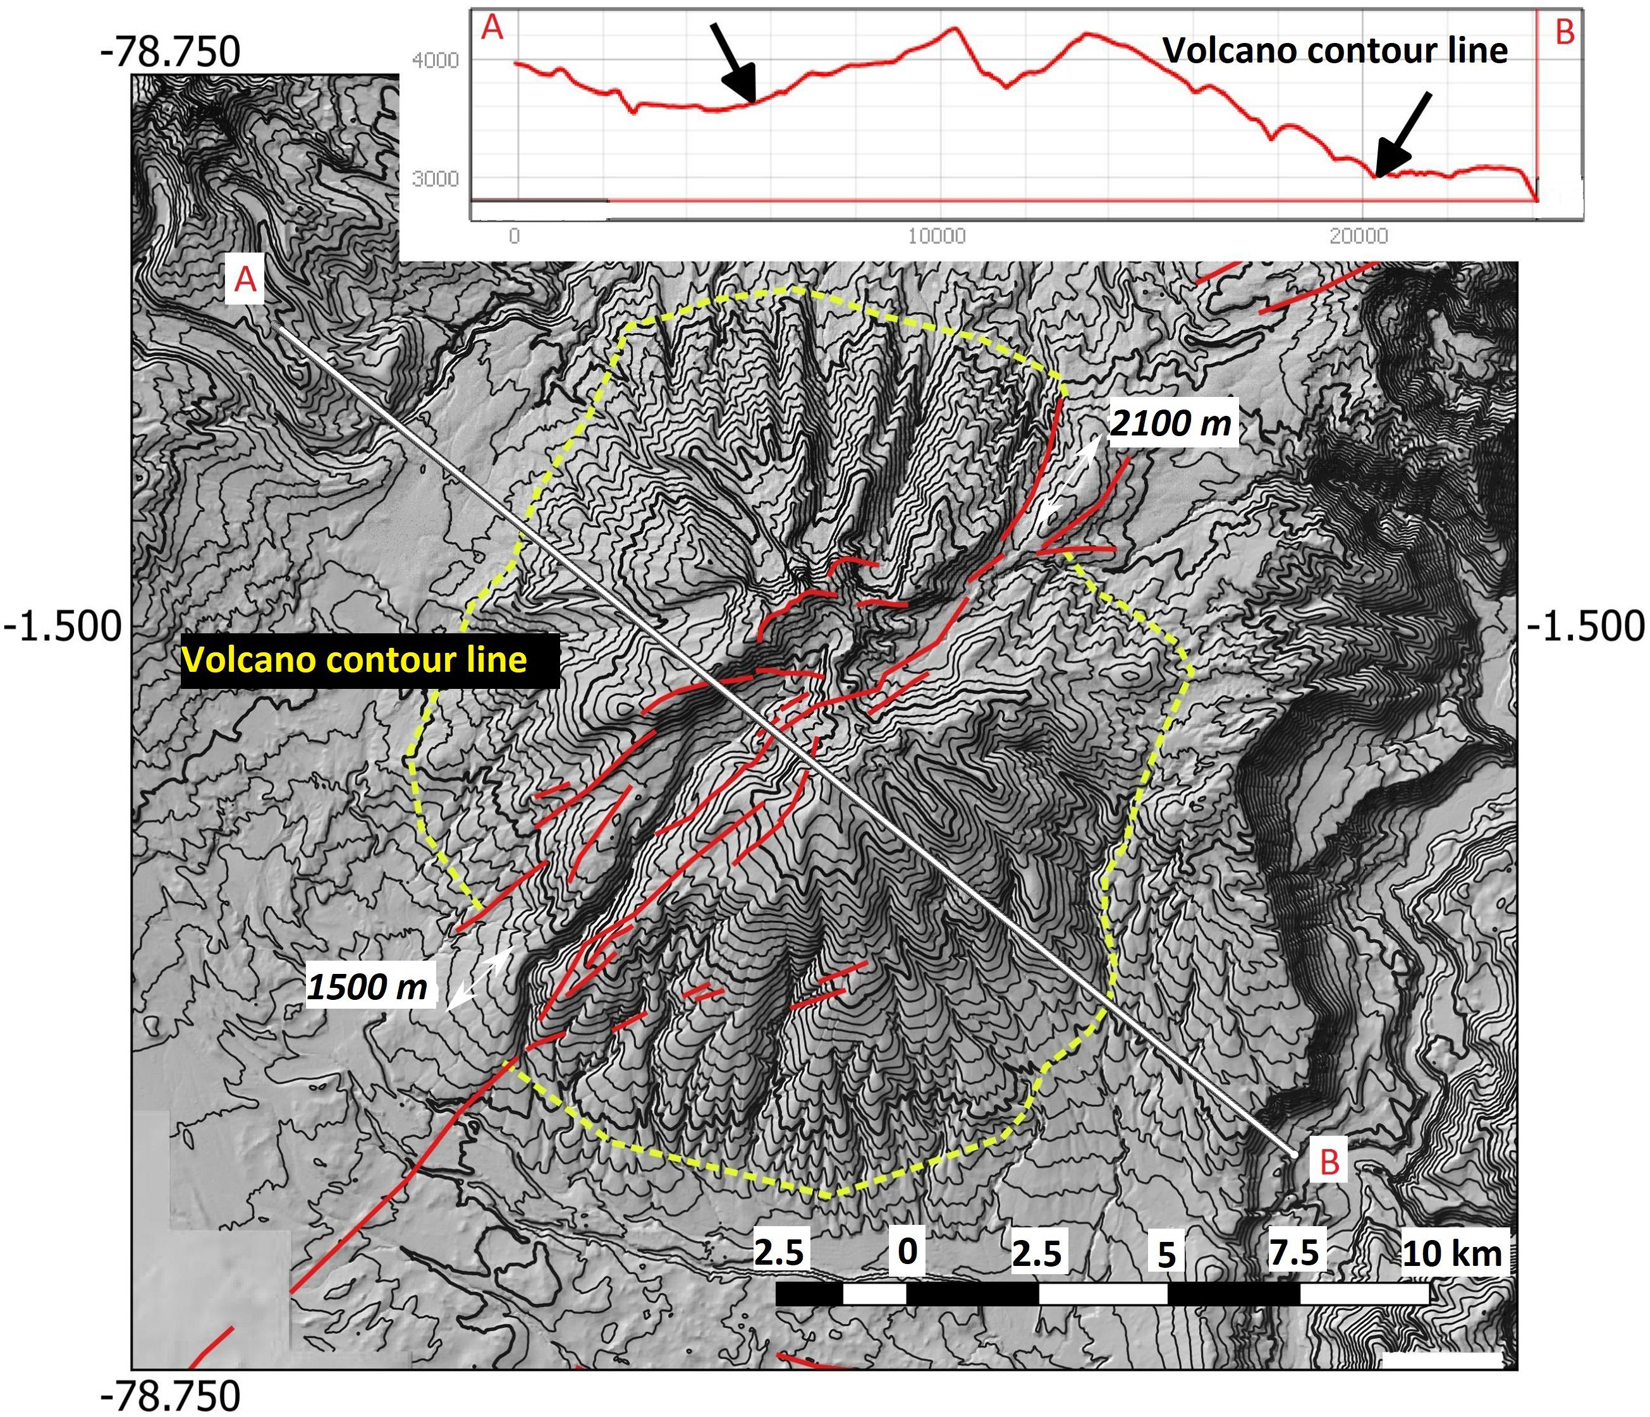
Figure 7. Topographic map of the Igualata edifice with hill-shade DEM picture and related elevation contours (contour spacing: 100 m; bold contour each 1000 m). Based on topographic profiles across the edifice (one profile is presented as an example with black arrows in the mean NW-SE direction), we traced the base of the edifice at the change in slope (yellow dashed line) and, assuming a rough cylindrical initial shape, we infer a right-lateral displacement of the whole volcano since its setup (1500–2100 m). Red lines are the morphotectonic lineaments forming the fault zone.
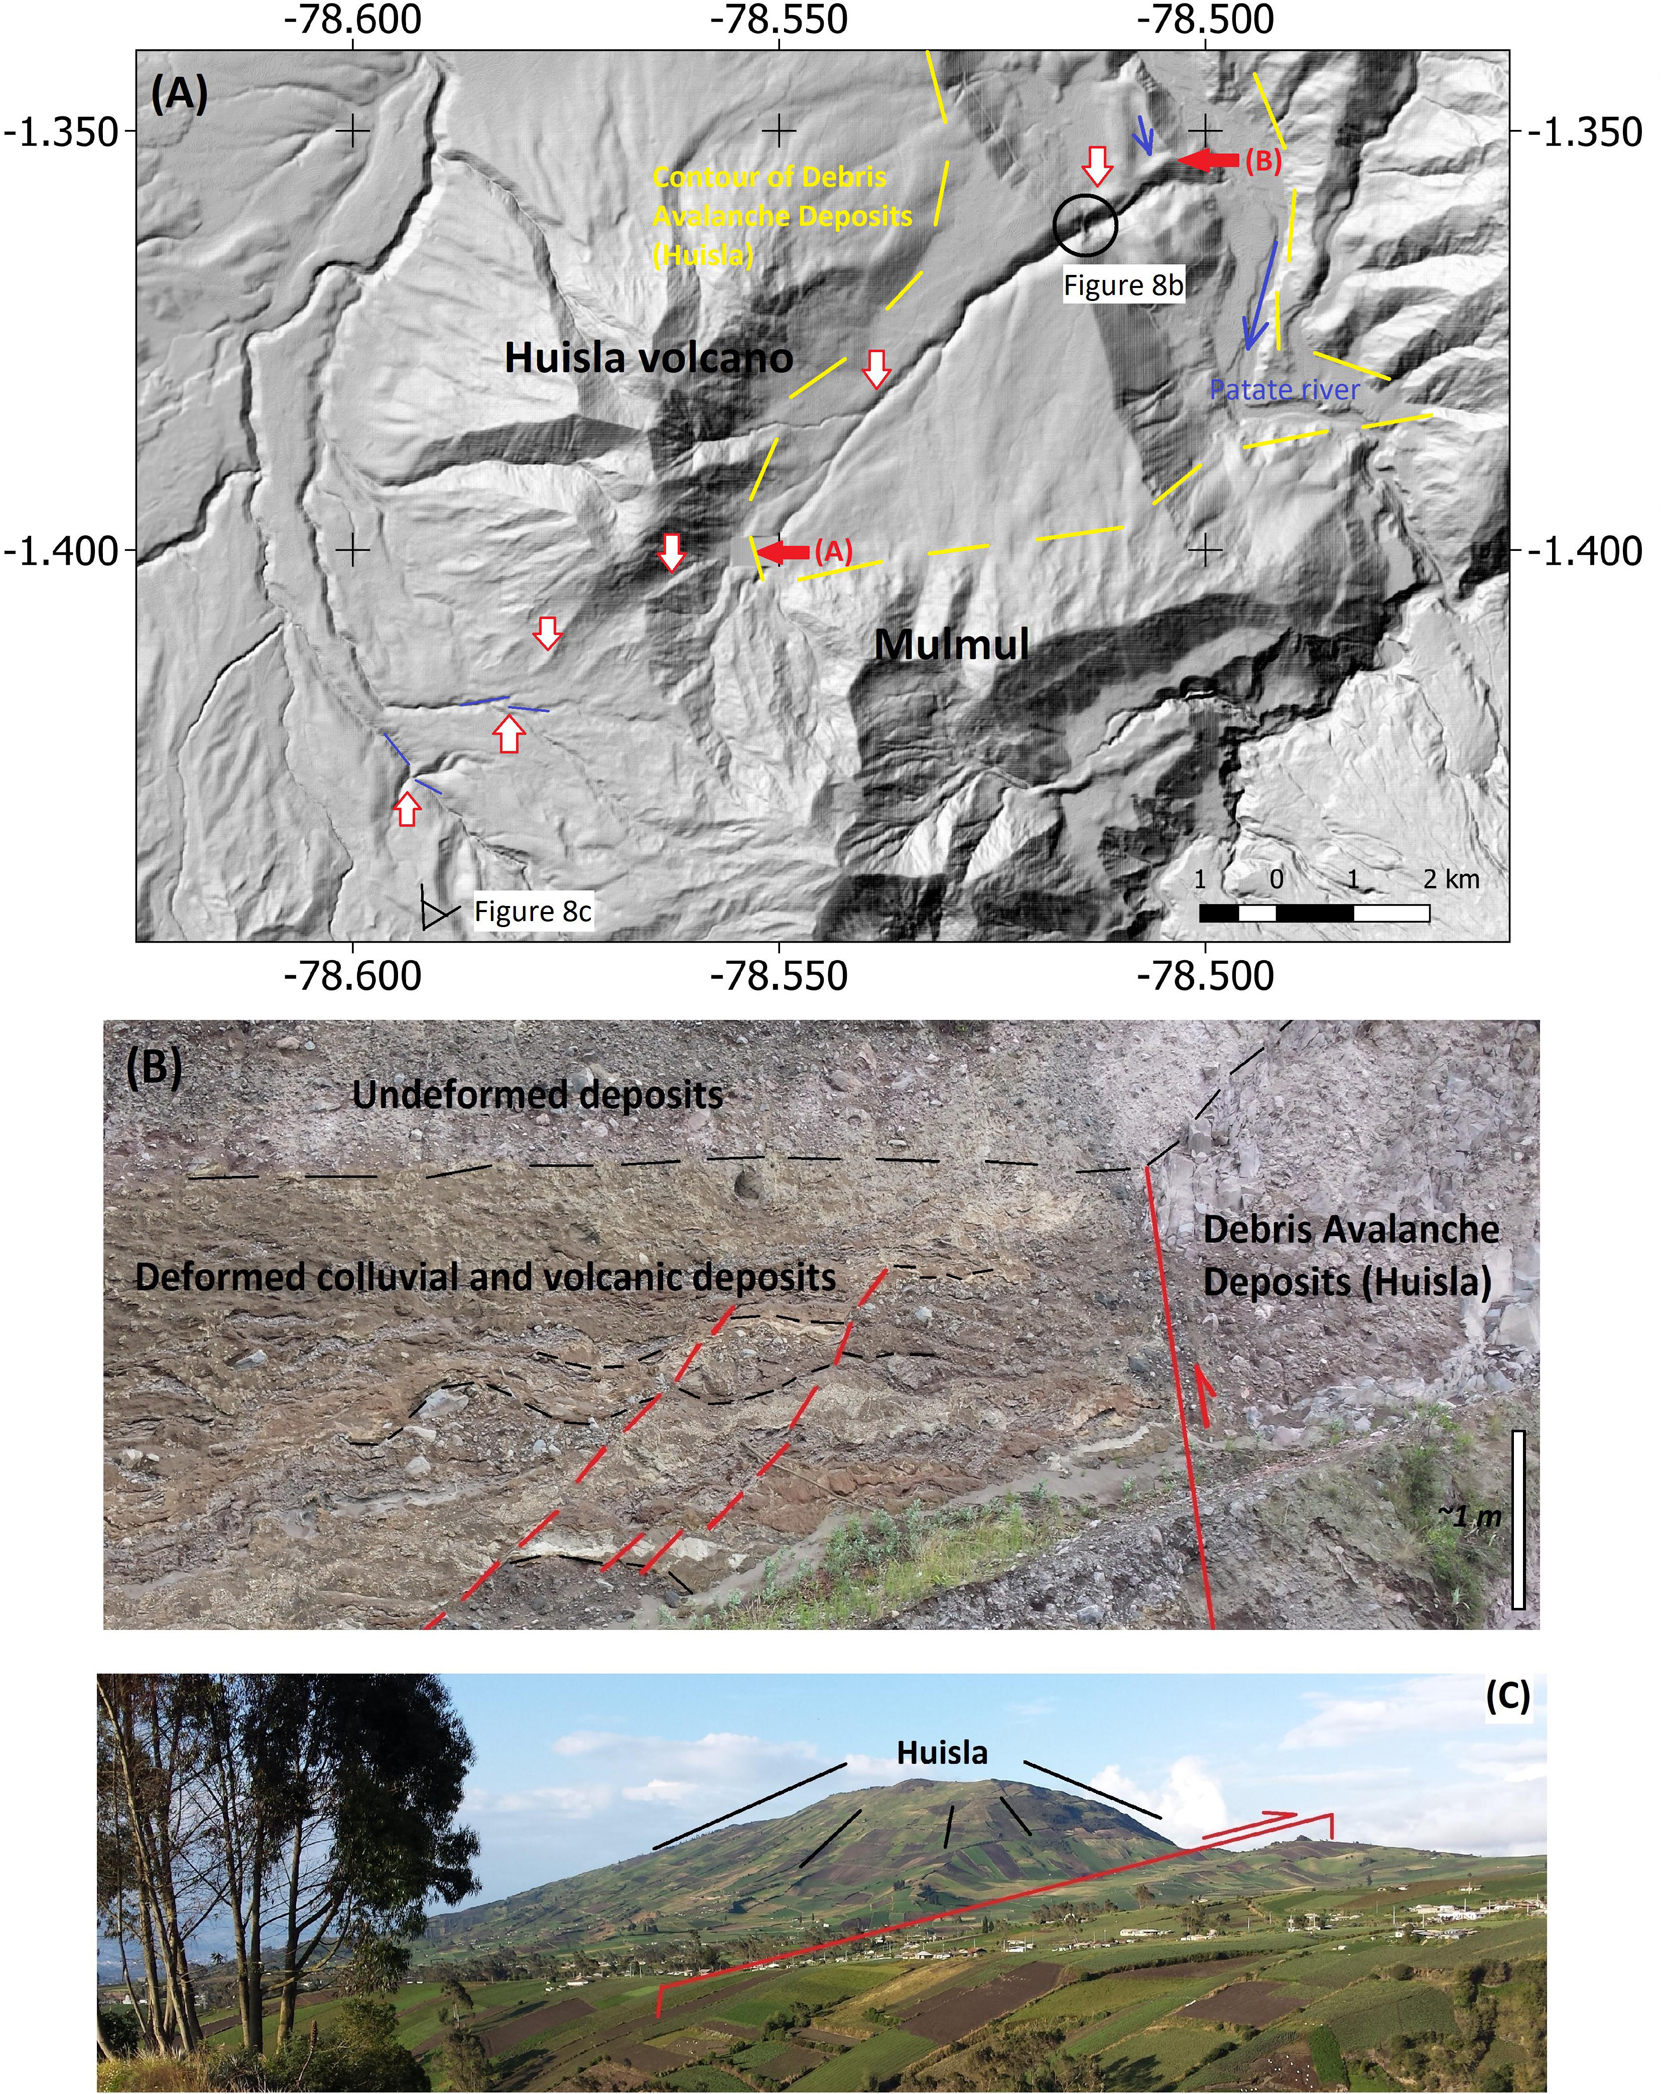
Figure 8. Illustration of the deformation of the Huisla volcano by the fault. (A) The map presents the course of the fault between red arrows, based on its morphological imprint. Southwest of the edifice, several drainage features (yellow dashed lines) are deflected; the fault cuts the southern flank of the Huisla edifice, then the Avalanche Debris of this volcano (emplaced between 215 and 175 ky based on stratigraphical relationships, according to Bablon et al., 2019) and landscape features; A and B labels locate sites described in the text. (B) A road cut exposes the Huisla fault segment juxtaposing the Huisla Avalanche Debris (to the right) with interbedded colluvial and volcanic layers (Pleistocene?). (C) Panoramic view from the south of the Huisla edifice, disrupted by the fault segment; gray lines depict the possible original slopes of the volcano, before its partial collapse and succeeding incision. P.R., Patate River.
Along the southwestern slopes of Igualata volcano, north of San Andres, we could trace a series of compelling evidences with cumulative dextral offsets of landscape features (horizontal: 20–50 m; vertical: 5–10 m), individual scarplets (vertical: 1 m) and faulted soils (label C, Figure 4), as described in Supplementary Material (pictures 2015-64-1 to 2015-65-2). The best indication of historical surface faulting is observed in the Igualata volcano summit part (Figure 5), with NE-SW counter-slope scarps displacing valley floors, free-face scarps and fresh en-echelon fractures (Figure 6 and pictures 2015-2 to 2015-13 in Supplementary Material). The occurrence of five abandoned erosional features (called “CH” on Figure 6) in the downthrown block (“a” to “e” in Figure 6) matching the same feature on the uplifted block is a compelling mark of the long-term activity, and possibly the succession of displacement events. The fault trace can be mapped up to the northern Igualata volcano slope, displacing the Late Pleistocene moraine deposits, terrace risers, and Holocene marsh deposits (Figure 5 and pictures 2016-7 and 2016-3&7&9 in Supplementary Material). The north-east continuation of active faulting of this fault portion is not as clearly documented as the previous one, both in the field and on the DEM, except across the Mulmul volcano (145–175 ka; Bablon et al., 2019; Figure 8).
The overall shape of the Igualata volcano testifies the long-term activity of the fault, which has caused the formation of large, deep and cross-cutting valley from SW to NE (Figure 7). When roughly reconstructing the geometry of the edifice on each side of the fault zone (red strands on Figure 7), we estimate a right-lateral separation of 1500 m of SW base and of 2100 m of NE base, assuming a symmetrical and roughly cylindrical shape.
A Step-Over to Huisla Volcano Fault Portion
North of the best-documented evidences on the Igualata volcano, we report clues of cumulative fault displacement across Huisla volcano (500–600 ka, Bablon et al., 2019) beyond a ∼5 km step-over. There, the Huisla volcano is dislocated by a NE-SW fault section. This fault throws down the south-eastern part of the volcano (Figure 8). The morphology of the Huisla strato-volcano is characterized by a collapse amphitheater resulting from a large and sudden collapse of its southeastern flank between 215 and 180 ka (Bablon et al., 2019). Huisla and related avalanche have been subsequently faulted during the Pleistocene (and Holocene?). The fault segment is revealed along its course to the NE down to the Patate River valley at several places (Figure 8), with one creek incised within the debris avalanche deposits with a significant (∼60 m) right-lateral component, for instance (label A, Figure 8 and picture 2015-26&27, Supplementary Material). On the Patate River western slope, a road-cut of the new Pelileo-Riobamba highway offers massive outcrops with many gravitational and tectonic deformation features. In one of these, we could document a Pleistocene NE-SW strike-slip shear plane between the Huisla avalanche deposits and a series of non-dated deposits with inter-stratified colluvial and volcanic fall layers (Figure 8B). One can notice that the older layers are affected by soft-sediment deformation, including folds, slumps and intra-formational faults. Downslope, we speculate that the damming of a perched NW-SE short valley could be due to a “positive” vertical deformation during right-lateral faulting (label B, Figure 8 and pictures 2015-33-3&4). The northernmost Huisla fault segment crosscuts the Patate valley to reach the western flanks of the Eastern Cordillera, approaching a length of about ∼20 km. In that area, it is possible to map (Figure 3 and Supplementary Figure S10) several short and discontinuous N-S to NE-SW linear morphological features with some dextral deflection evidences (Supplementary Material: pictures 2016-21, 27, 30, 32, 35) or fault expression in Quaternary deposits (Supplementary Material: pictures 2016-16 and 36). Actually, the fault seems to scatter amidst this buttress of Western Cordillera basement and finally appears to be deviated to the north, depicting a >30° bend (label Z, Figure 3). Note that this area includes the epicentral area of the 1949 Pelileo earthquake that caused many landslides and other secondary effects during shaking (Semanante, 1950).
The Laguna Pisayambo Area and the Pisayambo Fault
It was not possible to reach the high mountain area in the Llanganates National Park between waypoints 2016-20 and 2014-33 (Supplementary Figure S10) because of high elevation, steep relief, denser vegetation reaching higher altitudes and absence of tracks. There is a lack of clear lineament on the DEM between the aforementioned neotectonic clues and the NE-SW active Laguna Pisayambo fault mapped and observed close to the Angahuana volcano (Supplementary Figure S10), raising the possibility of a 15 km-wide active fault gap (Figure 3). Interestingly, this fault ruptured up to the surface in 2010 during a moderate earthquake (M∼5) (Champenois et al., 2017), and this historical surface rupture exactly sticks to a cumulative fault that dextrally displaces Pleistocene moraines of about ∼15 m and disrupts Holocene soils (Figures 9b,c; pictures 2014-18-1 and 2014-32 in Supplementary Material). A stratigraphic section in a hand-made trench allowed the check of the 2010 and syn-andisol development (Holocene) activity of the fault, during the last 8 ky (see Supplementary Figure S4 in Champenois et al., 2017 and picture 2014-34, Supplementary Material). Further north-east, several rather short lineaments (13 and 26 km) come one after the other separated by gaps or step-overs. These strike-slip segments (they are grouped into the Pisayambo Fault zone) merge the Andean east-verging Cosanga thrust (Alvarado et al., 2016). The fault segments strike around N30°–N50°E, and are parallel but not coincident with the Pucara fault defined several km further south (Alvarado, 2012).
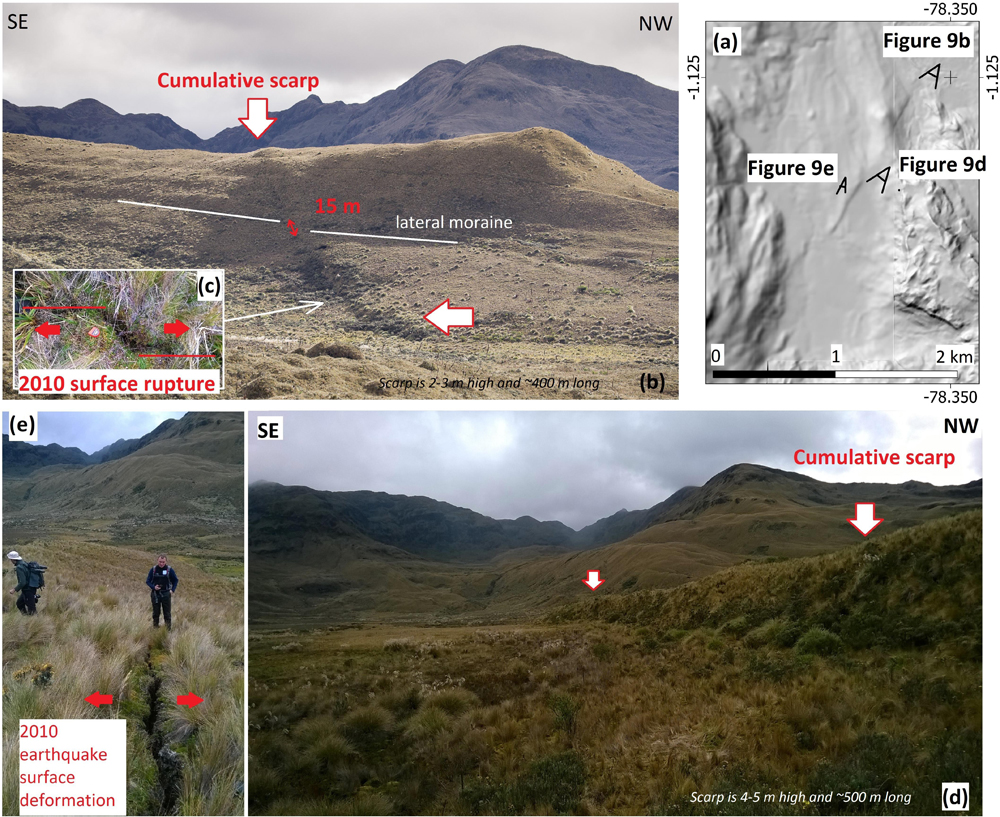
Figure 9. (a) The Pisayambo Fault segment has ruptured during a small magnitude event (Mw∼5) in 2010 along a clear cumulative fault scarp, leaving a 9 km long surface rupture (Champenois et al., 2017). (b,c) In the central section of the rupture, view of the 15 m offset of a lateral moraine, with evidences of 2010 30–40 cm right-lateral surface rupture; (d) illustration shows a high cumulative scarp in the south-central section, with coseismic surface deformation (open fissure).
Salcedo-Latacunga Folds
Turning back south to the Pelileo area (Figure 3), a striking point in the active fault map of the region is the north-south system of fault-related folds that arises north of the aforementioned basement buttress. Those NS structures, bounding the Inter-Andean depression north of the CCPP system, are kinematically consistent with this right-lateral fault system (Lavenu et al., 1995). The southernmost signs of folding in Quaternary deposits crop out in an area where they imbricate intimately with NE-SW scarps and lineaments (Figure 3 west of label Z and Supplementary Figure S10), a similar pattern as proposed by Fiorini and Tibaldi (2012) to the north in the Cotopaxi volcano region. The IAV is morphologically marked by flat surfaces, with rivers (e.g., Rio Patate) deeply incised in loose volcano-sedimentary sediments. Both DEM analysis and field observations underline the occurrence of many NS flexures, tilted surfaces and layers, elongated ridges, sometimes damming the drainage network (Laguna de Yambo, see pictures 2015-01 and 2016-55 in Supplementary Material), and even reverse faults (Figure 10 and picture 2016-53 in Supplementary Material). In map view, the general pattern of fault-related fold lines steps with a leftward en-échelon-like pattern toward the North. We could not evidence any lateral component of deformation in the area covered by the Figure 10 map. The morphological imprint of those compressive structures vanishes to the north and we assume that there is a significant gap in sub-surface faulting pattern. However, it is worth mentioning that Fiorini and Tibaldi (2012) report similar NS folds 15 km northward, close to the Cotopaxi volcano, which could then connect to the Quito-Latacunga folds.

Figure 10. North of the strike-slip fault sections in the Inter-Andean Valley, the fault-related folds and flexures around Ambato and Latacunga cities are clearly exposed in topography. (A,B) illustrates a topographic profile across those fault-related folds and flexures, suggesting a reverse component along near surface dip slip faults. Reverse faults have been observed in places between Quaternary volcanic deposits (e.g., between the Chalupas ignimbrite, 215 ka old according to Bablon et al., 2019, and the Latacunga series) and some symmetrical folds (e.g., Yambo laguna) clearly impact the landscape development.
The current activity of the N-S structures is strongly supported by the SAR data. In a study of the Tungurahua volcano activity, Champenois et al. (2014) used results from Advanced Synthetic Aperture Radar (ASAR) data provided by the Envisat satellite (C-band with a 5.6 cm wavelength; 23 ENVISAT SAR data; Ascending pass). They determined the surface deformation rate between 2003 and 2009, using the Persistent Scatters InSAR (PSI) technique to perform time series analysis of ground deformation. We here present a new map (Figure 11) showing the deformation in the enlarged Tungurahua volcano region. One can easily see that the InSAR-PS map also clearly depicts differential motion rates in the Line-of-Sight (LOS) across the IAV and its rims (Figure 11). Basically, positive LOS velocities depict pixels that move up (a lot) and west (a few), whereas negative values represent relative subsiding (or moving eastward) pixels. On Figure 11, we observe from west to east along the P1 profile a gentle and undulating decrease in the LOS displacement rate of about ∼ 2 mm/yr over 30 km. We suggest that this gentle eastward decreasing pattern of uplift may be due to the interseismic loading due to the subduction, as demonstrated by GNSS (Nocquet et al., 2014). This slope is then disrupted by a sharper gradient in displacement rate across a ∼2 km narrow band, in the area where the western structure bounding the IAV is mapped (Alvarado, 2012). Another step is found to the East, at the eastern edge of the IAV and, once again, it matches with the location of a mapped active structure. Because of their proximity in the study area, we speculate that there could be a structural linkage at depth between those NS fault-related folds and the strike-slip fault system located some km to the south. Assuming this relationship, there would be a conservation of strain across the area, accommodating the relative motion between the North Andean sliver and the South America Plate.
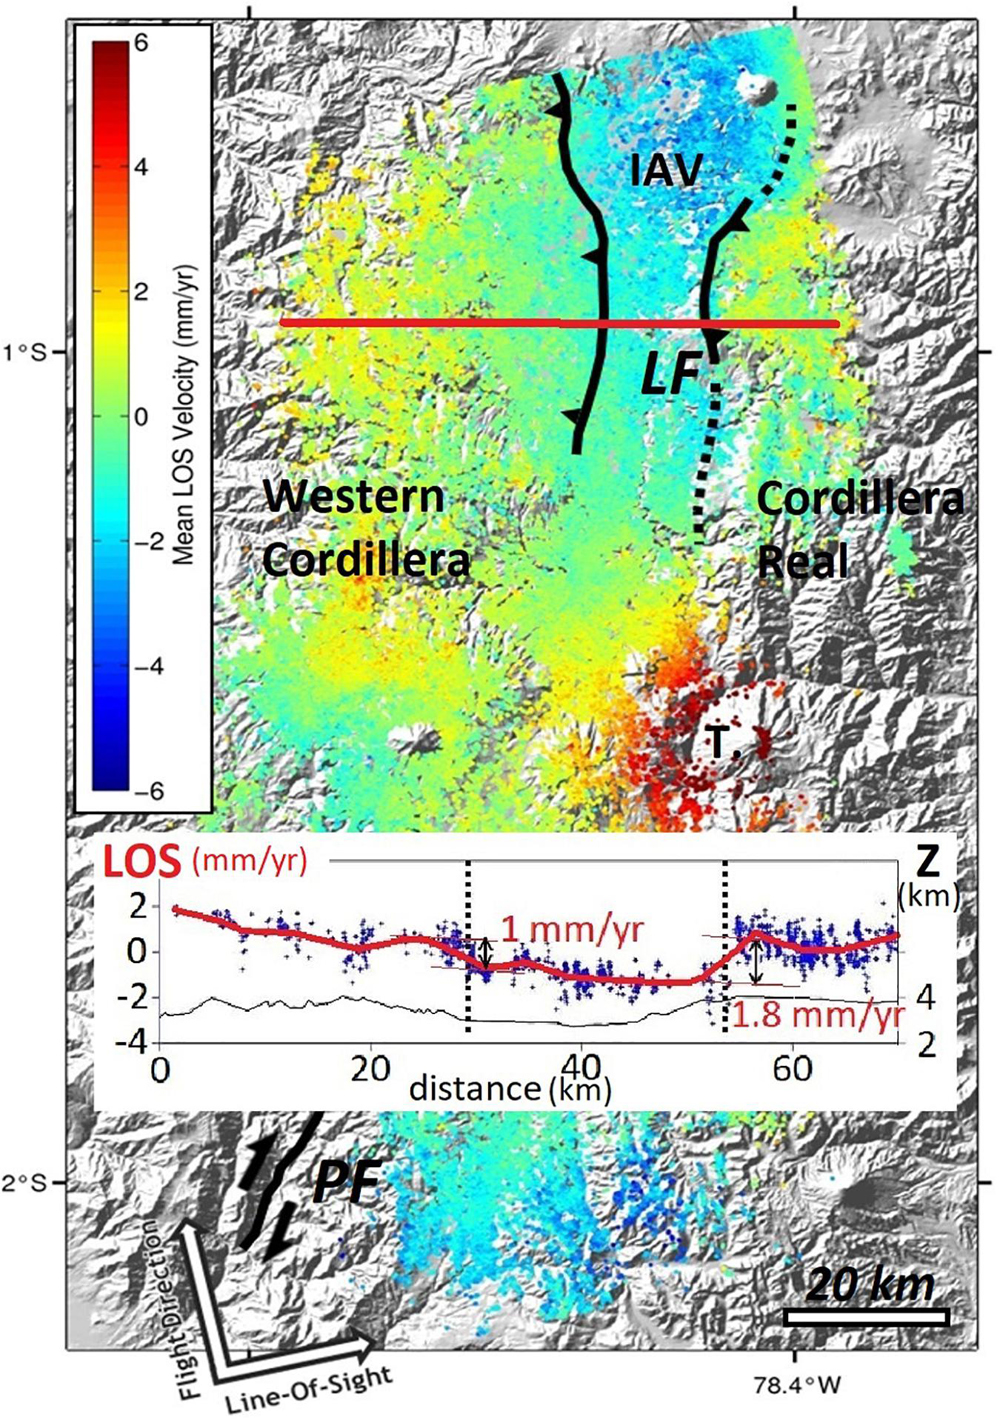
Figure 11. Illustration of surface deformation in the Inter-Andean Valley seen by SAR geodesy. The gentle decrease in the Line-Of-Sight displacement rate (LOS, in mm/yr) toward the east (due to the interseismic loading because of the subduction convergence) is affected by two sharper gradients in displacement rate that could match with the two IAV-bounding fault zones (Alvarado, 2012) that cause the uplift of the Cordilleras. Posing several assumptions (see text), we estimate that the fault slip rates could reach 1.7 mm/yr and 0.5 mm/yr for the Eastern and Western Boundary Faults, respectively. IAV, Interandean valley; LF, Latacunga folds; PF, Pallatanga fault; T., Tungurahua volcano.
Analysis
Structural Complexity
The new fault map depicts a series of fault sections including discontinuities, branching or sub-parallel strands, step-overs (max. 5 km), km-scale gaps or bends. Such complexities are rather common along active strike-slip fault systems within which earthquake ruptures can propagate. However, despite this complexity, individual fault portions do not show any dramatic internal changes, except for the area between the Huisla volcano and the eastern cordillera area where bends exceed 25°. The short surface distance (3–5 km) between the North-South folds and their spatial imbrication with strike-slip features in the Pelileo area suggest that there could be a structural relationship at depth between the two families of tectonic features. Considering that the complete fault network is related to the same geodynamic input (i.e., the North Andean Sliver motion to the NNE with respect to South America Plate), this interaction would imply a conservation of slip rates from south to north, across the fault network.
Slip Rates
Deflected morphological features and offset Quaternary formations allow inferring slip rate information. The fault zones cut a large panel of rocks, including Paleozoic basement (Eastern Cordillera) and Cretaceous/Tertiary volcanic rocks from the Western Cordillera terranes, but also recently dated Pleistocene/Holocene volcanic units, glacial deposits and thick Holocene andisols. During the field campaigns, we pointed out several spots where the amount of displacement of relatively recent deposits or the separation of landforms could be estimated.
The oldest K-Ar age obtained for Igualata volcano (376 ± 10 ka; Bablon et al., 2019) is interpreted as a minimum age for this edifice. This age provides a very long-term estimation of maximum slip rate for the northernmost segment of the Pallatanga fault. We estimate this slip rate based on the dextral apparent horizontal separation of the hinge line marking the base of the edifice. This estimation is highly uncertain because of our low ability to define precisely this piercing line (toe of the volcano slope). The southern flank toe appears to be offset between 900 and ∼1500 m (depending on the projection of the piercing lines applied to the wide fault zone), whereas the northern slope appears to be massively disrupted (∼2100 m, even 2500 m when considering an alternative option for projecting the slope toes). Considering the oldest age of this edifice, the resulting maximum and long-term slip rate range from 2.4 to 4 mm/yr (southern slope) to 5.6–6.6 mm/yr (northern slope). In addition, we assume that the Pallatanga fault already had an impact on morphology when the lava flow dated at 237 ± 9 ka (Bablon et al., 2019) have been emplaced in the southern fault-controlled valley.
On the same segment, south-west of Igualata volcano, the fault cuts the Guano valley, as well as the massive Chimborazo-related volcanic avalanche deposit which was deposited during the catastrophic collapse of the Chimborazo edifice between 40 ± 8 and 62 ± 4 ka, according to the ages of overlying and underlying lava flows (Samaniego et al., 2012; Bablon et al., 2019), respectively. The drainage incised in this massive volcanic package is dextrally offset, and the two spots are used to evaluate the cumulative slip. At site A (Figure 4), the drainage is offset by 60–120 m, depending on the chosen projection of upstream piercing line (incised channel or northern valley slope), whereas the southern slope of Guano valley (site B; Figure 4) is displaced between 60 and 90 m (depending on the projection of used piercing line, i.e., base of slope). Assuming that the drainage has started to incise after the avalanche deposits emplacement, this provides a slip rate range value between 1 and 2.7 mm/yr (site A) to 1–2 mm/yr (site B). This bracket represents a minimum value, because the offset drainage could be younger, for instance dating only back to the Holocene onset (12 ka), then slip rate could reach an unlikely value of ∼10 mm/yr. Otherwise, the same fault strand deforms the 4 ± 2 ka Guano lava flow (Bablon et al., 2019) in San Andres. The flat upper surface of this lava flow is clearly bumped along a tiny linear ridge in continuation of the fault. However, the lateral offset of the lava flow edge cannot be inferred from the DEM analysis. Note that other oblique strand has been detected by Baize et al. (2015) to the east, which deflects some avalanche deposits’ landscape features by ∼110 m. Summing up these two segments, a value of 3.6–4 mm/yr seems to best fit the data at this fault section, following the various hypotheses.
Along the slopes of the deep incision in the Igualata volcano summit area (∼3800–3900 m a.s.l.), the small-scale incision (“CH”), still active today, is offset of 73 ± 5 meters (Figure 6). Although we do not know the age of this incision feature, we suggest that it could have formed after the retreat of glaciers that filled the valley down to 3400–3600 m asl., during the Last Glacial Maximum. In the area, this climatic stage occurred from 33 ± 3 ka on, and ended at around 14 ka (Clapperton, 1990; Samaniego et al., 2012; Bablon et al., 2019). Consequently, the minimum slip rate there may then range between 2.1 mm/yr (68 m in 33 kyr) to 5.6 mm/yr (78 m in 14 kyr): we give more weight to the high range of values (∼5 mm/yr) because the valley was probably regularly glaciated up to 14 ka.
In Rumipamba, Winter et al. (1993) then Baize et al. (2015) estimated, based on the cumulative offset of Holocene morphological features and successive vertical displacements of late Holocene soils, that the apparent and mean slip rate ranges between 2.9 and 4.6 mm/yr and 2.5 mm/yr, respectively. We provide an updated analysis of slip rate (2.1 mm/yr) based on paleoearthquake record in the following section. Note that, accounting for the 41.5 m offset measured by Winter et al. (1993) on landscape features, and revising their “post-glacial” age from 10 to 13 ka of those authors to 30–14 ka (Samaniego et al., 2012), we come out with a very consistent mean slip rate values determined from large-scale morphological features’ offset and displaced soils (1.4–3 mm/yr range).
The Huisla segment is poorly documented. The only indication is a 60 m deflection of a drainage incision in the Huisla avalanche deposits, overlooked with DEM and checked in the field. The only temporal constrain available is the 215–180 ka age of the Huisla-related avalanche deposits (Bablon et al., 2019), providing a minimal slip rate of 0.3 mm/yr that does not seem realistic. Assuming that the drainage started to incise at the beginning of the Holocene, a speculative upper bound value 4 mm/yr is determined. The drainage deflection is located on the same lineament as the recent rupture visible in the road cut 5 km to the north-east (Figure 8B).
In Pisayambo area, we could map in different places the horizontal offset of moraines, between 15 and 20 meters. Considering their elevation (∼3700 m), these moraines could be associated with the LGM (33–14 ka) by analogy to the Chimborazo volcano flanks (Samaniego et al., 2012). These values would end up with a relatively low slip rate ranging between 0.45 and 1.4 mm/yr for the Pisayambo Fault.
Concerning the NS compressive structures, the mean Plio-Quaternary shortening rate across the IAV has been previously estimated around 1.4 mm/yr (Lavenu et al., 1995), including both the N-S structures that bound the IAV to the west and to the east. More recently, Fiorini and Tibaldi (2012) stated that slip rates along the thrust faults described are unknown, but provide an estimate of less than 1 mm/yr along each fault. We hereafter propose another evaluation based on InSAR data (Champenois et al., 2014) presented above. On Figure 11, we observe along the P1 profile that the first LOS displacement rate associated with the western border of IAV is about ∼1 mm/yr over ∼2 km narrow band in the area. The second LOS displacement rate step found to the East at the eastern margin of IAV is around ∼-1.8 mm/yr and the sense of LOS displacement is consistent with a relative uplift of the eastern cordillera. Assuming that those border faults are reverse and that the slip vector is for both faults parallel to the LOS, we can easily estimate their geodetic slip rates. Although the dips of these two faults are not well constrained, we assign 50° values by analogy with the Quito reverse fault, whereas the LOS is dipping by ∼70°. When projecting the LOS onto the two fault planes, we end up with actual slip rates of 1.7 and 0.5 mm/yr for the Eastern and Western Boundary Faults, respectively. Those reverse faults slip rates are much lower than the one determined for the Quito Fault (3–5 mm/yr) in the same large tectonic block (Quito Latacunga block; Alvarado et al., 2014), a fault that is now recognized to absorb a portion of shallow creep in its central part (Marinière et al., 2020).
The lower and upper bound values of slip rate are summarized in Table 1.
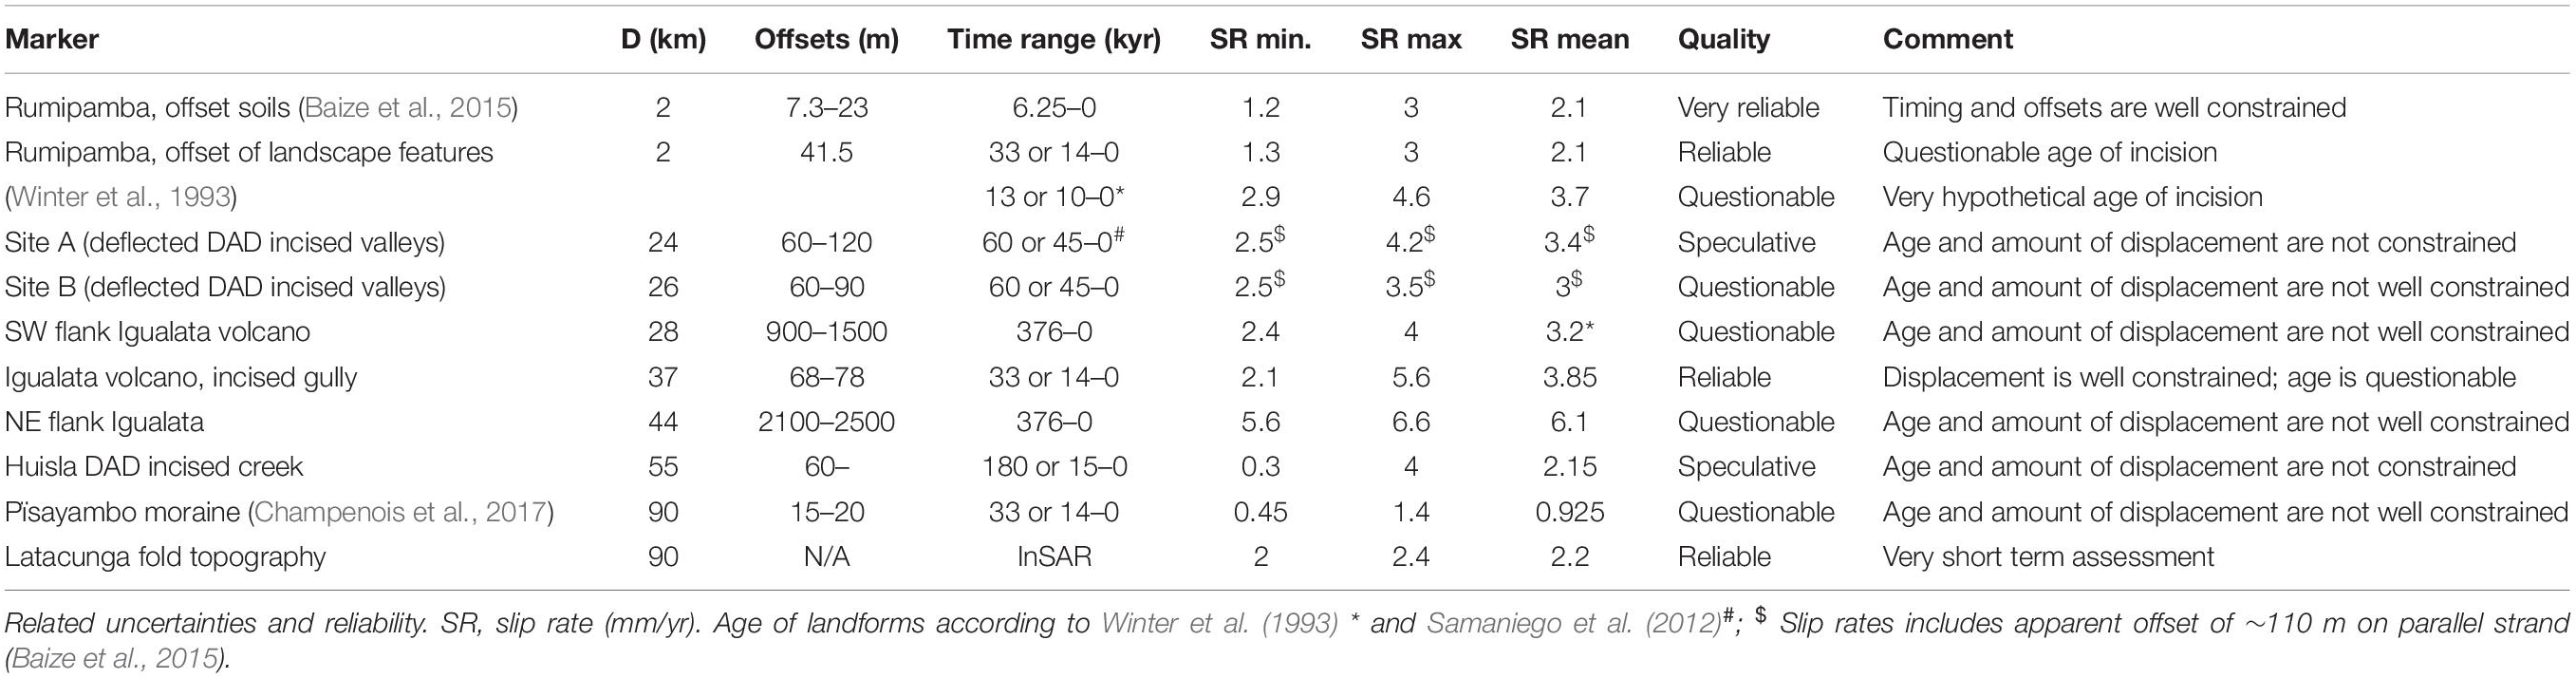
Table 1. Summary of slip rate along the 90 km section of the Pallatanga fault, based on observed offsets of landscape features and stratigraphic layers.
Earthquake Surface Ruptures and Their Recurrence
We recompiled the original radiocarbon ages obtained in Baize et al. (2015) trench, together with the measured vertical offsets. Soil samples 14C ages are calibrated with OxCal software (Bronk Ramsey, 2009), using the IntCal13 calibration curve (Reimer et al., 2013) to infer the possible range of paleo-earthquake dates. We provide details of this analysis in Supplementary Material. The geological interpretation of the trench T2 (Figure 12A), located a few tens of meters south of the trench visible on Figure 2, led to propose a series of 4 paleoearthquakes, i.e., a recording of 3 complete earthquake cycles bracketed by E4, E3, E2, and E1 within the last ∼8000 years (Figure 12B). Based on the calibrated ages (see Supplementary Material), we come out with the most probable following dates: E4 = 4250 BCE, E3 = 2400 BCE, E3 = 400 CE and an historical earthquake (post-1000 CE; Figure 12B). We supposed this last event to be the 1797 Riobamba earthquake, which seems to be the best candidate for this rupture, because of the vicinity of its epicentral location. However, we cannot completely rule out the Mmw∼7.2 1698 event. The perpendicular-to-fault trench only gives access to the vertical component of late Holocene slip. However, Winter et al. (1993) proposed that the long-term (Pleistocene to Holocene) slip is massively right-lateral, based on the geomorphic reconstruction of near-field landforms. Those authors came out with maximum, mean and minimum values of the related slip vector respectively dipping 20°, 11.5°, and 6° to the south. Using those values, the individual net slip during E1–E4 events range between 2 and 8.6 m, corresponding to moment magnitudes ranging between 7.3 and 7.9 for strike-slip earthquakes (Wells and Coppersmith, 1994). Figure 12B illustrates the slip versus time history that can be inferred from the trench result. Over the 3 earthquake cycles, the cumulative fault displacement is between 7.3, 12.5, and 23 m, respectively, slip vectors of 20°, 11.5°, and 6°, ranging the short-term (last 6000 years) slip rate between 1.2 and 3 mm/yr. We stress that the prolongation of slip rate line to the old ages in the trench (black dashed lines) intersects the “0” slip value, close to the oldest soil sampled a few cm above the bottom of the Holocene series. This strongly suggests that this soil was developed promptly after a morphogenic earthquake that created space for sediment accumulation.
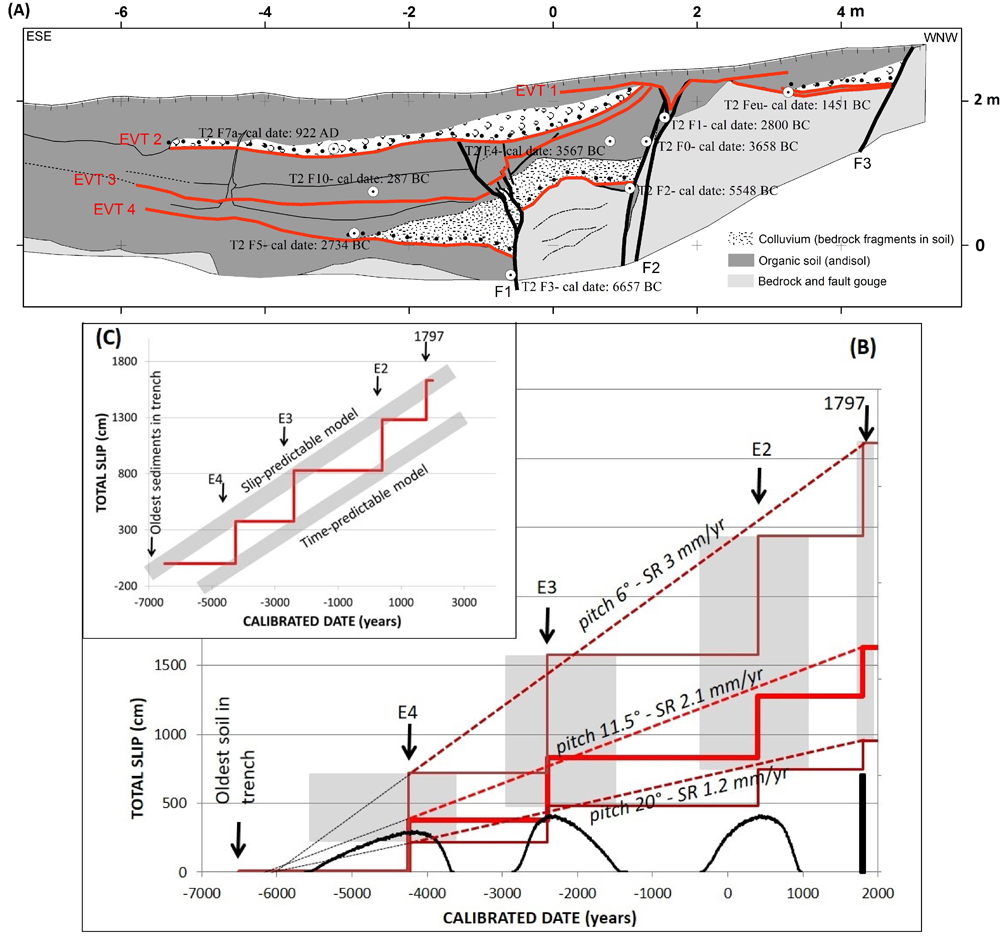
Figure 12. Illustration of the slip versus time history inferred from the Rumipamba trench results. (A) Geological section of trench T2 dug in 2009 in Rumipamba (Baize et al., 2015). We simplified the drawing in representing in a same caption the bedrock fragment-rich horizons (colluvial wedges), the soil units and the bedrock, as well as the fault planes and surrounding shattered rocks. We underline the stratigraphic location of the event horizons that are used in the OxCal analysis. (B) X-axis is calibrated date; black bell-shaped curves are probability density functions of earthquake dates resulting from the stratigraphic model and the resulting Bayesian estimation of dates determined by OxCal online tool. Gray shaded boxes depict the uncertainty ranges of paleoearthquakes including age uncertainty (from OxCal model) and slip range (from possible slip vector range). The staircase curve represents a “mean” slip versus date scenario based on those results, representing three earthquake cycles. A value of paleoseismological slip rate is extracted from this curve, depending on the initial slip vector hypothesis. (C) The “mean” slip versus data scenario (staircase curve) is presented to illustrate that the Rumipamba better matches a slip-predictable model.
On top of the ∼380 ka old Igualata volcano, the five successive dextral displacements of “CH” are between 7 and 18 m, ending up with a cumulative right-lateral offset of ∼73 m. The cumulative vertical component is around 4 meters (Figure 4). Assuming that those evidences are caused by surface-rupturing morphogenic earthquakes, we stress that the values are in the order of the highest offsets ever inferred for single events (> 15 m), such as those due to the M∼8 Wairarapa, New Zealand, earthquake in 1855 (Rodgers and Little, 2006) or the M7.6 Chi Chi, Taiwan, earthquake in 2001 (Lin et al., 2001), but massively larger than those ever measured recently such as the 8–9 m on the 2002 M7.9 Denali, Alaska, rupture (Haeussler et al., 2004), on the 2001 M7.8 Kokoxili, China, rupture (Klinger et al., 2005), the 2008 M7.9 Wenchuan, China, rupture (Yu et al., 2010), or even the 12 m on the 2016 M7.8 Kaikoura rupture in New Zealand (Kearse et al., 2018; Langridge et al., 2018). Based on this worldwide catalog, we question that the Igualata proofs of earthquake ruptures could correspond to a series of only five single event offsets and, therefore, we suggest that the time required to generate the “CH” feature could be longer than recurrence of large earthquakes, i.e., 1500–3000 years if we refer to the Rumipamba trench.
Along the Pisayambo section (north-east of Pelileo city) of the fault system, a magnitude 5 earthquake caused a surface rupture along a 9 km long fault with pure right-lateral surface displacements (maximum ∼30 cm according to field observations, ∼40 cm according to InSAR results). The hand-made trench, as presented in the Supporting information of Champenois et al. (2017), shows the main fault zone between the (presumably) Pleistocene moraine and the organic soil with a reactivation (opening) during the 2010 event. This section, as well as the general geomorphology (see picture 2014-18-1, in Supplementary Material), suggest the occurrence of two surface-rupturing events by the alignments of pebbles within the soil, one between -2500 and -1070 cal B.C, and the other between -840 and -340 cal B.C. However, the sedimentary signal is too weak to go further and estimate vertical separation, for instance.
Discussion
We estimate that multiple-segment ruptures could occur along the Pallatanga fault system. Biasi and Wesnousky (2017, 2016), based on a worldwide historical database, propose that the likelihood of rupture propagation is linearly related to the width of surface steps and gaps in strike-slip faults. For instance, they determine a 30% probability of rupture propagation across 5 km wide steps or gaps. In the same way, they also explore the influence of fault bends in rupture propagation and conclude that changes in strike play a significant role on rupture propagation when exceeding 25°. However, recent events suggest that those rules can be significantly overstepped, such as the 2016 M7.8 Kaikoura, New Zealand, earthquake during which the rupture jumped over large distances (10–20 km) from the Canterbury faults to the Marlborough faults. During this same event, some sections of the Canterbury surface ruptures intersect at orthogonal angle (Litchfield et al., 2018). Considering those empirical relationships, an “extreme” scenario rupturing the whole Pallatanga fault system cannot be excluded, then mobilizing a rupture length larger than 150 km from tip (south of Pallatanga at the western margin of the Andes) to tip (few km northeast of Pisayambo at the eastern margin of the Andes). Such an event could also mobilize the nearby reverse segment in the IAV. Historical examples (2002 Denali, Alaska; 2016 Kaikoura, New Zealand) have shown that a combination of strike-slip and thrust segments can rupture in one earthquake. In that case, our geological mapping is consistent with scenarios of large earthquakes of Mw = 7.5+, accounting for surface rupture length of 150 km or Rupture area of 4500 km2 (Wells and Coppersmith, 1994). This estimation is coherent with that of the 1797 Riobamba earthquake magnitude (Mmw = 7.6) based on historical accounts (Beauval et al., 2010). Unfortunately, we do not have sufficiently continuous and reliable data to validate this statement based on the most recent earthquake surface rupture (two sites distant of 40 km, from Rumipamba to Igualata), or based on paleoseismological recordings (one trenched site in Rumipamba and one outcrop in Sicalpa at 10 km, see Baize et al., 2015).
Keeping in mind the whole range of uncertainty and assuming a constant earthquake rate over time, the slip versus time distribution at the Rumipamba site suggests that the fault behavior is not perfectly periodic, but is better matched by a slip predictable model (Figure 12). The 1797 earthquake (E1) triggered too soon in a time predictable model. Additional data are needed to constrain this first appreciation, to understand if this is a common feature all along the Pallatanga fault. One first-choice site to explore is the Igualata summit, and another one is close to the pass between the Rio Pangor valley and the Cajabamba and Laguna Colta (site 2010-19, see Supplementary Material).
We describe the fact that the Igualata, Huisla and Mulmul edifices, which have been active between ∼380–100, ∼600–500, and ∼180–140 kyr, respectively (Bablon et al., 2019), are affected by the Pallatanga Fault, as well as many younger volcanic products filling the basin, such as the Guano lava flow and debris avalanche deposit from Chimborazo volcano. In terms of slip rate, our new data fill a gap of knowledge in the middle of the CCPP fault system between the south-westernmost CCPP section (the fault system crosses the littoral plain of Puna Island with minimal Holocene slip rate of 6–8 mm year (Dumont et al., 2005a, b) and the northernmost section (Holocene slip rates around 10 mm/yr according to Tibaldi et al. (2007) along the Chingual section). In Figure 13 and Table 1, we report the whole set of slip rate values estimated from both our field data and available datings or stratigraphic information. The Pallatanga fault is active at least since the beginning of the Igualata volcano building (∼376 ka), and probably largely before if we assume a connection with the Puna fault in the Guayaquil gulf (Witt et al., 2006). We ranked the values of slip rates obtained in the previous section with respect to their reliability, roughly estimated based on the robustness of the age of displaced markers and the precision or accuracy of the piercing lines. We consider the slip rate reliable when the age is estimated for a dated marker (14C or K-Ar) and when the piercing line is geometrically well-constrained. Speculative clues are those for which none of those conditions are satisfied. In between, questionable cases bear rather reliable age or offset. Based on this, there could be an increase of slip rate around the Igualata area, north of Rumipamba where the slip rate estimate is reliable, and south of Pisayambo. This trend is mainly driven by two spots with questionable results both due to poorly constrained ages of displaced deposits; those rates could be revised with further data acquisition. Despite slip partitioning from the Pallatanga – Rumipamba segments to the Pisayambo fault zone, on one hand, and to the north-south folds on the other hand, there seems to be a variability of slip rate along strike. This twofold change -from ∼2 to 3 mm/yr to ∼4 to 6 mm/yr- occurs around the Igualata volcano area over distances from 25 to 40 km (distances between available data). Therefore, the whole fault system would show changes at local (2–3 to 4–6 mm/yr) to regional (2–10 mm/yr) scales. Spatial changes are described both along long-living and segmented faults, like the 400 km-long Doruneh Fault in Iran (Farbod et al., 2016) or along young and evolving fault systems, like the Eastern California Shear Zone (Kirby et al., 2008; Frankel et al., 2011; Angster et al., 2018). In this latter case, variability is distributed over comparable along-strike distances. This is similar to the Pallatanga fault system. Along the Eastern California Shear Zone, the along-strike variation of strain is interpreted as the consequence of transfer to distributed structures off the fault of concern. This then suggests that this kind of variability could be a common trend of young and evolving fault systems, such as the Pallatanga Fault. Note that back and forth deformation transfer and interaction between faults is also evoked to explain temporal changes at a single site (Gold et al., 2013).
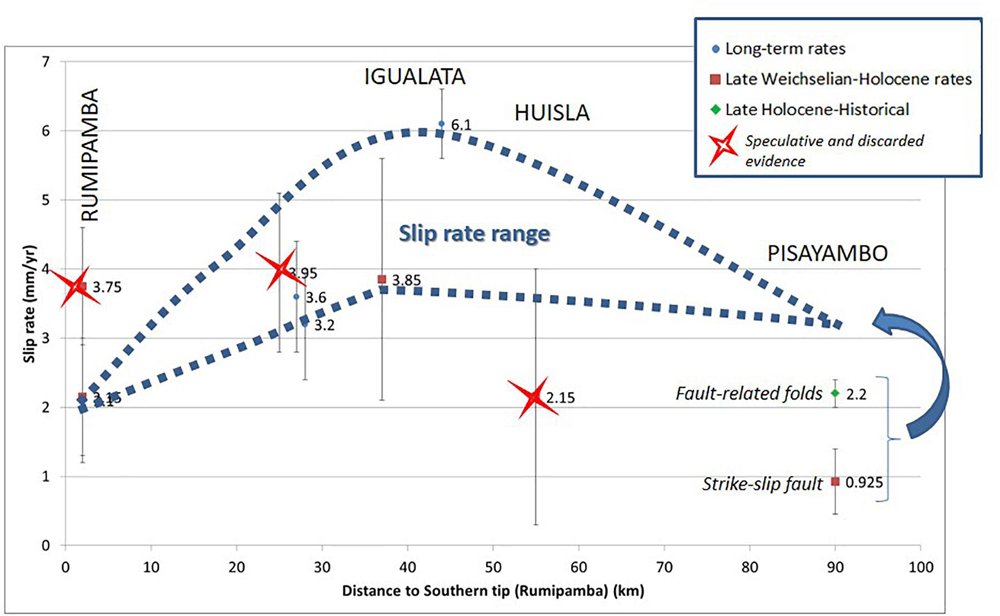
Figure 13. Synthesis of slip rate estimation along the section of the 90 km Pallatanga fault system of concern. This graph is based on observed offsets of landscape features and stratigraphic layers, and related uncertainties and reliability, reported in Table 1.
The fault map, when viewed at the regional scale, suggests that there are changing patterns from SW (Pallatanga area) to NE (Riobamba then Pelileo areas) with multiplication of fault sections, branches, and parallel strands. Long-living crustal magmatic bodies are known to make the lateral propagation of faults more difficult because they modify the thermo-mechanical properties of the bedrock (Dumont et al., 2017). It has also been proposed that the presence of a volcano could preclude the rupture propagation during a single earthquake (Yagi et al., 2016). By analogy, one can suggest that the migration of magmatic centers from northern Ecuador southward to the Riobamba region during the last ∼800 kyr (Bablon et al., 2019) might have perturbed the development of a unique and high strain fault across the IAV. Growth of the north-south trending active folds in the IAV is poorly constrained in time, though their onset is probably not older than several hundred of thousand years like the magmatic bodies intersecting the PF according to their immature morphology (Alvarado, 2012), and those features could be seen as the product of this interaction. This hypothesis will be tested further.
Conclusion
The primary objective of this work is to contribute to seismic hazard analyses for a densely inhabited area of central Ecuador. To achieve this aim, we provide a detailed description of available and newly acquired data on one major and emblematic fault zone, the Pallatanga fault, and its related structures. This compilation is a first step in building realistic fault models for future Probabilistic Seismic Hazard Analyses in Ecuador, providing updated and comprehensive fault maps and related earthquake geology parameters, such as slip rates, timing and magnitude of past earthquakes and their uncertainties. We are aware of the heterogeneity of the data and further studies will have both (1) to enrich the existing fault database in terms of geology (mapping, trenching, drilling, dating), geophysics (sub-surface profiling), geodesy (GNSS, InSAR) and seismology (near-fault monitoring, relocating clusters) information, and (2) to expand this endeavor to other parts of the same seismotectonic province. This is one goal of the on-going LMI SVAN group, which has developed an ambitious program to investigate the crustal faults. To date, the scarcity of earthquake geology data in Ecuador clearly preclude developing a segmentation model of the Pallatanga fault system like along well-studied fault systems, such as the Wasatch Fault (DuRoss et al., 2016). Yet, recent large earthquakes illustrate that multiple segment ruptures are not rare and that unexpected scenarios with either kinematical or geometrical complex configurations (2010 M7 Darfield: Atzori et al., 2012; 2010 M7.2 El Mayor Cucapah: Fletcher et al., 2014) or distant segments without structural linkage at depth (2016 M7.8 Kaikoura: Hamling et al., 2017) could happen during large strike-slip events.
To test those scenarios in Ecuador, one could use concepts and tools recently developed for Probabilistic Seismic Hazard Analysis that consider potential complexities. For instance, Chartier et al. (2019) developed a method coupling information from seismology and earthquake geology, for example where parameters such as geometry and slip rate are specified for each fault segment. Then, one can relax the rupture segmentation and calculate the rate of multiple segment ruptures based on geological constrain in consistency with seismological datasets. This approach is a relevant way to explore the behavior of the faults of concern.
We suggest that it would be worth to develop similar earthquake geology approaches across the continent of South America, in parallel to geophysical data acquisition. The instrumental and historical record of earthquakes (covering several hundred years at best) and the geodetic measurements, fail to capture alone the behavior of crustal faults, to describe their complete earthquake productivity rate and the long recurrence of large events. Those geological topics are critical knowledge for developing fault models and related seismic hazard analyses, beside seismology and geodesy, whatever the targets (national scale maps or site-specific studies).
Data Availability Statement
The GIS-handled 4 m-resolution digital elevation model (DEM-4m) is from SigTierras of the Ecuadorian Ministry of Agriculture, Quito (http://ide.sigtierras.gob.ec/geoportal/). The dataset generated during the study is compiled in Supplementary Material as a catalog of localized observations.
Author Contributions
SB, LA, AA, and HJ: conception and design of the work. SB, LA, AA, HJ, PE, and JC: acquisition, analysis, and interpretation of the data. SB, LA, AA, MB, XQ, PS, and J-LL: drafting the work and revising it critically.
Funding
Field work expenses were funded by the “Laboratoire Mixte International Séismes et Volcans des Andes du Nord” of “Institut pour la Recherche et le Développement” (LMI-SVAN), by the “Agence Nationale pour la Recherche” project ANR-REMAKE (N°ANR-15-CE04-0004), and by proper funds from the “Institut de Radioprotection et Sûreté Nucléaire.”
Conflict of Interest
The authors declare that the research was conducted in the absence of any commercial or financial relationships that could be construed as a potential conflict of interest.
The reviewer CG declared a past co-authorship with one of the authors LA to the handling Editor.
Acknowledgments
The Instituto Geofisico, Escuela Politecnica Nacional de Quito provided logistical help and scientific support. The Envisat ASAR data were provided by European Space Agency through category-1 project 13248.
Supplementary Material
The Supplementary Material for this article can be found online at: https://www.frontiersin.org/articles/10.3389/feart.2020.00193/full#supplementary-material
Footnotes
References
Alvarado, A. (2012). Néotectonique et Cinématique de la Déformation Continentale en Equateur. PhD thesis, University of Grenoble Alpes, France.
Alvarado, A., Audin, L., Nocquet, J. M., Jaillard, E., Mothes, P., Jarrín, P., et al. (2016). Partitioning of oblique convergence in the Northern Andes subduction zone: migration history and the present-day boundary of the North Andean Sliver in Ecuador. Tectonics 25, 1048–1065. doi: 10.1002/2016TC004117
Alvarado, A., Audin, L., Nocquet, J. M., Lagreulet, S., Segovia, M., Font, Y., et al. (2014). Active tectonics in quito, Ecuador, assessed by geomorphological studies, GPS data, and crustal seismicity. Tectonics 33, 67–83. doi: 10.1002/2012TC003224
Angster, S. J., Wesnousky, S. G., Figueiredo, P. M., Owen, L. A., and Hammer, S. J. (2018). Late quaternary slip rates for faults of the central walker Lane (Nevada, USA): spatiotemporal strain release in a strike-slip fault system. Geosphere 15, 1460–1478. doi: 10.1130/GES02088.1
Araujo, S. (2016). Travel Time Tomography of the Crust and the Mantle Beneath Ecuador From Data of the National Seismic Network. PhD thesis, University of Grenoble Alpes, France.
Aspden, J. A., and Litherland, M. (1992). The geology and Mesozoic collisional history of the cordillera real. Ecuador. Tectonophysics 205, 187–204. doi: 10.1016/0040-1951(92)90426-7
Atzori, S., Tolomei, C., Antonioli, A., Merryman Boncori, J. P., Bannister, S., Trasatti, E., et al. (2012). The 2010-2011 Canterbury, New Zealand, seismic sequence: multiple source analysis from InSAR data and modeling. J. Geophys. Res. Solid Earth 117:B08305. doi: 10.1029/2012JB009178
Bablon, M., Quidelleur, X., Samaniego, P., Le Pennec, J.-L., Audin, L., Jomard, H., et al. (2019). Interactions between volcanism and geodynamics in the southern termination of the Ecuadorian arc. Tectonophysics 751, 54–72. doi: 10.1016/j.tecto.2018.12.010
Baize, S., Audin, L., Winter, T., Alvarado, A., Pilatasig Moreno, L., Taipe, M., et al. (2015). Paleoseismology and tectonic geomorphology of the Pallatanga fault (Central Ecuador), a major structure of the South-American crust. Geomorphology 23, 14–28. doi: 10.1016/j.geomorph.2014.02.030
Barberi, F., Belloni, L., Ferrari, L., Pasquare, G., Previtali, F., Tibaldi, A., et al. (1988). “Riesgo Sismico,” in Tech. Rep. Coca-Codo Sinclair Project, (Quito), 294.
Beauval, C., MarinieÌre, J., Yepes, H., Audin, L., Nocquet, J. M., Alvarado, A., et al. (2018). A new seismic hazard model for Ecuador. Bull. Seismol. Soc. Am. 108, 1443–1464. doi: 10.1785/0120170259
Beauval, C., Yepes, H., Bakun, W. H., Egred, J., Alvarado, A., and Singaucho, J.-C. (2010). Locations and magnitudes of historical earthquakes in the sierra of Ecuador (1587-1996). Geophys. J. Int. 181, 1613–1633. doi: 10.1111/j.1365-246X.2010.04569.x
Beauval, C., Yepes, H., Palacios, P., Segovia, M., Alvarado, A., Font, Y., et al. (2013). An earthquake catalog for seismic hazard assessment in Ecuador. Bull. Seismol. Soc. Am. 103, 773–786. doi: 10.1785/0120120270
Bernard, B., and Andrade, D. (2016). Volcanes cuaternarios del Ecuador continental. ReasearchGate doi: 10.13140/RG.2.1.3851.3683
Biasi, G. P., and Wesnousky, S. G. (2016). Steps and gaps in ground ruptures: empirical bounds on rupture propagation. Bull. Seismol. Soc. Am. 106, 1110–1124. doi: 10.1785/0120150175
Biasi, G. P., and Wesnousky, S. G. (2017). Bends and ends of surface ruptures. Bull. Seismol. Soc. Am. 107, 2543–2560. doi: 10.1785/0120160292
Bronk Ramsey, C. (2009). Bayesian analysis of radiocarbon dates. Radiocarbon 51, 337–360. doi: 10.1017/S0033822200033865
Champenois, J., Baize, S., Vallée, M., Jomard, H., Alvarado, A., Espin, P., et al. (2017). Evidences of surface rupture associated with a low-magnitude (M w 5.0) shallow earthquake in the Ecuadorian andes. J. Geophys. Res. Solid Earth. 122, 8446–8458. doi: 10.1002/2017JB013928
Champenois, J., Pinel, V., Baize, S., Audin, L., Jomard, H., Hooper, A., et al. (2014). Large-scale inflation of tungurahua volcano (Ecuador) revealed by persistent scatterers SAR interferometry. Geophys. Res. Lett. 41, 5821–5828. doi: 10.1002/2014GL060956
Chartier, T., Scotti, O., and Lyon-Caen, H. (2019). SHERIFS – open-source code for computing earthquake rates in fault systems and constructing hazard models. Seismol. Res. Lett. 90, 1678–1688. doi: 10.1785/0220180332
Clapperton, C. M. (1990). Glacial and volcanic geomorphology of the chimborazo-carihuairazo massif, Ecuadorian andes. Trans. R. Soc. Edinb. Earth Sci. 81, 91–116. doi: 10.1017/S0263593300005174
Deniaud, Y., Baby, P., Basile, C., Ordoñez, M., Montenegro, G., and Mascle, G. (1999). Ouverture et évolution tectono-sédimentaire du golfe de guayaquil : bassin d’avant-arc néogène et quaternaire du sud des andes équatoriennes. Comptes Rendus Académie Sci. 328, 181–187. doi: 10.1016/S1251-8050(99)80094-9
Dumont, J. F., Santana, E., and Vilema, W. (2005b). Morphologic evidence of active motion of the Zambapala Fault, Gulf of Guayaquil (Ecuador). Geomorphology 65, 223–239. doi: 10.1016/j.geomorph.2004.09.003
Dumont, J. F., Santana, E., Vilema, W., Pedoja, K., Ordóñez, M., Cruz, M., et al. (2005a). Morphological and microtectonic analysis of quaternary deformation from puná and santa clara islands, gulf of guayaquil, Ecuador (South America). Tectonophysics 399, 331–350. doi: 10.1016/j.tecto.2004.12.029
Dumont, S., Klinger, Y., Socquet, A., Doubre, C., and Jacques, E. (2017). Magma influence on propagation of normal faults: evidence from cumulative slip profiles along Dabbahu-Manda-Hararo rift segment (Afar, Ethiopia). J. Struct. Geol. 95, 48–59. doi: 10.1016/j.jsg.2016.12.008
DuRoss, C. B., Personius, S. F., Crone, A. J., Olig, S. S., Hylland, M. D., Lund, W. R., et al. (2016). Fault segmentation: new concepts from the Wasatch Fault Zone, Utah, USA. J. Geophys. Res. Solid Earth 121, 1131–1157. doi: 10.1002/2015JB012519
Farbod, Y., Shabanian, E., Bellier, O., Abbassi, M. R., Braucher, R., Benedetti, L., et al. (2016). Spatial variations in late Quaternary slip rates along the doruneh fault system (Central Iran). Tectonics 35, 386–406. doi: 10.1002/2015TC003862
Field, E. H., Arrowsmith, R. J., Biasi, G. P., Bird, P., Dawson, T. E., Felzer, K. R., et al. (2014). Uniform California earthquake rupture forecast, version 3 (UCERF3)–the time-independent model. Bull. Seismol. Soc. Am. 104, 1122–1180. doi: 10.1785/0120130164
Fiorini, E., and Tibaldi, A. (2012). Quaternary tectonics in the central Interandean valley, Ecuador: fault-propagation folds, transfer faults and the cotopaxi volcano. Glob. Planet. Change 90–91, 87–103. doi: 10.1016/j.gloplacha.2011.06.002
Fletcher, J. M., Teran, O. J., Rockwell, T. K., Oskin, M. E., Hudnut, K. W., Mueller, K. J., et al. (2014). Assembly of a large earthquake from a complex fault system: surface rupture kinematics of the 4 April 2010 El Mayor–Cucapah (Mexico) Mw 7.2 earthquake. Geosphere 10, 797–827. doi: 10.1130/GES00933.1
Font, Y., Segovia, M., Vaca, S., and Theunissen, T. (2013). Seismicity patterns along the Ecuadorian subduction zone: new constraints from earthquake location in a 3-D a priori velocity model. Geophys. J. Int. 193, 263–286. doi: 10.1093/gji/ggs083
Frankel, K. L., Dolan, J. F., Owen, L. A., Ganev, P., and Finkel, R. C. (2011). Spatial and temporal constancy of seismic strain release along an evolving segment of the Pacific–North America plate boundary. Earth Planet. Sci. Lett. 304, 565–576. doi: 10.1016/j.epsl.2011.02.034
Gold, R., dePolo, C., Briggs, R., Crone, A., and Gosse, J. (2013). Late quaternary slip-rate variations along the warm springs valley fault system, northern walker lane, california–nevada border. Bull. Seismol. Soc. Am. 103, 542–558. doi: 10.1785/0120120020
Haeussler, P. J., Schwartz, D. P., Dawson, T. E., Stenner, H. D., Lienkaemper, J. J., Sherrod, B., et al. (2004). Surface rupture and slip distribution of the denali and totschunda faults in the 3 November 2002 M 7.9 Earthquake, Alaska. Bull. Seismol. Soc. Am. 94, S23–S52. doi: 10.1785/0120040626
Hall, M. L., Samaniego, P., Le Pennec, J. L., and Johnson, J. B. (2008). Ecuadorian andes volcanism: a review of late pliocene to present activity. J. Volcanol. Geotherm. Res. 176, 1–6. doi: 10.1016/j.jvolgeores.2008.06.012
Hamling, I. J., Hreinsdóttir, S., Clark, K., Elliott, J., Liang, C., Fielding, E., et al. (2017). Complex multifault rupture during the 2016 Mw=7.8 Kaikôura earthquake. New Zealand. Science 356, eaam7194. doi: 10.1126/science.aam7194
Hughes, R. A., and Pilatasig, L. F. (2002). Cretaceous and Tertiary terrane accretion in the cordillera occidental of the andes of Ecuador. Tectonophysics 345, 29–48. doi: 10.1016/S0040-1951(01)00205-0
Jaillard, E., Lapierre, H., Ordoñez, M., Álava, J. T., Amórtegui, A., and Vanmelle, J. (2009). Accreted oceanic terranes in Ecuador: southern edge of the Caribbean Plate? Geol. Soc. Lond. Spec. Publ. 328, 469–485. doi: 10.1144/SP328.19
Kearse, J., Little, T. A., Dissen, R. J. V., Barnes, P. M., Langridge, R., Mountjoy, J., et al. (2018). Onshore to offshore ground-surface and seabed rupture of the jordan–kekerengu–needles fault network during the 2016 Mw 7.8 Kaikôura Earthquake, New Zealand. Bull. Seismol. Soc. Am. 108, 1573–1595. doi: 10.1785/0120170304
Kendrick, E., Bevis, M., Smalley, R., Brooks, B., Vargas, R. B., Laurıìa, E., et al. (2003). The Nazca–South America Euler vector and its rate of change. J. South Am. Earth Sci. 16, 125–131. doi: 10.1016/S0895-9811(03)00028-2
Kirby, E., Anandakrishnan, S., Phillips, F., and Marrero, S. (2008). Late Pleistocene slip rate along the Owens Valley fault, eastern California. Geophys. Res. Lett. 35:L01304. doi: 10.1029/2007GL031970
Klinger, Y., Xu, X., Tapponnier, P., Van der Woerd, J., Lasserre, C., and King, G. (2005). High-resolution satellite imagery mapping of the surface rupture and slip distribution of the Mw 7.8, 14 November 2001 Kokoxili Earthquake, Kunlun Fault, Northern Tibet, China. Bull. Seismol. Soc. Am. 95, 1970–1987. doi: 10.1785/0120040233
Langridge, R. M., Rowland, J., Villamor, P., Mountjoy, J., Townsend, D. B., Nissen, E., et al. (2018). Coseismic rupture and preliminary slip estimates for the papatea fault and its role in the 2016 Mw 7.8 Kaikôura, New Zealand, Earthquake. Bull. Seismol. Soc. Am. 108, 1596–1622. doi: 10.1785/0120170336
Lavenu, A., Winter, T., and Dávila, F. (1995). A pliocene-quaternary compressional basin in the interandean depression, central Ecuador. Geophys. J. Int. 121, 279–300. doi: 10.1111/j.1365-246X.1995.tb03527.x
Lin, A., Ouchi, T., Chen, A., and Maruyama, T. (2001). Co-seismic displacements, folding and shortening structures along the Chelungpu surface rupture zone occurred during the 1999 Chi-Chi (Taiwan) earthquake. Tectonophysics 330, 225–244. doi: 10.1016/S0040-1951(00)00230-4
Litchfield, N. J., Villamor, P., Dissen, R. J. V., Nicol, A., Barnes, P. M., Barrell, D. J. A., et al. (2018). Surface rupture of multiple crustal faults in the 2016 Mw 7.8 Kaikôura, New Zealand, Earthquake. Bull. Seismol. Soc. Am. 108, 1496–1520. doi: 10.1785/0120170300
Longo, R., and Baldock, J. (1982). National geological map of the republic of Ecuador (including Galàpagos Province). Dir. Gen. Geol. Min.
Marinière, J., Nocquet, J.-M., Beauval, C., Champenois, J., Audin, L., Alvarado, A., et al. (2020). Geodetic evidence for shallow creep along the Quito fault. Ecuador. Geophys. J. Int. 220, 2039–2055. doi: 10.1093/gji/ggz564
McCalpin J. (ed.) (2009). Paleoseismology, International Geophysics Series, 2nd Edn. Burlington, MA: Academic Press.
Nocquet, J.-M., Jarrin, P., Vallée, M., Mothes, P. A., Grandin, R., Rolandone, F., et al. (2016). Supercycle at the Ecuadorian subduction zone revealed after the 2016 Pedernales earthquake. Nat. Geosci. 10, 145–149. doi: 10.1038/ngeo2864
Nocquet, J.-M., Villegas-Lanza, J. C., Chlieh, M., Mothes, P. A., Rolandone, F., Jarrin, P., et al. (2014). Motion of continental slivers and creeping subduction in the northern Andes. Nat. Geosci. 7, 287–291. doi: 10.1038/ngeo2099
Pindell, J. L., and Kennan, L. (2009). Tectonic evolution of the Gulf of Mexico, Caribbean and northern South America in the mantle reference frame: an update. Geol. Soc. Lond. Spec. Publ. 328, 1–55. doi: 10.1144/SP328.1
Reimer, P. J., Bard, E., Bayliss, A., Beck, J. W., Blackwell, P. G., Ramsey, C. B., et al. (2013). IntCal13 and Marine13 radiocarbon age calibration Curves 0–50,000 Years cal BP. Radiocarbon 55, 1869–1887. doi: 10.2458/azu_js_rc.55.16947
Rodgers, D. W., and Little, T. A. (2006). World’s largest coseismic strike-slip offset: the 1855 rupture of the Wairarapa Fault, New Zealand, and implications for displacement/length scaling of continental earthquakes. J. Geophys. Res. Solid Earth. 111:B12408. doi: 10.1029/2005JB004065
Samaniego, P., Barba, D., Robin, C., Fornari, M., and Bernard, B. (2012). Eruptive history of Chimborazo volcano (Ecuador): a large, ice-capped and hazardous compound volcano in the Northern Andes. J. Volcanol. Geotherm. Res. 22, 33–51. doi: 10.1016/j.jvolgeores.2012.01.014
Semanante, P. A. D. (1950). Sismologia del Terremoto de PELILEO. Quito.: Casa de la Cultura Ecuatoriana.
Soulas, J. P., Eguez, A., Yepes, H., and Perez, H. (1991). Tectonica activa y riesgo sismico. Bol. Geol. Ecuat. 2, 3–11.
Spikings, R. A., and Crowhurst, P. V. (2004). U–Th)/He thermochronometric constraints on the late Miocene–Pliocene tectonic development of the northern cordillera real and the interandean depression, Ecuador. J. South Am. Earth Sci. 17, 239–251. doi: 10.1016/j.jsames.2004.07.001
Tibaldi, A., Ferrari, L., and Pasquarè, G. (1995). Landslides triggered by earthquakes and their relations with faults and mountain slope geometry: an example from Ecuador. Geomorphology 11, 215–226. doi: 10.1016/0169-555X(94)00060-5
Tibaldi, A., Rovida, A., and Corazzato, C. (2007). Late quaternary kinematics, slip-rate and segmentation of a major cordillera-parallel transcurrent fault: the cayambe-afiladores-sibundoy system, NW South America. J. Struct. Geol. 29, 664–680. doi: 10.1016/j.jsg.2006.11.008
Vaca, S., Vallée, M., Nocquet, J.-M., and Alvarado, A. (2019). Active deformation in Ecuador enlightened by a new waveform-based catalog of earthquake focal mechanisms. J. South Am. Earth Sci. 93, 449–461. doi: 10.1016/j.jsames.2019.05.017
Vallejo, C., Spikings, R. A., Luzieux, L., Winkler, W., Chew, D., and Page, L. (2006). The early interaction between the caribbean plateau and the NW South American Plate: caribbean Plateau-South American Plate collision. Terra Nova. 18, 264–269. doi: 10.1111/j.1365-3121.2006.00688.x
Wells, D. L., and Coppersmith, K. J. (1994). New empirical relationships among magnitude, rupture length, rupture width, rupture area, and surface displacement. Bull. Seismol. Soc. Am. 84, 974–1002.
Winter, T., Avouac, J.-P., and Lavenu, A. (1993). Late Quaternary kinematics of the Pallatanga strike-slip fault (Central Ecuador) from topographic measurements of displaced morphological features. Geophys. J. Int. 115, 905–920. doi: 10.1111/j.1365-246X.1993.tb01500.x
Witt, C., Bourgois, J., Michaud, F., Ordoñez, M., Jiménez, N., and Sosson, M. (2006). Development of the Gulf of Guayaquil (Ecuador) during the Quaternary as an effect of the North Andean block tectonic escape. Tectonics 25:TC3017. doi: 10.1029/2004TC001723
Woodward and Clyde Consultant, (1981). “San francisco, cal., and USA,. lnvestigaciones para los estudios del riesgo sismico del sitio de la presa Agoyan,” in Technical Report for the Agoyan Dam Project, lnstituto Ecuadoriano de Electrification (INECEL), Quito.
Yagi, Y., Okuwaki, R., Enescu, B., Kasahara, A., Miyakawa, A., and Otsubo, M. (2016). Rupture process of the 2016 kumamoto earthquake in relation to the thermal structure around Aso volcano. Earth Planets Space 68, 118. doi: 10.1186/s40623-016-0492-3
Yepes, H., Audin, L., Alvarado, A., Beauval, C., Aguilar, J., Font, Y., et al. (2016). A new view for the geodynamics of Ecuador: implication in seismogenic source definition and seismic hazard assessment. Tectonics 35, 1249–1279. doi: 10.1002/2015TC003941
Yu, G., Xu, X., Klinger, Y., Diao, G., Chen, G., Feng, X., et al. (2010). Fault-scarp features and cascading-rupture model for the Mw 7.9 wenchuan earthquake, eastern tibetan plateau, chinafault-scarp features and cascading-rupture model for the Mw 7.9 wenchuan earthquake. Bull. Seismol. Soc. Am. 100, 2590–2614. doi: 10.1785/0120090255
Keywords: active tectonics, earthquake, Pallatanga fault, Andes, Ecuador
Citation: Baize S, Audin L, Alvarado A, Jomard H, Bablon M, Champenois J, Espin P, Samaniego P, Quidelleur X and Le Pennec J-L (2020) Active Tectonics and Earthquake Geology Along the Pallatanga Fault, Central Andes of Ecuador. Front. Earth Sci. 8:193. doi: 10.3389/feart.2020.00193
Received: 10 March 2020; Accepted: 14 May 2020;
Published: 09 June 2020.
Edited by:
Federica Ferrarini, G. d’Annunzio University of Chieti-Pescara, ItalyReviewed by:
Alessandro Tibaldi, University of Milano-Bicocca, ItalyChristoph Grützner, Friedrich Schiller University Jena, Germany
Copyright © 2020 Baize, Audin, Alvarado, Jomard, Bablon, Champenois, Espin, Samaniego, Quidelleur and Le Pennec. This is an open-access article distributed under the terms of the Creative Commons Attribution License (CC BY). The use, distribution or reproduction in other forums is permitted, provided the original author(s) and the copyright owner(s) are credited and that the original publication in this journal is cited, in accordance with accepted academic practice. No use, distribution or reproduction is permitted which does not comply with these terms.
*Correspondence: Stéphane Baize, stephane.baize@irsn.fr