Trends in Land Use, Irrigation, and Streamflow Alteration in the Mississippi River Alluvial Plain
 Lindsey M. W. Yasarer
 Jason M. Taylor
 James R. Rigby2
 - 1Water Quality and Ecology Research Unit, National Sedimentation Laboratory, Agricultural Research Service, United States Department of Agriculture, Oxford, MS, United States
- 2Watershed Physical Processes Research Unit, National Sedimentation Laboratory, Agricultural Research Service, United States Department of Agriculture, Oxford, MS, United States
The Mississippi River Alluvial Plain is a critical region for agricultural production in the United States, providing the majority of the nation's rice, catfish, and cotton. Although it is a humid region, high agricultural yields are maintained through irrigation from groundwater and surface water sources. Heavy groundwater extraction has led to cones of depression in the alluvial aquifer in both Arkansas and Mississippi. This study explores the link between increasing irrigation and streamflow alteration within the alluvial plain. Changing land use patterns were evaluated utilizing the USDA Census of Agriculture datasets to determine changes in land-use, irrigation, and crop yield from 1969 to 2017. Temporal land use patterns set the background for the analysis of sixteen long-term streamflow records from the USGS, which were assessed using the Indicators of Hydrologic Alteration (IHA) software to determine changes in low flow patterns in rivers overlying the Mississippi River Valley alluvial aquifer. Most streamflow records had significant hydrologic alteration with respect to low flow conditions, including higher frequency of low flow events, lower annual minima, or a declining base flow index. Changes in streamflow coincide with areas of massive increases in irrigated cropland area. This study provides further context for the tradeoffs between intensive agricultural production and agroecosystem sustainability.
Introduction
The Mississippi River Alluvial Plain (MAP), including most of eastern Arkansas, western Mississippi, and northeastern Louisiana, relies on agricultural production to drive the regional economy (Alhassan et al., 2019). The region is intensively farmed in row-crops that produce significant yields of corn (Zea mays L.) and soybean [Glycine max (L.) Merr.], and accounts for ~17–20% of total cotton (Gossypium hirsutum L.) and 69–78% of total rice (Oryza sativa L.) production nationally. Mississippi also returns the highest aquaculture yields in the nation (U.S. Department of Agriculture, National Agricultural Statistics Service, 2019). Although it is a humid region, the MAP receives most of its rainfall outside of the growing season, and thus producers rely on irrigation from either groundwater or surface water to reduce crop stress and to optimize crop yields (Massey et al., 2017). As of 2000, the Mississippi River Valley Alluvial Aquifer (MRVAA) was ranked third in the nation for total water withdrawals (35 billion liters per day) with more than 98% of this water used for irrigation (Maupin and Barber, 2005). Withdrawals from the MRVAA began as early as the 1900s but increased markedly between 1970 and 1980 (Evett et al., 2003; Clark et al., 2011). As a result of increased irrigation withdrawals, cones of depression have developed in both the Arkansas and Mississippi delta regions, which has drawn attention to the sustainability of groundwater resources for continued irrigation and agricultural economic development (Barlow and Clark, 2011; Kresse et al., 2014).
Generally, as groundwater levels decline, historically gaining streams receiving groundwater contributions may become losing, perched streams, where surface water seeps through an unsaturated zone into the aquifer (Brunner et al., 2011). Changes in surface water and groundwater exchange, or increased pumping of surface water for irrigation, can alter natural flow regimes in streams and rivers, contributing to decreased baseflow, as well as more frequent and extreme low flow conditions. The effect of groundwater extraction on nearby streamflow has been studied and modeled extensively (Hunt, 1999; Butler and Tsou, 2001; Fox and Durnford, 2003). However, there are spatial and temporal variations in surface-groundwater connectivity that are difficult to assess due to heterogeneity of streambed properties, variations in depth to groundwater both spatially and temporally, and disparities in infiltration rates due to depth and width of surface water bodies. However, it is generally accepted that a widening cone of depression in groundwater surface levels can increase the length of river disconnected from the aquifer and therefore alter baseflow (Brunner et al., 2011).
In addition to influencing water availability for agriculture, decreasing baseflow and increased number of extreme low flow events can have detrimental effects on aquatic ecosystems and associated biodiversity. Previous studies have demonstrated declines in fish species richness and abundance in conjunction with shifts from species with more specialized requirements to more tolerant generalist species as summer baseflows decline (Freeman and Marcinek, 2006; McCargo and Peterson, 2010; Buchannan et al., 2017). Similarly, loss of surface water flow and groundwater connectivity can result in significant declines in mussel richness and abundance due to habitat loss and thermal requirements (Golladay et al., 2004; Galbraith et al., 2010). In addition to dewatering critical habitat including shallow margins, coarse woody debris, riffle habitats (Bowen et al., 1998; Freeman et al., 2001; McCargo and Peterson, 2010), decreasing baseflows increase biological impairment by reducing dissolved oxygen, increasing water temperature, concentrating contaminants, and increasing diel swings in pH which can increase bioavailability and toxicity of contaminants to aquatic organisms (Brooks et al., 2006; Garvey et al., 2007; Carlisle et al., 2011; Valenti et al., 2011). Outside of river channels, loss of groundwater connectivity in riparian areas can produce mesic conditions that decrease riparian vegetation species richness, biomass and cover, or result in shifts from wetland to upland plant assemblages (Hanlon et al., 1998; Williams et al., 1999). River morphology can also be altered by these low flow conditions as the bed load will be deposited as flow velocity decreases, which may alter physical habitats and streambed substrate (Hauer et al., 2013).
The link between increasing crop irrigation, either with surface or groundwater, and streamflow alteration is often tenuous, due to information that may be lacking about the system—either irrigation usage, groundwater conditions, or the physical connection between groundwater and surface water bodies. However, several recent studies explore the concept of increased groundwater pumping and its impact on local streamflow depletion (Killian et al., 2019) and global environmental flow limits (de Graaf et al., 2019). This study evaluates changing land-use patterns in the Mississippi Alluvial Plain (MAP) by utilizing United States Department of Agriculture (USDA) Census of Agriculture datasets to determine changes in land-use, irrigation, and crop yield from 1969 to 2012. We used temporal trends in land use patterns to set the context for analysis of long-term patterns in low flow metrics in rivers overlying the MRVAA using the Indicators of Hydrologic Alteration (IHA) software. Based on conceptual linkages between the increase in irrigated cropland to both increased yield and increased streamflow alteration (Figure 1), we hypothesized that low flow components in MAP streams have been altered and these environmental deficits coincide with declining groundwater levels and increased irrigation demands within the region.
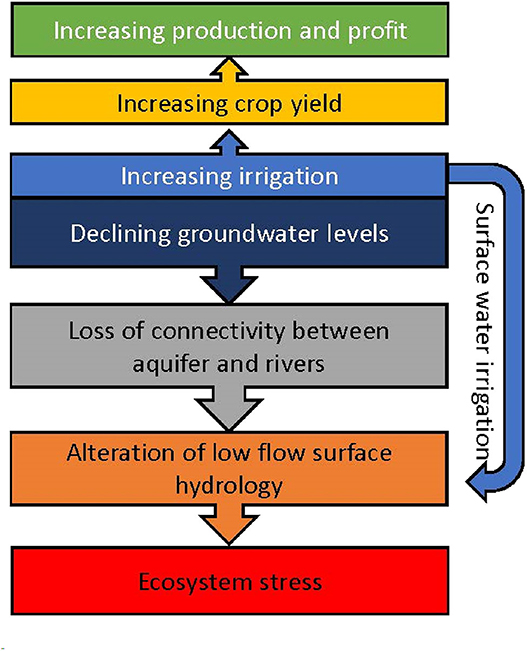
Figure 1. Conceptual diagram outlining the hypothesized costs and benefits of increasing irrigation in the Mississippi Alluvial Plain. The ultimate benefit is increased production and profit, while the ultimate cost is ecosystem stress. This study focuses on the aspects from crop yield to alteration of low flow hydrology.
Methods
Land Use Trend Analysis
We compiled records from the USDA Census of Agriculture including area in total cropland, harvested cropland, land in farms with irrigation, and irrigated cropland from 1969 to 2017 at the county or parish level to evaluate the change in area over time (Census of Agriculture, 1969–2017). In addition, we collected crop area harvested, harvested crop amount, and irrigated crop area for corn for grain, sorghum for grain, winter wheat, rice, upland cotton, and soybeans for each county or parish from 1969 to 2017. The census data was available every 5 years, except from 1974 to 1982 when it was collected every 4 years. The USDA Census of Agriculture is conducted by the USDA National Agricultural Statistics Service (NASS) and includes a complete count of U.S. farms and ranches, rural and urban, where $1,000 or more fruit, vegetables, or food animals were raised or sold. Census data was mapped to demonstrate differences between counties.
We analyzed counties/parishes if they intersected, or were located within, the watershed of a selected USGS gage, or if they were just downstream of a USGS gage. With respect to groundwater, the area of influence may include areas downstream of a surface water gage due to the influence of groundwater withdrawals. We calculated county-level yield for each crop type by dividing the total mass harvested in each county by the harvested area of the respective crop type. Crop mass harvested in the census does not differentiate between irrigated and non-irrigated cropland. We evaluated the difference in yield based on irrigation status utilizing available data from the USDA crop survey, however, only cotton yield was available for Louisiana, Arkansas, and Mississippi in both irrigated and non-irrigated cropland. We calculated the average and standard deviation of yield in the evaluated counties using available years of data to evaluate the effect of irrigation on yield. Availability of data differed by county with most counties providing yield from 1971 to 2018 (U.S. Department of Agriculture, National Agricultural Statistics Service, 2019). The Agricultural Resource Management Survey is conducted by the USDA NASS and includes a sample of farm operators that ensures adequate coverage by station and region.
Stream Gage Selection and Data Preparation
We identified USGS stream gages within the MAP region based on the availability of daily flow records of at least 20 years with minimal gaps (Kennard et al., 2010; Table 1). We utilized the Sunflower River at Sunflower despite a large data gap, as there was a sufficient period of data available before and after the gap, and the gage represented a critical geographic area. We did not fill gaps in the streamflow record. It was challenging to find enough gauges with the same time period of available data; therefore, the data range varied for the gauges in this study. Selected gages were also either unregulated or regulated with diversions for irrigation, as determined by information provided by the USGS StreamStats database (U.S. Geological Survey, 2016). Any gages with major upstream flood control dams were not included in the study, as releases from reservoirs can influence the flow record. To increase comparability between sites, flow was converted to stream yield (mm/day) by dividing by the watershed area provided by the USGS StreamStats website.
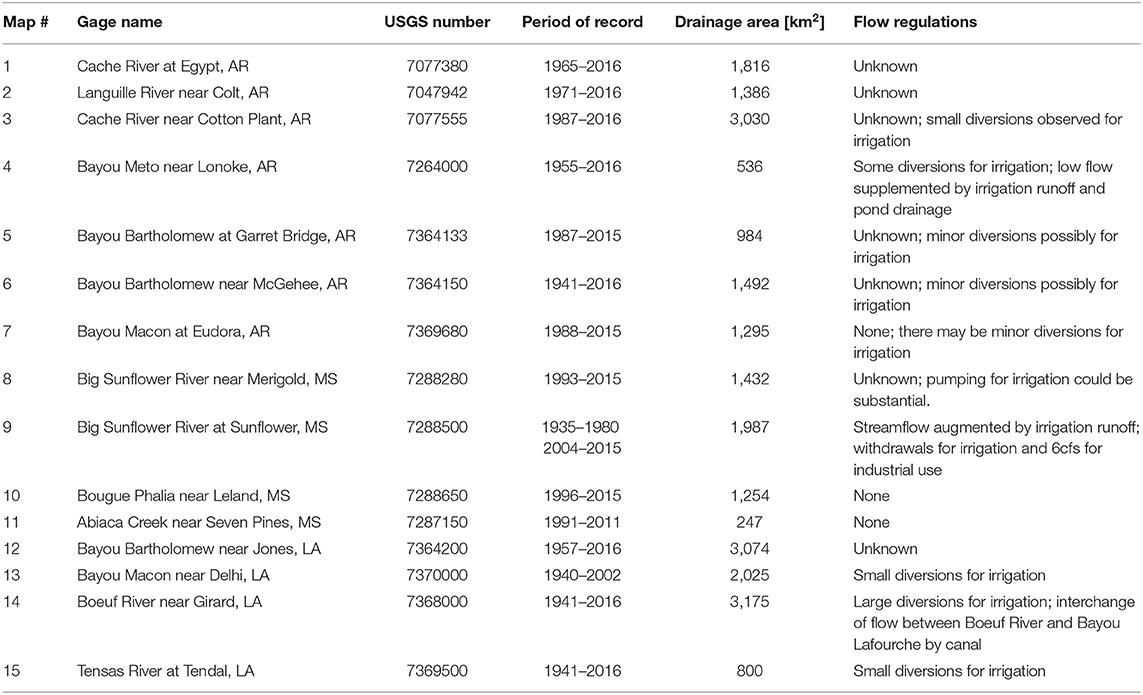
Table 1. USGS gages utilized in study, including period of record, drainage area, and any known flow regulations from the USGS StreamStats program, listed in order from north to south (U.S. Geological Survey, 2016).
Indicators of Hydrologic Alteration (IHA)
We assessed potential differences and trends in selected baseflow metrics over the studied time period representing before and after increasing irrigation withdrawals using Indicators of Hydrologic Alteration (IHA) software version 7.1 (The Nature Conservancy, 2009). The program uses daily hydrologic data to assess 33 ecologically-relevant hydrologic parameters related to five fundamental characteristics of hydrologic regimes: (1) magnitude of mean daily water conditions; (2) magnitude and duration of annual extreme conditions at various time intervals; (3) timing of annual extreme conditions; (4) frequency and duration of high and low pulses, and; (5) rate and frequency of change in conditions (Richter et al., 1996). For all stations, we ran the IHA using daily stream yield (mm/day) for the period of available data using temporal trend analysis. Stream yield was utilized to control for watershed size and allow temporal trends to be comparable across gages. We analyzed time series trends from the IHA, and the number of indicators demonstrating an increase in low flow conditions or decreasing flow levels (i.e., negative monthly flow trends) with a significance level ≤0.05 were summed for each gage to evaluate the degree of alteration occurring across the region. Due to the large number of indicators, not all results are presented. We chose to highlight a subset of IHA metrics that, based on the literature, were hypothesized to respond most strongly to water withdrawals (Carlisle et al., 2011; Kennen et al., 2014). The IHA parameters highlighted in this study include the base flow index, 7 day minimum flows, and the number of days with zero flow per year. Base flow index is calculated as the 7 day minimum flow divided by the annual mean flow. The 7 day minimum flow is the 7 day mean of the annual minima.
For a selected subset of stations, Cache River at Egypt, AR; Languille River near Colt, AR; Big Sunflower River at Sunflower, MS; Boeuf River near Girard, LA; and Tensas River at Tendal, LA, we conducted a comparative analysis using streamflow (cms) to compare low flow metrics between two time periods representing historic, relatively unaltered, flow conditions and current stream flows under increasing irrigation demands. We utilized the results of this two-period analysis to produce flow duration curves for the pre-alteration period (start of record–1986) and the post alteration period (1987–2016), as well as to examine the change in 7-day minimum flow before and after 1987. We chose the year of 1987 as a breakpoint due to the analysis of census data indicating a rise in irrigated cropland area at this time (Figure 3A), as well as evidence that surface and groundwater connectivity began to change at this time in the MRVAA region (Clark et al., 2011; Pugh and Westerman, 2014).
Precipitation Trends and Drought Occurrence
We analyzed regional precipitation trends using the climate division database (nClimDiv) from the National Oceanic and Atmospheric Administration (NOAA) (Vose et al., 2014). Divisions include: northeast, east central, and southeast Arkansas; the upper delta and lower delta in Mississippi; northeast Louisiana; and the Missouri bootheel. Because the period of record varies for the gages, we utilized 1960–2016 as the period to estimate mean precipitation for both the annual and growing season (April–October) time periods, as well as temporal trends over that time period. In addition, we also assessed the occurrence of droughts throughout the 1960–2016 record using the Palmer Drought Severity Index (PDSI). We considered droughts to have occurred in months with PDSI scores less than negative three, which is considered a severe drought.
Results and Discussion
Trends in Land Use, Yield, and Irrigation
County-level census data demonstrated that total cropland and harvested cropland areas have both declined over the period of record from 1969 to 2017. Meanwhile, the amount of irrigated cropland has increased, on average, by 45,000 hectares in all counties analyzed and, in several counties, total irrigated land increased by over 80,000 hectares. In Chicot County, AR, the location of Bayou Macon gage at Eudora, the amount of irrigated land increased 83,000 hectares, a 1,264% increase from 1969 values. Also, in Bolivar County, MS, the location of the Big Sunflower River gage at Merigold, the amount of irrigated land increased 94,000 hectares, or around 541% over 1969 values (Figure 2). From a different perspective, the amount of harvested cropland that was irrigated in the region has increased on average from 11% in 1969 to 69% in 2017 (Figure 2). Increases in irrigated cropland were highest in the southeastern AR with several counties reporting over 90% of all cropland with irrigation in 2017 (Figure 2).
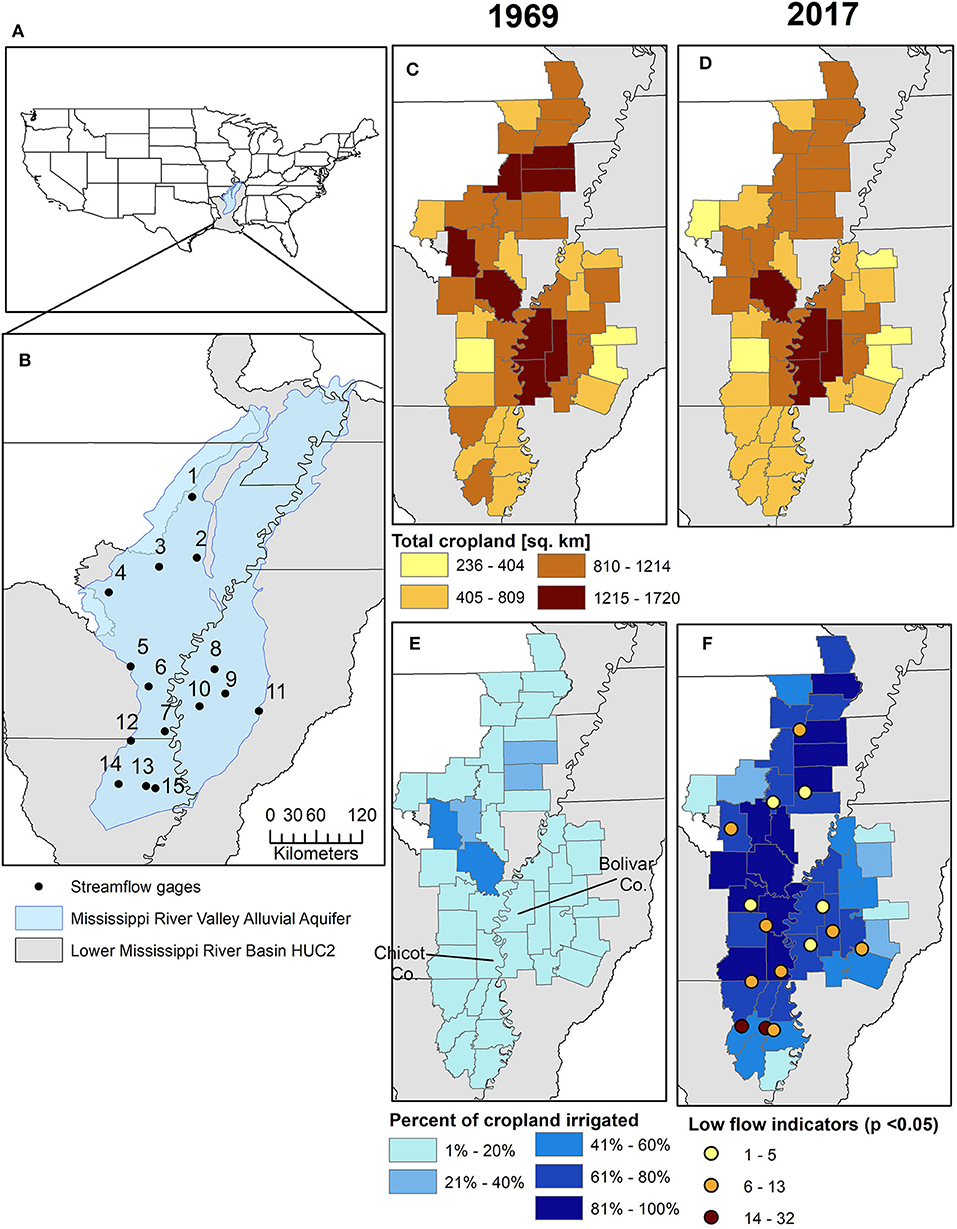
Figure 2. (A) Location of Mississippi Alluvial Plain within the United States; (B) location of gauge locations within Mississippi Alluvial Plain and Lower Mississippi River Basin, numbers correspond to gauge information in Table 1; (C) harvested cropland by county and parish in 1969; (D) and 2017; (E) percent of cropland with irrigation in counties and parishes in 1969; (F) and 2017 with the color of USGS representing the number of low flow indicators with a statistically significant increasing trend.
While the irrigated cropland trend has risen steadily since 1974, land in irrigated farms experienced a large jump in 1978 and then increased more slowly until leveling out around 1992 (Figure 3A). There are ~5 million hectares of land within irrigated farms that are not irrigated, suggesting irrigated cropland areas could increase further if producers expand their irrigation practices to additional land on their farms. One factor contributing to increased irrigated land has been land forming, or precision leveling, which creates a consistent slope to facilitate furrow irrigation and improve surface drainage (Maletic and Hutchings, 1967; Massey et al., 2017). Furrow irrigation is the predominate irrigation application method in the MAP region with 75% of irrigated land in MS and 80% of irrigated land in AR and LA in furrow irrigation (Kebede et al., 2014). Furrow irrigation is known to cause deep percolation losses, as well as tail-water runoff, which result in inefficient use of aquifer water.
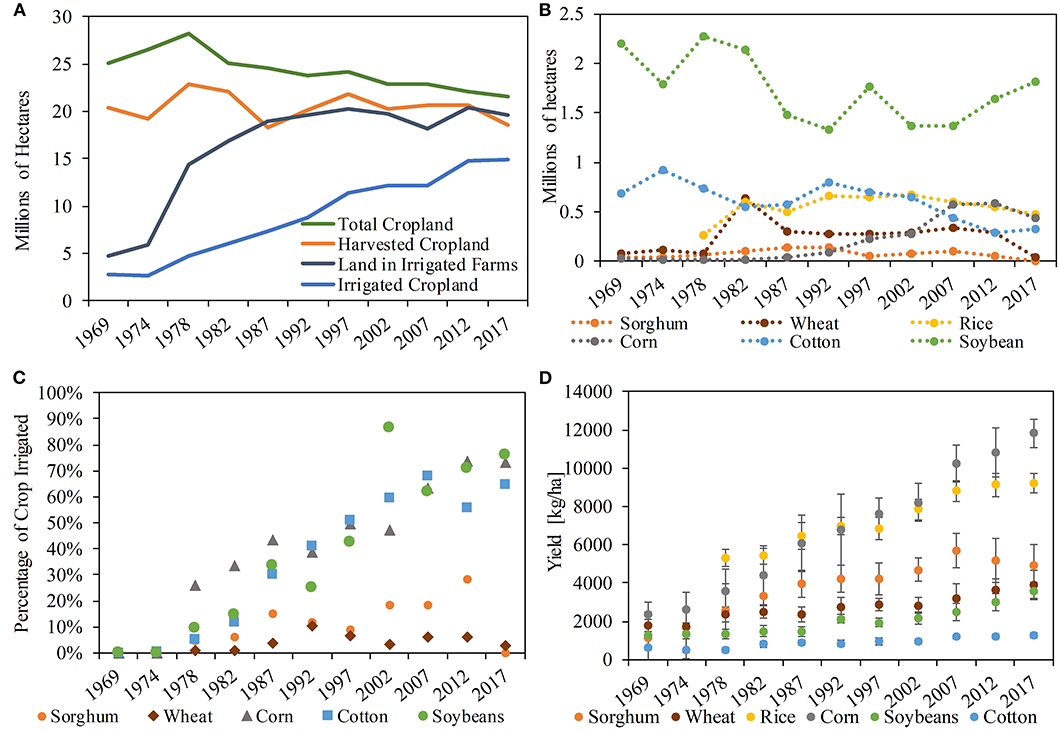
Figure 3. (A) Temporal trends in total cropland, harvested cropland, land in irrigated farms, and irrigated cropland areas from 1969 to 2017 for all counties/parishes examined in study; (B) total crop area by major crop type in all counties/parishes analyzed from 1969 to 2017; (C) percentage of crop irrigated for all counties/parishes studied. Rice is not plotted as irrigation was 100% for all years that crop irrigation status is reported; (D) calculated crop yield using Census of Agriculture data for each major crop type from 1969 to 2017.
Over the period from 1969 to 2017 there were some minor changes in crop types within the study area (Figure 3B). Harvested soybean declined from 1969 to 1992 and then began to increase from 2007 to 2017. Cotton declined from 1992 to 2012, while harvested corn increased during the same time frame. Our analysis demonstrates that corn area increased in most counties within the AR, LA, and MS portions of the MRVVA. Figure 3B demonstrates the change in area for the six major crops analyzed. Slight increases in grain sorghum and winter wheat were also found in most counties until 2012, but area harvested declined in 2017. There was not a consistent trend in growth or decline of rice cropland. Using census data alone, it is impossible to know if changes in crop area are related to access to irrigation. There are a multitude of factors at play in land use choices, among them are commodities prices, suitability of soil, previous land use history, and other socioeconomic and environmental factors (Miller and Plantinga, 1999; Caldas et al., 2016). However, access to irrigation may have allowed planting more water-demanding crops like corn (Smidt et al., 2016), especially when corn prices surged in the mid to late 2000s due to the increase in corn-based ethanol production in the United States (Welch et al., 2010; Gardebroek and Hernandez, 2013). Measured irrigation rates in Mississippi are highest for rice, followed by corn, soybean, and cotton (9,200, 3,100, 2,800, and 1,800 m3 ha−1, respectively; Massey et al., 2017).
While the total amount of cotton and soybean cropland may have decreased, irrigation of these crops has increased consistently throughout the 1980s and 1990s, so that in 2017 the majority of all cotton and soybean harvested within the region was irrigated (Figure 3C). This trend is consistent on a county basis as well; the proportion of soybean area irrigated has increased in all counties. In addition, the harvested mass of soybeans has also increased, even in counties with decreasing planted soybean area, suggesting that irrigation is increasing soybean yields while using less area. In general, yields have increased for all crops over the time period studied (Figure 3D). The greatest increases were seen in corn and grain sorghum, which had 400% and 330% increases in yield from 1969 to 2017, respectively. Winter wheat and cotton yield both increased by about 100%, and soybean yield increased approximately 175%. Rice had the lowest increase in yield, increasing 73% from 1978 to 2017. In addition to trends in increasing irrigated lands, observed increased yield is likely due to a combination of additional factors, including advanced agricultural technologies, genetically modified seed, and changes in planting density (Specht et al., 1999).
It is challenging to tease apart the effect of irrigation on crop yields using census data, as yield and irrigation both increased over time (Figures 3C,D, 4A). Available USDA survey data, which report yield by irrigation status, help provide the missing link between irrigated status and increased yield. In AR, LA, and MS irrigated cotton yield was about 214, 170, and 225 kg/ha higher, respectively, than non-irrigated on average for statewide-reported values (Figure 4). According to these values, irrigation accounts for 23 to 29% of the yield increase. County-level survey data showed similar trends, with an approximate 196–220 kg/ha difference between irrigated and non-irrigated cropland (Figure 4B). Linear trends for irrigated and non-irrigated yields over time seem to have nearly the same slope. This suggests benefits of irrigation for cotton are fixed over time. Yields are not available for other crops of interest in all three states, therefore, we cannot estimate increases in yields of corn or soybeans resulting from increased irrigation in this region. However, the literature demonstrates that irrigation lowers risk of crop damage or failure due to lack of rainfall during the growing season or drought (Massey et al., 2017) and generally does lead to higher yields of corn, soybeans, and cotton (Grissom et al., 1955; Heatherly et al., 1990; Klocke et al., 2011). In this region the majority of rainfall falls outside of the growing season and irrigation is often necessary to meet crop water needs (Kebede et al., 2014).
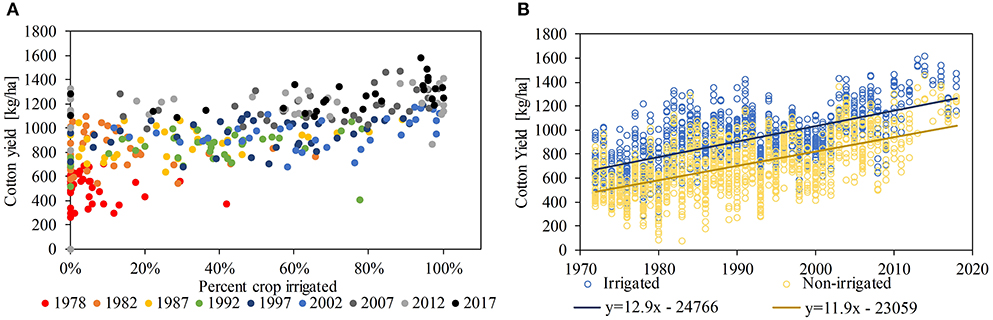
Figure 4. County/Parish cotton yield trends: (A) cotton yield vs. percent crop irrigated from the Census of Agriculture, different years are represented by different color dots; (B) cotton yield vs. time for irrigated (blue) and non-irrigated (yellow) cropland from the survey dataset, the linear trend lines for each dataset are also shown.
USDA Census data provide snapshots of cropping, yield, and irrigation trends throughout time. Together these data provide an overview of long-term regional trends in agriculture; however, it does not provide detailed information on irrigation practices. Therefore, trends in irrigation methods utilized and irrigation rates need to be determined by other means. One clear limitation of utilizing the Census and Survey data are that both datasets rely on self-reported information and values are more likely approximates rather than measured values. Also, the temporal and spatial scale of the Census data can limit analysis of causal relationships amongst variables. Despite the limitations, it was clear that irrigated cropland increased linearly within the MAP region from 1974 to 2017, despite a slight decrease in total cropland. The percentage of major crops like corn, cotton, and soybeans that are irrigated have also clearly increased since 1974 from around 10–20 to 70% in 2017. While the Census data demonstrated that yields of important field crop commodities increased since 1974, most notably a 400% increase in corn yield, they do not provide any co-variables that may help explain the spatial and temporal variation in yield. As we have noted, there are many factors that influence yield and irrigation is only one of them.
Indicators of Hydrologic Alteration Analysis
All the gages studied had at least one statistically significant indicator that demonstrated low flow alteration. The Boeuf River, Bayou Macon, Cache River, and Big Sunflower River at Sunflower sites all demonstrated a large degree of alteration in low flow indicators. Twelve out of the 15 gages demonstrated statistically significant declines in 7 day minimum flows and the base flow index over the period of record (see Table 2). The most significant declines in the base flow index were found at Bayou Macon at Eudora, AR; Boeuf River near Girard, LA; and Big Sunflower River at Sunflower, MS. The USGS Streamstats database indicates that the Boeuf and Sunflower River gages have diversions from irrigation and these may play a role in flow regulation. Most AR and LA gages showed a decline in the base flow index over the period of record, and most of these gages also have diversions present for irrigation (see Table 1). The 7 day minimum flow also showed significant declines for all stations in LA and most stations in AR and MS.
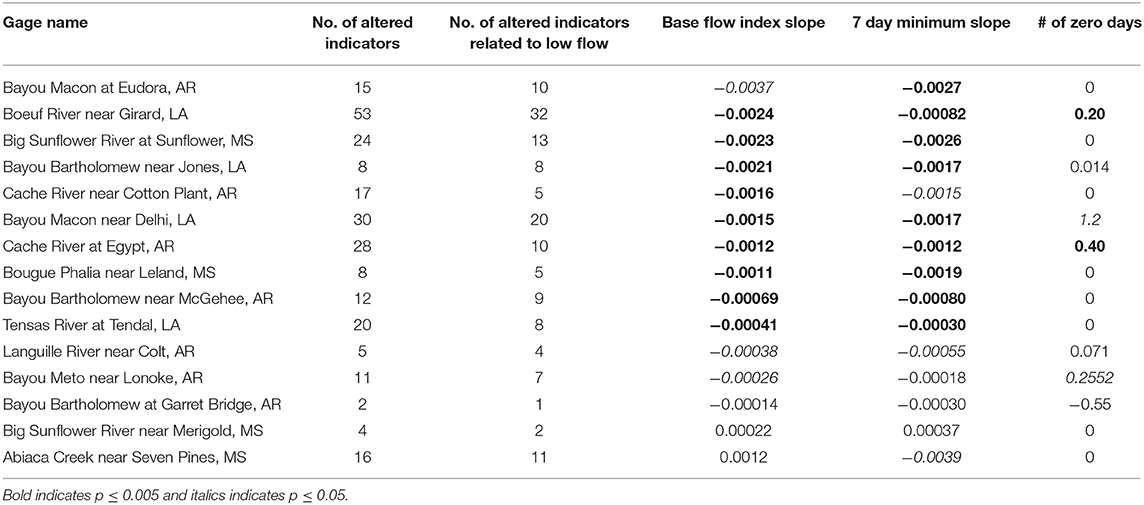
Table 2. Statistics related to the Indicators of Hydrologic Alteration analysis for each gage; gages are listed from most altered to least altered with respect to the slope of the base flow index.
A subset of the gages were selected to show long-term trends in 7 day minimum flows. In Figure 5 it is apparent that the median flow and interannual variability decreased at all sites post-1987. At the Boeuf, Tensas, Cache, and Sunflower sites, minimum flow in recent decades is below the range of natural variation that was seen in the earlier portion of the record. The number of days with zero flow represent a more extreme low flow indicator and was only relevant for seven of the gages (Table 2). Of the seven, five had statistically significant trends including Bayou Macon near Delhi, LA, with a slope of 1.2, and Cache River near Egypt, AR, with a slope of 0.4 (Table 2). Increasing days with zero flow can be detrimental to the aquatic ecosystem and to animals that rely on the rivers as a water source.
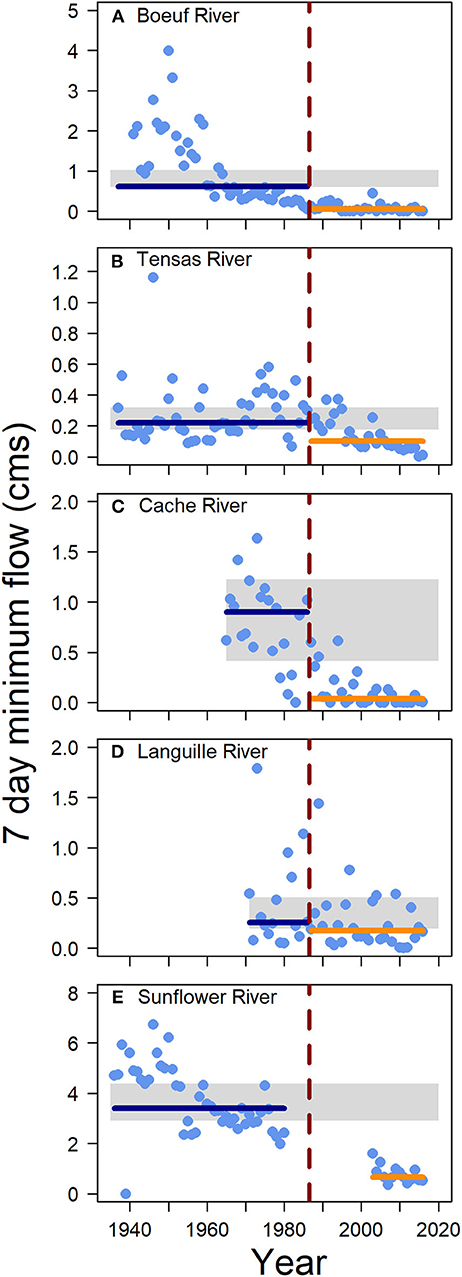
Figure 5. Seven day minimum flow for all available years of data for (A) Boeuf River near Girard, (B) Tensas River near Tendal, (C) Cache River near Egypt, (D) Languille River at Colt, and (E) the Sunflower River at Sunflower gages; dark blue line is the median of values pre-1987 and the orange line is the median of values after and including 1987, gray bar represents the range of natural variability in the data pre-1987.
Flow Duration Curve Analysis
Comparison of flow duration curves before and after 1987 indicated that the degree of flow alteration varied across sites and seasons (Figure 6). We observed significant declines in flow across most of the flow duration curve for all seasons in the Boeuf River (Figures 6A–C). In contrast, strong seasonal patterns were present for the other four rivers. The Tensas, Cache, and Languille all had similar patterns for February flow before and after 1987, while flow for exceedance values between 40 and 100 declined in the Sunflower River post-1987 (Figures 6D,G,J,M). During the growing season (June), the Boeuf had lower cms across the entire exceedance probability distribution, whereas the Cache and Languille Rivers demonstrated a higher degree of alteration at lower flows only (exceedance probability > 40) (Figures 6B,H,K). During June pumping from either groundwater or surface water for irrigation would have begun and irrigation runoff would comprise some of the streamflow in these systems. All locations showed significant flow alteration in October, after harvest, when cumulative groundwater withdrawals for the year would be greatest from pumping throughout the growing season, and stream flows are naturally lower. The Tensas, Cache and Sunflower sites had higher flows at exceedance probabilities <40 and drastic declines at higher exceedance values since 1987 (Figures 6F,I,O). In the Cache River near Egypt, AR and the Boeuf River near Girard, LA both systems have zero flow values about 10% of the time in October after 1987.
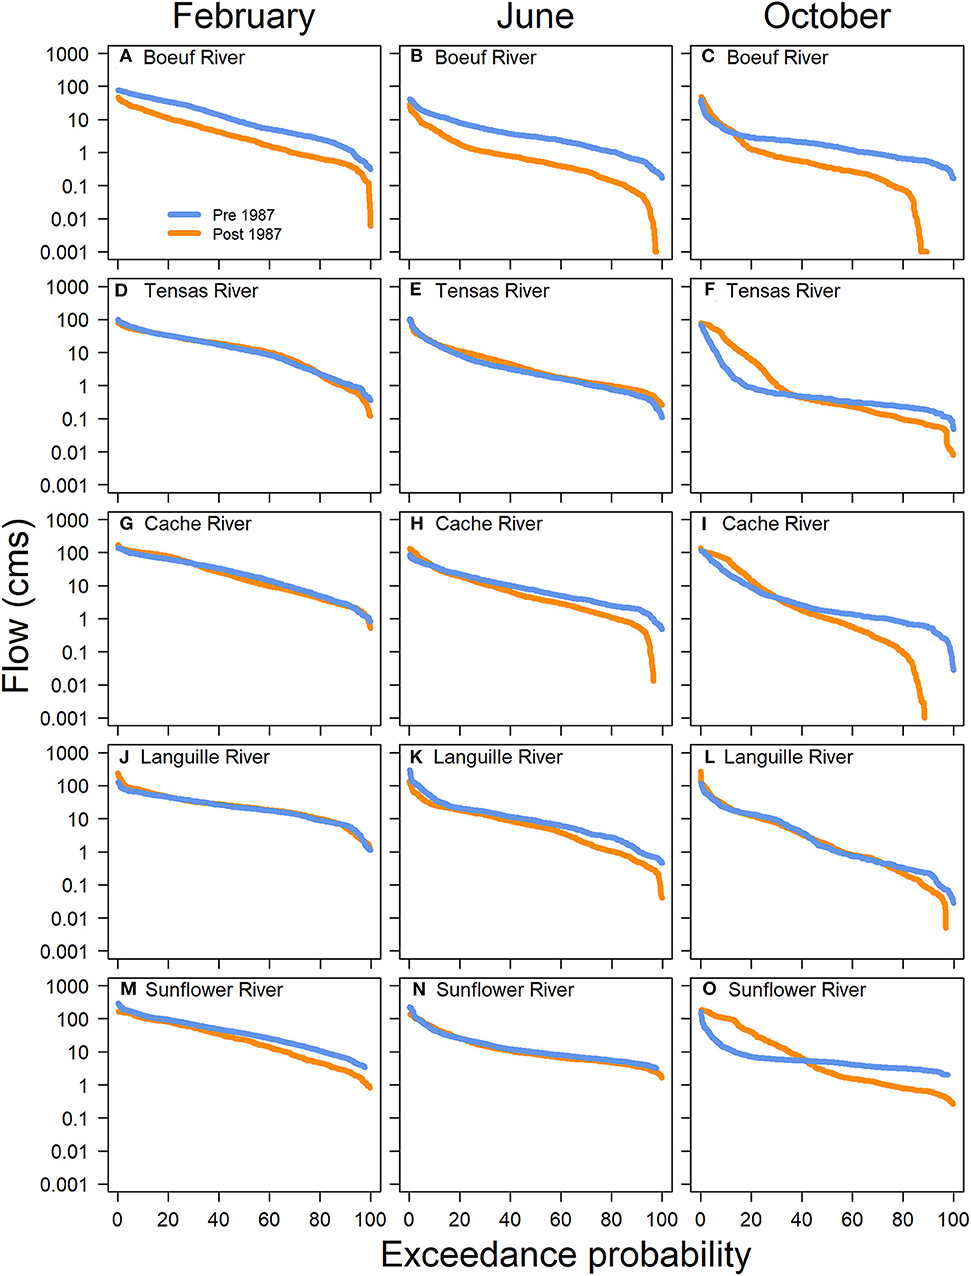
Figure 6. Flow duration curves plotted as flow vs. exceedance probability for February, June, and October flow values for the (A–C) Boeuf River near Girard, (D–F) Tensas River near Tendal, (G–I) Cache River near Egypt, (J–L) Languille River at Colt, and (M–O) the Sunflower River at Sunflower gages. The blue lines represent flows before 1987 and the orange lines represent flow after 1987.
Flow duration curves suggest low flow effects were widespread during the growing season and greatest in October when natural patterns of low flow conditions were combined with cumulative effects of groundwater withdrawals for irrigation during the preceding growing season (Figure 6). The seasonal patterns present in Tensas, Cache and Languille could indicate that low flow effects were due to surface water withdrawals or that groundwater contributions to streamflow were minimal during February both before and after 1987. Recent groundwater measurements showing the depth to water in the alluvial aquifer within the Cache River basin indicate that levels were likely too low for any groundwater connection in recent years (Arkansas Natural Resources Commission, 2015). The Cache River does not have any known regulations but does have small diversions for rice irrigation (Table 1). The Boeuf River station near Girard, LA, does have large diversions for irrigation, which is likely the driving cause of the alteration in the flow duration curves. The Tensas River at Tendal, LA, has small diversions for irrigation upstream from the station. This study was focused on low flow metrics; however, the flow duration curves indicate that high flow events were also altered at some sites due to levee development and stream downgrading, which separate streams from floodplains.
Regional Precipitation Trends and Drought Occurrence
It is unlikely that precipitation is a major factor driving observed patterns in hydrologic alteration within our study region. In fact, evaluation of precipitation trends suggest that mean annual precipitation is slightly increasing in the MAP between 7.8 and 17 mm/decade, and during the growing season it is increasing between 3.8 and 18 mm/decade (nClimDiv; Vose et al., 2014). Mean annual precipitation increased from north to south, with the lowest mean annual precipitation in the Missouri bootheel (1,230 mm) and the highest in northeast Louisiana (1,410 mm). With regard to growing season precipitation, east central Arkansas had the lowest (704 mm) and northeast Louisiana had the highest (732 mm). In general, regional precipitation data showed minimal differences over the time period analyzed and suggest changes in stream minimum flows are more likely associated with groundwater or surface water withdrawals, rather than changing climatic patterns. These findings are similar to what Killian et al. (2019) also found in Mississippi. With respect to drought, the monthly PDSI scores indicate that droughts occurred in the MAP region in 1963, 1967, 1986, 2000, and 2010–2012. The longest drought occurred in 2010 immediately following some of the wettest months in the record, which occurred in late 2009. The occurrence of drought also does not seem to be driving the trends in streamflow, which at several locations show consistent decreases in flow regardless of drought conditions (e.g., Boeuf River, Tensas River, Cache River, and Sunflower River). However, drought may further stress systems if occurring during periods when flow is already below normal or cause extreme low flows (i.e., zero flow). Irrigation rates are also likely to increase during a drought, which may further drawdown groundwater and surface water bodies, but at the same time could contribute return flow to regional streams and rivers. Therefore, there are both positive and negative feedbacks between climate, irrigation, and streamflow.
Evidence of Groundwater Decline
USGS groundwater reports indicate there have been significant declines in groundwater levels across the AR counties examined in this study. In the Boeuf-Tensas area there was an average change of −1.42 m over the period from 2004 to 2014 (Arkansas Natural Resources Commission, 2015). Similarly, 43 out of 50 wells analyzed showed declines, and 40 of these wells had average declines >0.3 m per year. In the St. Francis study area, there was an average decline in groundwater levels of 0.68 m. The counties in the St. Francis study area are upstream of the Languille River near Colt, AR, which showed evidence of hydrologic alteration related to low flow. Crowley's Ridge divides the St. Francis area (eastern side) from the Cache study area (western area).
The Cache area has much steeper declines in groundwater levels, with an average change of −1.5 m between 2004 and 2014. The Cache area has been continuously designated as a critical ground water area since 2009. Surface interpolations of the alluvial aquifer show a cone of depression occurring in the Cache River basin, with the deepest portion 29 to 44 m below surface. Comparatively, in the areas outside of the cones of depression, depth to water is 0 to 13 m. Without knowledge of riverbed material and infiltration capability, it is not possible to know the extent that depth to groundwater affects surface water resources in the declining areas, although modeling studies and data collected in the region do suggest rivers are losing water to recharge the alluvial aquifer (Schrader, 2010; Pugh and Westerman, 2014).
In MS, a cone of depression has developed in the alluvial aquifer in the center of the delta region below the Sunflower River. This area is key to agricultural production in MS. Groundwater withdrawals have been associated with streamflow depletion in the Sunflower River at Sunflower and the Bogue Phalia River near Leland gages (Barlow and Clark, 2011; Barlow and Leake, 2012). Similarly, a recent study has found significant reductions in baseflow that correlate with areas of extensive groundwater declines in the MAP (Killian et al., 2019).
Groundwater withdrawals in northeastern LA have also increased over time in most of the studied parishes for use in rice and other crop irrigation (White, 2019a,b,c,d,e,f,g). Modeling simulations show decreasing groundwater levels in these parishes over the period from 2004 to 2016 (Karakullukcu, 2018).
As groundwater supplies reach critical levels from increased irrigation demand, solutions such as improved irrigation efficiency, increased use of on-farm reservoirs and/or irrigation tailwater recovery systems, and managed aquifer recharge, have all been suggested to help slow or reverse the decline of groundwater levels in the MRVAA (Barlow and Clark, 2011; Reba et al., 2017). On-farm reservoirs and tailwater recovery systems have been used in eastern AR for several decades (Yaeger et al., 2018) and increasingly in Mississippi since 2014 (Prince Czarnecki et al., 2016; Brock et al., 2019). While these practices may reduce groundwater withdrawals, it is unclear if they will be sufficient to improve groundwater levels (Barlow and Clark, 2011).
Uncertainties
This study suggests, as others have also indicated, that surface water flow signatures are changing in the MAP (Killian et al., 2019). These changes coincide with increases in irrigated cropland area throughout the region and declines in groundwater levels. Several of the gages studied have known diversions for irrigation (Table 1), and for others it is unknown. Landowners in AR have the rights to riparian reasonable use if their land touches a water body. Consequently, permission or a permit are not required from the government for a riparian owner to use surface water (Evett et al., 2003). Therefore, it is challenging to know how much surface water is utilized for irrigation and to tease apart the proportion of flow alteration due to surface withdrawals vs. groundwater decline and leaking streambeds. Published irrigation water withdrawals from 2005 indicate that most recorded irrigation withdrawals are from groundwater. Yet, AR counties Lonoke, Desha, Chicot, and Arkansas record 22–42% of total irrigation water withdrawals from surface water sources (Holland, 2007).
Louisiana parishes studied also indicate surface water as part of total irrigated water use. Surface water bodies utilized include Bayou Macon, the Boeuf River, and the Tensas River. However, the proportion of surface water used is ~10 to 20% of total water usage for irrigation (White, 2019a-g). In MS, declining baseflow at the Big Sunflower River at Sunflower has been linked to the groundwater cone of depression in the central MS Delta (Killian et al., 2019). However, as Killian et al. (2019) mentions, the region's natural hydrology is heavily modified due to agriculture and streamflow-control structures; therefore, results need to be interpreted cautiously. Similarly, indicators of hydrologic alteration suggest that streamflow has been altered in many locations, but there is not enough evidence to delineate linkages between low flow alteration and groundwater/surface water withdrawals for agriculture. To reduce uncertainties, more data collection about streambed properties, groundwater movement, and surface water withdrawals would improve understanding of the driving forces of streamflow alteration.
Conclusions
The MAP is a rich agricultural landscape that supports a strong regional economy. Data compiled from the Census of Agriculture suggest total cropland area has decreased, yet productivity has increased due to increasing yields and intensification of agricultural production. Irrigation is one of the many factors that lead to high yields and intense production in this region. Data compiled from the Census of Agriculture indicate irrigated cropland has increased drastically from 1969 to 2017. Water use reports indicate both groundwater and surface water are utilized for irrigation in this region; however, groundwater is the predominant water source. Reliance on groundwater from the alluvial aquifer has led to cones of depression in AR and MS, as well as declining levels in LA. Stream gage records from stations overlying the alluvial aquifer show evidence of hydrologic alteration over time, including declining base flow index, increased number of low flow events and decreasing low flow values, as well as altered flow duration curves during the growing and harvest seasons. Streamflow alteration seems to be a function of both ground and surface water irrigation.
The coupled trends in groundwater decline and streamflow alteration present significant future challenges for sustaining agricultural production in the region, while also protecting natural resources and associated biodiversity. As more producers utilize ground and surface water resources for irrigation to increase production, water resources will likely continue to decline. Efforts are already underway in the MAP region to study the alluvial aquifer, to quantify irrigation withdrawals, and to examine options for reducing withdrawals through irrigation efficiency or increased recharge to the aquifer (Barlow and Clark, 2011). Further studies in Mississippi and Arkansas are exploring infiltration basins and tailwater recovery reservoirs to either increase groundwater recharge or to utilize captured runoff for irrigation (Reba et al., 2017; Yaeger et al., 2018; Brock et al., 2019). Future studies in the region will examine utilizing excess surface water during the winter and spring to enhance aquifer recharge or to optimize storage for irrigation. Slowing, or even reversing, the decline in groundwater levels will require a combination of creative engineering and agronomic water management solutions.
Our results suggest that there is an inherent trade off in increasing production via irrigation as declining water resources will result in less profit for future generations and stress to aquatic ecosystems that may be irreversible. Providing further evidence for environmental impacts of increased irrigation in the region may assist policy makers and decision makers when evaluating strategies to improve water management.
Data Availability Statement
The datasets generated for this study are available on request to the corresponding author.
Author Contributions
LY conceived the study, organized databases, performed data analysis, and wrote the first draft of the manuscript. LY, JT, JR, and ML contributed to design of the study. JT prepared figures and wrote sections of the manuscript. All authors contributed to manuscript revision, read, and approved the submitted version.
Conflict of Interest
The authors declare that the research was conducted in the absence of any commercial or financial relationships that could be construed as a potential conflict of interest.
Acknowledgments
We acknowledge Jay Rao and Lucas Leeper who assisted in data collection for this project. This work was improved through discussion with Mary Yaeger, and revisions from Matt Moore, Henrique Momm, and two reviewers. This research was a contribution from the Long-Term Agroecosystem Research (LTAR) network. LTAR was supported by the United States Department of Agriculture. Mention of trade names or commercial products in this publication is solely for the purpose of providing specific information and does not imply recommendation or endorsement by the USDA. USDA is an equal opportunity provider and employer.
References
Alhassan, M., Lawrence, C. B., Richardson, S., and Pindilli, E. J. (2019). The Mississippi Alluvial Plain Aquifers: an Engine for Economic Activity: U.S. Geological Survey Fact Sheet, 2019–3003. U.S. Geological Survey.
Arkansas Natural Resources Commission (2015). Arkansas Groundwater Protection and Management Report for 2014: A Supplement to the Arkansas Water Plan.
Barlow, J. R. B., and Clark, B. R. (2011). Simulation of Water-Use Conservation Scenarios for the Mississippi Delta Using an Existing Regional Groundwater Flow Model. U.S. Geological Survey Scientific Investigation Report 2011-5019. U.S. Geological Survey
Barlow, P. M., and Leake, S. A. (2012). Streamflow Depletion by Wells: Understanding and Managing the Effects of Groundwater Pumping on Streamflow. U.S. Geological Survey Circular. Reston, VA: U.S. Geological Survey.
Bowen, Z. H., Freeman, M. C., and Bovee, K. D. (1998). Evaluation of generalized habitat criteria for assessing impacts of altered flow regimes on warmwater fishes. Trans. Am. Fish. Soc. 127, 455–468.
Brock, M. L., Tagert, M. L. M., Paz, J. O., and Yasarer, L. (2019). “Characterizing surface water use for irrigation in the Mississippi Delta,” in Proceedings of the 2019 ASABE Annual International Meeting (Boston, MA).
Brooks, B. W., Riley, T. M., and Taylor, R. D. (2006). Water quality of effluent-dominated ecosystems: ecotoxicological, hydrological, and management considerations. Hydrobiologia 556, 365–379. doi: 10.1007/s10750-004-0189-7
Brunner, P., Cook, P. G., and Simmons, C. T. (2011). Disconnected surface water and groundwater: from theory to practice. Ground Water 49, 460–467. doi: 10.1111/j.1745-6584.2010.00752.x
Buchannan, B. P., Auerbach, D. A., McManamay, R. A., Taylor, J. M., Flecker, A. S., Archibald, J. A., et al. (2017). Environmental flows in the context of unconventional natural gas development in the Marcellus Shale. Ecol. Appl. 27, 37–55. doi: 10.1002/eap.1425
Butler, J. J. Jr., Zlotnik, V. A., and Tsou, M. S. (2001). Drawdown and stream depletion produced by pumping in the vicinity of a partially penetrating stream. Ground Water 39, 651–659. doi: 10.1111/j.1745-6584.2001.tb02354.x
Caldas, M. M., Bergtold, J. S., Peterson, J. M., and Earnhart, D. H. (2016). Land-use choices: the case of conservation reserve program (CRP) re-enrollment in Kansas, USA. J. Land Use Sci. 11, 579–594. doi: 10.1080/1747423X.2016.1215563
Carlisle, D. M., Wolock, D. M., and Meador, M. R. (2011). Alteration of streamflow magnitudes and potential ecological consequences: a multiregional assessment. Front. Ecol. Environ. 9:53. doi: 10.1890/100053
Census of Agriculture. (1969–2017). National Agricultural Statistics Service. Washington, DC: United States Department of Agriculture. Available online at: https://www.nass.usda.gov/AgCensus/index.php (accessed August 10, 2019).
Clark, B. R., Hart, R. M., and Gurdak, J. J. (2011). Groundwater availability of the Mississippi embayment. US Geological Survey Professional Paper (Reston, VA).
de Graaf, I. E. M., Gleeson, T., van Beek, L. P. H., Sutanudjaja, E. H., and Bierkens, M. F. P. (2019). Environmental flow limits to global groundwater pumping. Nature 574, 90–94. doi: 10.1038/s41586-019-1594-4
Evett, S., Carman, D., and Bucks, D. (2003). “Expansion of irrigation in the Mid-South United States: water allocation and research issues,” in Proceedings of the 2nd International Conference on Irrigation and Drainage, Water for a Sustainable World – Limited Supplies and Expanding Demand (Phoenix, AZ, 247–260.
Fox, G. A., and Durnford, D. S. (2003). Unsaturated hyporheic zone flow in stream/aquifer conjunctive systems. Adv. Water Resour. 26, 989–1000. doi: 10.1016/S0309-1708(03)00087-3
Freeman, M. C., Bowen, Z. H., Bovee, K. D., and Irwin, E. R. (2001). Flow and habitat effects on juvenile fish abundance in natural and altered flow regimes. Ecol. Appl. 11, 179–190. doi: 10.1890/1051-0761(2001)011[0179:FAHEOJ]2.0.CO;2
Freeman, M. C., and Marcinek, P. A. (2006). Fish assemblage responses to water withdrawals and water supply reservoirs in Piedmont streams. Environ. Manage. 38, 435–450. doi: 10.1007/s00267-005-0169-3
Galbraith, H. S., Spooner, D. E., and Vaughn, C. C. (2010). Synergistic effects of regional climate patterns and local water management on freshwater mussel communities. Biol. Conserv. 143, 1175–1183. doi: 10.1016/j.biocon.2010.02.025
Gardebroek, C., and Hernandez, M. A. (2013). Do energy prices stimulate food price volatility? Examining volatility transmission between US oil, ethanol and corn markets. Energy Econ. 40, 119–129. doi: 10.1016/j.eneco.2013.06.013
Garvey, J. E., Whiles, M. R., and Streicher, D. (2007). A hierarchical model for oxygen dynamics in streams. Can. J. Fish. Aquatic Sci. 64, 1816–1827. doi: 10.1139/f07-144
Golladay, S. W., Gagnon, P., Kearns, M., Battle, J. M., and Hicks, D. W. (2004). Response of freshwater mussel assemblages (Bivalvia: Unionidae) to a record drought in the Gulf Coastal Plain of southwestern Georgia. J. North Am. Benthol. Soc. 23, 494–506. doi: 10.1899/0887-3593(2004)023<0494:ROFMAB>2.0.CO;2
Grissom, P., Raney, W. A., and Hogg, P. (1955). Crop Response to Irrigation in the Yazoo-Mississippi Delta. Mississippi State College Agricultural Experiment Station.
Hanlon, T. C., Williams, C. E., and Moriarity, W. J. (1998). Species composition of soil seed banks of Allegheny Plateau riparian forests. J. Torrey Bot. Soc. 125, 199–215. doi: 10.2307/2997218
Hauer, C., Unfer, G., Holzmann, H., Schmutz, S., and Habersack, H. (2013). The impact of discharge change on physical instream habitats and its response to river morphology. Clim. Change 116, 827–850. doi: 10.1007/s10584-012-0507-4
Heatherly, L. G., Wesley, R. A., and Elmore, C. D. (1990). Corn, sorghum, and soybean response to irrigation in the Mississippi River Alluvial Plain. Crop Sci. 30, 665–672. doi: 10.2135/cropsci1990.0011183X003000030038x
Holland, T. W. (2007). Water Use in Arkansas, 2005. Scientific Investigations Report 2007–5241, U.S. Geological Survey.
Hunt, B. (1999). Unsteady stream depletion from ground water pumping. Ground Water 37, 98–102. doi: 10.1111/j.1745-6584.1999.tb00962.x
Karakullukcu, R. (2018). Groundwater modeling for Mississippi river alluvial aquifer of Northeastern Louisiana (Master's thesis). Louisiana State University, Baton Rouge, LA, United States.
Kebede, H., Fisher, D. K., Sui, R., and Reddy, K. N. (2014). Irrigation methods and scheduling in the Delta region of Mississippi: current status and strategies to improve irrigation efficiency. Am. J. Plant Sci. 5, 2917–2928. doi: 10.4236/ajps.2014.520307
Kennard, M. J., Mackay, S. J., Pusey, B. J., Olden, J. D., and Marsh, N. (2010). Quantifying uncertainty in estimation of hydrologic metrics for ecohydrological studies. River Res. Appl. 26, 137–156. doi: 10.1002/rra.1249
Kennen, J. G., Riskin, M. L., and Charles, E. G. (2014). Effects of streamflow reductions on aquatic macroinvertebrates: linking groundwater withdrawals and assemblage response in southern New Jersey streams, USA. Hydrol. Sci. J. 59, 545–561. doi: 10.1080/02626667.2013.877139
Killian, C. D., Asquith, W. H., Barlow, J. R. B., Bent, G. C., Kress, W. H., Barlow, P. M., et al. (2019). Characterizing groundwater and surface-water interaction using hydrograph-separation techniques and groundwater-level data throughout the Mississippi Delta, USA. Hydrogeol. J. 27, 2167–2179. doi: 10.1007/s10040-019-01981-6
Klocke, N. L., Currie, R. S., Tomsicek, D. J., and Koehn, J. (2011). Corn yield response to deficit irrigation. Trans. ASABE 54, 931–940. doi: 10.13031/2013.37118
Kresse, T. M., Hays, P. D., Merriman, K. R., Gillip, J. A., Fugitt, D. T., Spellman, J. L., et al. (2014). Aquifers of Arkansas – Protection, Management, and Hydrologic and Geochemical Characteristics of Groundwater Resources in Arkansas. Scientific Investigations Report 2014–5149, U.S. Geological Survey.
Maletic, J. T., and Hutchings, T. B. (1967). “Selection and classification of irrigable land,” in: Irrigation of Agricultural Lands, eds R. M. Hagan, H. R. Haise, T. W. Edminster (Madison, WI: ASA Agronomy Monograph, 125–173.
Massey, J. H., Stiles, C. M., Epting, J. W., Powers, R. S., Kelly, D. B., Bowling, T. H., et al. (2017). Long-term measurements of agronomic crop irrigation made in the Mississippi delta portion of the lower Mississippi river valley. Irrigation Sci. 35, 297–313. doi: 10.1007/s00271-017-0543-y
Maupin, M. A., and Barber, N. L. (2005). Estimated Withdrawals From Principal Aquifers in the United States. U.S. Geological Survey Circular. Reston, VA: U.S. Geological Survey.
McCargo, J. W., and Peterson, J. T. (2010). An evaluation of the influence of seasonal base flow and geomorphic stream characteristics on Coastal Plain stream fish assemblages. Trans. Am. Fish. Soc. 139, 29–48. doi: 10.1577/T09-036.1
Miller, D. J., and Plantinga, A. J. (1999). Modeling land use decisions with aggregate data. Am. J. Agric. Econ. 81, 180–194. doi: 10.2307/1244459
Prince Czarnecki, J. M., Omer, A. R., and Dyer, J. L. (2016). Quantifying capture and use of tailwater recovery systems. J. Irrig. Drainage Eng. 143:05016010. doi: 10.1061/(ASCE)IR.1943-4774.0001124
Pugh, A. L., and Westerman, D. A. (2014). Mean annual, seasonal, and monthly precipitation and runoff in Arkansas, 1951-2011. U. S. Geol. Survey Sci. Invest. Rep. 49:20145006. doi: 10.3133/sir20145006
Reba, M. L., Massey, J. H., Adviento-Borbe, M. A., Leslie, D., Yaeger, M. A., Anders, M., et al. (2017). Aquifer depletion in the Lower Mississippi River Basin: challenges and solutions. J. Contemp. Water Res. Educ. 162, 128–139. doi: 10.1111/j.1936-704X.2017.03264.x
Richter, B. D., Baumgartner, J. V., Powell, J., and Braun, D. P. (1996). A method for assessing hydrologic alteration within ecosystems. Conserv. Biol. 10, 1163–1174. doi: 10.1046/j.1523-1739.1996.10041163.x
Schrader, T. P. (2010). Water levels and selected water quality conditions in the Mississippi River Valley alluvial aquifer in eastern Arkansas, 2008. U. S. Geol. Survey Sci. Invest. Rep. 71:20105140. doi: 10.3133/sir20105140
Smidt, S. J., Haacker, E. M. K., Kendall, A. D., Deines, J. M., Pei, L., Cotterman, K. A., et al. (2016). Complex water management in modern agriculture: trends in the water-energy-food nexus over the High Plains Aquifer. Sci. Total Environ. 566–577, 988–1001. doi: 10.1016/j.scitotenv.2016.05.127
Specht, J. E., Hume, D. J., and Kumudini, S. V. (1999). Soybean yield potential – a genetic and physiological perspective. Crop Sci. 39, 1560–1570. doi: 10.2135/cropsci1999.3961560x
U.S. Department of Agriculture National Agricultural Statistics Service. (2019). Quick Stats. c1971. Washington, DC. Available online at: https://quickstats.nass.usda.gov/ (accessed August 10, 2019).
U.S. Geological Survey (2016). StreamStats. c2016. Available online at: http://streamstats.usgs.gov (accessed February 01, 2018).
Valenti, T. W., Taylor, J. M., Back, J. A., King, R. S., and Brooks, B. W. (2011). Influence of drought and total phosphorus on diel pH in wadeable streams: implications for ecological risk assessment of ionizable contaminants. Integr. Environ. Assess. Manage. 7, 636–647. doi: 10.1002/ieam.202
Vose, R. S., Applequist, S., Durre, I., Menne, M. J., Williams, C. N., Fenimore, C., et al. (2014). Improved historical temperature and precipitation time series for U.S. climate divisions. J. Appl. Meteorol. Climatol. 53, 1232–1251. doi: 10.1175/JAMC-D-13-0248.1
Welch, H. L., Green, C. T., Rebich, R. A., Barlow, J. R. B., and Hicks, M. B. (2010). Unintended Consequences of Biofuel Production – The Effects of Large-Scale Crop Conversion on Water Quality and Quantity. Open-File Report 2010–1229, U.S. Geological Survey.
White, V. E. (2019a). Water Resources of East Carroll Parish, Louisiana: U. S. Geological Survey Fact Sheet 2019–3014. U.S. Geological Survey.
White, V. E. (2019b). Water Resources of Franklin Parish, Louisiana: U. S. Geological Survey Fact Sheet 2019–3021. U.S. Geological Survey.
White, V. E. (2019c). Water Resources of Madison Parish, Louisiana: U. S. Geological Survey Fact Sheet 2019–3018. U.S. Geological Survey.
White, V. E. (2019d). Water Resources of Morehouse Parish, Louisiana: U. S. Geological Survey Fact Sheet 2018–3068. U.S. Geological Survey.
White, V. E. (2019e). Water Resources of Richland Parish, Louisiana: U.S. Geological Survey Fact Sheet 2019–3005. U.S. Geological Survey.
White, V. E. (2019f). Water Resources of Tensas Parish, Louisiana: U.S. Geological Survey Fact Sheet 2019–3004. U.S. Geological Survey.
White, V. E. (2019g). Water Resources of West Carroll Parish, Louisiana: U.S. Geological Survey Fact Sheet 2018–3069. U.S. Geological Survey.
Williams, C. E., Moriarity, W. J., Walters, G. L., and Hill, L.. (1999). Influence of inundation potential and forest overstory on the ground-layer vegetation of Allegheny Plateau riparian forests. Am. Midland Nat. 141, 323–338.
Yaeger, M. A., Massey, J. H., Reba, M. L., Adviento-Borbe, M., and Arlene, A. (2018). Trends in the construction of on-farm irrigation reservoirs in response to aquifer decline in eastern Arkansas: implications for conjunctive water resource management. Agric. Water Manage. 208, 373–383. doi: 10.1016/j.agwat.2018.06.040
Keywords: irrigation, streamflow, groundwater, land use, Mississippi, Arkansas, Louisiana
Citation: Yasarer LMW, Taylor JM, Rigby JR and Locke MA (2020) Trends in Land Use, Irrigation, and Streamflow Alteration in the Mississippi River Alluvial Plain. Front. Environ. Sci. 8:66. doi: 10.3389/fenvs.2020.00066
Received: 06 December 2019; Accepted: 07 May 2020;
Published: 05 June 2020.
Edited by:
Mark A. Drummond, United States Geological Survey (USGS), United StatesReviewed by:
Elzbieta Antczak, University of Łódz, PolandJennifer Anna Maria Koch, University of Oklahoma, United States
Copyright © 2020 Yasarer, Taylor, Rigby and Locke. This is an open-access article distributed under the terms of the Creative Commons Attribution License (CC BY). The use, distribution or reproduction in other forums is permitted, provided the original author(s) and the copyright owner(s) are credited and that the original publication in this journal is cited, in accordance with accepted academic practice. No use, distribution or reproduction is permitted which does not comply with these terms.
*Correspondence: Lindsey M. W. Yasarer, lindsey.yasarer@usda.gov