Uranium Budget and Leaching in Swiss Agricultural Systems
 Moritz Bigalke1*
  Martin Imseng1 Stephan Schneider1
  Lorenz Schwab1,2
  Matthias Wiggenhauser3,4 Armin Keller5
  Michael Müller5
  Emmanuel Frossard3
  Wolfgang Wilcke6
- 1Institute of Geography, University of Bern, Bern, Switzerland
- 2Department of Environmental Geosciences, Centre for Microbiology and Environmental Systems Science, University of Vienna, Vienna, Austria
- 3Institute of Agricultural Sciences, ETH Zürich, Zurich, Switzerland
- 4Institut des Sciences de la Terre, CRNS, Université Grenoble-Alpes, Gières, France
- 5Swiss Soil Monitoring Network (NABO), Agroscope, Zurich, Switzerland
- 6Institute of Geography and Geoecology, Karlsruhe Institute of Technology (KIT), Karlsruhe, Germany
Many mineral P fertilizers contain toxic uranium (U) in high concentrations. When the fertilizers are applied to agricultural sites, U can either accumulate in the soil or leach to ground and surface waters. We analyzed the U fluxes at three arable and three grassland agricultural sites on the Swiss plateau for 1 year. We calculated all inputs and outputs to the soils, modeled the speciation of U in the soil solution and investigated the possible leaching of U along preferential flow paths. We found that all sites showed positive U budgets (+0.9–6.6 g ha–1 y–1), indicating an accumulation of U. However, the accumulation of U was low and a doubling of U concentration in the surface soil would need 850–2,660 years assuming today’s U fluxes. Mineral P fertilizers were the quantitatively most important input, followed by manure application and mineral weathering (only important in the soils developed on limestone). While at sites with slightly acidic pH only little U (<0.01 μg L–1) was leached, the U leaching increased at neutral pH values, because of the formation of carbonato-U complexes. In all soil solutions, the U concentrations (≤0.8 μg L–1) were below legal threshold values and comparable to local drinking and surface waters. We found no indication for enhanced U leaching along preferential flow paths.
Introduction
Mineral P fertilizers are regularly applied to many agricultural sites, although they often inadvertently contain uranium (U) in high concentrations. Depending on the soil conditions and agricultural practices, mineral P fertilizer-derived U might accumulate in the soil and affect soil health or leach to ground- and surface waters (Birke and Rauch, 2008; Huhle et al., 2008; Schnug and Lottermoser, 2013). As a consequence, the U may end up in drinking water, which is the major source for human uptake of toxic U (65–95% of total U uptake, Schnug, 2012).
Mineral P fertilizers are supposed to be the main source of anthropogenic U for agricultural soils. Mineral P fertilizers are produced from phosphate rocks of igneous or sedimentary origin. Sedimentary phosphorites can be heavily enriched in U (up to 280 mg kg–1; McLaughlin et al., 1996; Ulrich et al., 2014). During the process of mineral P fertilizer production, U is further enriched in the fertilizers by up to 150% (Sattouf, 2007). Different types of mineral P fertilizers may have different U concentrations depending on the source and production process. Furthermore, manure, sewage sludge application, and deposition from the atmosphere can be additional U sources for soils (Kabata-Pendias and Mukherjee, 2007; Kratz et al., 2008; Bottcher et al., 2012). Kratz et al. (2008) found that U inputs from manure or sewage sludge would cause 13–45% of the U inputs which would be caused by applying the same amount of P with mineral P fertilizers. The total U input via fertilization ranges between 2.3 and 23 g ha–1 y–1 (Kratz et al., 2008). Plants take up little U from soils, but U in soil can sorb to roots and enter the food chain via root vegetables (Kratz et al., 2008; ATSDR, 2013). However, humans ingest negligible amounts of U from plant products (Schnug, 2012; Schnug and Lottermoser, 2013).
Generally, concentrations of U in drinking water vary regionally and are related to the chemical composition of the geological bedrock (CCME, 2011; Stalder et al., 2012). However, some studies suggested that mineral P fertilizer-derived U can be transferred to aquifers (Birke and Rauch, 2008; Huhle et al., 2008; Smidt et al., 2012). The leaching of U to groundwater depends on soil properties driving the U mobility. Among the most important drivers of the U mobility is the soil pH (Echevarria et al., 2001; Taylor and Kim, 2008). The lowest mobility of U occurs around pH 7 and mobility increases with decreasing pH, because of decreasing numbers of negatively charged binding sites in the soil as a consequence of surface protonation. At pH > 7, the U mobility increases because of changes in U speciation in the soil solution. Depending on pH and the presence of organic and inorganic ligands such as phosphates (PO43–), carbonates (CO32–), sulfates (SO42–), chlorides (Cl–), or fluorides (F–), U forms stable complexes of distinct mobility (Bourdon et al., 2003; Vandenhove et al., 2007a, b). Especially under slightly alkaline and oxic conditions, which are common in many Swiss agricultural soils, U should have little mobility (Jacques et al., 2006). The presence of carbonates can, however, increase the mobility of U in alkaline soils because carbonato-U complexes are mostly neutral or negatively charged and have a low affinity for soil minerals (Echevarria et al., 2001; Zheng et al., 2003; Read et al., 2008). Besides pH and the presence of complexing agents, the amount of possible binding sites (provided by organic material, Fe oxides, and clay minerals) controls the U sorption (Rogasik et al., 2008). In the absence of sufficient binding sites for the specific chemical U form, mobile U species are readily transferred to aquifers (Mortvedt, 1994; Hamamo et al., 1995), especially if the ground water table is close to the soil surface (Huhle et al., 2008). It has been shown for some elements that the transport in soils is influenced by preferential flow paths in soils (Gachter et al., 1998; Knechtenhofer et al., 2003). Although, we are not aware of a study addressing U transport in preferential flow paths, the occurrence of such transport might also be a reason for high U concentrations in surface-near groundwaters and surface waters.
Currently, we are not aware of published U budgets based on in situ measurements of agricultural soils. Moreover, the general state of knowledge about U fluxes in soils is incomplete or merely based on theoretical assumptions. The literature about leaching of mineral P fertilizer-derived U is contradictory and preferential flow has not been considered up to now. Based on these considerations, in this study we aim to:
• Present (for the first time) in situ measured U budgets from arable fields and grassland sites, to assess the importance of the different inputs and outputs and the potential accumulation of U in agricultural soils,
• Investigate U leaching and U speciation in soil solution, and
• Assess the U transport by preferential flow in three different arable soils.
The study sites in Switzerland represent small-scale farming systems under temperate climatic conditions (Cfb, Köppen climate). This climate is representative for most of Europe, but can also be found in many other parts of the world (e.g., the Americas, Southern Africa, China, East Australia, New Zealand). The study was based on the same sampling campaign, which was used to establish the Cd (isotope) and Zn (isotope) balances and the soil plant transfer of Cd (Imseng et al., 2018, 2019a,b) in former studies.
Materials and Methods
Study Sites
The study was carried out at two arable and three grassland monitoring sites (Figure 1) of the Swiss Soil Monitoring Network (NABO, Gubler et al., 2015) in Oensingen (OE), Wiedlisbach (WI), Tänikon (TA), Ebikon (EB), and Ependes (EP). In addition, one arable monitoring site was chosen from the cantonal soil monitoring network Basel-Landschaft in Nenzlingen (NE), located in the Swiss Jura. These six sites were selected because of contrasting geological background, soil properties and U concentrations in the soils. The three arable soils developed on calcareous alluvial deposits (OE), mixed calcareous, siliceous moraine material (WI), and limestone (NE), respectively. At OE, the soil is classified as a Stagnic Calcaric Eutric Fluvic Cambisol, WI is an Eutric Cambisol and NE a Leptic Calcaric Eutric Cambisol (IUSS working group WRB, 2014). The soil properties are summarized in Supplementary Table S1. The arable sites were used in crop rotation. During the monitoring period, wheat was grown at all sites, followed by barley. Although the barley harvest was outside the sampling period of 1 year, the barley harvest was still sampled and analyzed, and the budgets were calculated for both, wheat and barley growth.
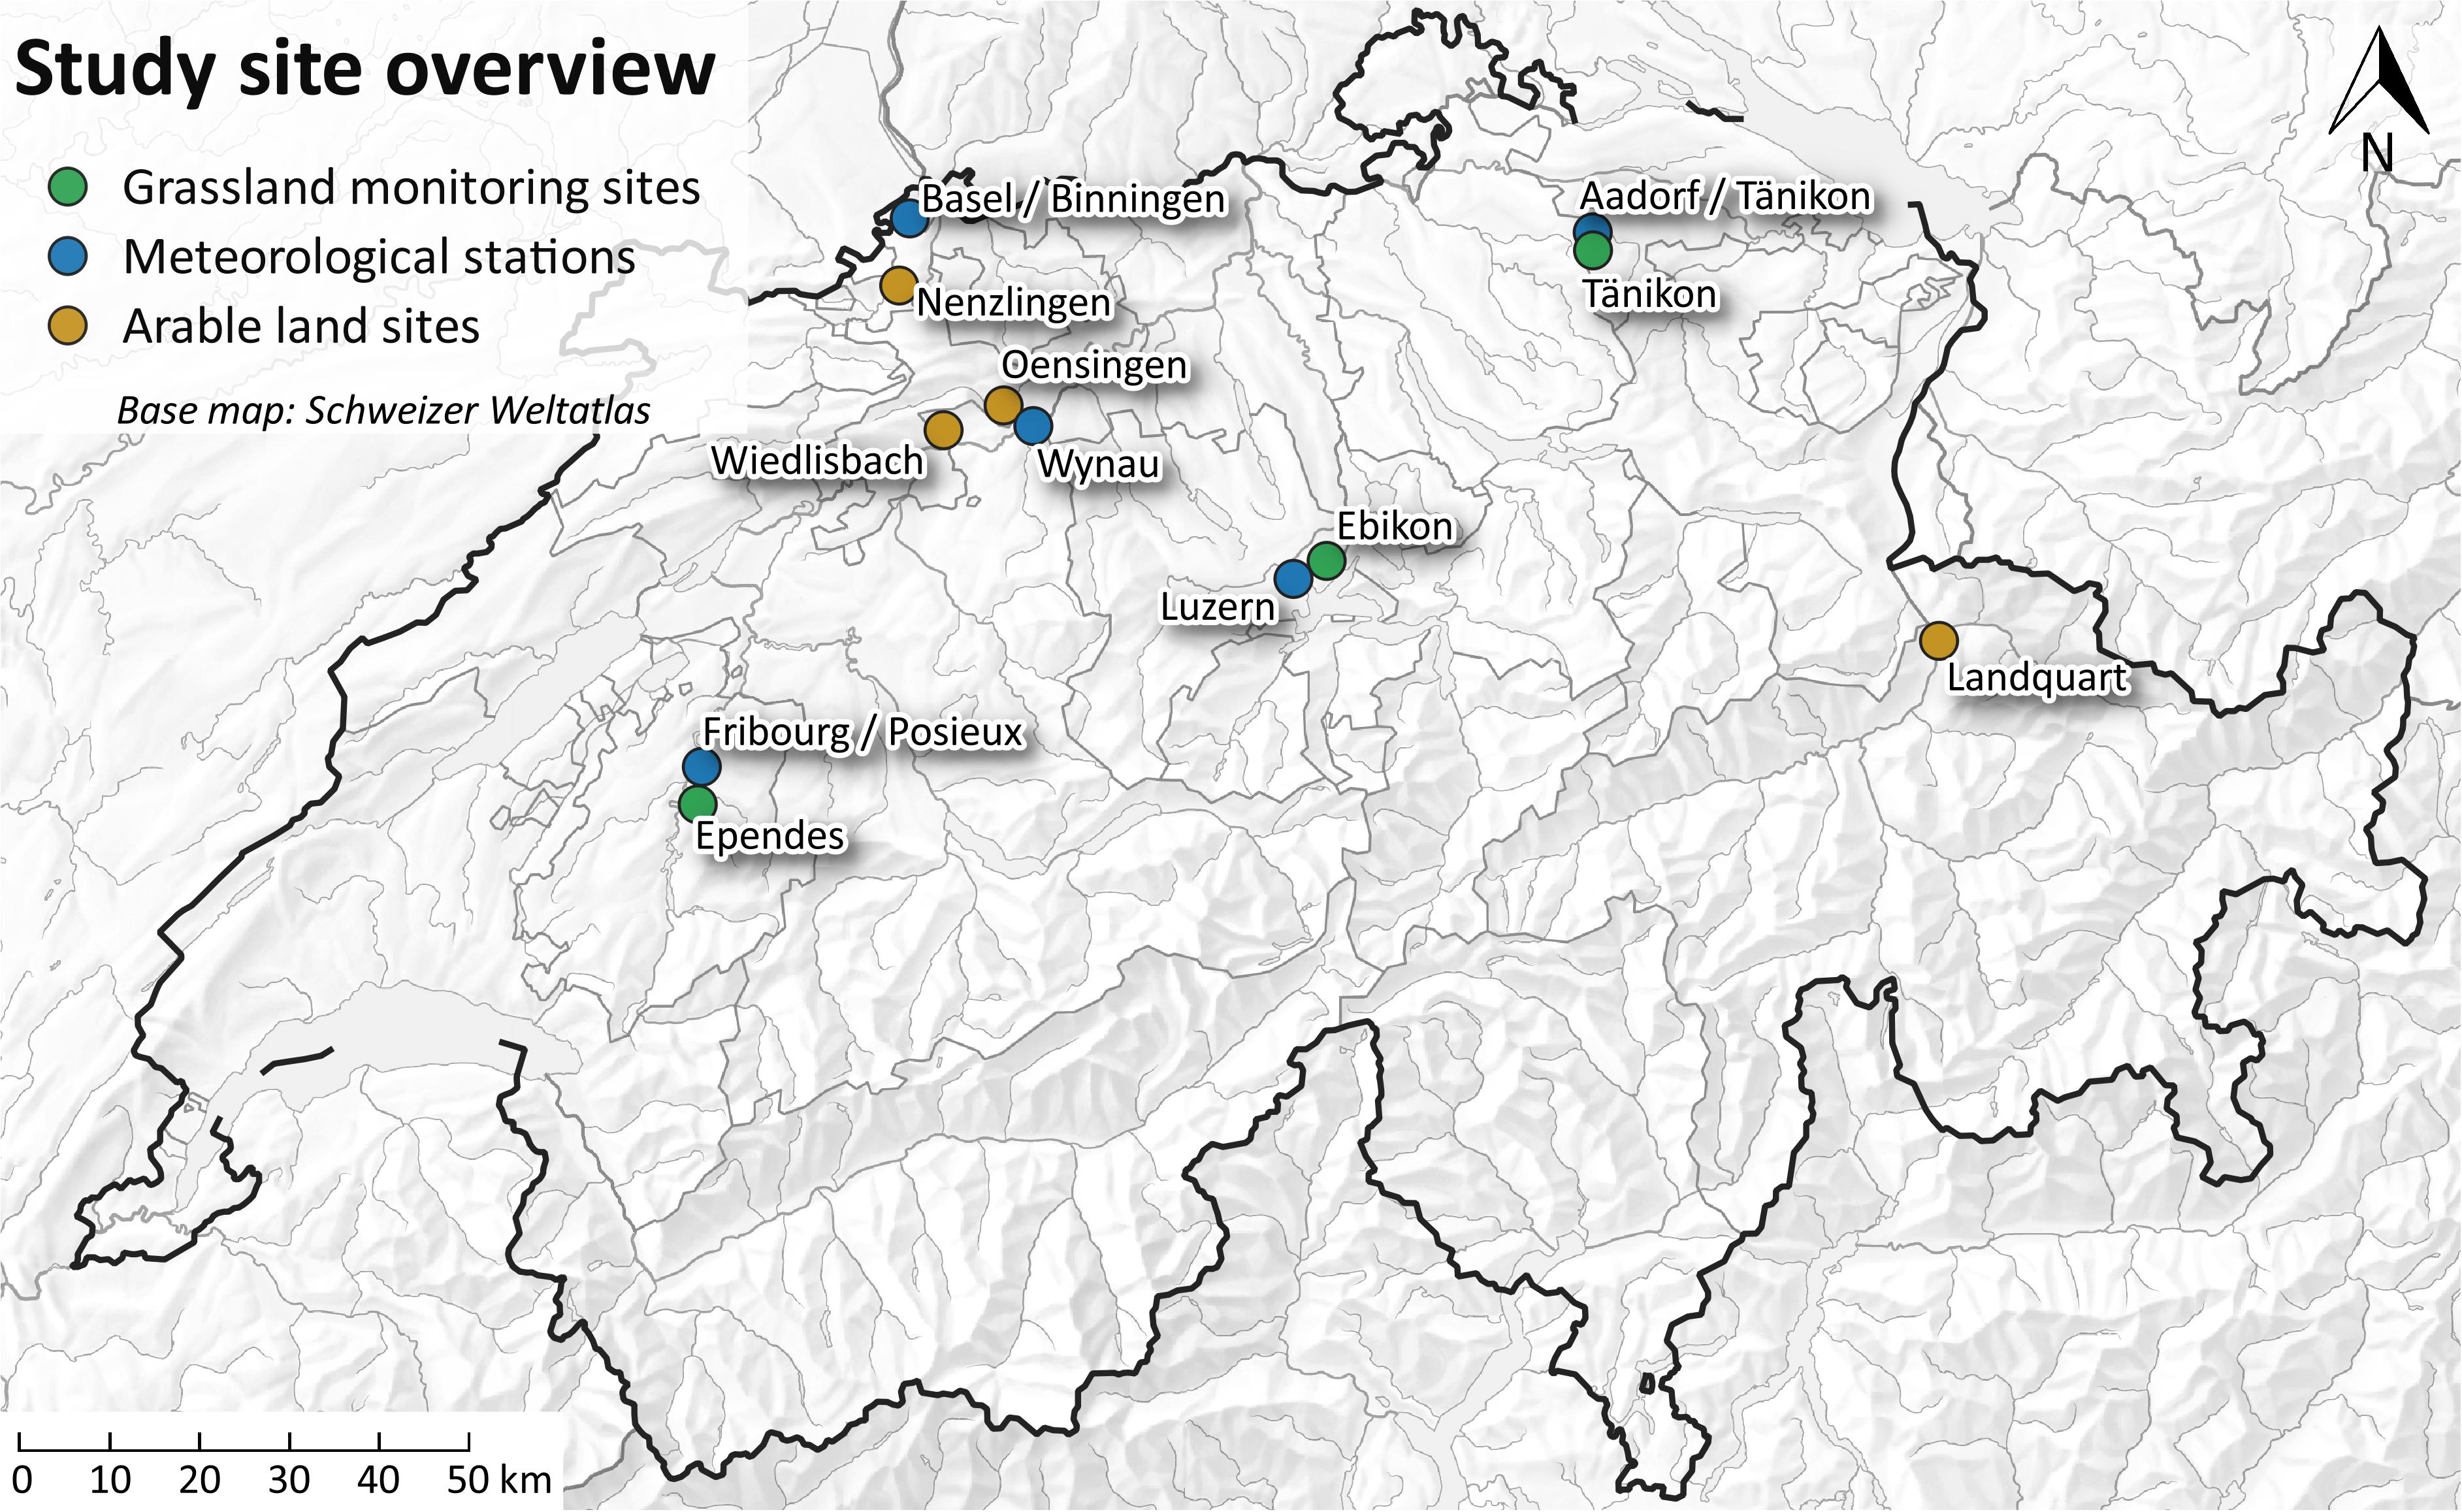
Figure 1. Map of Switzerland with the locations of the study sites and the meteorological stations.
The soils of the three grassland sites developed on alluvial deposits (TA), sandstone (EB), and moraine material (EP). All three soils were classified as Eutric Cambisols. The three soils have been used as grasslands for at least the last 30 years. The grassland sites at TA and EB were cut 4 and 6 times during our study period, respectively. The grassland site at EP was cut once and was used for grazing of cows. The sites at EP and TA received some mineral P fertilizers during the study period. Liquid cow manure was applied at all grassland sites, liquid pig manure was applied at TA and EB, and poultry dung was applied at EP every fourth year. For the preferential flow experiment, only arable soils were tested because of the higher mineral P fertilizer input. Furthermore, the site at Nenzlingen was replaced by a site at Landquart, because of the shallow soil depth in Nenzlingen. The soil at Landquart is a Fluvisol with high organic matter content and neutral pH and the bedrock of Landquart consists of deposits from detritic cones mainly from jurassic limestone of the northern Alps. All soils are fertilized according to the Swiss fertilization guidelines (Richner and Sinaj, 2017).
Sampling
At each site, samples were collected from a 10 × 10 m plot (Figure 2). Soil samples from the 0–20 cm depth layer were sampled as four area-mixed replicates per site, each consisting of 25 subsamples. Further samples from deeper soil horizons were collected at six different locations per site and in four depth intervals (0–20 cm, 20–50 cm, 50–75 cm, >75 cm), using an HUMAX® core sampler (HUMAX Bohrsonden, Martin Burch AG, Rothenburg, Switzerland). The depth of the deepest sample varied among the study sites.
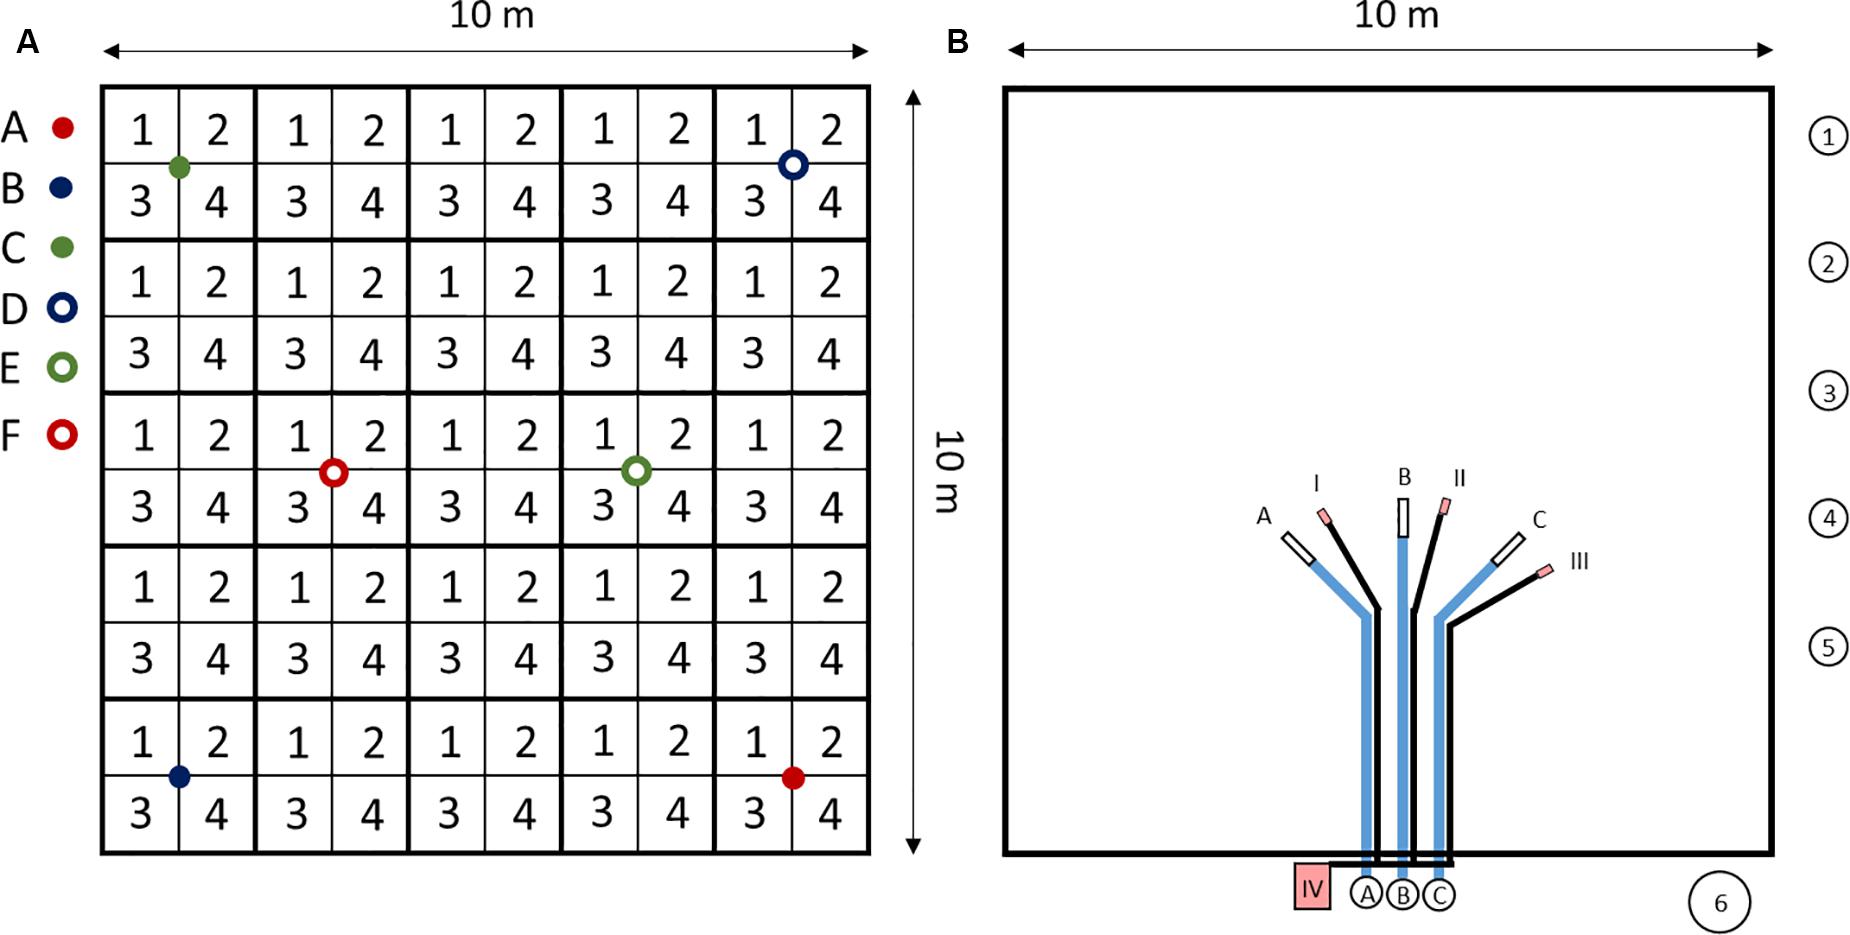
Figure 2. 10 × 10 m plot of the study sites. (A) Soil sampling. 1–4: area mixed samples from 0 to 20 cm depth, each consisting of 25 subsamples. A–F: HUMAX core samples, separated into four depths (0–20 cm, 20–50 cm, 50–75 cm, >75 cm), used to determine bulk soil density and coarse soil content (>2 mm). For further soil analysis, HUMAX core samples were pooled to three samples (A&F, B&D, and C&E). (B) Seepage water sampling, atmospheric deposition sampling and soil water content measurements. A–C: Suction cups with tubes and sampling bottles. 1–5: atmospheric deposition samplers. 6: snow sampler. I-III: EC-5 sensors to measure soil water contents. IV: HOBO® datalogger to record soil water measurement data.
To sample seepage water, three suction cups (SPE20®, UMS, Munich, Germany) with a nylon membrane (0.2 μm pore size) were installed at each 10 × 10 m plot at the 50 cm depth. The suction cups were connected with acid-cleaned sampling bottles in a plastic box, located outside the field (at 5 m distance). The connection tubes were buried at 40 cm depth to allow for plowing (Figure 2B). Soil solutions were sampled by applying a vacuum of 50 kPa to the sampling bottles. Next to the 10 × 10 m plot, 2 m above the ground, five acid-cleaned bulk precipitation samplers (volume: 2 L) were installed. The samplers consisted of a sampling bottle and a funnel on top. A polyester net (PES-1600/61, Franz-Eckert GmbH, Waldkirch, Germany) was used at the bottom of the funnels to prevent insects to fall into the samplers. Above the net, table tennis balls (PVDF, Semadeni, Ostermundigen, Switzerland) were used to reduce evaporation of the sampled water. Plastic thorns were put outside the funnels to prevent birds from sitting on the samplers. For the winter months, between week 52 in 2014 and week 10 in 2015, snow samplers were installed to sample bulk deposition. These consisted of 30 cm diameter buckets that were fitted with PE plastic bags. After each sampling, the full bags were taken back to the laboratory, where the snow and ice were thawed. All individual sampler components were acid-cleaned and tested for trace element leaching to exclude contamination of the sample. Following collection, bulk deposition samples were passed through 0.45 μm filters to remove particles.
Dielectric permittivity of the soils was measured with three TDR sensors (EC-5, Decagon Devices Inc., Pullman, WA, United States) at the 50 cm depth, in 1-h resolution and the volumetric water content of the soil was calculated, using a sensor-specific calibration for mineral soils. In OE, data for soil water content were obtained from the Swiss Soil Moisture Experiment (SwissSMEX). This experiment was carried out on the same arable field, during the same period and only ∼70 m away from our plot.
Inputs and outputs (Figure 3) were sampled during one hydrological year between May 2014 and May 2015, barley harvest samples were taken after that period, in July 2015. Mineral P fertilizers were obtained from the farmers for each application while liquid cattle manure was sampled once at OE and WI and four times at TA, EB, and EP. Bulk deposition and soil solution were sampled cumulatively every second week. Rainfall amounts were provided by MeteoSwiss (2016). We used data from the meteorological stations Wynau (OE, WI), Basel/Binningen (NE), Aadorf/Tänikon (TA), Luzern (EB), and Posieux/Fribourg (EP) (Figure 1). Plants were sampled during two cropping seasons (wheat harvest in summer 2014, barley harvest in summer 2015).
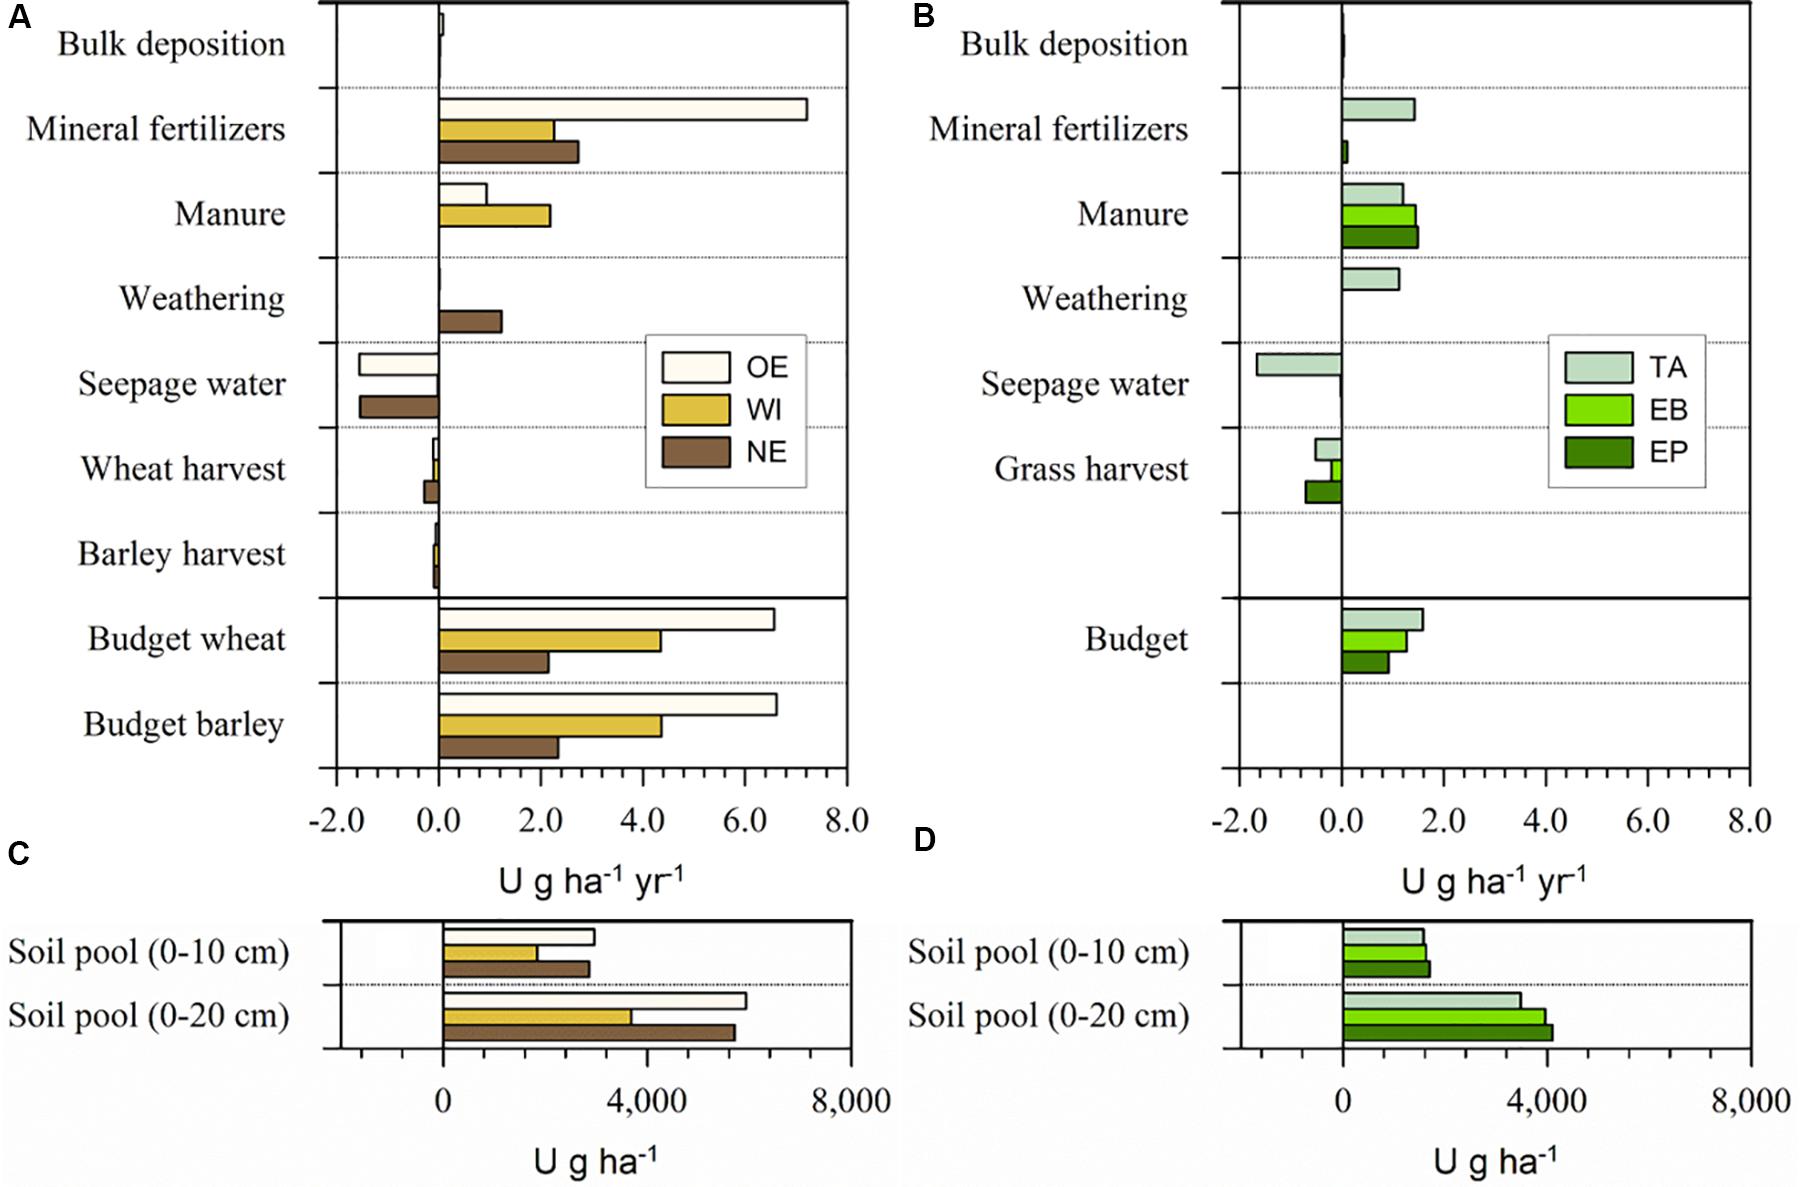
Figure 3. Uranium budgets of (A) the three arable soils at OE, WI, and NE and (B) the three grassland sites TA, EB, and EP for one hydrological year (May 2014–May 2015) and the U soil pools at the (C) arable and (D) grassland sites. Mass budgets were calculated individually for wheat and barley cropping considering the respective U removal by the yield (straw and grain) for the arable sites. Please mind the different labeling of the axes in (A,B) compared to (C,D).
The preferential flow path in the soil was visualized using Brilliant Blue FCF (4 g L–1, Supplementary Figure S1) and KBr (12 g L–1) tracers (Knechtenhofer et al., 2003; Alaoui and Goetz, 2008). Both tracers were applied on the soil surface of 1 m2 using a watering can and then a rain event was simulated with an irrigation system consisting of a slowly rotating 1-m2 plate with several rain outlets. The intensity and volume of the rain was selected according to Geiger et al. (1992). The artificial rain event had a duration of 1 h. To compensate water losses during the field work and within the sprinkling machine, two additional liters were added. The irrigation intensities at Oensingen, Wiedlisbach, and Landquart were 30, 30, and 48 mm, respectively and were applied for 40 min. Rain events of such high intensities occur typically every 2.33 years in the respective areas (Geiger et al., 1992) and were chosen for the experiment to simulate an extreme event with moderate reoccurrence. After the rain events, soil profiles were excavated down to 80–85 cm and subdivided into five depth intervals (0–10 cm, 10–30 cm, 30–50 cm, 50–70 cm, >70 cm). For each depth interval, five replicate samples were taken from each of the colored preferential flow paths and the non-colored matrix soils. More details about soil sampling and analyses are given in the Supplementary Material.
Laboratory Analysis
Basic soil properties including pH, effective cation-exchange capacity (ECEC), texture, C, N, and S concentrations and bulk density were determined. Soil, parent material, plant, manure, and mineral P fertilizer samples were digested using a microwave oven (ETHOS, MLS, Leutkirch, Germany) in a mixture of HNO3 (65%), H2O2 (35%), and HF (40%) (2/0.5/2 mL, HF only for soil and parent material) at 200°C for 30 min. For the samples containing HF, a second run (180°C, 30 min) with 10 mL H3BO3 (6%) was added to complex remaining HF. Uranium concentrations were determined in the sample digests, bulk deposition, and seepage water by inductively-coupled mass spectrometry (ICP-MS, 7700x, Agilent Technology, Waldbronn, Germany). Titanium (Ti) concentrations were additionally measured in digests of soil and parent material samples to calculate U mass gains or losses of soils relative to parent materials (τU values, Supplementary Table S1). It is assumed that Ti is not lost during weathering. The τ values indicate the enrichment or depletion of an element relative to its concentration in the parent material. A positive value of τ indicates a gain of the considered element compared to the parent material and a negative value of τ indicates a loss. The τ value represents the mass fraction gained or lost relative to the parent material (Brimhall et al., 1992, see section 1.4 in Supplementary Material for more details). The Cd, P, and U concentrations were furthermore analyzed in HNO3 (65%)/H2O2 (35%, 8/2 mL) microwave extracts (200°C, 30 min) of stained and unstained areas of the soil profiles from the preferential flow experiments. The mobile U fraction was assessed by extraction with NaHCO3 (0.1 mol L–1, 24 h, soil:solution ratio 1:100).
Aliquots of seepage water samples were used to measure the concentrations of major cations (Na+, NH4+, K+, Mg2+, and Ca2+) and anions (Cl–, NO2–, NO3–, PO43–, and SO42–) by ion chromatography (IC, DX-120, Thermo Fisher Scientific, Waltham, MA, United States). Dissolved organic carbon (DOC) and total nitrogen (TN) were measured with a vario TOC cube analyzer (Elementar Analysensysteme, Langenselbold, Germany). Total dissolved concentrations of the most abundant elements (Al, V, Mn, Fe, Co, Ni, Cu, Zn, As, Rb, Sr, Ba, and U) in bulk deposition and seepage water as well as the Br, Cd, P, and U concentrations in the soil digests from the preferential flow experiment were measured by inductively-coupled mass spectrometry (ICP-MS, 7700x, Agilent Technology, Waldbronn, Germany). Because seepage water was sampled with suction cups with a pore size of 0.2 μm, possible colloidal transport (>0.2 μm) in the soil is not considered in this study.
Mass Budget Calculations and Speciation Modeling
Individual U mass budgets (B) were calculated for each study site, considering inputs from atmospheric deposition (AD), manure (M), mineral P fertilizers (MPF), and weathering (W) and outputs through crop harvest (CH) and seepage water (SW) during 1 year, according to Equation (1), see Supplementary Material for details about the calculation of the individual fluxes. The crop harvest in the monitored year was wheat. However, to see how different crops affect the budget, also the following crop (barley) was sampled. Budgets were calculated for wheat and barley individually. Input from weathering was thereby calculated from dissolution of the coarse soil (>2 mm, considered as belonging to the parent material, see Supplementary Material for details) which introduces U to the fine earth (<2 mm) of the soil. See Supplementary Table S2 for the contents of the coarse fraction in the study soils.
The speciation of U in the soil solution was modeled with Visual MINTEQ (VMINTEQ). The pH, cation, anion, total element, and dissolved organic matter concentrations of soil solution were used as input data (Supplementary Tables S3, S4). The HCO3– concentration was calculated as the anion deficit of the charge balance. The charge balance was calculated with VMINTEQ and included all analyzed parameters including DOC and pH. Dissolved organic matter (DOM) concentrations were inferred from the measured dissolved organic carbon concentrations (DOC), using a conversion factor DOM:DOC of 2:1 (Pribyl, 2010). Uranium speciation was modeled with DOM, consisting to 40% of humic substances (HS), in line with reported values (Groenenberg et al., 2010; Ren et al., 2015). The remaining mass fractions were assumed to consist of hydrophilic organic substances. This fraction can be neglected in the models because it was shown that hydrophilic organic substances do not influence metal speciation (Groenenberg et al., 2010; Ren et al., 2015). The humic substances were further subdivided into fulvic (FA, 90%) and humic (HA, 10%) acids (Groenenberg et al., 2010; Ren et al., 2015). Thus, DOM was assumed to consist to 4% of humic acids, 36% of fulvic acids, and 60% of hydrophilic organic substances.
Results
Mineral P fertilizer was the main input for U at all three arable sites (2.3–7.2 g ha–1 a–1), followed by manure addition (0–2.2 g ha–1 a–1, Figure 3). At the grassland sites, mineral P fertilizer still contributed most of the U input at TA (1.4 g ha–1 a–1), but manure was the most important input at EB and EP (1.4–1.5 g ha–1 a–1, Figure 3). The weathering-related input was only substantial on calcareous bedrock at TA and NE (1.1–1.2 g ha–1 a–1) and the atmospheric input was generally low (≤0.08 g ha–1 a–1). The main output occurred with the seepage water at OE, NE, and TA (1.5–1.7 g ha–1 a–1), while the leaching output at the other sites was very low (≤ 0.1 g ha–1 a–1). The output by biomass removal was higher at the grassland (0.2–0.7 g ha–1 a–1) than the arable sites (0.1–0.3 g ha–1 a–1). At the grassland sites, U output by mowing was highest for EP (0.7 g ha–1 a–1), followed by TA (0.5 g ha–1 a–1), and EB (0.2 g ha–1 a–1). At the arable sites, U output with crop harvest was highest for wheat at NE (0.3 g ha–1 a–1) and lowest for wheat at OE (0.1 g ha–1 a–1). All budgets were positive and arable sites showed a higher U accumulation than grassland sites. The annual U accumulation at all studied sites varied between 0.9 and 6.6 g ha–1 y–1.
The U concentrations in the soil solution were low at WI, EB and EP (always < 0.01 μg L–1), slightly higher at OE and highest at NE and TA (Figure 4). The temporal variation was limited at OE but comparatively high at TA. However, the U concentrations were generally ≤0.8 μg L–1 (Figure 4). The U speciation in the soil solution was dominated by carbonato-U complexes at most sites (Table 1). Only at EP, U showed a balanced ratio between carbonato- and organo-U complexes while at EB organo-complexes were the dominating U species. Thus, the second most abundant group of U species in soil solution were organo-U complexes, while other inorganic compounds (e.g., UO22+ and hydroxo-U complexes) occurred only to a minor extent. Generally, the U species in soil solution were neutral or negatively charged, while positively charged species were little important. Neutral species dominated at OE, NE, and TA, anionic species dominated at EB and EP, while neutral and anionic species were balanced at WI.
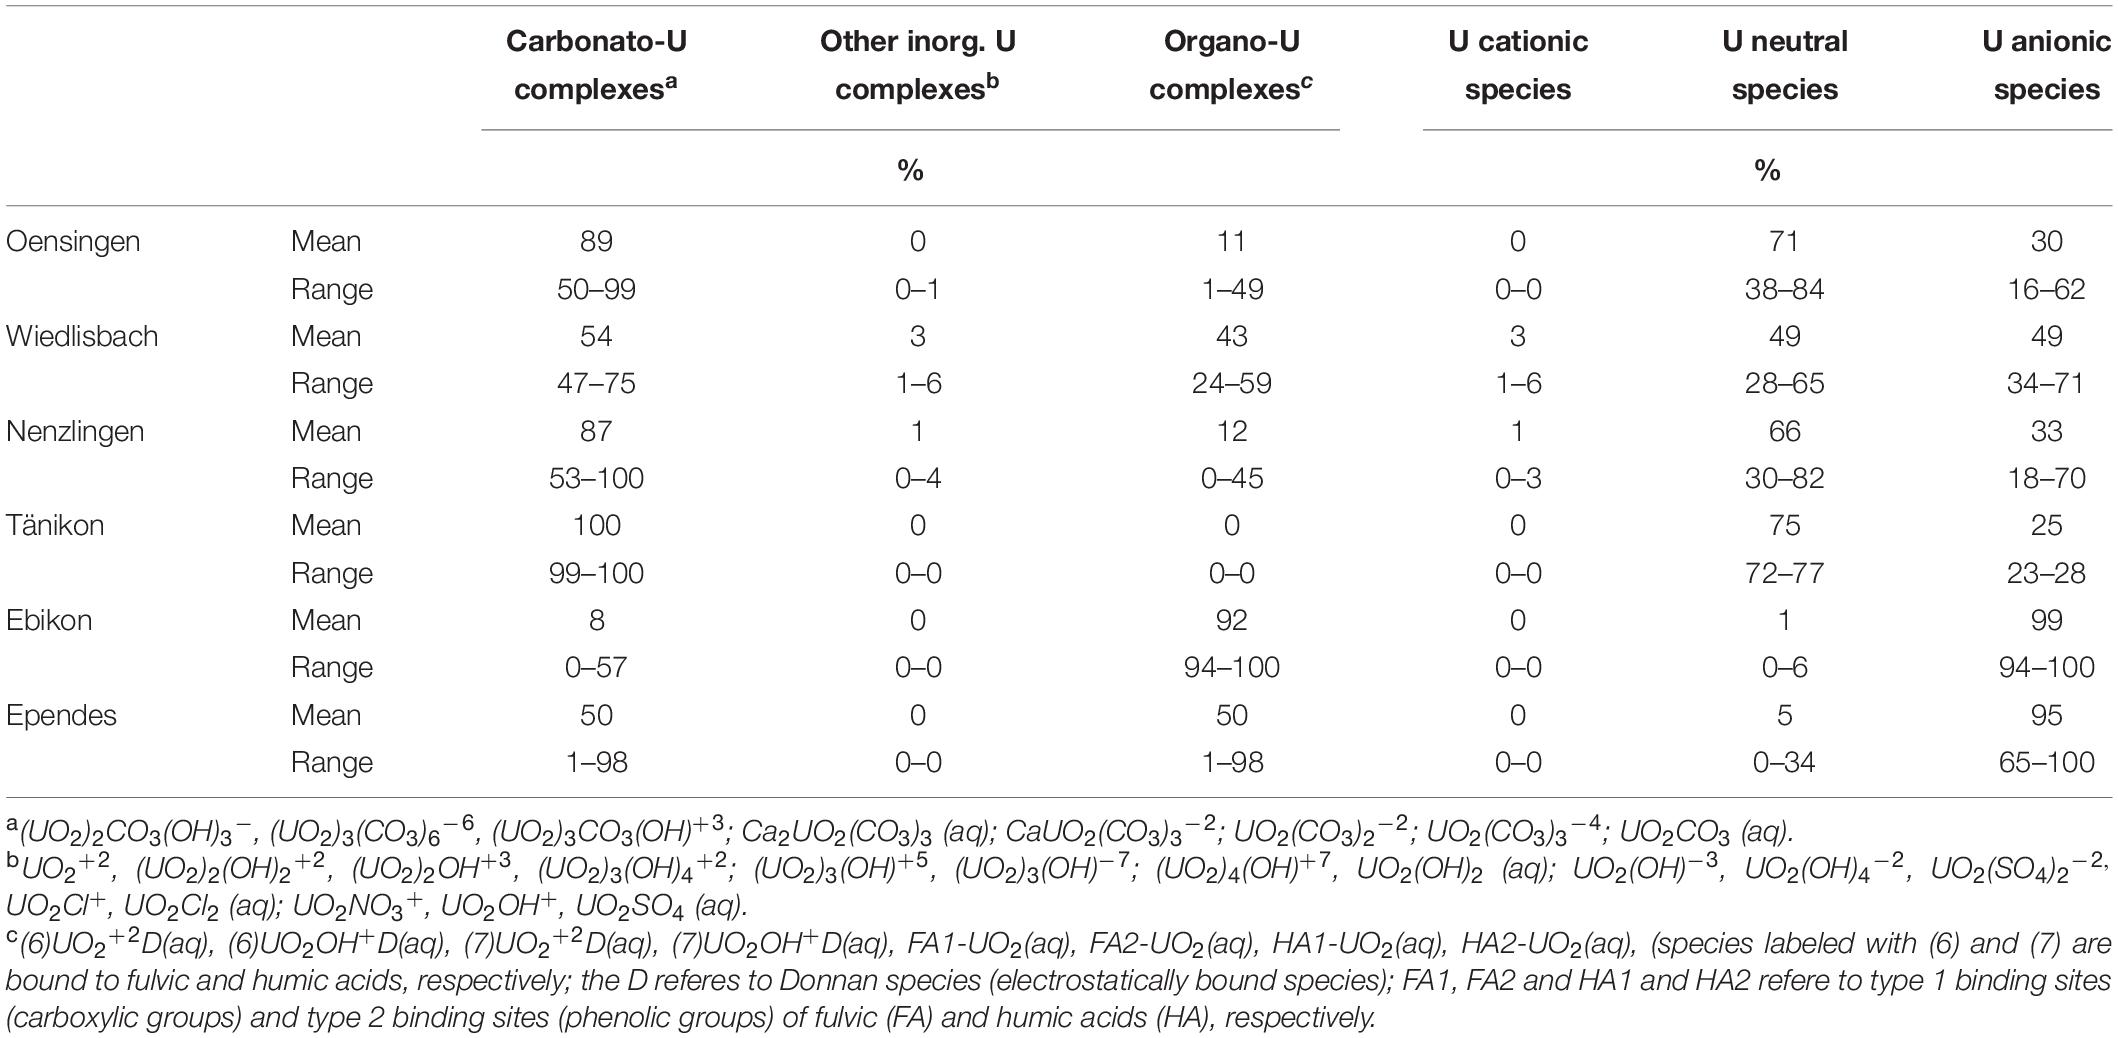
Table 1. Speciation of U and charge of U species in soil solution at the different study sites modeled with Visual MINTEQ.
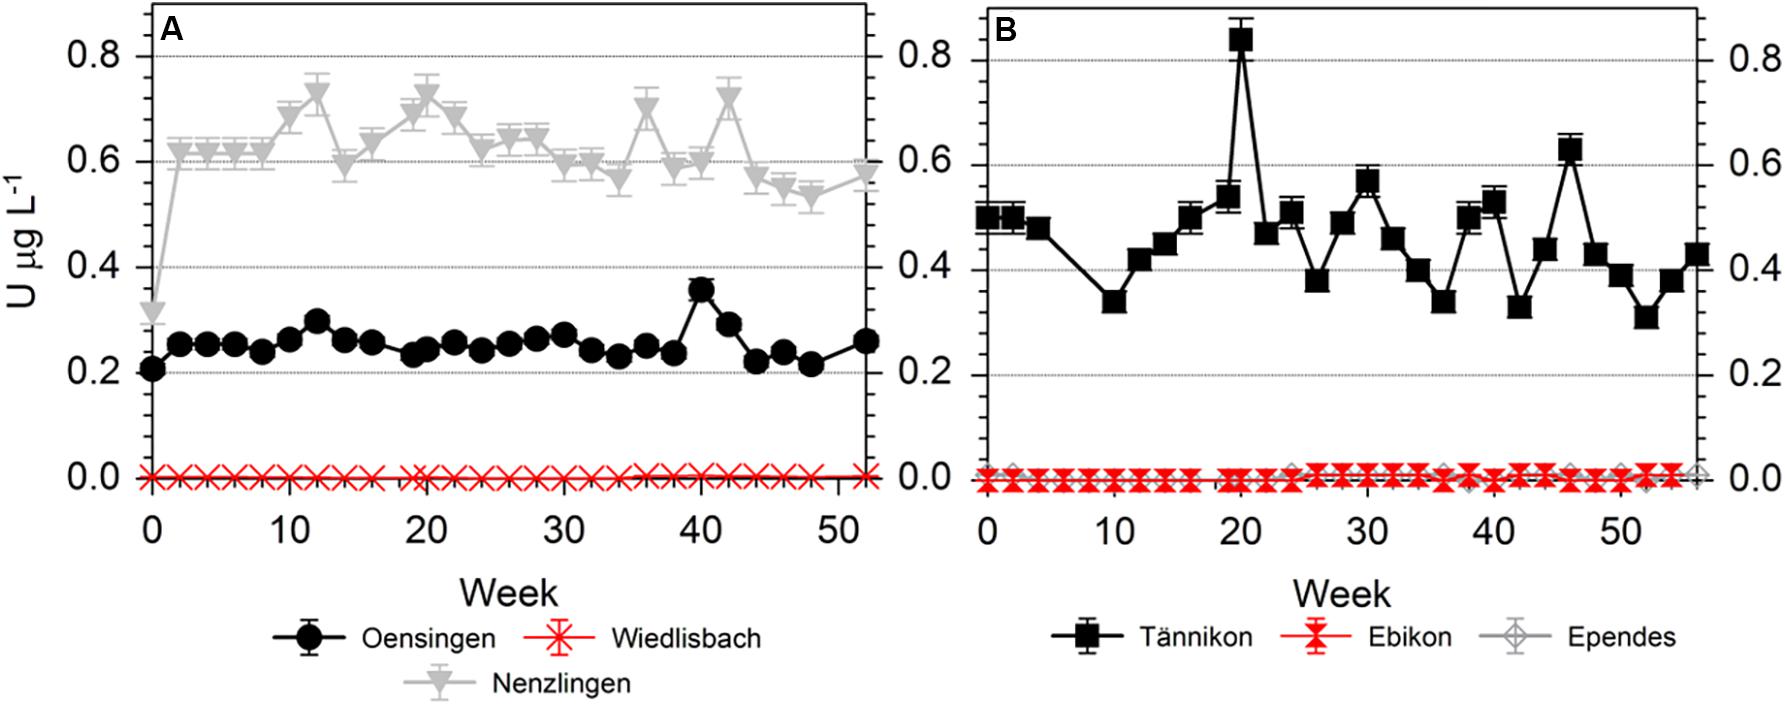
Figure 4. Temporal variation of the U concentrations in the soil solutions of (A) arable sites and (B) grassland sites, during the sampling time of 52 weeks (arable sites) and 56 weeks (grassland sites).
The stained preferential flow path in the three investigated soils did not differ in total and NaHCO3-extractable U concentrations from the unstained matrix soil (Figure 5). At WI, no preferential flow paths were visible below 20 cm soil depth. Other elements, which are typically introduced by mineral P fertilizers into the soil (e.g., P) did neither show an enrichment along the preferential flow path relative to the matrix (Supplementary Figure S2). However, for U as well as for P an enrichment was visible in the surface soil layers relative to the subsoil.
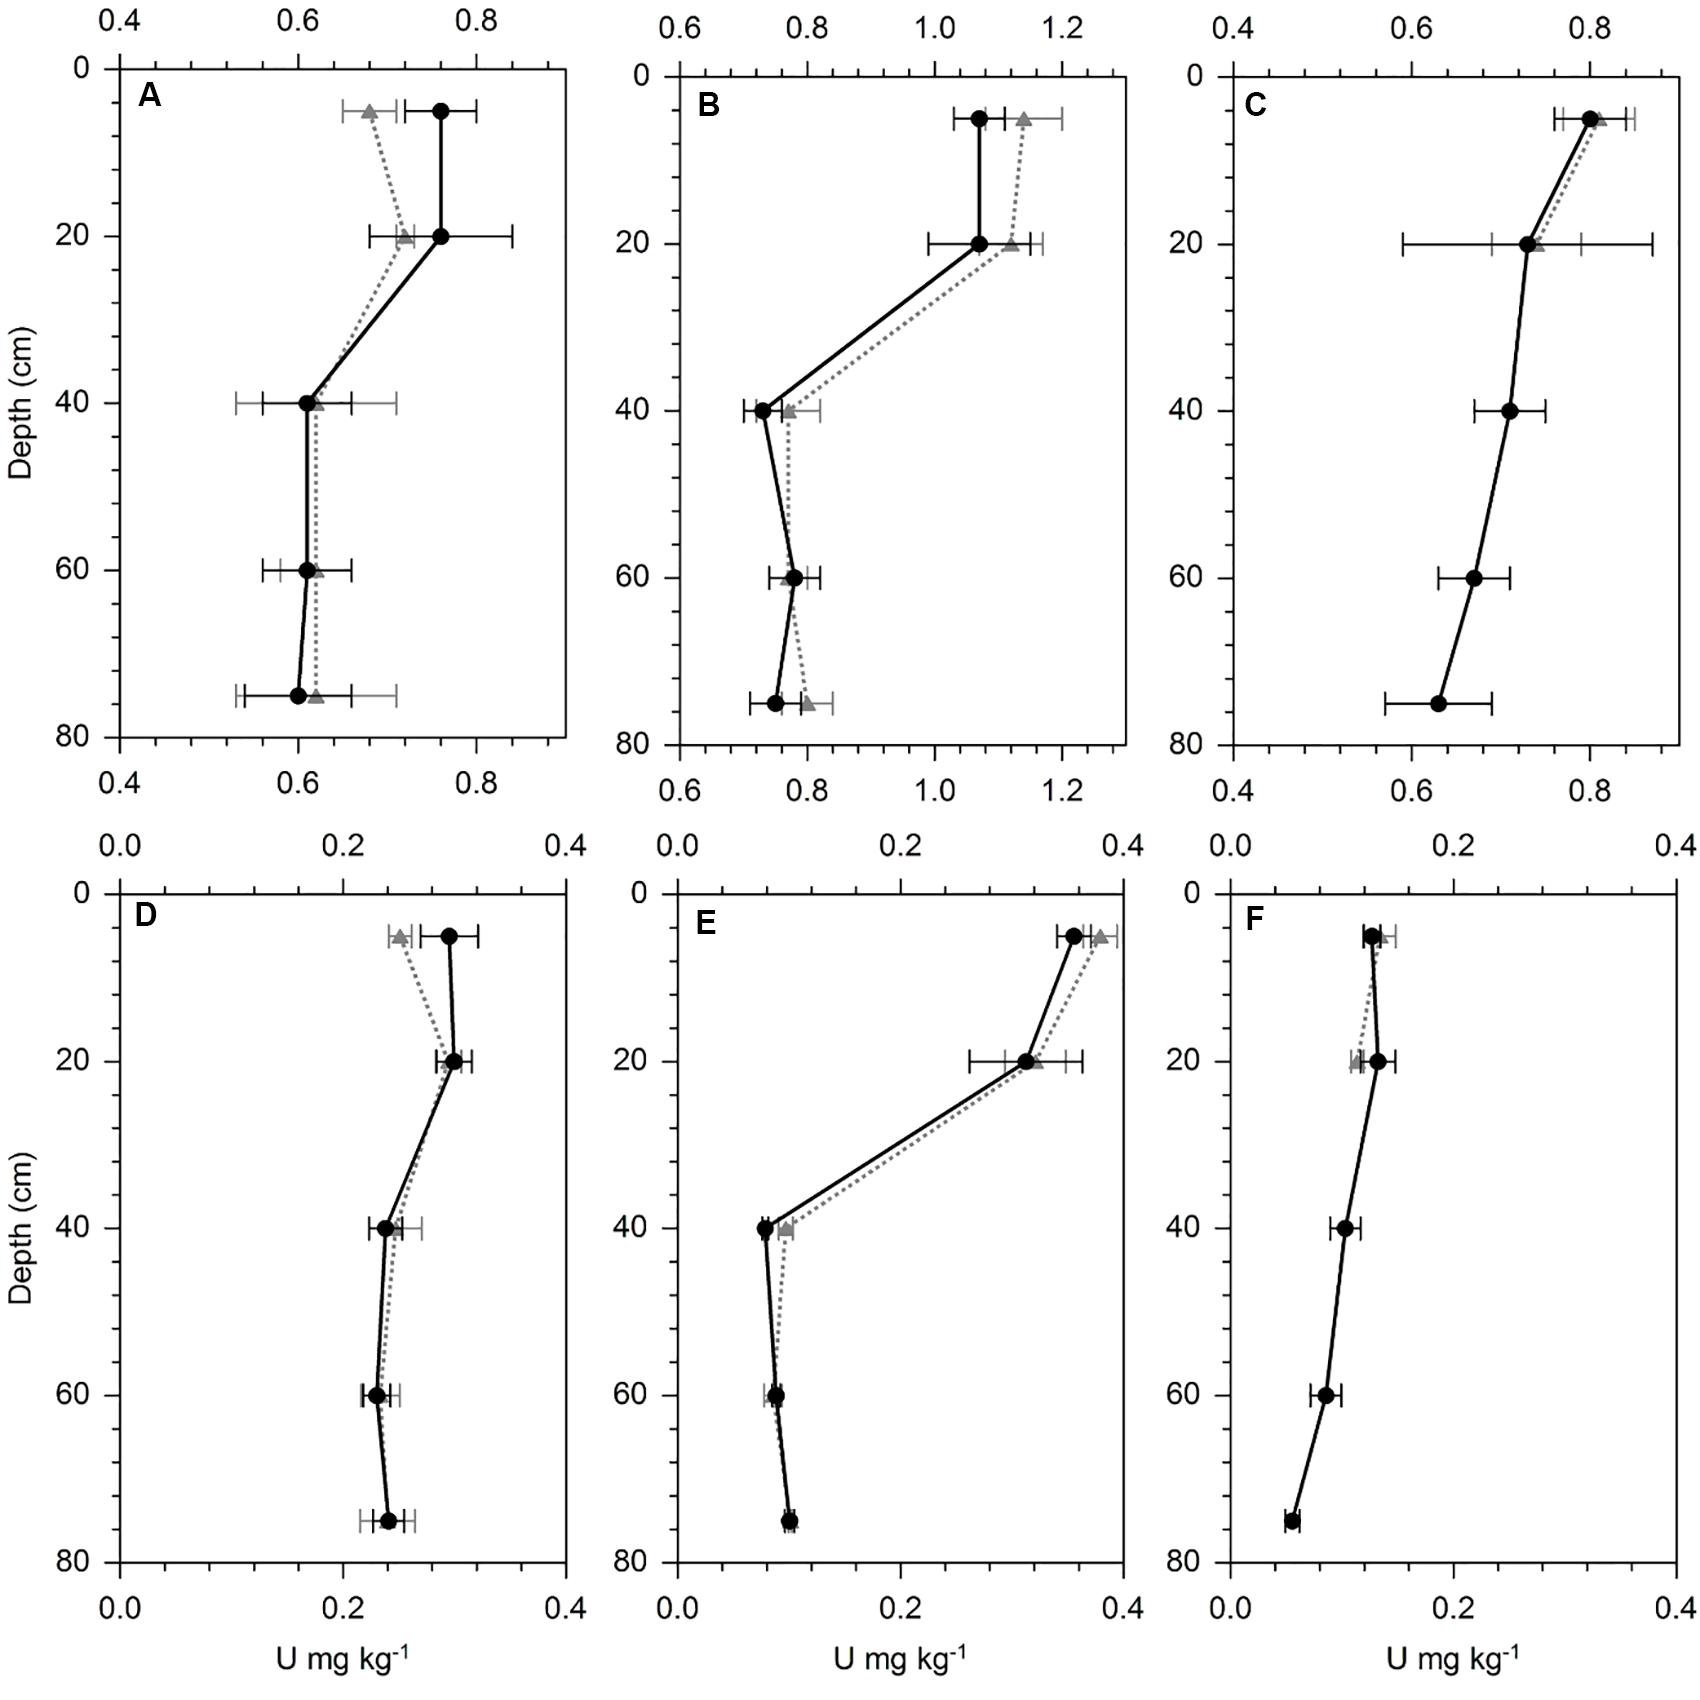
Figure 5. U concentration in HNO3 digests (A–C) and NaHCO3 (D–F) extracts from the three preferential flow path soil profiles (dotted gray line) and the matrix soil samples (straight black line) at (A,D) Landquart, (B,E) Oensingen, and (C,F) Wiedlisbach. Error bars represent the standard deviation of five replicate samples per sampling depth.
Discussion
Uranium Budgets in Agroecosystems
The main U inputs into the soils occurred with mineral P fertilizers, in line with reports about frequently high U concentrations in mineral P fertilizers (McLaughlin et al., 1996; Bigalke et al., 2018). However, at WI and all grassland sites, also manure fertilization was an important U source and even the dominant one at EB and EP (Figure 3). The comparatively high inputs with manure in spite of lower U concentrations than in mineral P fertilizers were related with the much larger application amounts of manure than mineral P fertilizers. Furthermore, feed supplements provided to livestock may contain phosphate from the same origin as mineral P fertilizers and livestock may also take up soil material during grazing. The feed supplements and soil may thus also contain U impurities, which are taken up by the livestock and excreted in the manure (McLaughlin et al., 1996; Arruda-Neto et al., 1997). The total U addition to the soil via fertilization (2.7–8.1 g ha–1 yr–1) was at the lower end of the 2.3–23 g ha–1 y–1 estimated by Kratz et al. (2008). The comparatively low mineral fertilizer-derived U input at our study sites might be partly explained by the crops grown at the sites. According to the Swiss fertilization guidelines, wheat and barley demand less P (27 and 28 kg ha–1) than other crops (e.g., corn or fodder beets with 46 and 52 kg ha–1, respectively, Richner and Sinaj, 2017). At the intensively used grassland sites, the potentially high P demand (27–47 kg ha–1) is mostly covered by manure and not by mineral P fertilizers. However, the total U input might strongly vary depending on the used mineral P fertilizer. At our sites, the U concentrations of the used mineral P fertilizers were in the same range as in other studies from Switzerland (range this study, 50–560 mg kg–1 P2O5, literature range 0.21–593 mg kg–1 P2O5, Gisler and Schwab, 2015; Bigalke et al., 2017). Thus, even at constant mineral P fertilizer application rates, the variation of U concentrations by two orders of magnitude may lead to substantial variation in U inputs. However, also the amount of mineral P fertilizer application varies over time and decreased in Switzerland by about 60–70% between 1980 and 2008 (Spiess, 2011). Thus, mineral P fertilizer use is also much depending on the agricultural system and politics and might vary considerably in different countries. The U input by weathering was only substantial at NE and TA, because of the carbonate bedrock, which showed a comparatively high weathering rate and thus a high U release. The bulk deposition contributed little to the total inputs.
Seepage water was the most important output for U at OE, NE, and TA, most likely because of the neutral pH values and the presence of dissolved carbonates in the soil solution, forming neutral or negatively charged U complexes of comparatively high mobility (Table 1; Echevarria et al., 2001; Zheng et al., 2003; Jacques et al., 2006; Read et al., 2008). There was no relationship between the variation of the U concentration data in TA and the water fluxes in the soil (Figure 4). Contrary to this, the U leaching at WI, EP, and EB was low and of little importance for the U budgets of the sites. The output of U with crops was generally small, because of the small U uptake of plants (Kratz et al., 2008; ATSDR, 2013).
The U budgets showed a clear accumulation of U at all six study sites, which, for the first time empirically confirm theoretical considerations reporting a general U accumulation in agricultural soils in Switzerland (Bigalke et al., 2017, 2018) and in other countries (Jones, 1992; Takeda et al., 2006; Taylor, 2007). However, the U accumulation at our study sites was small when compared with the total soil pool of U. Given the low mobility of U, we can assume that the accumulation will mainly take place in the (plowed) surface soil (0–20 cm) at arable and about the upper 10 cm at grassland sites. Based on the mass budget of the study year, a doubling of the U concentrations in these uppermost 20 cm would take 850–2,660 years at the arable sites and a doubling in the uppermost 10 cm would take 990–1,830 years at the grassland sites. These slow U accumulation rates were also confirmed by the U concentrations and τU values in the soil profiles. While all soils showed a strong increase in P concentrations at the surface and a high τP value, U is only slightly enriched in the arable soils and show no signs of enrichment in the grassland soils (Supplementary Table S1 and Supplementary Figure S2). Although we considered the study sites as representative for Swiss arable soils, the local mineral P fertilizer use, the U concentrations in the fertilizers, the kind of crop, soil properties, and climate variability will have an effect on the U budgets likely resulting in a considerable variation of the U budgets at individual agricultural plots.
U Leaching From Agricultural Sites
Leaching of U from agricultural sites fertilized with mineral P has been proposed in several studies (Birke and Rauch, 2008; Huhle et al., 2008; Smidt et al., 2012). The U might enter surface waters (Birke and Rauch, 2008), but also contaminate groundwater and finally affect human health because of the uptake of U with drinking waters (Schnug, 2012; Schnug and Lottermoser, 2013).
At our study sites, the U concentrations in the soil solution were generally low (<0.8 μg L–1) and below any known toxicity threshold for U (World Health Organization [WHO], 2011; Figure 4). The concentrations in the soil solution showed little temporal variation at most sites (in biweekly resolution), indicating no short-term effect of the fertilization on the water quality. On the contrary, the soil properties seemed to control the U concentrations in soil solution. At WI, EB and EP, the sites with a slightly acidic pH, without carbonates and lower U concentrations in the soil (<2 mg kg–1), U concentrations in soil solution were extremely low, partly even below the detection limit (<0.002 μg L–1) of our ICP-MS. In comparison, the U concentration were higher at OE, TA, and highest at NE, the sites with slightly alkaline pH values, carbonates, and higher soil U concentrations (>2 mg kg–1). These findings are in line with results from Echevarria et al. (2001), Read et al. (2008) and Zheng et al. (2003), who reported that the presence of carbonates increases the mobility of U in alkaline soils because carbonato-U complexes are predominantly neutral or negatively charged and have a low affinity for soil minerals. Indeed, the U in the soil solution at the three sites with higher dissolved U concentrations showed a high proportion of carbonato-U complexes and neutral species clearly dominated (Table 1). On the contrary, at the sites with low U concentrations in the soil solution, carbonato-U complexes contributed <50% and were thus equally or less abundant than organo-U complexes. Together with this increase of the share of organo-U complexes, the proportion of anionic U species strongly increased. Overall, the charge of the U complexes in the solution is neutral or negative, preventing U sorption to negatively charged surfaces in the soils, which commonly prevail in soils of the temperate zone (Weil and Brady, 2017). Based on these data, we suggest that the soil pH and carbonate concentrations are a more important control of dissolved U concentrations in soil solution than the total U concentration in the soils or the amount of U added with mineral P fertilizers. This also means that U concentrations in leaching water are rather driven by relatively stable soil properties, and not by short-term U inputs like mineral P fertilizer application.
The U concentrations in the soil solutions of carbonate soils with the highest U concentrations in seepage water (<0.8 μg L–1) were lower or comparable with the concentrations in Swiss (2.04 μg L–1) and German (0.68 μg L–1) drinking waters (Smidt et al., 2012; Stalder et al., 2012) and stream waters in Germany (0.90 μg L–1, Birke and Rauch, 2008) and Europe (0.89 μg L–1, Salminen et al., 2005). Thus, the U concentrations in the seepage waters of our study soils will likely not lead to an increase of U concentrations in drinking waters.
U concentrations in West German waters are reported to be higher than in East German surface waters (0.741 and 0.462 μg L–1, respectively). This difference has been explained by the lower application rates of mineral P fertilizer, which moreover originated mainly from igneous rocks with lower U concentrations in the former German Democratic Republic (Schulz et al., 2003; Birke and Rauch, 2008). However, considering the importance of soil properties, compared to U concentrations, the variation of the U concentrations in ground and surface waters seems to be mainly controlled by the geological bedrock as well as the chemical properties of the waters and the U leaching rates from rocks or soils. Huhle et al. (2008) reported markedly enhanced U concentrations and higher U leaching rates in soils under agricultural use than under forest. However, considering the data in this paper, it is not clear if the higher U leaching was caused by the higher mineral P fertilizer-derived U concentrations in soils or by the different chemical properties of the arable than the forest soils. Agricultural soils are often treated with lime to maintain a favorable pH for the crop production, while forest soils are often acidic. This difference in pH might cause considerably higher U leaching from agricultural soils. Furthermore, our data demonstrate clearly that the soil chemical properties drive U leaching from soil and not the total U concentration. The U concentrations in soil solution found in our study were far below any known threshold for health effects of U (e.g., 30 μg L–1, World Health Organization [WHO], 2011).
U Leaching by Preferential Flow
Beside the soil solution sampled with our suction cups, there might be additional U leaching by preferential flow (Alaoui and Goetz, 2008), which bypasses the suction cups. This fraction was reported to have a significant effect on the leaching of some elements (Gachter et al., 1998; Knechtenhofer et al., 2003; Jarvis, 2007) but is not accounted for in our U budgets. Preferential flow is difficult to assess, because it cannot easily be sampled. We selected an alternative approach by coloring the soil with direct contact to preferential flow paths and analyzing the U concentrations of this soil fraction and another non-stained soil fraction away from the preferential flow path. We assumed that enhanced U leaching along preferential flow paths would have increased the U concentration in the stained soil relative to the unstained one, as reported for lead contaminated shooting range soils (Knechtenhofer et al., 2003). However, our experiment did not show any U enrichment in the soil around the preferential flow path, neither in total U concentrations (HNO3/H2O2 digest) nor in the mobile U form (NaHCO3 extract, Figure 5). We analyzed the same soil samples also for their P concentrations, as P is considered to be a good tracer for mineral P fertilization and did neither find any enrichment (Supplementary Figure S2), indicating that preferential flow in these soils does not substantially contribute to the leaching of mineral P fertilizer-derived elements. We also analyzed Br in the samples, which was added to the soil together with the brilliant blue, and found a strong enrichment, indicating that the sampled soil was indeed influenced by preferential flow (Supplementary Figure S2).
The missing enrichment does not mean that there is no enhanced U leaching with preferential flow at all but it renders it unlikely that the preferential flow solution is highly enriched in U, which should have caused elevated U concentrations in soil along the flow path.
Conclusion
Mineral P fertilizer is the main source of U in agricultural systems. If mineral P fertilizers are used they dominate the U inputs, but also manure can substantially contribute to the U inputs. Mineral weathering only contributes to the U inputs in soils developed on limestone, although even on limestone weathering inputs of U contribute little to the budget. The export with harvested crops is also only of minor importance. Leaching of U only occurs in soils with slightly alkaline pH values and carbonates in the soil, because of the formation of neutral or negatively charged carbonato-U complexes, which enhance the U mobility. However, the U concentrations in leaching water are generally low, similar to U concentrations commonly found in groundwater and stream water and do likely not pose a health risk. We did not find an indication of U leaching by preferential flow in the soil. We found that all sites had positive U budgets (+0.9–6.6 g ha–1 y–1), indicating an accumulation of U in the soil. However, compared to the soil pool, the accumulation of U was minor and a doubling of the current U concentration in the uppermost 20 cm (arable land) or 10 cm (grass land) of the soil can only be expected in 850–2,660 years.
Data Availability Statement
The raw data supporting the conclusions of this article will be made available by the authors, without undue reservation, to any qualified researcher.
Author Contributions
MB wrote the manuscript, contributed to the design of the experiments and field sampling, and modeled the U speciation in the soil water. MI contributed to the design of the experiments, conducted field and laboratory work, and generated the data for the budget calculations. SS contributed to the design of the experiments and conducted field and laboratory work for the preferential flow experiment. LS analyzed the soils in the experiments. MW, AK, and MM contributed to field sampling, supplied data and knowledge about fertilization, plants, and agricultural practices. EF and WW contributed to the design of the experiments. MB, AK, EF, and WW raised the funds for the research project. All authors contributed to the manuscript.
Funding
This study was funded by the Swiss Parliament via the National Research Program (NRP) 69 “Healthy Nutrition and Sustainable Food Production” (SNSF Grant No. 406940_145195/1).
Conflict of Interest
The authors declare that the research was conducted in the absence of any commercial or financial relationships that could be construed as a potential conflict of interest.
Acknowledgments
We thank the farmers from the study sites for cooperation. Many thanks to the members of the cLAB especially Daniela Fischer and Patrick Neuhaus and the Soil Science Group at the University of Bern for support in the laboratory and inspiring discussions.
Supplementary Material
The Supplementary Material for this article can be found online at: https://www.frontiersin.org/articles/10.3389/fenvs.2020.00054/full#supplementary-material
References
Alaoui, A., and Goetz, B. (2008). Dye tracer and infiltration experiments to investigate macropore flow. Geoderma 144, 279–286. doi: 10.1016/j.geoderma.2007.11.020
Arruda-Neto, J. D. T., Tavares, M. V., and Filadelfo, M. (1997). Concentrations of uranium in animal feed supplements: measurements and dose estimates. J. Radioanalyt. Nuclear Chem. Artic. 221, 97–104. doi: 10.1007/bf02035249
Bigalke, M., Schwab, L., Rehmus, A., Tondo, P., and Flisch, M. (2018). Uranium in agricultural soils and drinking water wells on the Swiss Plateau. Environ. Pollut. 233, 943–951. doi: 10.1016/j.envpol.2017.09.061
Bigalke, M., Ulrich, A., Rehmus, A., and Keller, A. (2017). Accumulation of cadmium and uranium in arable soils in Switzerland. Environ. Pollut. 221, 85–93. doi: 10.1016/j.envpol.2016.11.035
Birke, M., and Rauch, U. (2008). “Uranium in stream water of Germany,” in Loads and Fate of Fertilizer Derived Uranium, eds L. J. de Kok and E. Schnug (Leiden: Backhuys Publishers), 79–90.
Bottcher, G., Dau, A.-K., Ehrentreich, B., Hennings, U., Kape, H.-E., Kuhne, J., et al. (2012). “Bestandsaufnahme zur Klärung erhöhter Uran -Gehalte im Grund- und Trinkwasser in Mecklenburg-Vorpommern,” in Landesamt für Umwelt (Güstrow: Naturschutz und Geologie).
Bourdon, B., Turner, S., Henderson, G. M., and Lundstrom, C. C. (2003). Introduction to U-series geochemistry. Uranium Ser. Geochem. 52, 1–21. doi: 10.2113/0520001
Brimhall, G. H., Chadwick, O. A., Lewis, C. J., Compston, W. I., Williams, S., Danti, K. J., et al. (1992). Deformational mass-transport and invasive processes in soil evolution. Science 255, 695–702. doi: 10.1126/science.255.5045.695
CCME (2011). Scientific Criteria Document for the Development of the Canadian Water Quality Guidelines for the Protection of Aquatic Life. Winnipeg: Canadian Council of Ministers of the Environment.
Echevarria, G., Sheppard, M. I., and Morel, J. (2001). Effect of pH on the sorption of uranium in soils. J. Environ. Radioact. 53, 257–264. doi: 10.1016/s0265-931x(00)00116-8
Gachter, R., Ngatiah, J. M., and Stamm, C. (1998). Transport of phosphate from soil to surface waters by preferential flow. Environ. Sci. Technol. 32, 1865–1869. doi: 10.1021/es9707825
Geiger, H., Röthlisberger, G., Stehli, A., and Zeller, J. (1992). Extreme Punktregen unterschiedlicher Dauer und Wiederkehrperioden, 1901–1970. Available online at: https://hydrologischeratlas.ch/produkte/druckausgabe/niederschlag/tafel-2-4 (accessed May 20, 2016).
Gisler, A., and Schwab, L. (2015). Marktkampagne Dünger 2011/2012 Kennzeichnung und Schwermetalle. Available online at: https://Bericht+Marktkampagne+D%C3%BCnger+2011-2012.pdf
Groenenberg, J. E., Koopmans, G. F., and Comans, R. N. J. (2010). Uncertainty analysis of the nonideal competitive adsorption-donnan model. Effects of dissolved organic matter variability on predicted metal speciation in soil solution. Environ. Sci. Technol. 44, 1340–1346. doi: 10.1021/es902615w
Gubler, A., Schwab, P., Wächter, D., Meuli, R. G., and Keller, A. (2015). Ergebnisse der Nationalen Bodenbeobachtung (NABO) 1985–2009. Ittigen: Bundesamt für Umwelt.
Hamamo, H., Landsberger, S., Harbottle, G., and Panno, S. (1995). Studies of radioactivity and heavy-metals in phosphate fertilizer. J. Radioanalyt. Nuclear Chem. Artic. 194, 331–336. doi: 10.1007/bf02038431
Huhle, B., Kummer, S., Stadler, S., and Merkel, B. J. (2008). “Mobility of uranium from phosphate fertilizers in sandy soils,” in Loads and Fate of Fertilizer Derived Uranium, eds L. J. de Kok and E. Schnug (Leiden: Backhuys Publishers), 47–55.
Imseng, M., Wiggenhauser, M., Keller, A., Muller, M., Rehkamper, M., Murphy, K., et al. (2018). Fate of Cd in agricultural soils. A stable isotope approach to anthropogenic impact, soil formation, and soil-plant cycling. Environ. Sci. Technol. 52, 1919–1928. doi: 10.1021/acs.est.7b05439
Imseng, M., Wiggenhauser, M., Keller, A., Muller, M., Rehkamper, M., Murphy, K., et al. (2019a). Towards an understanding of the Cd isotope fractionation during transfer from the soil to the cereal grain. Environ. Pollut. 244, 834–844. doi: 10.1016/j.envpol.2018.09.149
Imseng, M., Wiggenhauser, M., Mueller, M., Keller, A., Frossard, E., Wilcke, W., et al. (2019b). The fate of Zn in agricultural soils: a stable isotope approach to anthropogenic impact, soil formation, and soil-plant cycling. Environ. Sci. Technol. 53, 4140–4149. doi: 10.1021/acs.est.8b03675
IUSS working group WRB (2014). World Reference Base for Soil Resources 2014. International Soil Classification System For Naming Soils And Creating Legends For Soil Maps. World Soil Resource Reports No. 106. Rome: FAO.
Jacques, D., Simunek, J., Mallantsl, D., and van Genuchten, M. T. (2006). Modelling uranium leaching from agricultural soils to groundwater as a criterion for comparison with complementary safety indicators. Sci. Basis Nuclear Waste Manag. 932, 1057–1064.
Jarvis, N. J. (2007). A review of non-equilibrium water flow and solute transport in soil macropores. principles, controlling factors and consequences for water quality. Eur. J. Soil Sci. 58, 523–546. doi: 10.1111/j.1365-2389.2007.00915.x
Jones, R. L. (1992). Uranium and phosphorus contents in morrow plot soils over 82 years. Commun. Soil Sci. Plant Anal. 23, 67–73. doi: 10.1080/00103629209368570
Kabata-Pendias, A., and Mukherjee, A. B. (2007). Trace Elements From Soil to Human. Berlin: Springer.
Knechtenhofer, L. A. I, Xifra, O., Scheinost, A. C., Fluhler, H., and Kretzschmar, R. (2003). Fate of heavy metals in a strongly acidic shooting-range soil. small-scale metal distribution and its relation to preferential water flow. J. Plant Nutr. Soil Sci. 166, 84–92.
Kratz, S., Knappe, F., and Rogasik, S. E. (2008). “Uranium balances in agroecosystems,” in Loads and Fate Of Fertilizer Derived Uranium, eds L. J. de Kok and E. Schnug (Leiden: Backhuys Publishers).
McLaughlin, M. J., Tiller, K. G., Naidu, R., and Stevens, D. P. (1996). Review. The behaviour and environmental impact of contaminants in fertilizers. Austr. J. Soil Res. 34, 1–54.
MeteoSwiss (2016). Federal Office of Meteorology and Climatology MeteoSwiss. Available online at: www.meteoswiss.admin.ch (accessed March 1, 2016).
Mortvedt, J. J. (1994). Plant and soil relationships of uranium and thorium decay series radionuclides - a review. J. Environ. Q. 23, 643–650. doi: 10.2134/jeq1994.00472425002300040004x
Pribyl, D. W. (2010). A critical review of the conventional SOC to SOM conversion factor. Geoderma 156, 75–83. doi: 10.1016/j.geoderma.2010.02.003
Read, D., Black, S., Beddow, H., Trueman, E., and Baumann, N. (2008). “The fate of uranium in phosphate-rich soils,” in Loads and Fate of Fertilizer Derived Uranium, eds L. J. de Kok and E. Schnug (Leiden: Backhuys Publishers), 65–71.
Ren, Z. L., Tella, M., Bravin, M. N., Comans, R. N. J., Dai, J., Garnier, J. M., et al. (2015). Effect of dissolved organic matter composition on metal speciation in soil solutions. Chem. Geol. 398, 61–69. doi: 10.1016/j.chemgeo.2015.01.020
Richner, W., and Sinaj, S. (2017). Grundlagen für die Düngung landwirtschaftlicher Kulturen in der Schweiz. Bern: Agroscope.
Rogasik, J., Kratz, S., Funder, U., Panten, K., Baumecker, M., Gutser, R., et al. (2008). “Uranium in soils of German long-term fertilizer experiments,” in Loads and Fate of Fertilizer Derived Uranium, eds L. J. de Kok and E. Schnug (Leiden: Backhuys Publishers), 135–146.
Salminen, R., Batista, M., Bidovec, M. D., Demetriades, A., De Vivo, B., De Vos, W., et al. (2005). Geochemical Atlas of Europe. Part 1 - Background Information, Methodology, and Maps. Espoo: Geological Survey of Finland.
Sattouf, M. (2007). Identifying the Origin of Rock Phosphates and Phosphorous Fertilisers Using Isotope Ratio Techniques and Heavy Metal Patterns. Völkenrode: Bundesforschungsanstalt für Landwirtschaft, p. 311.
Schnug, E. (2012). Uran in Phosphor-Düngemitteln und dessen Verbleib in der Umwelt. Strahlentelex 612-613, 3–7.
Schnug, E., and Lottermoser, B. G. (2013). Fertilizer-derived uranium and its threat to human health. Environ. Sci. Technol. 47, 2433–2434. doi: 10.1021/es4002357
Schulz, C., Rapp, T., Conrad, A., Hünken, A., Seiffert, I., Becker, K., et al. (2003). Trinkwasser. Elementgehalte im häuslichen Trinkwasser aus Haushalten mit Kindern in Deutschland. Kinder-Umwelt-Survey 2003/06 - KUS. WaBoLu Hefte 04/08. Dessau-Rosslau: Umweltbundesamt.
Smidt, G. A., Hassoun, R., Erdinger, L., Schäf, M., Knolle, F., and Utermann, J. (2012). “Uranium in German tap and groundwater - Occurence and origins,” in The New Uranium Mining Boom - Challenge and Lesson Learned, eds B. J. Merkel and M. Schipper (Berlin: Springer).
Spiess, E. (2011). Nitrogen, phosphorus and potassium balances and cycles of Swiss agriculture from 1975 to 2008. Nutr. Cyc. Agroecosyst. 91, 351–365. doi: 10.1007/s10705-011-9466-9
Stalder, E., Blanc, A., Haldimann, M., and Dudler, V. (2012). Occurrence of uranium in Swiss drinking water. Chemosphere 86, 672–679. doi: 10.1016/j.chemosphere.2011.11.022
Takeda, A., Tsukada, H., Takaku, Y., Hisamatsu, S., and Nanzyo, M. (2006). Accumulation of uranium derived from long-term fertilizer applications in a cultivated Andisol. Sci. Total Environ. 367, 924–931. doi: 10.1016/j.scitotenv.2006.01.006
Taylor, M. D. (2007). Accumulation of uranium in soils from impurities in phosphate fertilisers. Landbauforschung Völkenrode 57, 133–139.
Taylor, M. D., and Kim, N. (2008). “The fate of uranium contaminants of phosphate fertilizer,” in Loads and Fate of Fertilizer Derived Uranium, eds L. J. de Kok and E. Schnug (Leiden: Backhuys Publishers), 147–155.
Ulrich, A. E., Schnug, E., Prasser, H. M., and Frossard, E. (2014). Uranium endowments in phosphate rock. Sci. Total Environ. 478, 226–234. doi: 10.1016/j.scitotenv.2014.01.069
Vandenhove, H., van Hees, M., Wannijn, J., Wouters, K., and Wang, L. (2007a). Can we predict uranium bioavailability based on soil parameters? Part 2: Soil solution uranium concentration is not a good bioavailability index. Environ. Pollut. 145, 577–586. doi: 10.1016/j.envpol.2006.04.012
Vandenhove, H., van Hees, M., Wouters, K., and Wannijn, J. (2007b). Can we predict uranium bioavailability based on soil parameters? Part 1: Effect of soil parameters on soil solution uranium concentration. Environ. Pollut. 145, 587–595. doi: 10.1016/j.envpol.2006.04.011
Weil, R. R., and Brady, N. C. (2017). The Nature And Properties Of Soils. New York, NY: Pearson Prentice Hall.
World Health Organization [WHO] (2011). Uranium in Drinking-Water. Background Document For Developement of WHO Guidelines for Drinking-Water Quality 2011. Geneva: WHO.
Keywords: uranium, metal flux, metal leaching, agriculture, mineral P fertilizer
Citation: Bigalke M, Imseng M, Schneider S, Schwab L, Wiggenhauser M, Keller A, Müller M, Frossard E and Wilcke W (2020) Uranium Budget and Leaching in Swiss Agricultural Systems. Front. Environ. Sci. 8:54. doi: 10.3389/fenvs.2020.00054
Received: 24 March 2020; Accepted: 27 April 2020;
Published: 05 June 2020.
Edited by:
Laodong Guo, University of Wisconsin–Milwaukee, United StatesReviewed by:
Susan Tandy, Rothamsted International, United KingdomXueyan Jiang, Ocean University of China, China
Copyright © 2020 Bigalke, Imseng, Schneider, Schwab, Wiggenhauser, Keller, Müller, Frossard and Wilcke. This is an open-access article distributed under the terms of the Creative Commons Attribution License (CC BY). The use, distribution or reproduction in other forums is permitted, provided the original author(s) and the copyright owner(s) are credited and that the original publication in this journal is cited, in accordance with accepted academic practice. No use, distribution or reproduction is permitted which does not comply with these terms.
*Correspondence: Moritz Bigalke, moritz.bigalke@giub.unibe.ch