Structural Features of Lignin Fractionated From Industrial Furfural Residue Using Alkaline Cooking Technology and Its Antioxidant Performance
 Rui Li
 Xiaohui Wang†
  Fengxia Yue
 Xiaoying Wang
 Junli Ren
- State Key Laboratory of Pulp and Paper Engineering, School of Light Industry Science and Engineering, South China University of Technology, Guangzhou, China
Furfural, a versatile platform compound, is produced from the hydrolysis of pentose (hemicellulose) in lignocellulosic biomass. The manufacturing of furfural results in the production and accumulation of cellulose- and lignin-rich furfural residue, simultaneously. Reasonable and effective utilization of furfural residue would provide both environmental and economic benefits. In this work, alkali cooking technology was applied to extract lignin from industrial furfural residue. The effects of different alkali treatment conditions on the composition and chemical structure of extracted lignin and solid residue were studied. The results showed that extracted lignin contained abundant guaiacyl (G), syringyl (S), and p-hydroxyphenyl (H) structural units, among which the G-type lignin structural unit accounted for the main proportion. The extracted lignin samples were rich in hydroxyl, and the highest content of hydroxyl was 4.02 mM/g under the condition of T3 (135°C−0.35 M). An oxidize resistance test showed that extracted lignin showed a high inhibition effect on DPPH. The increase of lignin content in solid residue was due to the carbonization of cellulose into a lignin-like substance under the condition of a high temperature alkali treatment. This alkali cooking technology is suitable for extracting lignin from furfural residue, which has a promising application as a potential antioxidant in the food and cosmetic industry.
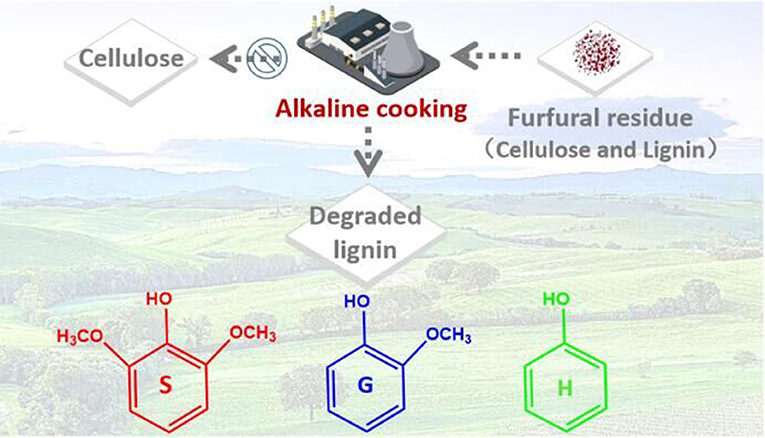
Graphical Abstract. Extraction of lignin from industrial furfural residue by alkali cooking technology.
Introduction
Furfural, a versatile industrial chemical, is regarded as a renewable, indispensable platform compound that is used for organic synthesis, solvents, petroleum refining, and pharmaceuticals. In general, furfural is derived from the dehydration of pentose (hemicellulose) in corncob, bagasse, rice husk, and other agricultural waste (Sun et al., 2008). The demand of market and industrial development drives the huge production of furfural, as about 12–15 t of furfural residue is produced for each ton of furfural production (Sun et al., 2008; Wang et al., 2019). At present, furfural residue is mostly used in the fields of heat generation, soil improvement, plant cultivation, and activated carbon synthesis (Ren et al., 2009; Wang et al., 2017), which is based on the overall utilization of
furfural residue solid waste, regardless of its composition and content. However, furfural residue is rich in cellulose (30 wt%) and lignin (63 wt%), each component having promising applications for the production of biofuels, chemicals, and materials (Wang et al., 2019). Furthermore, industrial furfural residue is a kind of organic waste with a high salt content and acidity, while the massive accumulation and unreasonable use would result in serious environmental pollution. Therefore, the reasonable and effective utilization of furfural residue would provide both environmental and economic benefits.
Most research has focused on the physical, chemical, and biological treatment of furfural residue to obtain cellulose for further utilization. However, the separation and utilization of lignin from furfural residue is scarce because of its complex structure. Lignin is a biopolymer with a three-dimensional network structure formed by three phenylpropane units, including p-hydroxyphenyl (H), guaiacyl (G), and syringyl (S). Lignin in furfural residue has the potential to be used as a reinforcing agent, antioxidants, a mineral powder binder, scale inhibitor, corrosion inhibitor, and in pharmaceuticals. At present, the main industrial methods to obtain lignin are dilute acid pretreatment, alkali pretreatment, ionic liquid treatment, and organosolv methods. The G and S-type lignin is extracted and purified by citric acid treatment from pulping black liquor (Liu Z. et al., 2009). Structural changes of corn stover lignin were studied during acid pretreatment, and the results showed that the condensation reaction became the main reaction of lignin at high temperature, which limited the depolymerization and subsequent utilization of lignin (Moxley et al., 2012). Olive residue lignin was extracted by ionic liquid triethylammonium hydrogen sulfate in Cequier's report, and the recovery yield of lignin reached 40% (Cequier et al., 2019). Two organosolv methods involving formic acid/acetic acid and sulfuric acid/ethanol solvent mixtures were investigated for lignin extraction from banana rachis biomass residue, and the obtained lignin fraction had a higher purity of 76.5 and 71.0% (Tiappi et al., 2019). Nitsos explored the characteristics of lignin isolated from spruce and birch with the use of alkaline or ethanol organosolv pretreatment, and the result showed that the molecular weight of alkaline lignin was higher than that of organosolv lignin (Nitsos et al., 2016). In summary, the cleavage of the C–O bond of lignin occurred in dilute acid treatment, and then the C–C bond was formed, which is more difficult to depolymerize. This phenomenon poses a huge challenge to the subsequent depolymerization and high value utilization of lignin. Although the higher yield and purity of lignin could be obtained by ionic liquid and organic solvent methods, the two methods are difficult to adapt to industrial production. In addition, in recent years, the acid-free pretreatment has attracted more interest to further improve lignin properties for high-value utilization (Tao et al., 2012). The condensation of lignin in raw materials could be avoided and high-performance lignin products could be obtained using alkali treatment technology, which is conducive to the utilization and development of lignin downstream industries. As an effective and simple way of lignin depolymerization, homogeneous alkaline catalysis technology has attracted the attention of researchers. Among them, alkaline cooking is a pulping method with NaOH as the catalyst and anthraquinone as the auxiliary catalyst to depolymerize lignin through the whole lignocellulosic biomass (Karp et al., 2014). Thring et al. proposed that up to 30% of small phenolic molecules could be achieved by the depolymerization of Alcell lignin with NaOH (Thring, 1994). Shabtai, Chornet, and Johnson reported that abundant small molecules were obtained by alkali depolymerization of lignin, and then the aromatics fuels such as gasoline were prepared by catalytic hydrogenation, realizing the high value utilization of lignin in the field of biofuel (Vigneault et al., 2007). Miller et al. reported the effect of alkaline strength on the depolymerization of lignin, and the results showed that strong alkali (NaOH, KOH) could produce more small molecular, than weak alkali (LiOH) (Miller et al., 1999, 2002). Katahira et al. systematically studied the structure and properties of lignins obtained from the alkali extraction residue derived after the acid and enzyme hydrolysis, deacetylation disk mill treatment, and deacetylation twin-screw treatment. Different raw materials and alkali treatment methods would lead to different depolymerization degrees and small molecule types of lignin (Katahira et al., 2016). High quality lignin could be obtained through alkali treatment technology, which is conducive to the utilization and development of downstream industries.
In this work, alkali cooking technology was applied to extract lignin from industrial furfural residue. The treatment condition was investigated as follows: 165°C−0.35 M NaOH-60 min (T1), 135°C−0.35 M NaOH-60 min (T2) and 135°C−0.20 M NaOH-60 min (T3). The structure and properties of lignin were comparatively studied under different alkaline cooking methods to examine the impact of alkali severity, and the treated solid residues were also investigated. The structural properties of extracted lignins and treated solid residues were determined using elemental analysis, gel permeation chromatography (GPC), fourier transform infrared (FTIR) spectroscopy, 2D HSQC NMR spectra, quantitative phosphorus spectrum (31P NMR), gas chromatography-mass spectrometry (GC-MS), and oxidation resistance test.
Materials and Methods
Materials
Furfural residue was obtained from the Henan biotechnology company (Henan, China), a solid residue was produced in the preparation of furfural from corncob by sulfuric acid hydrolysis. Furfural residue was washed to neutral, with a large amount of deionized water before being used, and then dried in an oven at 60°C for 12 h. The component content of the dried furfural residue was measured by NREL method (Zhang et al., 2010). The furfural residue contains 29.56% cellulose, 62.97% lignin, and 7.47% others. Deuterium pyridine, cyclohexanol, deuterium chloroform, 2-chloro-4,4,5,5-tetramethyl-1,3,2-dioxaphospholane (TMDP), 1,1-diphenyl-2-trinitrophenylhydrazine (DPPH), and 2,6-di-tert-butyl-4-methylphenol (BHT) were purchased from Mecklin Reagent Co., Ltd. (Shanghai, China). Sodium hydroxide, sulfuric acid and tetrahydrofuran were purchased from Guangzhou Chemical Reagent Co., Ltd. (Guangzhou, China). All reagents were of analytical pure grade, without any treatment before being used.
Separation and Recovery of Lignin From Furfural Residue
Furfural residue and a certain concentration of NaOH aqueous solution were fully stirred according to the solid-liquid ratio of 1:20 g/mL, and then transferred to a 100 mL Parr reactor (YZPR-100, Shanghai Yanzheng Instrument Co., Ltd.). The mixture was treated at a certain temperature for 60 min. After the reaction, the mixture was filtered. The filtrate was added to acid to precipitate lignin. The solid residue was washed repeatedly to neutral by a large amount of deionized water, and then dried in an oven at 60°C for 12 h. Based on the previous work and the screening of experimental data (Moghaddam et al., 2017), the alkali treatment conditions were determined with the yield of three components as the goal. In order to investigate the impact of the severity of alkali treatment on the extraction of lignin, three different reaction conditions were selected: 165°C−0.35 M NaOH-60 min (T1), 135°C−0.35 M NaOH-60 min (T2), and 135°C−0.20 M NaOH-60 min (T3). At the same time, in order to compare the structure of lignin in the black liquor during the pulping process, soda lignin was also extracted from corncob. Corncob was mixed with an aqueous sodium hydroxide (1 M NaOH) solution and the mixture was reacted at 170°C for 90 min in a 100 mL Parr reactor according to the solid-liquid ratio of 1:20 g/mL.
The precipitation process of lignin by adding acid was as follows: the pH value of the reaction liquid was adjusted by 2 M H2SO4 solution to precipitate the alkali extracted lignin. The steps were as follows: 2 M H2SO4 solution was added to the alkali treatment solution until the pH value was about 4.5, and stirred at room temperature for 15 min. Then 2 M H2SO4 solution was added until the pH value was about 3, and the alkali treatment solution was vibrated in an air constant temperature oscillator (THZ-C, Jiangsu Taicang experimental equipment factory) at 65°C for 30 min. The solid and liquid mixture were filtered and separated after the vibration was completed. The solid mixture was washed to neutral with deionized water and then dried in a vacuum drying oven at 40°C for 24 h. The dried solid was the precipitated lignin.
Characterization of Lignin
Component Analysis
The contents of the cellulose, hemicellulose, and lignin in the sample were measured by the standard method (NREL) of American Renewable Energy Laboratory (Zhang et al., 2010). 0.3 g of the sample was mixed with 3 mL of 72 wt% H2SO4 solution and reacted at 30°C for 60 min. Eighty four milliliter of deionized water was then added to the mixture. The mixture was transferred to a high-temperature autoclave (DSX-280kb24, Shanghai Shenan medical instrument factory) and reacted at 121°C for 60 min. After the reaction, the solid mixture and liquid were separated by G3 filter. The sugar content of liquid was detected after being filtered by a 0.22 μm aqueous filter membrane. The solid was dried to a constant weight and calcined in a muffle furnace at 575°C for 6 h. The reduced mass was the content of acid insoluble lignin. The acid soluble lignin was calculated by the absorption value of ultraviolet spectrophotometer at 205 nm. The total amount of lignin was the sum of acid soluble lignin and acid insoluble lignin. Cellulose and hemicellulose were calculated according to the following formula:
CGlu and CXyl+Ara represent the concentrations of glucose, xylose, and arabinose, mg/L, respectively; 0.90 and 0.88 are the coefficients of the conversion of cellulose and hemicellulose into glucose, xylose, and arabinose, respectively (Zhang et al., 2010).
The yield of extracted lignin samples was calculated according to the following formula (3):
YieldLignin, WLignin, and WFR represent the yield of extracted lignin, the mass of extracted lignin, the mass of furfural residue.
Molecular Weight Analysis
The 10 mg lignin sample was dissolved in 10 mL tetrahydrofuran and the mixture was filtered by an 0.22 μm organic filter membrane. The filtered liquid was injected into the gel chromatograph (Agilent 1260, USA) to determine sample molecular weight. The column was PL-gel 5 μm 103 Å and PL-gel 3 μm Mixed-3 (Series connection), the mobile phase was tetrahydrofuran, the flow rate was 1 mL/min, and the standard sample was 800–49,400 g/mol polystyrene.
Functional Group and Element Analysis
The infrared spectrum was determined by TENSOR27 (Bruker company Germany). A certain amount of sample was mixed with potassium bromide according to the mass ratio of 1:100. The scanning range was 4,000–400 cm−1. The contents of carbon (C), hydrogen (H), nitrogen (N), sulfur (S), and oxygen (O) in the lignin samples were determined by element analyzer (Vario EL cube, Germany). At the same time, according to the alkane formula CnH2n+2 and the relative content of elements, the C9 expression of lignin samples were calculated (Moghaddam et al., 2017).
2D HSQC NMR Spectra Analysis
More detailed chemical structure information for lignin samples could be provided by 2D HSQC NMR spectra. The lignin samples were analyzed on a 600 MHz Bruker AVANCE III (Karlsruhe, Germany) spectrometer. Thirty milligram of lignin was dissolved in 1-mL DMSO-d6, and then transferred to an NMR tube for testing. The spectrum width of the hydrogen spectrum and carbon spectrum were 5,000 and 20,000 kHz, respectively. The total number of samples collected in the one-dimensional hydrogen spectrum was 1,024, and the relaxation time was 1.5 s. The total number of acquisition points of one-dimensional carbon spectrum was 256 and the cumulative number is 64 times. The software used for data processing was mestrenova 6.1.1. It should be noted that the 2D HSQC NMR spectra of corncob and the furfural residue were tested according to the reference (Kim et al., 2008a). Eighty milligram of the sample, after full milling, was swelled in 0.75 mL DMSO-d6. The data was measured according to the above set parameters.
Quantitative Phosphorus Spectra Analysis
According to the reference (Granata and Argropouls, 1995; Akim et al., 2001), the content of hydroxyl in lignin samples were determined by quantitative phosphorus spectroscopy (31P-NMR). Twenty milligram of the lignin sample, 100 μL solution B, and 0.5 mL solution A were mixed. After full dissolution, 0.1 mL solution C was added, and then 0.1 mL of phosphating agent (TMDP) was added until the above mixture mixed well. The mixture was measured immediately after 15 min. Solution A was a mixture of deuterium pyridine and deuterium chloroform with the volume ratio of 1.6:1. Solution B was internal standard reagent, which was made using the following method: 54.25 mg of cyclohexanol was accurately weighed and then fixed with 5 mL solution A. Solution C, as a relaxation agent, was a 5 mg/mL chromium acetylpyruvate solution.
Pyrolysis Analysis
The fast pyrolysis of lignin samples was performed using a high temperature Tandem u-Reactor RX-3050TR pyrolyzer, and the pyrolysis products were characterized by gas chromatography-mass spectrometry (GC-MS, Agilent 7890B/5977A, USA). The 0.50-mg lignin sample was pyrolyzed at 500°C. The initial temperature was set at 50°C and maintained at this temperature for 1 min. The temperature then rose to 280°C at 6°C/min and was maintained at this temperature for 5 min. The pyrolyzed gas was put into gas chromatography for detection under helium purging. The carrier gas flow was 50 mL/min, and the split ratio was set as 30:1. After pyrolysis, the mass spectrum peaks were compared with the results in the National Institute of Standards and Technology (NIST), and the identified chemicals were analyzed quantitatively according to the literature.
Oxidation Resistance Test
According to Lu et al. (2012), DPPH (1,1-diphenyl-2-trinitrophenylhydrazine) was used to determine the antioxidant capacity of lignin. Different amounts of lignin were dissolved in a 0.1-mL water/dioxane (1/9, V/V) mixture to prepare 0.05–5 mg/mL of lignin solution. 3.9 mL DPPH ethanol solution (25 mg/L) was then added to the above solution. The absorption of the sample at 517 nm was determined by ultraviolet visible spectrophotometer (UV-1800, Shimadzu, Japan). The inhibition rate of lignin on DPPH was calculated according to the following formula (4):
A0 was the absorbance of the control sample, A1 was the absorbance after reaction with lignin.
Characterization of Solid Residues
Component Analysis
The solid residues obtained by different alkali treatment conditions were defined as R1, R2, R3, and R4, respectively. The procedure for determining the lignin composition were the same as those for the above extracted lignin samples. The yield of solid residues was calculated according to the following formula (5):
YieldSR, WSR and WFR represent the yield of solid residue, the mass of solid residue, the mass of furfural residue.
Functional Group Analysis
The infrared spectrum of corncob, furfural residue, and the solid residue were determined by attenuated total reflection fourier transform infrared spectroscopy (ATR-FTIR). The infrared spectrum of the sample was determined by vertex 70 (Bruker company, Germany). A certain amount of the sample was mixed and ground with KBr according to the mass ratio of 1:100. Thirty-two scans were performed at a resolution of 2 cm−1 with a scanning range of 4,000–400 cm−1.
Solid State NMR Spectra Analysis
The solid-state NMR spectra (CP/MAS 13C NMR) of the samples were determined by the 400 M Bruker NMR (AVANCE III HD 400). The 4-mm rotary tube was used, and the speed was 5 kHz. The contact time and pulse delay time were 1.5 ms and 3.16, respectively (Dong et al., 2013).
Results and Discussion
Composition Analysis
The element content, empirical formula, and C9 form structural formula of corncob furfural residue and NaOH extracted lignin samples were studied (Table 1). The C9 form structural formula indicated that the sample was a hydroxyphenyl structure, which was calculated from six carbon benzene rings and three carbon propane side chains. The components content of corncob, furfural residue and extracted lignin samples were also measured (Table 2). As shown in Table 1, compared with corncob, the content of hydrogen (H) and oxygen (O) in furfural residue were significantly reduced, because corncob was composed of three major components: cellulose (C6H12O6), hemicellulose (C5H10O5), and lignin (C10H14O). In view of the structural formula of the three components, the proportion of hydrogen and oxygen in cellulose and hemicellulose were relatively high, and the proportion of carbon in lignin was relatively high. Combined with the thermal stability of these three components and the proportion of the content in biomass, the decrease of H and O content in furfural residue was attributed to the conversion of hemicellulose into furfural (Gallo et al., 2013), which was in accordance with the fact that no xylan was detected in furfural residue (Table 2). Compared with furfural residue, the content of carbon (C) and hydrogen (H) in the alkali extracted lignin sample were increased, while the content of oxygen (O) was decreased. According to the proportion of C, H, and O elements in the three components, the alkali treated lignin samples didn't contain or contained a small amount of xylan and glucan (T1 and soda lignin contained a small amount xylan and glucan, Table 2), which showed that cellulose and hemicellulose were completely removed from lignin. The content of hydrogen in the lignin samples was higher than that in the furfural residue, meaning that the lignin samples may contain relatively high hydroxyl content.
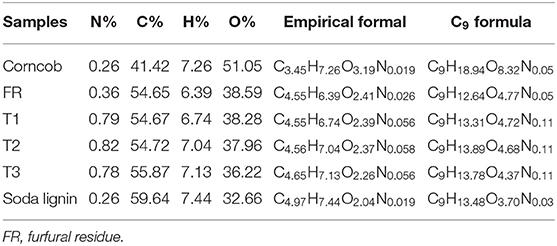
Table 1. Elemental analysis and formula of corncob, furfural residue, and extracted lignin samples.
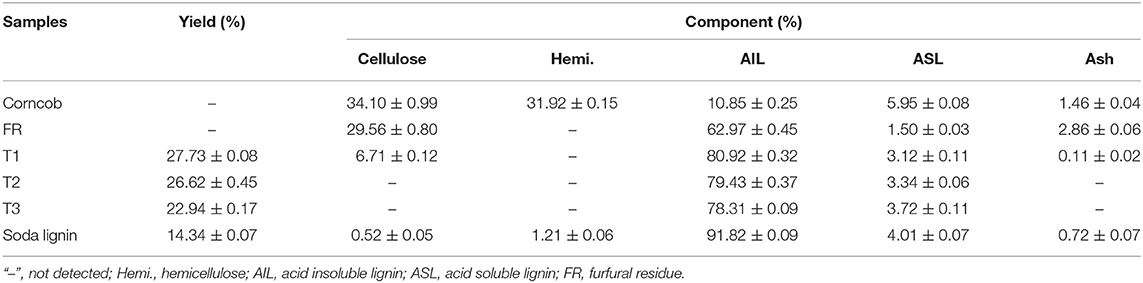
Table 2. Yield and chemical composition of corncob, furfural residue and extracted lignin samples.
The yield and component content of lignin samples obtained by alkali cooking technology were shown in Table 2, T1 and soda lignin contained 6.7 and 0.5% cellulose, while no cellulose was detected in other lignin samples (T2 and T3), which may be related to the more lignin-carbohydrate complex (LCC) in alkali extract liquor of corncob and furfural residue. LCC and lignin with a higher molecular weight were easily extracted by a stronger alkali solution (Zhu, 2008). The content of acid insoluble lignin in soda lignin was higher than that in other samples. The cell wall of corncob was easily damaged by strong alkaline treatment, and more lignin with a high molecular weight was dissolved to form soda lignin (Phongpreecha et al., 2017). Moreover, another reason was that H2SO4 was industrially used to remove the most hemicellulose and a part of lignin from corncob, so furfural residue was lower for acid insoluble lignin. The lignin content of furfural residue after alkaline cooking treatment also confirmed this phenomenon. The yields of lignins obtained from T1, T2, and T3 were in the order of T1 > T2 > T3. The high yield of lignin was obtained by severe alkali treatment of furfural residue.
It could be explained that the higher molecular weight lignin was dissolved with harsh alkali treatment conditions, further accumulated and precipitated in the acid precipitation method, thus more acid insoluble lignin was obtained. The order of the molecular weight of lignin samples was T1 > T2 > T3, which also showed that lignin with a larger molecular weight could be dissolved in a strong alkaline environment (Table 3) (Thring, 1994; Phongpreecha et al., 2017). The precipitation of the above alkali extracted lignin was related to the molecular weight of lignin. A large amount of alkali soluble lignin could not be precipitated due to its small molecular weight. Only a small amount of high molecular weight lignin extracted by strong alkaline conditions could be precipitated (Zhu, 2008). Therefore, a higher lignin yield could be achieved under stronger alkali treatment conditions.
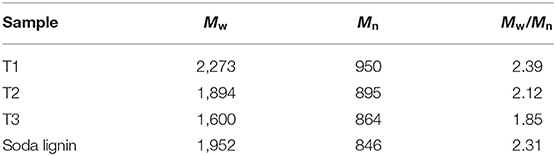
Table 3. Molecular weight distribution of the extracted lignin samples.
Functional Group Analysis
In order to better understand the structure changes of samples during the preparation of furfural, the attenuated total reflection (ATR) of corncob and furfural residue are shown in Figure 1A. The vibration peak at 896 cm−1 is the characteristic peak of the β- glucoside bond (Sun et al., 2012), which was obviously weakened after acid treatment, indicating that cellulose was destroyed or degraded during the preparation of furfural from corncob catalyzed by strong acid (H2SO4). Hemicellulose is a kind of polymer composed of many monosaccharides, its infrared characteristics come from the C=O stretching vibration in acetyl and carboxyl groups. The vibration peak of corncob at 1,725 cm−1 assigns to the C=O stretching vibration in hemicellulose, the vibration peaks at 1,371 and 1,248 cm−1 assign to the C–O stretching vibration in polysaccharide, and the C–O stretching vibration in hemicellulose acetyl, and the vibration peak at 996 cm−1 is the typical absorption peak of the arabinose based xylan structure, which disappeared or weakened after acid treatment. The C–O stretching vibration appeared at 1,025 cm−1 and decreased sharply to 1,158 cm−1. The changes of the above vibration peaks indicated that hemicellulose was degraded to a large extent (Rahimi et al., 2016). After acid treatment, the vibration peak of furfural residue at 1,057 cm−1 belongs to C=O and OH vibration. Lignin is a kind of aromatic polymer with many complex functional groups. In Figure 1A, the vibration peak at 1,513 cm−1 belongs to the aromatic skeleton vibration of lignin, and the vibration peak at 1,602 cm−1 assigns to the stretching vibration of the aromatic skeleton and C=O. After acid treatment, the two vibration peaks increased significantly, which was attributed to the increase of lignin relative content in corncob after the conversion of hemicellulose to furfural (Liu L. et al., 2009; Xu et al., 2015), indicating that the residual solid residue of corncob, after the preparation of furfural by acid catalysis, contained lignin and retained the basic structure of lignin.
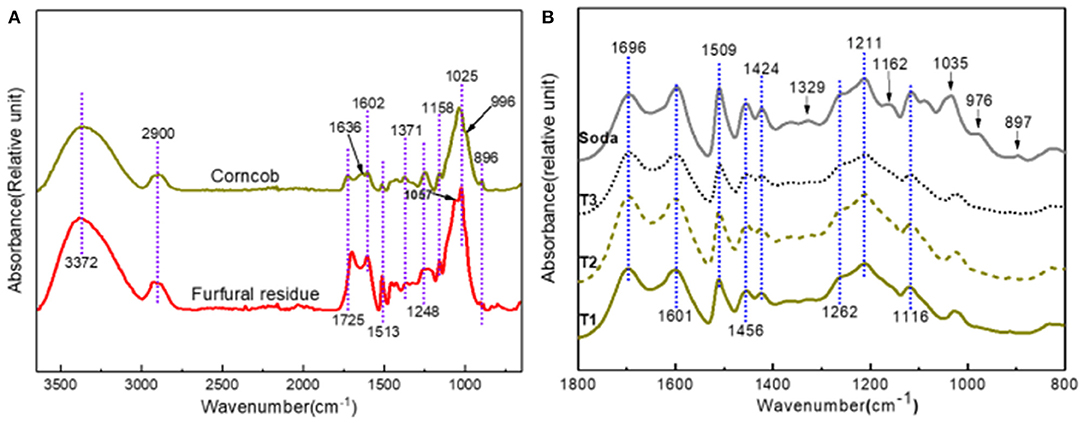
Figure 1. ATR spectra of corncob, furfural residue (A) and extracted lignin samples (B).
The infrared spectra of alkali extracted lignin samples are shown in Figure 1B. The infrared spectra of lignin samples under different alkali treatment conditions were very similar. The three main characteristic peaks of the lignin structure, such as 1,601, 1,509 and 1,424 cm−1, were obviously present in the infrared spectra of lignin samples, indicating that the basic lignin structure existed in the samples. The vibration peak at 1,695 cm−1 belongs to the C=O stretching vibration in the non-conjugated ketone or carbonyl compounds (Yang et al., 2013). The vibration peak intensity of the lignin samples was similar, indicating that the lignin obtained from corncob and furfural residue were oxidized, and a similar degree was observed (Yang et al., 2013). The vibrations at 1,601, 1,509, 1,456, and 1,424 cm−1 are attributed to the vibration of lignin aromatic skeleton and C–H deformation vibration (Xu et al., 2013; Rodríguez-Gutiérrez et al., 2014). Compared with the vibration peak of the lignin sample in furfural residue, the signal peak of the soda lignin sample was stronger, which indicated that the soda lignin sample contained a greater benzene ring structure. The signal peaks at 1,329 and 1,116 cm−1 are derived from the C–H vibration in syringyl based structural units (Villaverde et al., 2009). These characteristic peaks disappeared or weakened in lignin samples, indicating that there was a relatively rich syringyl in soda lignin. In addition, the signal peaks at 832 and 1,035 cm−1 belong to the C–H vibration in the p-hydroxyphenyl structural unit. The signal peak at 1,162 cm−1 is the characteristic peak of p-hydroxycinnamic acid. The vibration at 1,262 cm−1 is related to the C=O stretching vibration in the guaiacyl structural unit. The peak at 1,211 cm−1 belongs to the vibration of C–C, C–O, and C=O in the condensed guaiacyl structural unit (Barsbay and Güner, 2007; Miao et al., 2014).
2D HSQC NMR Spectra Analysis
The 2D HSQC NMR spectra and the main structure of corncob and furfural residue are displayed in Figure 2, and the assignment of signal peaks of lignin and carbohydrate in 2D HSQC NMR spectra are summarized in Table 4. The 2D HSQC NMR spectra of Figure 2A shows that the carbohydrate found in corncob was mainly xylan, and the signal peak of cellulose was weak or even disappeared, which was due to the decrease of the fluidity of crystalline cellulose in the corncob and the overlap of some signal peaks (Kim et al., 2008b). The signal peaks of X2, X3, X4, and X5 in corncob are attributed to C2/H2, C3/H3, C4/H4, and C5/H5 in β-D-xylopyranoside of corncob xylan. The signal peaks at X2'and X3' are derived from the partial acetylation of C2 and C3 in xylan (Rencoret et al., 2009). The signal peaks of other carbohydrates including X1, X1', and GL1(hem) belong to β-D-xylopyranoside, 2-O-acetyl-β-D-xylopyranoside, and C1/H1 in (1 → 3) + (1 → 6)-β-D-glucopyranoside (Van Erven et al., 2017). The 2D HSQC NMR spectrum of furfural residue was obviously different from that of corncob, and the results are illustrated in Figure 2B. The signal peaks of xylose (X1, X2, X3, X4, X5) or acetylated xylose (X1', X2', X3') disappeared completely in furfural residue, because hemicellulose was hydrolyzed and dissolved during the preparation of furfural from corncob. There were some carbohydrate signal peaks in furfural residue, which came from cellulose or modified cellulose. GlI, Gl(R), and Gl(NR) belong to unchanged cellulose or cellulose containing reducing and non-reducing end groups in furfural residue, respectively (De Menezes et al., 2017). These changes indicated that the cellulose of corncob was modified or degraded in the production process of furfural.
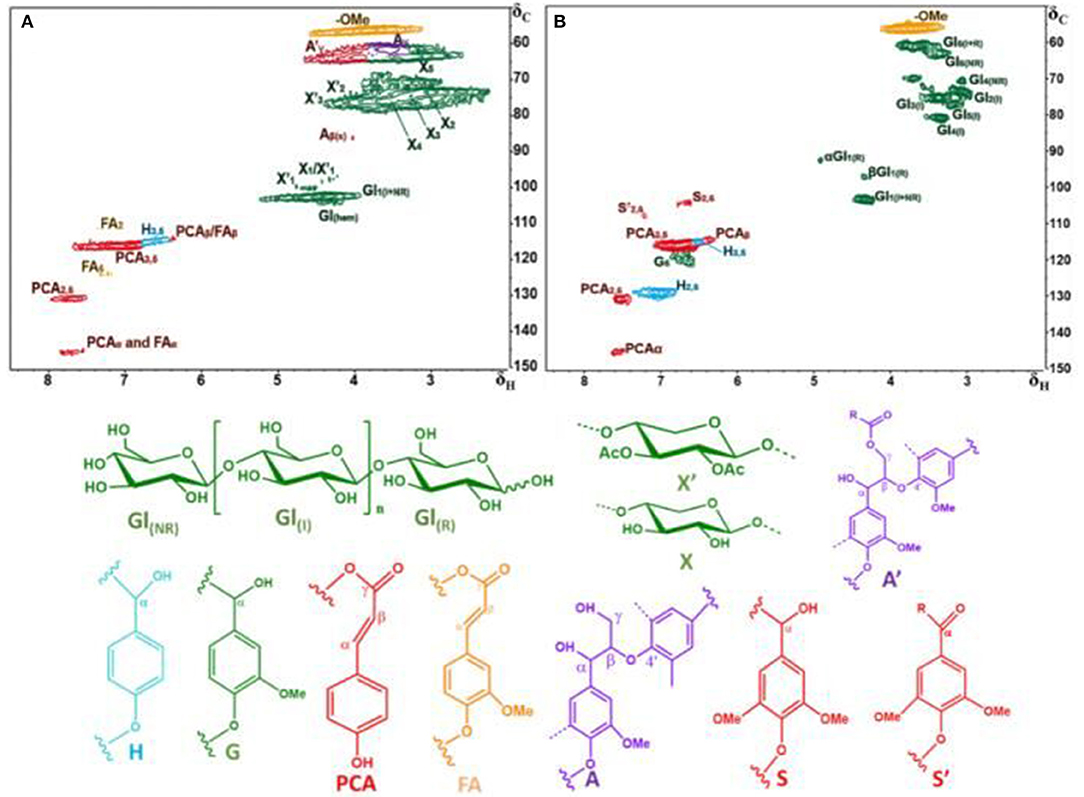
Figure 2. 2D-HSQC NMR spectra and the main structures of the corncob (A) and furfural residue (B).
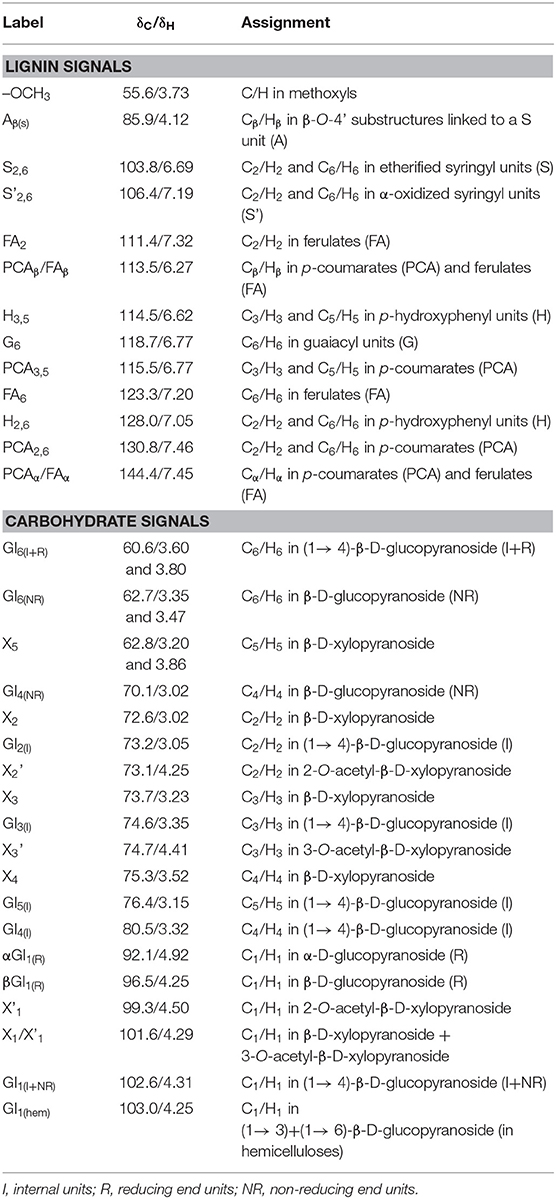
Table 4. Assignment of 13C/1H correlation of signals in the 2D HSQC NMR spectra.
Figure 3 presents the 2D HSQC NMR spectra of alkali extracted lignins and soda lignin. In Figure 3, the H, S, G, and PCA structural units were mainly distributed in the aromatic regions of these lignin samples. Although clear signals of lignin units were observed in the aromatic regions, no signals were detected in the lignin linkages regions. The reason is as follows: the signal of lignin linkages regions and side chain structure were lost due to the serious damage caused by alkali treatment, while the strong signals of lignin were observed because the benzene ring structure of lignin was not damaged. The signal peaks at δC/δH 106.4/7.19 were observed in all lignin samples, which belong to the oxidation structure (S') of the S structural unit at C2, 6/H2, 6, indicating that the structure of lignin samples was partially oxidized (Kaparaju and Felby, 2010). The signal peaks of the lignin samples at δC/δH 114.9/6.77 belong to the C3, 5/H3, 5 structure in the H structural unit, and were also related to C5/H5 in the G unit and C3, 5/H3, 5 in PCA. C2, 6/H2, 6 in H structural units were also observed at δC/δH 127.9/7.19. In addition, the signal peaks at 110.8/6.97, 114.5/6.70, and 119.0/6.78 of δC/δH belong to C2/H2, C5/H5, and C6/H6 structures in the G-type unit (Mousavioun and Doherty, 2010; Rönnols et al., 2015), indicating that G-type units existed in all lignin samples and the content was relatively rich, which was closely related to the types and characteristics of raw materials. The lignin samples extracted from furfural residue contain abundant G, H, S units, and the S-type unit was easy to oxidize.
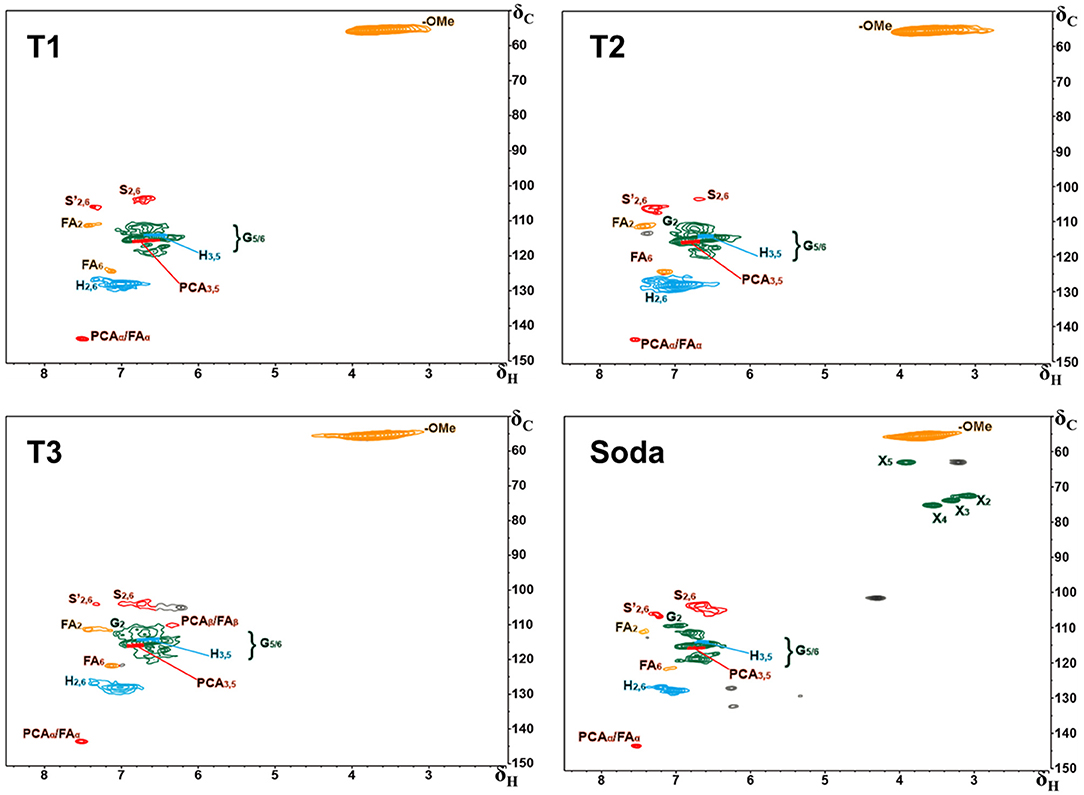
Figure 3. 2D-HSQC-NMR spectra of the extracted lignin samples.
Quantitative Phosphorus Spectra Analysis
The quantitative phosphorus spectra of alkali extracted lignins and soda lignin are illustrated in Figure 4. Based on the analysis of quantitative phosphorus spectra, the functional groups on the lignin samples of TMDP phosphating were quantified (Table 5). From Table 5, there was no significant difference between the hydroxyl content of the soda lignin sample and that of the alkali extracted furfural residue lignin, and the hydroxyl content of lignin from T3 was significantly higher than that of soda lignin. The order of hydroxyl content in lignin samples was T3 > T2 > T1, which was due to the different severities of the alkali treatment conditions. Compared with soda lignin, the hydroxyl content of guaiacyl (non-condensed) in the alkali extracted lignin samples decreased while that of p-hydroxyphenyl increased. Moreover, with the harsh conditions of alkali extraction, the hydroxyl content of guaiacyl (non-condensable) in the obtained lignin samples decreased more and more seriously, which was related to the loss of methoxyl in the guaiacyl structural units during alkali extraction (Rönnols et al., 2015). However, compared with the soda lignin sample, the content of carboxyl and hydroxyl groups in the alkali extracted lignin samples increased significantly, which may be related to the oxidation of lignin in the production process of furfural or the impurities of fatty acids in lignin (Constant et al., 2016). Thus, the highest content of hydroxyl in the lignin samples was 4.02 mM/g under T3, which was higher than that in the soda lignin samples (3.41 mM/g). Therefore, lignin samples with rich hydroxyl content could be obtained from furfural residue in the appropriate alkaline extraction condition. The lignin could be used as additives of some antioxidants (Mousavioun and Doherty, 2010), which is of great significance for the efficient utilization of lignin in furfural residue.
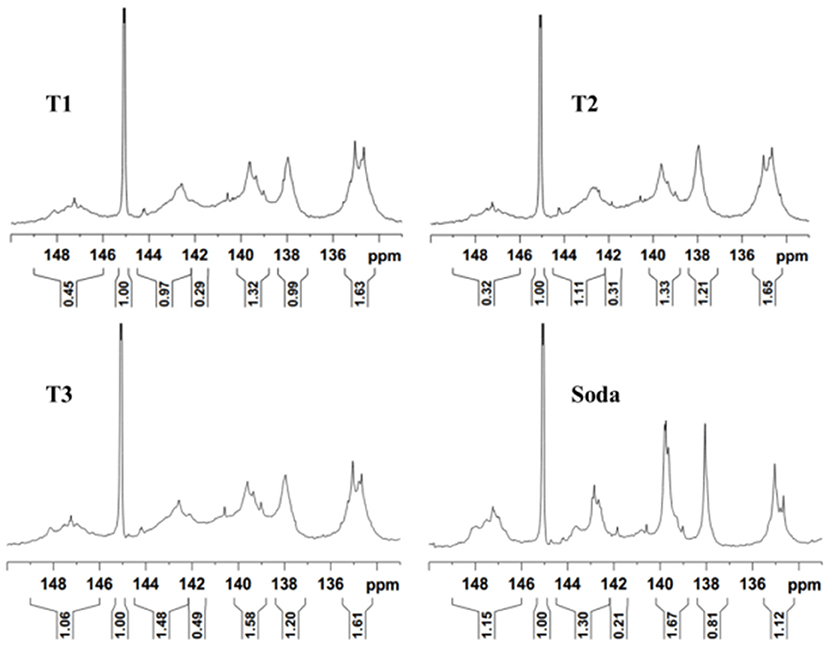
Figure 4. 31P-NMR spectra of the extracted lignin samples.
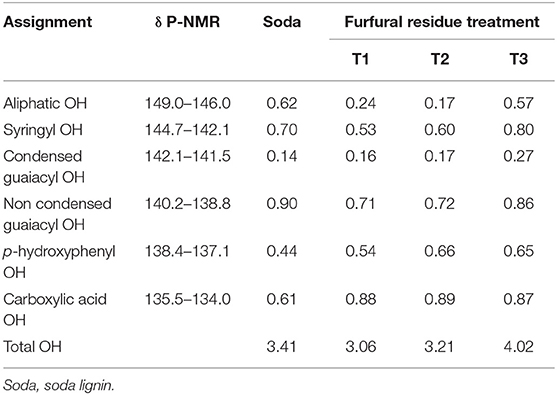
Table 5. 31P-NMR results of the extracted lignin samples (mM/g).
Pyrolysis Analysis
The samples of corncob, furfural residue, and extracted lignin were analyzed by pyrolysis gas chromatography-mass spectrometry (PyGC-MS). The degradation products and relative abundance of lignin samples are listed in Table S1. It is obvious that the main small molecules produced in the pyrolysis of lignin samples were p-hydroxyphenyl (H), syringyl (S), and guaiacyl (G). The relative contents of phenols derived from lignin and the contents of H, G, S, and S/G are listed in Table S1. The high content of 4-vinylguaicol was produced in the pyrolysis of corncob, furfural residue, and lignin samples, which had a significant impact on the content of the G unit in the pyrolysis products. However, it should be noted that 4-vinylguaicol was mainly derived from the decarboxylation of ferulic acid in gramineous materials (Del Río et al., 2012; Río et al., 2015). In other words, this part of the guaiacyl structural unit was from ferulic acid. Therefore, this part of guaiacyl could not be used as a part of the G-type structural unit to calculate the ratio of H, G, S. After the removal of 4-vinylguaicol, the ratio of H, G, S and the ratio of H, G, S containing 4-vinylguaicol are also listed in Table S1. Obviously, there were significant differences in the composition of lignin in different samples. Taking 4-vinylguaicol into account, corncob and furfural residue contained abundant G-type unit (46.5 and 49.3%). After 4-vinylguaicol was not considered, the G-type structural unit in corncob decreased to 30.5%, which confirmed that 4-vinylguaicol was released from the G-type structural unit and ferulic acid. However, the change of the G-type structural unit in furfural residue was not significant at 41.5%, implying that there was an abundant G-type structural unit in furfural residue, which could also be seen from 2D HSQC NMR spectra. Many small phenolic molecules were released from lignin samples, according to the degree of treatment, and the contents of H, G, and S were obviously different. As the treatment conditions become more and more severe, the content of the H-type unit increased gradually, and the proportion of the G-type unit and S-type unit decreased, which may be related to the removal of methoxyl in the G-type and S-type units under severe conditions (Harman-Ware et al., 2013). The content of the G-type unit of lignin samples under T1, T2, and T3 was 29.9, 36.9, and 42.3%, respectively. The results of Py-GC/MS showed that similar S/G (1.0–1.1) values and a high proportion of the G-type unit were present in the three lignin samples. Therefore, the extracted lignin could be applied in many chemical fields based on the chemical properties. Lignin, which contains a lot of hydroxyl, could be used to scavenge free radicals, develop antioxidant products, and to provide reactivity for the synthesis of phenolic resin. Lignin with a large number of G-type units could activate the benzene ring, which has potential in the synthesis of benzene ring structures containing methoxy groups.
Antioxidant Analysis
Figure 5 displays the inhibition of different lignin samples on DPPH. The clearance rate of lignin samples to DPPH was significantly related to its concentration. The inhibition rate of DPPH increased with the increase of lignin concentration. Among them, the antioxidant activity of the lignin sample extracted under T3 was the best one, and the scavenging rate of the DPPH radical was 91.5%. The order of the antioxidant strength of samples was as follows: T3 > soda lignin > T2 > T1 > BHT > furfural residue > corncob, shown in Figure 5. Obviously, the antioxidant activity of lignin samples obtained by alkali extraction was higher than that of commercial antioxidant BHT, which was related to the hydroxyl content in lignin samples by alkali extraction, and the conclusion was consistent with the results of the phosphorus spectrum test. However, the oxidation resistance of corncob and furfural residue was weak, which may be related to the characteristics of the sample itself and the undissolved lignin. Therefore, lignin samples extracted under different alkali conditions have a promising application as potential antioxidants in food and cosmetics.
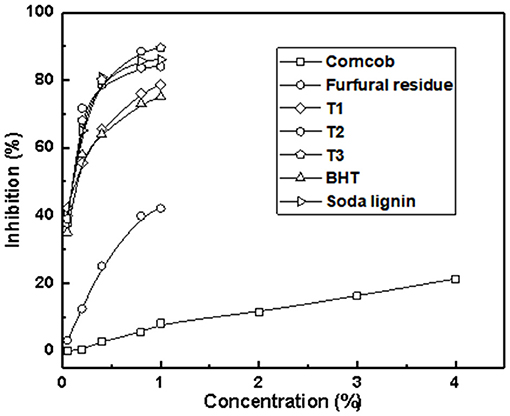
Figure 5. Scavenging activity of lignin samples compared with commercial antioxidants for DPPH radical.
Solid Residue Analysis
Component Analysis
The components of corncob, furfural residue, and the alkali treated solid residue were analyzed, and the results are shown in Table 6. Obviously, 77.25% glucan was observed in the alkali treated corncob solid residue, and the yield of the solid residue was 28.11%. The glucan content was significantly higher than that of the corncob and furfural residue because lignin in the raw material was removed by alkali extraction. However, after alkali treatment of furfural residue, the content of glucan in solid residues were 7.89, 10.55, and 12.70%, and the corresponding yields were 63.4, 64.7, and 75.4 under T1, T2, T3. This result showed that the content of glucan in alkali treated furfural residue was significantly reduced, and with the severity of alkali treatment, the content of glucan in furfural residue decreased. This results were contrary to the increase of glucan content in alkali treated corncob, which was attributed to the removal of hemicellulose in the process of preparing furfural by acid catalysis. The removal of hemicellulose further resulted in the exposure of cellulose to the alkali solution, so partial cellulose was degraded into small molecules in the reaction solution (Yang and Pei, 2001). In addition, the increase of acid insoluble lignin content in solid residue was mainly due to the carbonization of partial cellulose into lignin-like substances under the condition of high-temperature alkali treatment. Furthermore, the harsh alkali treatment conditions lead to the aggravation of cellulose carbonization (Hoekman et al., 2011). As shown in Table 2, the dissolution rate of lignin also increased when increasing the severity of reaction conditions. The dissolution rates of lignins were 27.7, 26.6, and 22.9% under T1, T2, and T3, while the content of acid insoluble lignin in solid residues were 82.41, 74.78, and 70.43%, respectively (Table 6), which also indicated that some lignin-like black carbon may be produced under the condition of a high-temperature alkali treatment. These results showed that the removal of lignin by alkaline cooking technology was not suitable for cellulose utilization from industrial furfural residue.
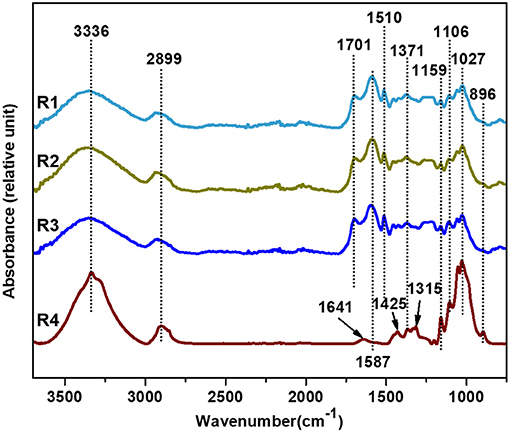
Figure 6. FT-IR spectra of the alkali treated furfural residue.
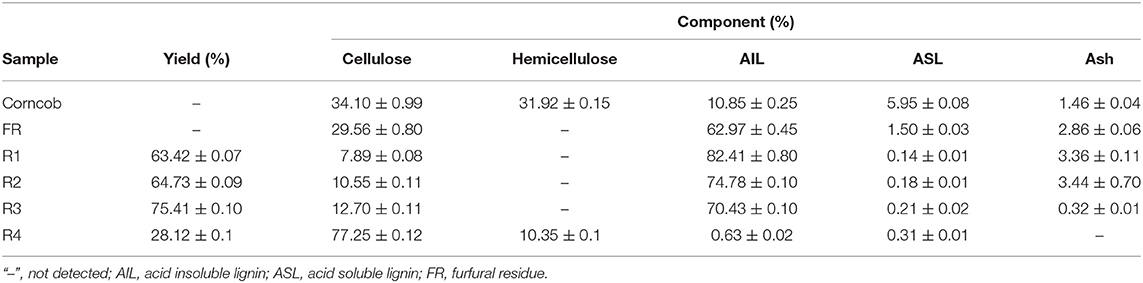
Table 6. Chemical composition of the corncob, original and alkali treated furfural residues.
The total mass balance of extracted lignin samples and alkali treated solid residues in the separation and recovery process is shown in Table 7. The reduction of total mass after separation was mainly due to the hydrolysis of cellulose in the reaction solution and the carbonization of cellulose to form lignin-like substances. The components of solid residue were mainly cellulose and lignin-like substances generated by cellulose.
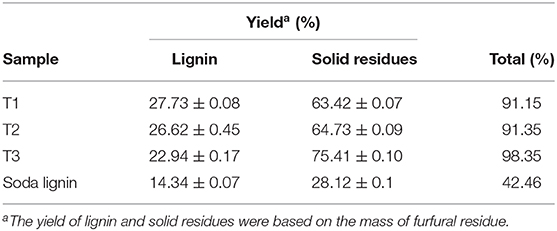
Table 7. The total mass balance of extracted lignin samples and alkali treated solid residues in the separation and recovery process.
Functional Group Analysis
The infrared spectra of solid residues extracted from furfural residue under different alkali treatment conditions are shown in Figure 6. There was a similar structure in solid residues under different alkali treatments. The absorption peaks at 1,587 and 1,510 cm−1 are attributed to C=C stretching vibration on the skeleton of the lignin benzene ring, which indicated that there were lignin-like structure substances in solid residues. Vibrations at 2,899, 1,425, 1,371, 1,159, 1,106, 1,027, and 896 cm−1 are related to the cellulose in solid residues. Among them, the vibration at 1,425 cm−1 is attributed to the asymmetric bending vibration of C–H in methyl –CH3 and methylene –CH2. The absorption peak at 1,371 cm−1 is –CH bending vibration and C–O stretching vibration in cellulose (Ma et al., 2015). The strength of characteristic peaks (1,425, 1,159, 1,027, and 896 cm−1) of cellulose in furfural residue solid residue was significantly lower than that of cellulose in corncob solid residue, indicating that partial cellulose in furfural residue was degraded, dissolved, or carbonized into lignin-like structure substances, which was consistent with the results of the component analysis in Table 6. Moreover, the characteristic peak intensity of lignin (1,587 and 1,510 cm−1) in the furfural solid residue was significantly higher than that in corncob solid residue, implying that the lignin of corncob was effectively dissolved in the alkali solution, but the lignin dissolution of furfural residue was poor, and could even not be dissolved.
Solid State NMR Spectra Analysis
The structure of corncob, furfural residue, and solid residue was analyzed by solid-state NMR spectra, and the results are shown in Figure 7. Compared with untreated corncob and furfural residue, the relative strength of the cellulose signal peak in alkali treated solid residue was weakened, and the lignin signal peak was enhanced, which was consistent with the results of the component and functional group analysis. The intensity of signal peaks at 89.1 or 88.9 ppm was weakened, indicating that the crystalline cellulose in furfural residue was destroyed and the relative content of cellulose was reduced under alkali treatment. The decrease of signal peak at 83.4 or 84.2 ppm showed the decrease of amorphous cellulose, which was due to the destruction of the cellulose structure by alkali treatment, indicating that partial cellulose had undergone a peeling reaction and gradually dissolved into small molecules (Liu et al., 2006a). The signal peaks at the chemical shifts of 126.9 or 128.9 ppm and 148.3 or 147.5 ppm are attributed to the carbon in the benzene ring structure of lignin and the carbon in the β-O-4 structure of the syringyl group, respectively (Liu et al., 2006b). The signal peak at 56.4 ppm is attributed to the carbon of the methoxy group in the lignin aromatic structure (Dong et al., 2013). Compared with the untreated corncob and furfural residue, the signal relative intensity of lignin or lignin-like substances in the solid residue was enhanced, indicating that the relative content of lignin-like substances increased after alkali treatment, which was related to the carbonization of partial cellulose.
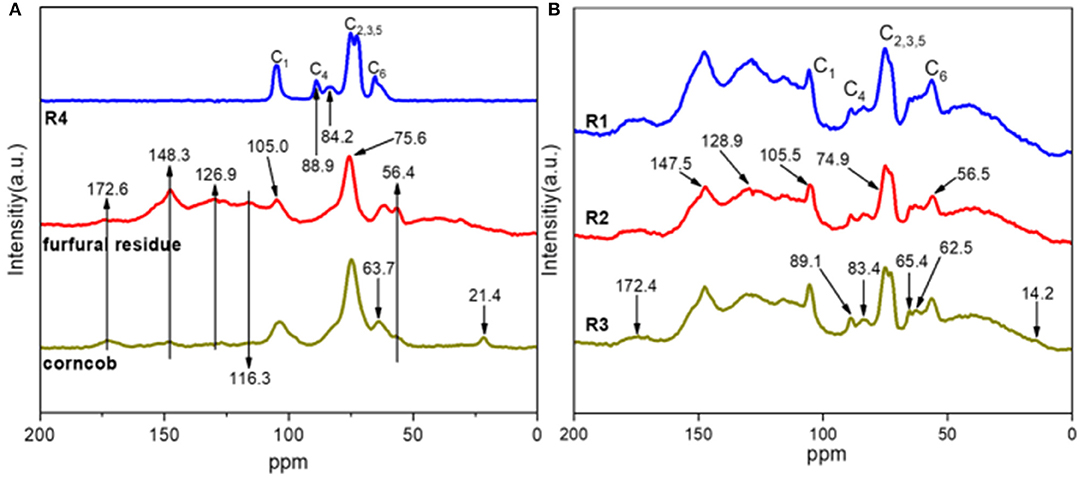
Figure 7. 13C CP/MAS NMR spectra of corncob, alkali treated corncob, original (A), and alkali treated furfural residue (B).
Conclusion
This study has provided insightful information on the composition and structural characteristics of alkali extracted lignin from furfural residue and its solid residue. The basic structural units (G, S, and H) were present in extracted lignin, in which the G-type unit accounted for the main proportion. The hydroxyl content was rich in lignin, and the highest hydroxyl content was 4.02 mM/g by T3. Moreover, the alkaline cooking treatment had little influence on the structure of the obtained lignin, and the extracted lignin had a great inhibition effect on DPPH free radicals, which give them special properties for different applications, particularly as potential antioxidants in food and cosmetic industry.
Data Availability Statement
All datasets generated for this study are included in the article/Supplementary Material.
Author Contributions
RL, XiaohW, and QL designed and finished the preparation and characterization analysis of lignin. FY, CL, XiaoyW, and JR supervised the project, helped design the experiments, and evaluated the data. The results of the manuscript were discussed by all authors.
Funding
This work was supported by the Program for National Natural Science Foundation of China (Nos. 21978104 and 21576103), the Nature Science Foundation of Guangdong Province (No. 2019A1515011654), The Guangdong Program for Support of Top-notch Young Professionals (No. 2016TQ03Z585), and the Fundamental Research Funds for the Central Universities of SCUT, China (Nos. 2019PY17, 2019PY13).
Conflict of Interest
The authors declare that the research was conducted in the absence of any commercial or financial relationships that could be construed as a potential conflict of interest.
Supplementary Material
The Supplementary Material for this article can be found online at: https://www.frontiersin.org/articles/10.3389/fenrg.2020.00083/full#supplementary-material
References
Akim, L. G., Argyropoulos, D. S., Jouanin, L., Leplé, J.-C., Pilate, G., Pollet, B., et al. (2001). Quantitative 31P NMR spectroscopy of lignins from transgenic poplars. Holzforschung 55, 386–390. doi: 10.1515/HF.2001.064
Barsbay, M., and Güner, A. (2007). Miscibility of dextran and poly(ethylene glycol) in solid state: effect of the solvent choice. Carbohydr. Polym. 69, 214–223. doi: 10.1016/j.carbpol.2006.09.028
Cequier, E., Aguilera, J., Balcells, M., and Canela-Garayoa, R. (2019). Extraction and characterization of lignin from olive pomace: a comparison study among ionic liquid, sulfuric acid, and alkaline treatments. Biomass Convers. Biorefin. 9, 241–252. doi: 10.1007/s13399-019-00400-w
Constant, S., Wienk, H. L. J., Frissen, A. E., Peinder, P. D., Boelens, R., Van Es, D. S., et al. (2016). New insights into the structure and composition of technical lignins: a comparative characterisation study. Green Chem. 18, 2651–2665. doi: 10.1039/C5GC03043A
De Menezes, F. F., Rencoret, J., Nakanishi, S. C., Nascimento, V. M., Silva, V. F. N., Gutierrez, A., et al. (2017). Alkaline pretreatment severity leads to different lignin applications in sugarcane biorefineries. ACS Sustain. Chem. Eng. 5, 5702–5712. doi: 10.1021/acssuschemeng.7b00265
Del Río, J. C., Prinsen, P., Rencoret, J., Nieto, L., and Gutiérrez, A. (2012). Structural characterization of the lignin in the cortex and pith of elephant grass (Pennisetum purpureum) stems. J. Agric. Food Chem. 60, 3619–3634. doi: 10.1021/jf300099g
Dong, X. Q., Yang, J. S., Zhu, N., Wang, E. T., and Yuan, H. L. (2013). Sugarcane bagasse degradation and characterization of three white-rot fungi. Bioresour. Technol. 131, 443–451. doi: 10.1016/j.biortech.2012.12.182
Gallo, J. M. R., Alonso, D. M., Mellmer, M. A., and Yeap, J. H. (2013). Production of furfural from lignocellulosic biomass using beta zeolite and biomass-derived solvent. Top. Catal. 56, 1775–1781. doi: 10.1007/s11244-013-0113-3
Granata, A., and Argropouls, D. S. (1995). 2-chloro-4,4,5,5-tetramethyl-1,3,2-dioxaphospholane, a reagent for the accurate determination of the uncondensed and condensed phenolic moieties in lignins. J. Agric. Food Chem. 43, 1538–1544. doi: 10.1021/jf00054a023
Harman-Ware, A. E., Crocker, M., Kaur, A. P., Meier, M. S., Kato, D., and Lynn, B. (2013). Pyrolysis–GC/MS of sinapyl and coniferyl alcohol. J. Anal. Appl. Pyrol. 99, 161–169. doi: 10.1016/j.jaap.2012.10.001
Hoekman, S. K., Broch, A., and Robbins, C. (2011). Hydrothermal carbonization (HTC) of lignocellulosic biomass. Energy Fuels 25, 1802–1810. doi: 10.1021/ef101745n
Kaparaju, P., and Felby, C. (2010). Characterization of lignin during oxidative and hydrothermal pre-treatment processes of wheat straw and corn stover. Bioresour. Technol. 101, 3175–3181. doi: 10.1016/j.biortech.2009.12.008
Karp, E. M., Donohoe, B. S., O'Brien, M. H., Ciesielski, P. N., Mittal, A., Biddy, M. J., et al. (2014). Alkaline pretreatment of corn stover: bench-scale fractionation and stream characterization. ACS Sustain. Chem. Eng. 2, 1481–1491. doi: 10.1021/sc500126u
Katahira, R., Mittal, A., Mckinney, K., Chen, X., Tucker, M., Johnson, D., et al. (2016). Base-catalyzed depolymerization of biorefinery lignins. ACS Sustain. Chem. Eng. 4, 1474–1486. doi: 10.1021/acssuschemeng.5b01451
Kim, H., Ralph, J., and Akiyama, T. (2008a). Solution-state 2D NMR of ball-milled plant cell wall gels in DMSO-d6/pyridine-d5. Bioenergy Res. 8, 576–591. doi: 10.1039/B916070A
Kim, H., Ralph, J., and Akiyama, T. (2008b). Solution-state 2D NMR of ball-milled plant cell wall gels in DMSO-d6. Bioenergy Res. 1, 56–66. doi: 10.1007/s12155-008-9004-z
Liu, C. F., Ren, J. L., Xu, F., Liu, J. J., Sun, J. X., and Sun, R. C. (2006a). Isolation and characterization of cellulose obtained from ultrasonic irradiated sugarcane bagasse. J. Agric. Food Chem. 54, 5742–5748. doi: 10.1021/jf060929o
Liu, C. F., Sun, R., and Ye, J. (2006b). Structural and thermal characterization of sugarcane bagasse phthalates prepared with ultrasound irradiation. Polym. Degrad. Stab. 91, 280–288. doi: 10.1016/j.polymdegradstab.2005.05.005
Liu, L., Sun, J., Li, M., Wang, S., Pei, H., and Zhang, J. (2009). Enhanced enzymatic hydrolysis and structural features of corn stover by FeCl3 pretreatment. Bioresour. Technol. 100, 5853–5858. doi: 10.1016/j.biortech.2009.06.040
Liu, Z., Luo, X. G., Li, Y., Li, L., and Huang, Y. (2009). Extraction of lignin from pulping black liquor by organic acid. Mater. Sci. Forum 620–622, 571–574. doi: 10.4028/www.scientific.net/MSF.620-622.571
Lu, Q., Liu, W., Yang, L., Zu, Y., Zu, B., Zhu, M., et al. (2012). Investigation of the effects of different organosolv pulping methods on antioxidant capacity and extraction efficiency of lignin. Food Chem. 131, 313–317. doi: 10.1016/j.foodchem.2011.07.116
Ma, L., Cui, Y., Cai, R., Liu, X., Zhang, C., and Xiao, D. (2015). Optimization and evaluation of alkaline potassium permanganate pretreatment of corncob. Bioresour. Technol. 180, 1–6. doi: 10.1016/j.biortech.2014.12.078
Miao, W., Jinhui, P., Xueming, Z., and Runcang, S. (2014). Enhancement of lignin biopolymer isolation from hybrid poplar by organosolv pretreatments. Int. J. Polym. Sci. 2014, 1–10. doi: 10.1155/2014/194726
Miller, J., Evans, L., Mudd, J. E., and Brown, K. (2002). Batch microreactor studies of lignin depolymerization by bases. 2. aqueous solvents. Off. Sci. Tech. Inform. Tech. Rep. 30, 61–78. doi: 10.2172/800964
Miller, J. E., Evans, L., Littlewolf, A., and Trudell, D. E. (1999). Batch microreactor studies of lignin and lignin model compound depolymerization by bases in alcohol solvents. Fuel 78, 1363–1366. doi: 10.1016/S0016-2361(99)00072-1
Moghaddam, L., Rencoret, J., Maliger, V. R., Rackemann, D. W., Harrison, M. D., Gutiérrez, A., et al. (2017). Structural characteristics of bagasse furfural residue and its lignin component. an NMR, Py-GC/MS, and FTIR study. ACS Sustain. Chem. Eng. 5, 4846–4855. doi: 10.1021/acssuschemeng.7b00274
Mousavioun, P., and Doherty, W. O. S. (2010). Chemical and thermal properties of fractionated bagasse soda lignin. Ind. Crops Prod. 31, 52–58. doi: 10.1016/j.indcrop.2009.09.001
Moxley, G., Gaspar, A. R., Higgins, D., and Xu, H. (2012). Structural changes of corn stover lignin during acid pretreatment. J. Indust. Microbiol. Biotechnol. 39, 1289–1299. doi: 10.1007/s10295-012-1131-z
Nitsos, C., Stoklosa, R., Karnaouri, A., Dimitrij, V., Lange, H., Hodge, D, et al. (2016). Isolation and characterization of organosolv and alkaline lignins from hardwood and softwood biomass. ACS Sustain. Chem. Eng. 4, 5181–5193. doi: 10.1021/acssuschemeng.6b01205
Phongpreecha, T., Hool, N. C., Stoklosa, R. J., Klett, A. S., Foster, C. E., Bhalla, A., et al. (2017). Predicting lignin depolymerization yields from quantifiable properties using fractionated biorefinery lignins. Green Chem. 19, 5131–5143. doi: 10.1039/C7GC02023F
Rahimi, K. S. M., Brown, R. J., Tsuzuki, T., and Rainey, T. J. (2016). A comparison of cellulose nanocrystals and cellulose nanofibres extracted from bagasse using acid and ball milling methods. Adv. Nat. Sci. Nanosci. Nanotechnol. 7:035004. doi: 10.1088/2043-6262/7/3/035004
Ren, G. J., Zhang, C. L., Zhao, J. X., and Gao, X. R. (2009). Adsorption performance of furfural residue for Cr(VI). Plat. Finish. 31, 9–11.
Rencoret, J., Marques, G., Gutierrez, A., Nieto, L., Santos, J. I., Jiménez-Barbero, J., et al. (2009). HSQC-NMR analysis of lignin in woody (Eucalyptus globulus and Picea abies) and non-woody (Agave sisalana) ball-milled plant materials at the gel state. Holzforschung 63, 691–698. doi: 10.1515/HF.2009.070
Río, J. C. D., Lino, A. G., Colodette, J. L., Lima, C. F., Gutiérrez, A., Martínez, A. T., et al. (2015). Differences in the chemical structure of the lignins from sugarcane bagasse and straw. Biomass Bioenergy 81, 322–338. doi: 10.1016/j.biombioe.2015.07.006
Rodríguez-Gutiérrez, G., Rubio-Senent, F., Lama-Muñoz, A., García, A., and Fernández-Bolaños, J. (2014). Properties of lignin, cellulose, and hemicelluloses isolated from olive cake and olive stones: binding of water, oil, bile acids, and glucose. J. Agric. Food Chem. 62, 8973–8981. doi: 10.1021/jf502062b
Rönnols, J., Schweinebarth, H., Jacobs, A., Stevanic, J. S., Olsson, A. M., Reimann, A., et al. (2015). Structural changes in softwood kraft lignin during non-oxidative thermal treatment. Nordic Pulp Paper Res. J. 30, 550–561. doi: 10.3183/npprj-2015-30-04-p550-561
Sun, S. N., Li, M. F., Yuan, T. Q., Xu, F., and Sun, R. C. (2012). Effect of ionic liquid pretreatment on the structure of hemicelluloses from corncob. J. Agric. Food Chem. 60, 11120–11127. doi: 10.1021/jf3021464
Sun, Y. D., Sun, R., Jiang, J. X., and Zhu, L. W. (2008). Study on conversion process for furfural residue manufacture to ethanol by simultaneous saccharification and fermentation. Modern Chem. Industry 85, 93–101. doi: 10.1212/WNL.0000000000001984
Tao, L., Chen, X., Aden, A., Kuhn, E., Himmel, M. E., Tucker, M., et al. (2012). Improved ethanol yield and reduced minimum ethanol selling price (mesp) by modifying low severity dilute acid pretreatment with deacetylation and mechanical refining: 2) techno-economic analysis. Biotechnol. Biofuels 5:69. doi: 10.1186/1754-6834-5-69
Thring, R. W. (1994). Alkaline degradation of ALCELL® lignin. Biomass Bioenergy 7, 125–130. doi: 10.1016/0961-9534(94)00051-T
Tiappi, D. M. F., Nicolas, V., Mario, A., Nicolas, J., Happi, G. T., Patrick, G., et al. (2019). Chemical composition analysis and structural features of banana rachis lignin extracted by two organosolv methods. Ind. Crops Prod. 132, 269–274. doi: 10.1016/j.indcrop.2019.02.022
Van Erven, G., De Visser, R., Merkx, D. W. H., Strolenberg, W., De Gijsel, P., Gruppen, H., et al. (2017). Quantification of lignin and its structural features in plant biomass using 13C lignin as internal standard for pyrolysis-GC-SIM-MS. Anal. Chem. 89, 10907–10916. doi: 10.1021/acs.analchem.7b02632
Vigneault, A., Johnson, D. K., and Chornet, E. (2007). Base-catalyzed depolymerization of lignin: separation of monomers. Can. J. Chem. Eng. 85, 906–916. doi: 10.1002/cjce.5450850612
Villaverde, J. J., Li, J., Ek, M., Ligero, P., and Vega, A. D. (2009). Native lignin structure of miscanthus x giganteus and its changes during acetic and formic acid fractionation. J. Agric. Food Chem. 57, 6262–6270. doi: 10.1021/jf900483t
Wang, Q., Liu, Y., Liu, S., Wang, W., Yu, Q., Fu, J., et al. (2019). Comprehensive thermochemical utilization of biomass residues from furfural plants and ELW technology. Fuel 252, 116–124. doi: 10.1016/j.fuel.2019.04.089
Wang, Y., Xu, Z. Y., Song, X., Yang, B., and Zhang, D. (2017). The preparation of low-cost adsorbent for heavy metal based on furfural residue. Mater. Manufact. Proc. 32, 87–92. doi: 10.1080/10426914.2016.1198017
Xu, G., Wang, L., Liu, J., and Wu, J. (2013). FTIR and XPS analysis of the changes in bamboo chemical structure decayed by white-rot and brown-rot fungi. Appl. Surf. Sci. 280, 799–805. doi: 10.1016/j.apsusc.2013.05.065
Xu, J. K., Sun, Y. C., and Sun, R. C. (2015). Synergistic effects of ionic liquid plus alkaline pretreatments on eucalyptus: lignin structure and cellulose hydrolysis. Proc. Biochem. 50, 955–965. doi: 10.1016/j.procbio.2015.03.014
Yang, D., Zhong, L. X., Yuan, T. Q., Peng, X. W., and Sun, R. C. (2013). Studies on the structural characterization of lignin, hemicelluloses and cellulose fractionated by ionic liquid followed by alkaline extraction from bamboo. Ind. Crops Prod. 43, 141–149. doi: 10.1016/j.indcrop.2012.07.024
Zhang, H., Zheng, R., Cheng, J., and Huang, H. (2010). Determination of components of lignocellulose by NREL. Anal. Lab. 29, 15–18.
Keywords: furfural residue, alkali treatment, lignin, cellulose, chemical structure
Citation: Li R, Wang X, Lin Q, Yue F, Liu C, Wang X and Ren J (2020) Structural Features of Lignin Fractionated From Industrial Furfural Residue Using Alkaline Cooking Technology and Its Antioxidant Performance. Front. Energy Res. 8:83. doi: 10.3389/fenrg.2020.00083
Received: 16 February 2020; Accepted: 22 April 2020;
Published: 05 June 2020.
Edited by:
Ao Xia, Chongqing University, ChinaReviewed by:
Jorge Rencoret, Consejo Superior de Investigaciones Científicas (CSIC), SpainJixiang Zhang, China University of Petroleum, China
Copyright © 2020 Li, Wang, Lin, Yue, Liu, Wang and Ren. This is an open-access article distributed under the terms of the Creative Commons Attribution License (CC BY). The use, distribution or reproduction in other forums is permitted, provided the original author(s) and the copyright owner(s) are credited and that the original publication in this journal is cited, in accordance with accepted academic practice. No use, distribution or reproduction is permitted which does not comply with these terms.
*Correspondence: Junli Ren, renjunli@scut.edu.cn
†These authors have contributed equally to this work