A Single-Particle Trigger for Time-of-Flight Measurements in Prompt-Gamma Imaging
 Paulo Magalhaes Martins1,2*
  Riccardo Dal Bello1,3
  Michael Seimetz4
  German Hermann5
  Thomas Kihm5
  Joao Seco1,3
- 1German Cancer Research Center – DKFZ, Heidelberg, Germany
- 2Instituto de Biofísica e Engenharia Biomédica, Faculdade de Ciências da Universidade de Lisboa, Lisbon, Portugal
- 3Department of Physics and Astronomy, University of Heidelberg, Heidelberg, Germany
- 4Instituto de Instrumentación para Imagen Molecular (I3M), CSIC-Universitat Politècnica de València, Valencia, Spain
- 5Max Planck Institute for Nuclear Physics, Heidelberg, Germany
Tracking of single particles accelerated by synchrotrons is a subject that crosses several physics fields. The high clinical intensities used in particle therapy that can exceed 109 p/s make this task very challenging. The tracking of the arrival time of single particles in the ion beam is fundamental for the verification of the particle range and dose delivered to the patient. We present a prototype made of scintillating fibers which has been used to provide time-of-flight (TOF) information for three beam species currently accelerated at the Heidelberg Ion-Beam Therapy Center (HIT). We have demonstrated a time-tracker for a prompt-gamma spectroscopy system that allows for a background TOF rejection with a sub-nanosecond time resolution.
1. Introduction
The correlation between the ion beam microstructure and the prompt-gamma ray production in synchrotron facilities has been investigated in the context of therapy monitoring by means of in-beam PET imaging [1, 2]. The prompt-gamma ray emissions during ion-beam therapy, at that time still considered mostly a source of background, eventually became a promising technique for range verification [3]. Several authors have meanwhile investigated the benefits of time-of-flight (TOF) measurements for background rejection in prompt gamma imaging (PGI) [4–9]. In cyclotron-based facilities, the use of the TOF information is rather straightforward as the arrival time of the proton bunches is highly correlated with the radio-frequency (RF) of the accelerator, being the bunch width in the order of 1–2 ns. However proton bunch drifts against the RF of the cyclotron have been observed [10]. In synchrotron facilities, a time-correlation of the prompt gamma radiation with the residual microstructure of the extracted beam is still observed [11], but the minimum bunch width is in the order of 10 ns. The information obtained thereof may be sufficient to track the inter- and intra-spill time between spills and bunches, respectively, to be used for in-beam PET. However, it is not sufficient for defining a useful TOF window for PGI. Provided the distance from the prompt-gamma detector to the target, typical TOF windows are usually within 1–3 ns [9, 12–14]. Many experiments in high-energy physics have achieved sub-ns TOF resolutions. Several types of detectors have been used in those experiments, such as plastic scintillator slabs [15], resistive plate chambers [16–18], and strip silicon detectors [19–21]. The plastic scintillator detectors have also been widely investigated for radiation dosimetry by Beddar et al. [22, 23], Beaulieu and Beddar [24] and Beddar and Beaulieu [25]. Many facilities use plastic scintillator counters for beam monitoring. In the therapy with ion beams, plastic detector counters are usually placed after the beam extraction. However, this solution is just available during quality assurance, since particles hitting the detector will be scattered and will not reach the nozzle. Testa et al. [4] have proposed the use of an external beam monitor between the nozzle and the patient to determine the time correlation between the prompt gamma detection and the transverse position of the incident ions measured by the monitor. Several solutions for spatial tracking have meanwhile been presented either based on diamond detectors [26, 27], or based on plastic scintillating fibers [28, 29]. The aforementioned strip silicon detectors have presented promising results for beam characterization and monitoring in a clinical setting [30]. Several authors claimed the need for bunch monitors to create reliable range verification procedures in the clinical routine [10, 31–33]. In this work, we present a prototype of a trigger system capable of providing distinct time references for single particles accelerated at the Heidelberg Ion-Beam Therapy Center—HIT [34]. The information of the arrival time of those particles is correlated with the prompt-gamma arrival time measured in the CeBr3 detectors to assess the system time resolution. The bunch width and peak interval for several beam species and energies are also shown thus demonstrating the need for such an external trigger. Finally, we evaluate the energy deposition for beam diagnostic purposes and provide results on the efficiency of tracking single particles.
The main requirements to our prototype of a trigger system are: triggering on single particles within an ion beam provided by a synchrotron; providing a sub-ns system time resolution; being able to cope with clinical intensities; being radiation hard; interacting as few as possible with the beam.
In this work, we will focus on the first three requirements. The last two requirements are partially satisfied by beam triggers based on scintillating fibers, which was demonstrated in previous studies [29, 35–38]. The radiation hardness remains as a major concern for the use of scintillating fibers under high intensities. Joram et al. consider that the moderate radiation hardness of plastic scintillators currently prevents their use in very harsh radiation environments [36]. The evaluation under clinical conditions is however beyond the scope of the current work.
2. Materials and Methods
The HIT facility accelerates proton, helium, carbon, and oxygen ions from 48 to 515 MeV/u. Protons and carbon ions are routinely used in the clinical setting, while helium ions are currently being commissioned [39, 40], and oxygen ions still remain as a research beam species. In this work, we focus just on proton, helium, and carbon ion beams.
The intensities in clinical practice range from 2 × 10⁶ to 8 × 10⁷ p/s for carbon ions and from 8 × 10⁷ to 3.2 × 10⁹ p/s for protons in 10 intensity levels. The intensity is controlled via an intensity feedback system [41]. This system can however be switched off for achieving lower intensities. In that case, the beam can be bent via magnets up to 1° and the intensity at the nozzle can be lowered down to approximately 30–50 particles per second. The intensity can also be artificially changed by demanding a certain charge in the ionization chambers through the intensity feedback system. The latter is suitable to deliver intensities down to three orders of magnitude of the lowest clinical intensity (8 × 10⁴ p/s for protons and 2 × 10³ p/s for carbon ions).
For carbon beams, the beam size (the FWHM at the isocenter) ranges from 3.4 mm (E = 430.1 MeV/u) to 9.8 mm (88.8 MeV/u). For helium beams, the beam size ranges from 4.9 mm (E = 220.5 MeV/u) to 18.6 mm (50.6 MeV/u). For proton beams, the beam size ranges from 8.1 mm (E = 221.1 MeV/u) to 32.4 mm (48.1 MeV/u).
The HIT facility is equipped with two clinical horizontal rooms, a fully 360° gantry and an horizontal experimental room. All the experiments were performed in the experimental room, i.e., at the largest distance from the synchrotron extraction point.
2.1. Experimental Setup
The prompt gamma spectroscopy (PGS) system is composed of CeBr3 detectors ( 1.5″ × 3″) coupled to Hamamatsu R13089 photomultiplier tubes (PMTs) and plugged to a voltage divider. The anode output feeds our data acquisition system (DAQ) [42]. This is a module of a FlashCam FADC system, originally designed for cameras proposed for the Cherenkov Telescope array (CTA) [43].
Figure 1A shows a schematic drawing of our PGS system consisting of a primary prompt-gamma detector, a trigger for the incoming particles, and the electronics. The focus of the present study is the external trigger placed between the nozzle and the target and the TOF information on the incoming particles extracted thereof. Figure 1C shows a photo of the first setup with two CeBr3 detectors facing each other at a distance of 15 cm from the beam axis. The target is composed by two flasks of water comprising a length of 6.4 cm of water and 0.45 cm of polystyrene. The distance from the target to the fibers active region was 27 cm.
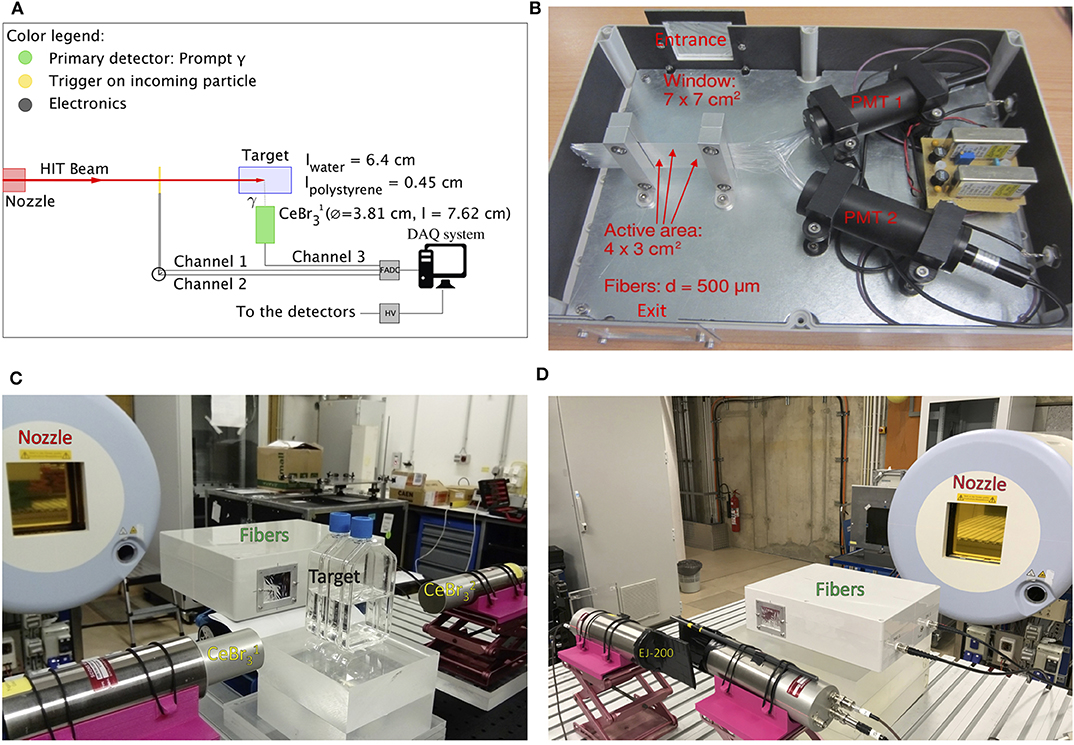
Figure 1. (A) Schematic drawing of the first experimental setup comprising the PGS system and an external trigger detector between the nozzle and the target. (B) Photo of the prototype of a trigger system comprising scintillating fibers connected on one side to two independent PMTs in an alternating fashion. (C) Photo of the first experimental setup. (D) Photo of the second experimental setup with the scintillating fibers and the EJ-200 scintillating tiles placed, in sequence, along the beam axis.
Moreover, we performed experiments also with a second setup (Figure 1D). In this case, the target and the CeBr3 were removed, while two EJ-200 scintillating tiles were introduced. The trigger and the scintillating plastics were placed along the beam axis to detect, in sequence, the beam particles delivered by the synchrotron and determine the intrinsic time resolution.
2.1.1. Trigger
We considered several options for our trigger. In a previous study, we used plastic scintillators and showed their ability to provide TOF information [44]. Such detectors are commonly used as start counters, but have a limited count rate of approximately 106 cps. We chose EJ-200 scintillating plastics with a squared area of 8 × 8 cm2 and a respective thickness of 1 and 4 mm. Each of these was sealed with aluminum foil and black tape to make it light tight and coupled on one side with a silicone coupling component to a Hamamatsu PMT R13089.
For the prototype of an alternative trigger system presented in this study, we implemented a set of scintillating fibers with a square cross section of 500 μm. We designed dedicated supports to obtain a single layer of scintillating fibers (BCF–12 fast scintillator fibers, decay time = 3.2 ns, Saint Gobain Crystals). The total active area was 4 × 3 cm2. The fibers were connected on one side, in an alternating fashion, to two independent R647 PMTs with E849–35 socket assembly (Hamamatsu). The detector included an housing for light shielding equipped with an entrance and exit window for the beam (double aluminized mylar with a total thickness of 10 μm). High voltage supply modules are integrated in the prototype of a trigger system and powered by an external 12 V DC plug. The gain of the two channels has been pre-adjusted with a Sr–90 source. Figure 1B shows a photograph of the prototype of a trigger system without the top cover.
Each PMT provides an analog signal to the acquisition system. The signals are continuously digitized and stored in data files [42]. The post-processing is then performed offline. The information from the arrival time of the particles at the trigger is compared with the arrival time of these particles at the plastic scintillators to extract the intrinsic time resolution. In order to show the feasibility in a clinical scenario, we compare the arrival time of the irradiated particles at the trigger and the arrival time of the generated prompt-gamma at the CeBr3 detectors which are placed perpendicular to the irradiated target. We then extract the system time resolution that has contributions from the time resolution of the fibers and the CeBr3.
2.2. Data Acquisition, Processing, and Analysis
Our DAQ system has 24 channels, which are capable of acquiring at 250 MS/s with 12-bit precision. The samples are buffered in one FPGA and processed in a configurable way to derive a trigger decision. All electronics are read out via high 1 GB Ethernet network, using off-the-shelf switches and a standard commercial computer [42, 45].
The data is transferred from the DAQ to the PC through Gigabit Ethernet and stored event by event in binary data files. Those files were then converted to independent binary files containing the key information of each trace, i.e., the relative time assigned to the event, the dead time, and a standalone energy calculation. The data pulse processing and analysis were carried out offline in self-designed MATLAB routines.
It is possible to split an analog input signal onto four digitization channels which are phase shifted by 1 ns with respect to each other and therefore to effectively sample the signal at a rate of 1 GS/s. We used this clustering technique to acquire the data from the two PMT outputs of the scintillating fiber setup and the PMT outputs from both plastic detectors. In total, we used 16 channels (4 channels for each PMT). For the CeBr3 detector, we opted for the larger sampling interval of δt = 4 ns. The signals in the CeBr3 were only compared to the ones in the fibers. The maximum throughput of the DAQ system is approximately 200,000 events/s. The maximum stored data rate is 100 MByte/s.
In order to retrieve the arrival time and energy of the particles in every detector, we shaped the digital signal by convolving the input signal with an impulse response function. For fast evaluation and visualization purposes, we acquired traces comprising an adjustable time slice up to 15.6 μs and with a configurable offset relative to the time of the trigger. This acquisition mode displays the bunch structure within approximately 16 μs and permits a fast visualization of pile-up events. A Supplementary Video shows the single carbon particles arriving within the course of a single spill. These large traces were also used to determine the bunch width and peak interval for several beam species with different energies.
In order to determine the system time resolution and the intrinsic resolution of the fibers, we acquired traces of 240 ns with 1 GS/s sampling rate. The coincidences between the events in the scintillating fibers and the signals in the plastic or in the CeBr3 detector were detected offline by analyzing the corresponding traces. A maximum of 3 peaks per trace and a minimum peak prominence on the processed data were considered. The time stamp was extracted from the half width at half height for each peak. Three Gaussian functions were analytically calculated with the values of the local peaks and widths and their maximum considered for calculating the energy deposition. All data were corrected for dead time.
2.3. Decomposition of the Cross-Talk Between Neighboring Fibers
During the manufacturing process, we deliberately avoided any cladding in order to avoid dead regions between the scintillating fibers. As a consequence, we observed a optical cross-talk between neighboring fibers, this effect being more evident for incident carbon ions due to their higher scintillation light yield. Every time we observe a single event from a carbon ion in an odd (even) fiber we observe a cross-talk event with smaller light yield in the even (odd) fiber. The larger signal can be taken into account and the smaller one discarded by evaluating the energy deposition in both odd and even fibers. After setting a threshold on the deposited energy and performing logical AND operations, we can decompose the events in three components: (a) the events that have an energy deposition in the odd or even fibers above that threshold and which generated an event in the neighboring fiber below that threshold; (b) events that generated a signal above the given threshold in both odd and even fibers; (c) events that generated a signal below the given threshold in both odd and even fibers. In the end, the relevant events from the first component (a) account for approximately 92% of the whole events and are the ones considered for further analysis.
2.4. Spill Structure
The spill macrostructure comprehends a period of approximately 5 s of irradiation followed by a pause of approximately 4 s. In order to determine the initial and final part of each spill, we use the reference clock of the FADC that runs at 250 MHz. This clock assigns a very precise relative time stamp to each event. To determine both the spill start and end, we calculated the first and second derivatives of the trigger time course (inversely proportional to the count rate) provided by the FADC clock. During the spill on, we have many triggered events close-by in time. Conversely, during spill off, very few events are detected. In the presence of a CeBr3 detector, we used the time derivative of the energy deposited in the CeBr3 or the presence of overflows generated by scattered charged particles hitting directly the CeBr3, as they immediately arise during spill on. During spill off, there is just the activation of the target with gamma-rays being emitted with an energy of 511 keV. Conversely, during spill on, the high energetic prompt-gammas immediately provide the information that the spill started. In the absence of a CeBr3 detector, we used an external radioactive source to provide a continuous count rate that can be observed in Figure 2 (left) even during spill off. This method is quite accurate within a few milliseconds. In the Supplementary Video, we can clearly see the start and the end of the carbon ion spill with 16 μs traces. Figure 2 shows a straightforward method for determining the spill start and end by defining a threshold on the energy deposited in the trigger detector. During spill off, there are still activation related events acquired by the CeBr3, but without any energy deposition in the fibers.
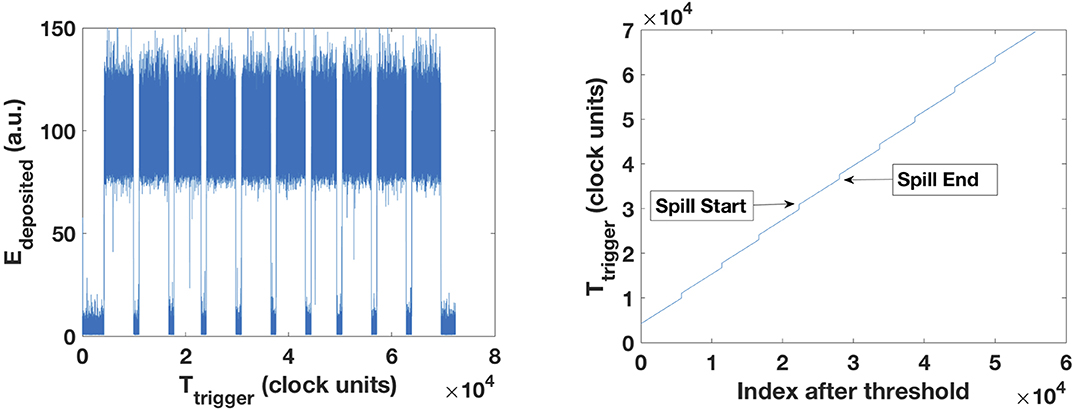
Figure 2. (Left) Energy deposited in the trigger detector along the acquisition time. The relative acquisition is given by the internal clock of the FADC unit. (Right) After setting a threshold at 60 (a.u.), we obtain the index of the spill start and the spill end and the corresponding trigger time given by the FADC unit. The time difference between those times gives the time between spills.
3. Results
3.1. Single Particle Tracking
Figure 3 (left) shows the time microstructure of beams of protons, helium, and carbon. Displayed are the 16 μs traces acquired with both odd (top) and even (bottom) fibers. We observe a very regular time microstructure for the helium beams due to the very low energy. The beam travels from the injector to the nozzle with very few turns in the synchrotron. This results in a very small error in the bunch width (see Table 1).
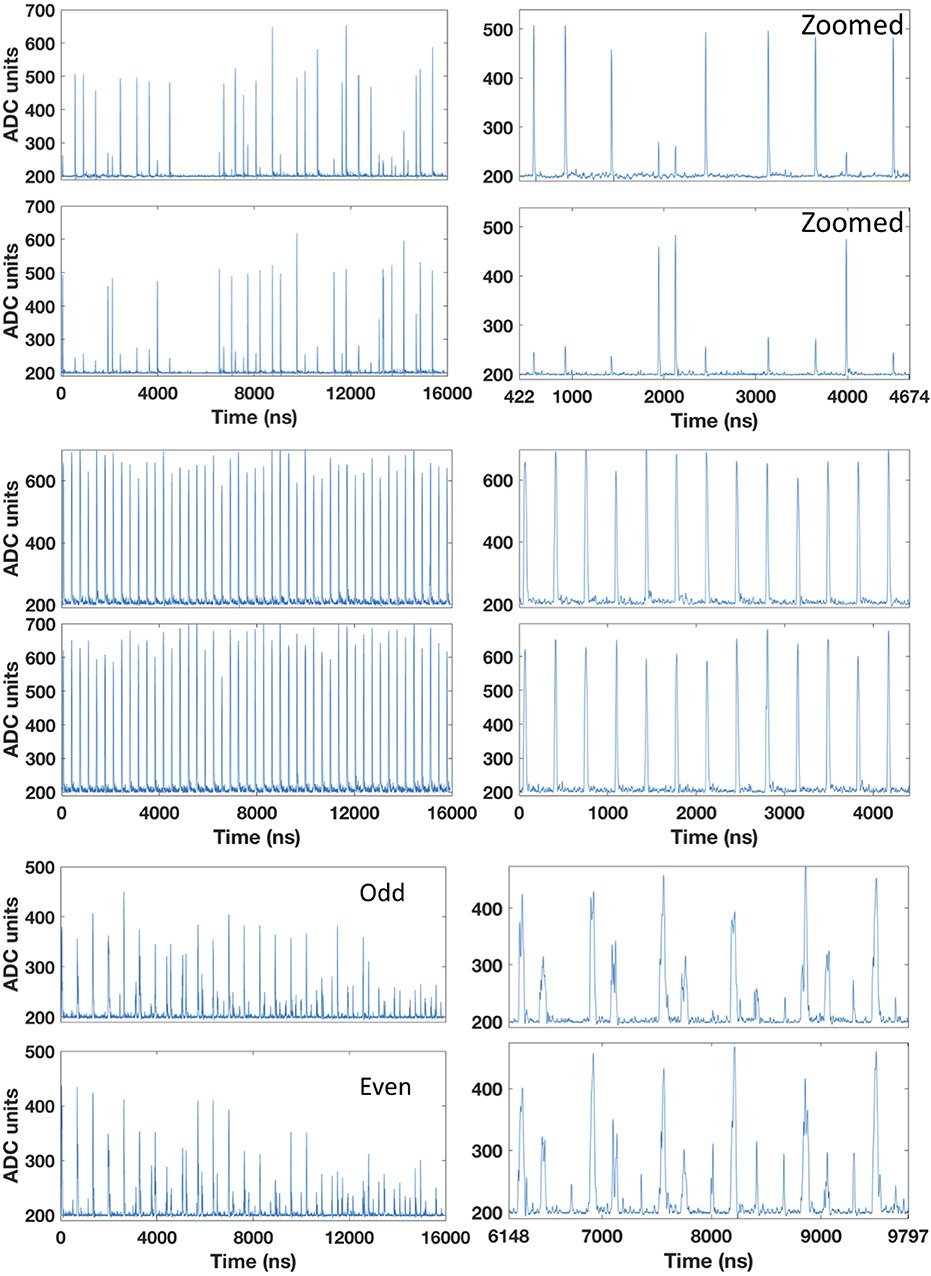
Figure 3. Time microstructure for carbon (top), helium (middle), and proton (bottom) beams. The beam energies are 276, 146, and 145 MeV/u, respectively. The intensities are 2 × 10⁶, 2 × 10⁷, and 8 × 10⁷p/s, respectively. The trace duration is 16 μs and hits in both odd and even fibers are shown. The right plots correspond to a windowed region from the left plot. Cross-talk for carbon ions and multiple hits for protons are clearly visible.
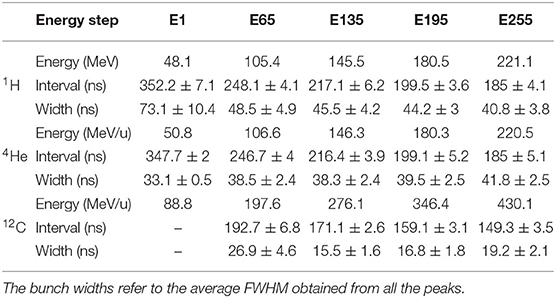
Table 1. Bunch width and peak interval for proton, helium, and carbon beams for five energy steps ranging from 48.1 to 221.1 MeV/u, from 50.6 to 220.5 MeV/u, and from 88.8 to 430.1 MeV/u, respectively.
Figure 3 (right) shows a zoom over a smaller time period, where the single particles are clearly distinguishable. For proton beams, we can even distinguish double and multiple hits within a bunch of particles. However, some multiple hits cannot be resolved for such intensity (I1 = 8 × 10⁷ p/s). For higher clinical intensities, the protons are too close-by within the bunch to be distinguished with the current prototype of a trigger. For carbon ions, the cross-talk between odd and even fibers is clearly visible. Every hit in an odd or even fiber creates a simultaneous but smaller hit in the neighboring fiber. Figure 4 shows an exemplary multiple hit with four events within 200 ns from a proton beam. These fours event would overlap and be discarded without the clustering technique.
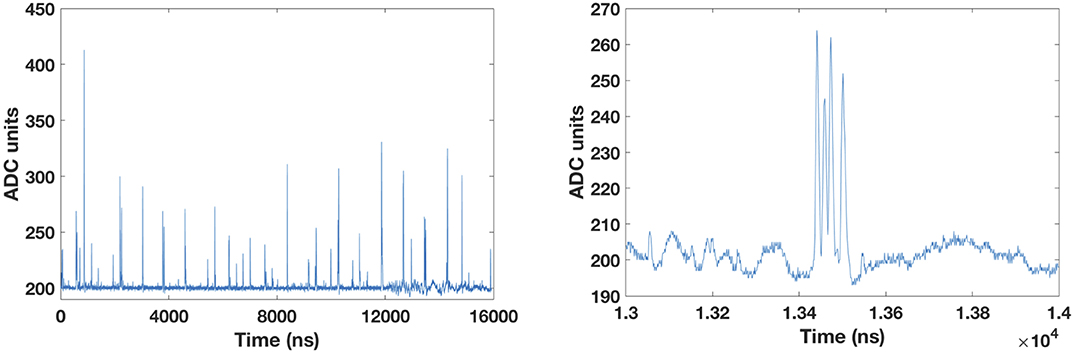
Figure 4. (Left) A 16 μs trace from a proton beam with an intensity of 8 × 10⁷ p/s. (Right) A zoom over the time interval from 13 to 14 μs shows a multiple hit with four events within 200 ns.
Figure 5 shows a frame from the Supplementary Video. That video shows the arrival time of carbon ions within the course of a spill. The spill starts with a low particle rate within the first milliseconds and achieves the requested intensity afterwards. It eventually vanishes after approximately 4.85 s. The ramp-up time was already observed by Schoemers et al. [41].
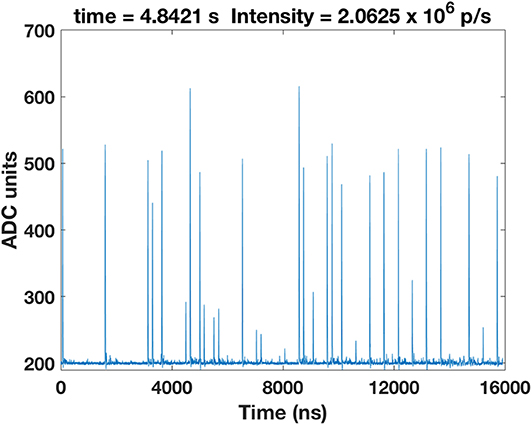
Figure 5. Frame from an animation of the carbon ion spill course. Every frame in the Supplementary Video corresponds to a 16 μs trace. The spill lasts approximately 4.85 s. Only the initial and the last part of the spill are displayed. The nominal intensity is I1 = 2 × 10⁶ p/s.
3.2. Bunch Width and Peak Interval
Figure 6 shows a histogram of the arrival time of the helium and carbon ions over 10 spills for an energy of 180 and 276 MeV/u, respectively. The bunch widths refer to the average full width at half maximum (FWHM) obtained from all the peaks with the function findpeaks. For carbon ions, we observe a peak interval of 171.1 ± 2.6 ns and a minimum bunch width of 15.5 ± 1.6 ns. Table 1 shows that as the energy of the helium ions increases, the bunch width gets larger. Due to the regular microstructure of the helium beams with lowest energy, we observe a very precise bunch width of 33.1 ± 0.5 ns. Also three components seem to arise and become more evident for higher energies. As expected, we observe that the peak interval between bunches decreases for an increasing energy of all beam species.
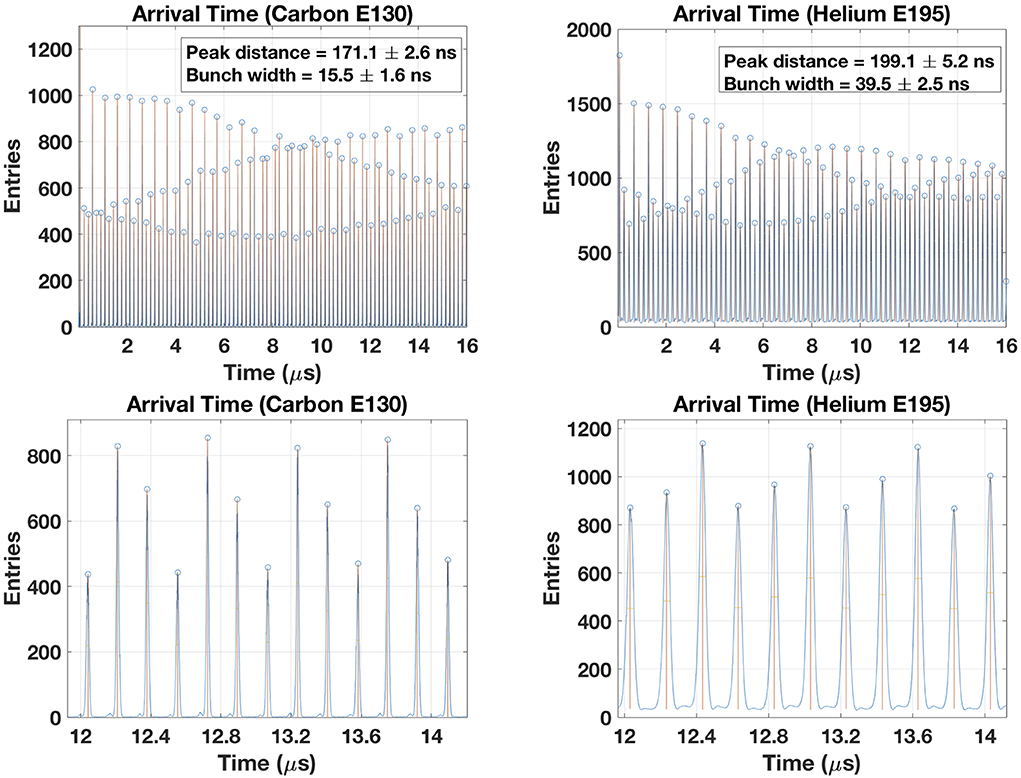
Figure 6. Bunch width and peak interval of a carbon beam with 276 MeV/u (left) and a helium beam with 180 MeV/u (right). A zoom over the region 12–14 μs shows the bunch width (bottom).
3.3. Time Resolution
Figure 7 (left) shows the spectrum obtained from the time difference between the arrival of the prompt-gamma radiation generated by a thin target at the two CeBr3 detectors and the carbon ions at the odd and even scintillating fibers. In Figure 7 (right), we observe that the time difference between the CeBr and the odd fibers shows a clear prompt component with a modeled Gaussian function in red. A delayed component from neutron and fragment induced prompt gamma is also observed. A faster component just before the prompt component may result from prompt-gamma induced by fragments produced in the nozzle and hitting directly the CeBr3 detectors. This is in line with the results from Testa et al. [46] and Dal Bello et al. [47]. The prompt component demonstrates a system time resolution of approximately 0.85 ns FWHM.
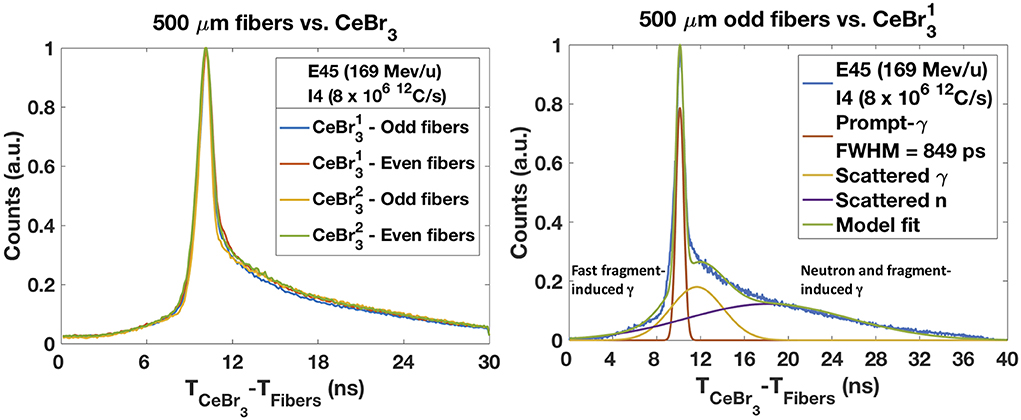
Figure 7. Time resolution of the PGS system. (Left) The time difference between the arrival from prompt-gamma to the two CeBr3 detectors and the arrival from carbon ions to the odd and even scintillating fibers. (Right) The time difference between the CeBr and the odd fibers shows a prompt component (red) with 0.85 ns FWHM. A delayed component resulting from neutron and fragment induced γ-rays is observed and may be removed by TOF cuts. A fast component resulting from fragment induced γ-rays scattered in the nozzle is also visible.
Figure 8 shows the time spectrum obtained from the time difference between the arrival of the carbon ions at the plastic scintillator and at the scintillating fibers for five energy steps (E1 = 88.8 MeV/u; E65 = 197.6 MeV/u, E130 = 276.1 MeV/u, E195 = 346.4 MeV/u, and E255 = 430.1 MeV/u). For this measurement the setup has been changed. For the previous measurements only the scintillating fibers were in the beam (in coincidence with the CeBr3). Here the coincidences are made exclusively between the plastic scintillator and the odd scintillating fibers placed along the beam axis and spaced apart by 27.5 cm. The higher the energy the faster the particles and the lower the time elapsed between both detectors. A reproducible intrinsic time resolution of 0.7 ns FWHM was obtained for the five energy steps.
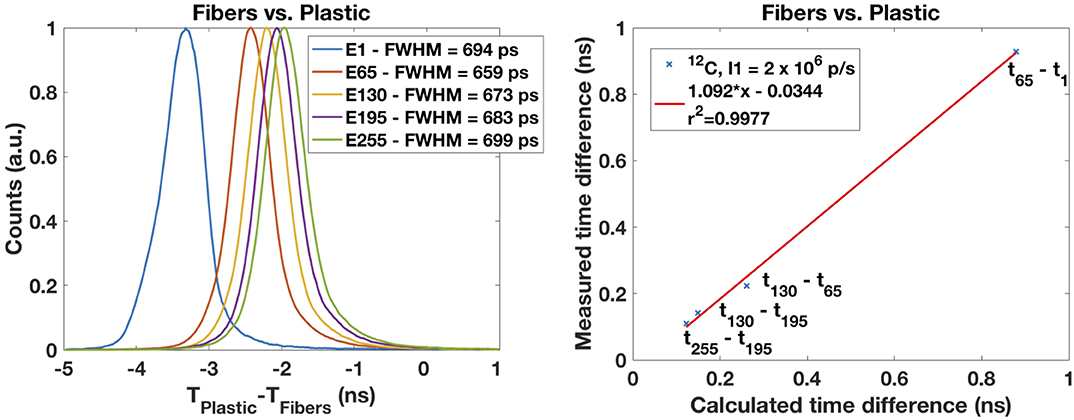
Figure 8. (Left) Time resolution determined from the time between the arrival from carbon ions to the plastic detector and to the scintillating fibers. A reproducible value of 0.7 ns is observed for five energy steps covering the full energy range. The energy steps E1, E65, E130, E195, and E255 correspond to 88.8, 197.6, 276.1, 346,4, and 430.1 MeV/u, respectively. (Right) The higher the energy, the faster the particles and the smaller the time elapsed between detectors. If one takes the distance between the detectors of 27.5 cm, the change in is consistent with the energy change.
Figure 9 shows a slightly different time difference between the odd and the even scintillating fibers and the plastic detector. We observe a degradation of the time resolution for helium (1.56 ns FWHM) and proton (2.64 ns FWHM) beams attributable to an increased energy straggling (not shown).
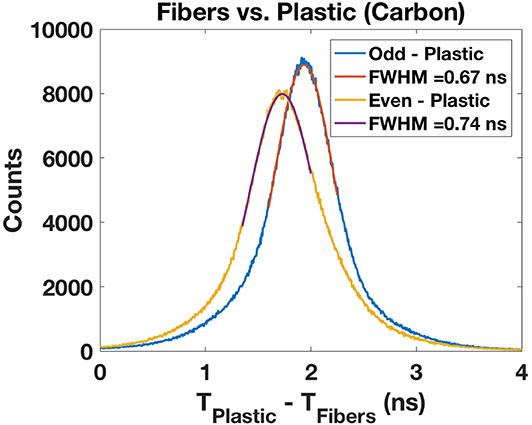
Figure 9. Intrinsic time resolution for the odd and even scintillating fibers present within the alternating fashion. A reproducible value of 0.7 ns is obtained for both fiber bundles.
3.4. Energy Deposition
Figure 10 shows four spectra of the energy deposited by carbon and helium ions in both plastic scintillators and in the odd and even fibers. The carbon ion distributions present a Gaussian shape as expected from a Vavilov distribution in the Gaussian limit [48]. For lighter particles, the distributions resemble a Landau distribution as expected for such particles hitting a thin target. The proton beam distributions resemble the helium ions distributions (not shown).
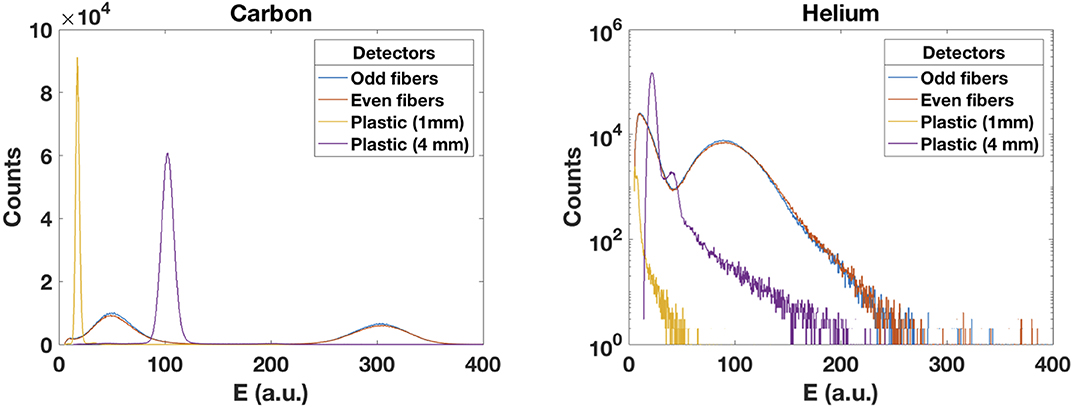
Figure 10. Energy deposited by carbon (left) and helium (right) beams in the scintillating fibers and in the two plastic scintillators. An expected Gaussian shape for heavier particles is observed. The distributions from lighter particles resemble a Landau distribution as expected for a thin target.
Figure 11 presents the result from the decomposition of the four components associated to the interaction of the carbon ions with the odd and even fibers. As mentioned before, there is an evident cross-talk between odd and even fibers if irradiated by carbon ions. We can select from the events hitting the odd fibers, the ones that have a higher energy deposition in that fiber and a lower energy deposition in the neighboring fiber. Conversely, we can choose from the events hitting the even fibers, the ones that have a higher energy deposition in that fiber and a lower energy deposition in the neighboring fiber. We observe that 45.6% of the events deposit higher energy in the odd fibers and 46.2% in the even fibers, totalling 91.8% of the total events. The remaining 8% are described in section 2.3. In this analysis, the threshold was set at 200 (a.u.).
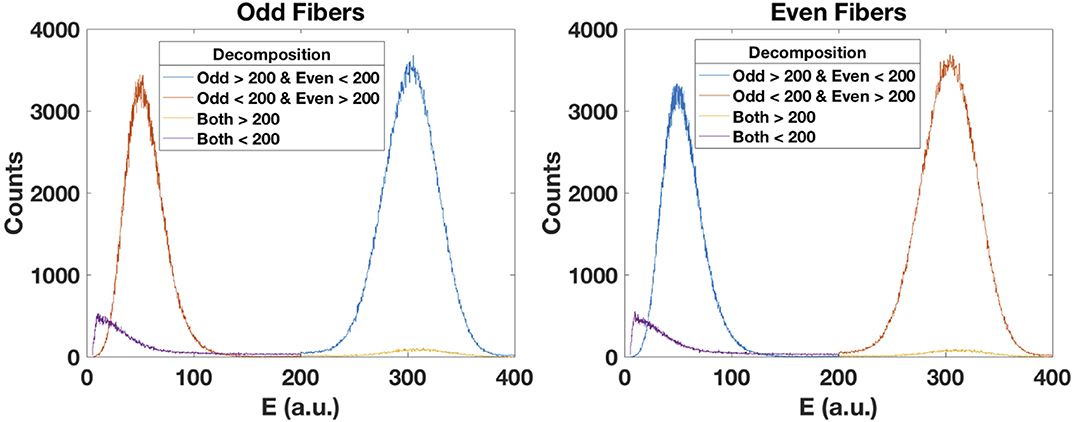
Figure 11. The energy deposited by carbon ions in the scintillating fibers produces cross-talk in the corresponding neighboring fiber. For the odd fibers (left), we can decompose the events by setting a threshold and performing logic operations. The blue curve corresponds to the relevant events. Conversely, for the even fibers (right), the relevant events are represented in the red curve.
3.5. Efficiency
In order to evaluate the efficiency of the scintillating fibers, we lowered the beam intensity by two means: (a) bending the beam up to 1° via magnets; (b) collimating the beam with two PMMA blocks separated by a 1 mm spacer. For the determination of very low intensities, we bent the beam gradually and detected the scattered particles in the nozzle with the thicker plastic detector very close to the nozzle. We compared the count rate with the one obtained with the scintillating fibers. Since we clustered the channels from the fibers, the FADC throughput was limited to ≈ 28 kcps. For the first nominal intensity, we obtained a count rate in the plastic detector of ≈ 950 cps. We gradually bent the beam until we had a count rate of ≈ 30 cps. We acquired alternately the events from the plastic scintillator and the scintillating fibers.
In Table 2, we present the results from the acquisition of carbon ions with an intensity lowered from the nominal intensity I1 = 2 × 10⁶ p/s down to 100 p/s. Both detectors match at run 6. We obtained a count rate in the scintillating fibers of ≈ 60.5 kcps, already corrected for a dead time of 53.6%, and a count rate of 29 cps in the plastic detector. The extrapolated count rate (ECR) is obtained from the count rate (CR) factor from the bunch monitor (BCM) measurements (CR Factor = 1 for nominal intensity I1) multiplied by the measured CR in the scintillating fibers (SciFi) after dead time correction. We finally obtained an extrapolated count rate of 2.002 × 10⁶ p/s which compares well with the nominal intensity of reference. Below those values (run 1–5), the plastic scintillator is not reliable due to large fluctuations in the count rate, while above those values (run 7–11), the dead time starts playing an important role and the count rate in the scintillating fibers is not retrievable anymore. The trigger system has a non-paralyzable behavior and all events happening during the dead time are lost. The FADC is equipped with a dead time logic which monitors with time stamps the dead time of the system. The correction for the dead time is the one derived from the non-paralyzable case (N ≈ Nm/(1−Nmτ/T)), where the actual number of events, N, are estimated by knowing the dead time, τ, during the given time interval, T.
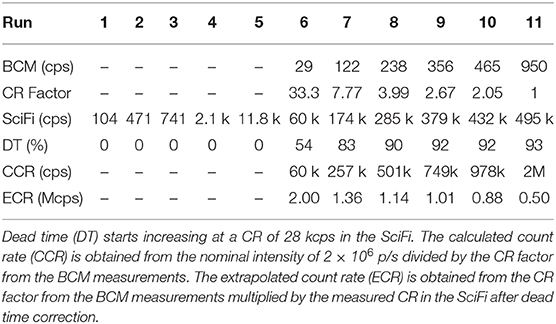
Table 2. Measured count rate (CR) in the plastic scintillator bunch monitor (BCM) and in the scintillating fibers (SciFi).
In order to retrieve the relative efficiency of the scintillating fibers under the reference clinical intensities provided by the HIT accelerator [41], traces of 16 μs were acquired and the number of particles in each trace counted. We increased the intensity in order to evaluate the ability of two 0.5 mm fibers feeding alternate PMTs to cope with a collimated beam with a slit of 1 mm. For carbon ions, the beam size (FWHM at the isocenter) was 5.9 mm (E = 169.2 MeV/u). For protons, the beam size (FWHM at the isocenter) was 17.4 mm (E = 90.7 MeV/u). The beam intensity ranged from the intensity step 1 (I1 = 2 × 10⁶ p/s for carbon ions and I1 = 8 × 10⁷ p/s for protons) up to the intensity step 8 (I8 = 3 × 10⁷ p/s for carbon ions and I8 = 1.2 × 10⁹ p/s for protons). Figure 12 shows the relative number of particles in each trace for the several intensity steps and the estimated intensity. We observe a linear behavior for carbon ions up to the intensity step 7 (2 × 10⁷ p/s) both for odd and even fibers. For protons, there is an increasing underestimation of the true intensity as a result of the pile-up of multiple hits within bunches.
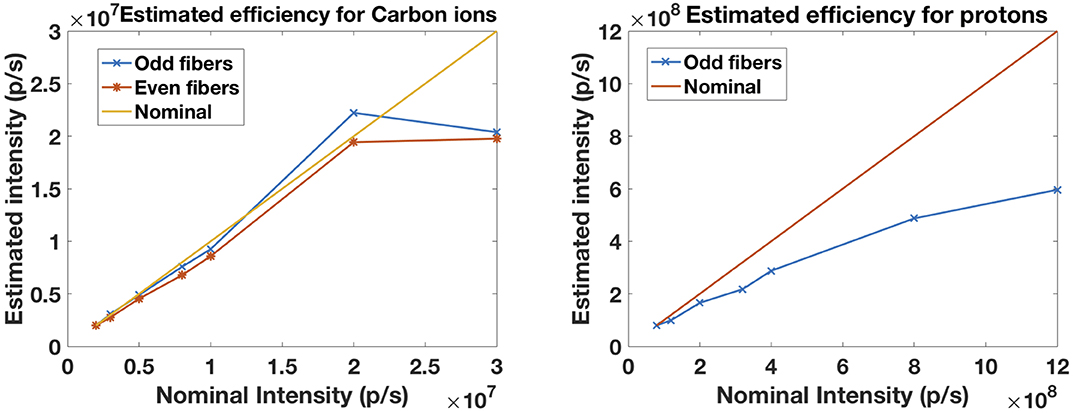
Figure 12. Estimated relative efficiency for the detection of carbon ions (left) and protons (right) by the scintillating fibers for an intensity range of 2 × 10⁶–3 × 10⁷ p/s and 8 × 10⁷–1.2 × 10⁹ p/s, respectively. Results for odd and even fibers are shown for carbon ions as well as the ideal line.
4. Discussion
A small-scale prototype of a trigger system of a hadron beam time tracker for the measurement of the arrival time of single particles in an ion beam has been demonstrated. This prototype of a trigger system was able to track single particles within bunches of proton, helium, and carbon ions accelerated at the HIT facility provided the event pile-up and the dead time remained low. This is of utmost importance for PGI systems relying on the TOF information for range verification. For carbon ions, we demonstrated a time resolution for the prompt component of 0.85 ns FWHM. This allows for an efficient rejection of neutron and fragment induced prompt-gamma background. The results from the measurement of the carbon bunch width was in good agreement with previous results [11]. However, those results are clearly insufficient if compared with the proton bunch widths in cyclotron-based facilities where the protons are much less spread over the bunch and very well correlated with the cyclotron RF. Despite the absence of fiber cladding, we were able to decompose the cross-talk events between neighboring fibers by evaluating the energy deposited in the alternating fibers. This evaluation may be further used in beam diagnostics, e.g., in mixed beams [49, 50], where the carbon beams are used for treatment and the helium beams are used for imaging. Such prototype of a trigger system may also be used for cross-section measurements of carbon ions hitting a thin target. The carbon ions and the fragment (e.g., protons) component may be separated by measuring the energy deposition.
We plan to scale our prototype of a trigger system and build a 20 × 20 cm2 detector to cover the full treatment area and work under active scanning beams. The current Saint-Gobain BCF-12 fibers have improved transmission for use in long lengths. Other fiber type, such as BCF-10 from Saint-Gobain or the SCSF-81 from Kuraray, have a shorter decay time (2.4 ns and 2.7 vs. 3.2 ns) and were optimized for diameters larger that 0.25 mm. The faster decay time and the fibers smaller cross-section could provide an improved solution for reducing the pile-up events. For such an area, we would need 400–800 scintillating fibers readout by independent detector elements. In order to cope with the maximum intensities available at the HIT facility (3.2 × 10⁹ p/s) and considering an average separation between bunches of approximately 150 ns, we would need to track 480 single particles per bunch. These particles may be spread over a small or a large area depending on the beam focus. If we consider a lateral spread of 3 cm (3σ), those 480 particles would be spread over 60 scintillating fibers with an average number of events per scintillating fiber and per bunch of ≈8. For carbon ion beams where intensities reach 5 × 10⁷ ions/s and the lateral spread is smaller (≈1 cm), we would need 20 scintillating fibers to cope with approximately 8 particles per bunch and measure an average number of events per scintillating fiber and per bunch below 0.35. This is essentially an occupancy problem, and depends on the response time (analog bandwidth) of the system to single particles.
The interference of the prototype of a trigger system with the beam and its radiation hardness remained out of the scope of this paper. However, we plan to measure the water equivalent path length of the crossed material and the effect on beam degradation and test the scintillating fibers against radiation damage over routine clinical workflow conditions. Radiation damage is a major concern under clinical intensities. The several studies reported in the literature show the difficulty to draw a global and consistent picture [37, 51]. Scintillating fibers (SCSF-78M from Kuraray) have been tested up to doses of 60 kGy within the LHCb SciFi group [51]. Fluka simulations predict a maximum integrated ionizing dose to which the fibers are expected to be exposed of 35 kGy [52]. The specific condition for the scintillating fibers to be radiation hard, apart from transparency loss, include an unaffected scintillation light yield by an ionizing dose of up to 50 kGy. Moreover, the mechanical and geometrical properties of the scintillating fiber shall not change for an ionizing dose of up to 50 kGy. Most producers are generally unable to measure and guarantee those parameters [52]. The tests to scintillating fibers included the evaluation of the photon spectrum after propagation through the fibers, the attenuation length and the scintillation process. In the case of combining the fibers with silicon photomultipliers (SiPMs), further studies will also be needed as it is known that SiPMs are sensitive to radiation damage. An alternative to the scintillating fibers may be the large area polycrystalline diamond detectors which are know to be highly radiation hard and with an expected time resolution at the level of few tens of picoseconds and a spatial resolution at the level of 1 mm [26, 27]. They demand however complex dedicated integrated electronics with large number of channels.
In what concerns the data acquisition, we plan to acquire the data with multiple FADCs, therefore increasing the throughput of the system. The DAQ system can be extended to 2,304 channels featuring a maximum read out speed of 3.5 Gbytes/s. Each ADC card with 24 channels can deliver up to 100 MByte/s and all cards can be synchronized by an external clock and time distribution.
Finally, a clinical prototype of a trigger system comprising such scintillating fibers will provide a fundamental input to PGI for the verification of the particle range and dose delivery to the patient.
Data Availability Statement
The datasets generated for this study are available on reasonable request to the corresponding author.
Author Contributions
PM designed and performed the experiments. RD attended and provided support during the experimental campaigns and he contributed to the design of the experiments and interpretation of the results. JS coordinated the project, acquired funding, and provided guidance during the design of the detector. MS, GH, and TK provided support with the detector and electronics used in the experimental setup. MS manufactured the trigger according to the design developed together with RD, PM, and JS. PM conducted the post-processing of the experimental data and he wrote the software to perform the quantitative analysis. All authors discussed content and researched data. They reported quantitative parameters that demonstrate the scintillating fiber trigger for time resolved detection of prompt gamma radiation.
Funding
PM was supported by a research fellowship for postdoctoral researchers from the Alexander von Humboldt Foundation, Bonn, Germany. RD was supported by the International Max Planck Research School for Quantum Dynamics in Physics, Chemistry and Biology, Heidelberg, Germany.
Conflict of Interest
The authors declare that the research was conducted in the absence of any commercial or financial relationships that could be construed as a potential conflict of interest.
Acknowledgments
The authors thank the staff of the Heidelberg Ion-Beam Therapy Center (HIT), Heidelberg, Germany, in particular Dr. Stephan Brons and Dipl.-Ing. (FH) Jochen Schreiner for the technical support. The authors also thank the radiation protection department of the DKFZ, in particular Dipl.-Ing. Mechthild Kämmer, for the support with calibration sources.
Supplementary Material
The Supplementary Material for this article can be found online at: https://www.frontiersin.org/articles/10.3389/fphy.2020.00169/full#supplementary-material
References
1. Parodi K, Crespo P, Eickhoff H, Haberer T, Pawelke J, Schardt D, et al. Random coincidences during in-beam PET measurements at microbunched therapeutic ion beams. Nucl Intrum Meth A. (2005) 545:446–58. doi: 10.1016/j.nima.2005.02.002
2. Crespo P, Barthel T, Frais-Kolbl H, Griesmayer E, Heidel K, Parodi K, et al. Suppression of random coincidences during in-beam PET measurements at ion beam radiotherapy facilities. IEEE Trans Nucl Sci. (2005) 52:980–7. doi: 10.1109/TNS.2005.852637
3. Stichelbaut F, Jongen Y. Verification of the proton beams position in the patient by the detection of prompt gamma-rays emission. In: 39th Meeting of the Particle Therapy Co-Operative Group. San Francisco, CA (2003). p. 16.
4. Testa E, Bajard M, Chevallier M, Dauvergne D, Le Foulher F, Freud N, et al. Monitoring the Bragg peak location of 73 MeVu carbon ions by means of prompt γ-ray measurements. Appl Phys Lett. (2008) 93:093506. doi: 10.1063/1.2975841
5. Biegun AK, Seravalli E, Lopes PC, Rinaldi I, Pinto M, Oxley DC, et al. Time-of-flight neutron rejection to improve prompt gamma imaging for proton range verification: a simulation study. Phys Med Biol. (2012) 57:6429–44. doi: 10.1088/0031-9155/57/20/6429
6. Smeets J, Roellinghoff F, Prieels D, Stichelbaut F, Benilov A, Busca P, et al. Prompt gamma imaging with a slit camera for real-time range control in proton therapy. Phys Med Biol. (2012) 57:3371–405. doi: 10.1088/0031-9155/57/11/3371
7. Verburg JM, Riley K, Bortfeld T, Seco J. Energy- and time-resolved detection of prompt gamma-rays for proton range verification. Phys Med Biol. (2013) 58:L37–49. doi: 10.1088/0031-9155/58/20/l37
8. Golnik C, Hueso-González F, Müller A, Dendooven P, Enghardt W, Fiedler F, et al. Range assessment in particle therapy based on prompt γ-ray timing measurements. Phys Med Biol. (2014) 59:5399–422. doi: 10.1088/0031-9155/59/18/5399
9. Lopes PC, Clementel E, Crespo P, Henrotin S, Huizenga J, Janssens G, et al. Time-resolved imaging of prompt-gamma rays for proton range verification using a knife-edge slit camera based on digital photon counters. Phys Med Biol. (2015) 60:6063–85. doi: 10.1088/0031-9155/60/15/6063
10. Petzoldt J, Roemer KE, Enghardt W, Fiedler F, Golnik C, Hueso-González F, et al. Characterization of the microbunch time structure of proton pencil beams at a clinical treatment facility. Phys Med Biol. (2016) 61:2432–56. doi: 10.1088/0031-9155/61/6/2432
11. Parodi K, Brons S, Forck P, Franczak B, Haberer T, Hoffmann TK, et al. Measurement of the carbon ion microstructure after KO extraction. In: EXTERNAL-HIT-08 (2008). p. 381.
12. Verburg JM, Seco J. Proton range verification through prompt gamma-ray spectroscopy. Phys Med Biol. (2014) 59:7089–106. doi: 10.1088/0031-9155/59/23/7089
13. Hueso-González F, Enghardt W, Fiedler F, Golnik C, Janssens G, Petzoldt J, et al. First test of the prompt gamma ray timing method with heterogeneous targets at a clinical proton therapy facility. Phys Med Biol. (2015) 60:6247–72. doi: 10.1088/0031-9155/60/16/6247
14. Martins PM, Bello RD, Rinscheid A, Roemer K, Werner T, Enghardt W, et al. Prompt gamma spectroscopy for range control with CeBr3. CDBME. (2017) 3:113–7. doi: 10.1515/cdbme-2017-0023
15. Gil EC, Albarrán EM, Minucci E, Nüssle G, Padolski S, Petrov P, et al. The beam and detector of the NA62 experiment at CERN. J Instrum. (2017) 12:P05025. doi: 10.1088/1748-0221/12/05/p05025
16. Schüttauf A. Timing RPCs in FOPI. Nucl Instrum Meth A. (2004) 533:65–8. doi: 10.1016/j.nima.2004.07.002
17. Alici A. Status and performance of the ALICE MRPC-based Time-Of-Flight detector. J Instrum. (2012) 7:P10024. doi: 10.1088/1748-0221/7/10/p10024
18. Blanco A, Fonte P, Garzon JA, Koenig W, Kornakov G, Lopes L. Performance of the HADES-TOF RPC wall in a Au + Au beam at 1.25 AGeV. J Instrum. (2013) 8:P01004. doi: 10.1088/1748-0221/8/01/p01004
19. Sadrozinski HFW, Ely S, Fadeyev V, Galloway Z, Ngo J, Parker C, et al. Ultra-fast silicon detectors. Nucl Instrum Meth A. (2013) 730:226–31. doi: 10.1016/j.nima.2013.06.033
20. Cartiglia N, Staiano A, Sola V, Arcidiacono R, Cirio R, Cenna F, et al. Beam test results of a 16 ps timing system based on ultra-fast silicon detectors. Nucl Instrum Meth A. (2017) 850:83–8. doi: 10.1016/j.nima.2017.01.021
21. Sadrozinski HFW, Seiden A, Cartiglia N. 4D tracking with ultra-fast silicon detectors. Rep Prog Phys. (2017) 81:026101. doi: 10.1088/1361-6633/aa94d3
22. Beddar AS, Mackie TR, Attix FH. Water-equivalent plastic scintillation detectors for high-energy beam dosimetry: I. Physical characteristics and theoretical considerations. Phys Med Biol. (1992) 37:1883–900. doi: 10.1088/0031-9155/37/10/006
23. Beddar AS, Mackie TR, Attix FH. Water-equivalent plastic scintillation detectors for high-energy beam dosimetry: II. Properties and measurements. Phys Med Biol. (1992) 37:1901–13. doi: 10.1088/0031-9155/37/10/007
24. Beaulieu L, Beddar S. Review of plastic and liquid scintillation dosimetry for photon, electron, and proton therapy. Phys Med Biol. (2016) 61:R305–43. doi: 10.1088/0031-9155/61/20/r305
25. Beddar S, Beaulieu L. Scintillation Dosimetry. Boca Raton: CRC Press; Taylor & Francis Group (2016).
26. Gallin-Martel ML, Bes A, Boukhémiri A, Bosson G, Collot J, Dauvergne D, et al. Large area polycrystalline diamond detectors for online hadron therapy beam tagging applications. In: 2016 IEEE Nuclear Science Symposium, Medical Imaging Conference and Room-Temperature Semiconductor Detector Workshop (NSS/MIC/RTSD) (Strasbourg), (2016). p. 1–5.
27. Marcatili S, Collot J, Curtoni S, Dauvergne D, Hostachy JY, Koumeir C, et al. Ultra-fast prompt gamma detection in single proton counting regime for range monitoring in particle therapy. Phys Med Biol. (2020). doi: 10.1088/1361-6560/ab7a6c
28. Kirn T. SciFi–A large scintillating fibre tracker for LHCb. Nucl Instrum Meth A. (2017) 845:481–5. doi: 10.1016/j.nima.2016.06.057
29. Leverington BD, Dziewiecki M, Renner L, Runze R. A prototype scintillating fibre beam profile monitor for Ion Therapy beams. J Instrum. (2018) 13:P05030. doi: 10.1088/1748-0221/13/05/p05030
30. Vignati A, Monaco V, Attili A, Cartiglia N, Donetti M, Mazinani MF, et al. Innovative thin silicon detectors for monitoring of therapeutic proton beams: preliminary beam tests. J Instrum. (2017) 12:C12056. doi: 10.1088/1748-0221/12/12/c12056
31. Krimmer J, Dauvergne D, Létang JM, Testa E. Prompt-gamma monitoring in hadrontherapy: a review. Nucl Intrum Meth A. (2018) 878:58–73. doi: 10.1016/j.nima.2017.07.063
32. Pausch G, Berthold J, Enghardt W, Römer K, Straessner A, Wagner A, et al. Detection systems for range monitoring in proton therapy: needs and challenges. Nucl Instrum Meth A. (2018) 954:161227. doi: 10.1016/j.nima.2018.09.062
33. Hueso-González F, Bortfeld T. Compact method for proton range verification based on coaxial prompt Gamma-ray monitoring: a theoretical study. IEEE Trans Radiat Plasma Med Sci. (2020) 4:170–83. doi: 10.1109/TRPMS.2019.2930362
34. Haberer T, Debus J, Eickhoff H, Jäkel O, Schulz-Ertner D, Weber U. The heidelberg ion therapy center. Radiother Oncol. (2004) 73:S186–90. doi: 10.1016/S0167-8140(04)80046-X
35. Hara K, Hata K, Kim S, Mishina M, Sano M, Seiya Y, et al. Radiation hardness and mechanical durability of Kuraray optical fibers. Nucl Instrum and Meth A. (1998) 411:31–40.
36. Joram C, Haefeli G, Leverington B. Scintillating fibre tracking at high luminosity colliders. J Instrum. (2015) 10:C08005. doi: 10.1088/1748-0221/10/08/c08005
37. Ekelhof RJ. Studies for the LHCb SciFi Tracker - Development of Modules from Scintillating Fibres and Tests of their Radiation Hardness. Technische Universitaet Dortmund (2016). Available online at: https://cds.cern.ch/record/2212494
38. Dauvergne D. Online control of particle therapy - CLaRyS collaboration. In: Final MediNet Network Meeting. Wiener Neustadt (2019). p. 18–25. Available online at: https://hal.archives-ouvertes.fr/hal-02350983
39. Tessonnier T, Mairani A, Chen W, Sala P, Cerutti F, Ferrari A, et al. Proton and helium ion radiotherapy for meningioma tumors: a Monte Carlo-based treatment planning comparison. Radiat Oncol. (2018) 13:2. doi: 10.1186/s13014-017-0944-3
40. Mein S, Dokic I, Klein C, Tessonnier T, Böhlen TT, Magro G, et al. Biophysical modeling and experimental validation of relative biological effectiveness (RBE) for 4He ion beam therapy. Radiat Oncol. (2019) 14:123. doi: 10.1186/s13014-019-1295-z
41. Schoemers C, Feldmeier E, Naumann J, Panse R, Peters A, Haberer T. The intensity feedback system at Heidelberg Ion-Beam Therapy Centre. Nucl Instrum Meth A. (2015) 795:92–9. doi: 10.1016/j.nima.2015.05.054
42. Werner F, Bauer C, Bernhard S, Capasso M, Diebold S, Eisenkolb F, et al. Performance verification of the FlashCam prototype camera for the Cherenkov Telescope Array. Nucl Instrum Meth A. (2017) 876:31–4. doi: 10.1016/j.nima.2016.12.056
43. The CTA Consortium, Actis M, Agnetta G, Aharonian F, Akhperjanian A, Aleksić J, et al. Design concepts for the Cherenkov Telescope Array CTA: an advanced facility for ground-based high-energy gamma-ray astronomy. Exp Astron. (2011) 32:193–316. doi: 10.1007/s10686-011-9247-0
44. Dal Bello R, Magalhaes Martins P, Graça J, Hermann G, Kihm T, Seco J. Results from the experimental evaluation of CeBr3 scintillators for 4He prompt gamma spectroscopy. Med Phys. (2019) 46:3615–26. doi: 10.1002/mp.13594
45. Pühlhofer G, Bauer C, Bernhard S, Capasso M, Diebold S, Eisenkolb F, et al. FlashCam: a fully-digital camera for the medium-sized telescopes of the Cherenkov Telescope Array. In: Proceedings of The 34th International Cosmic Ray Conference — PoS(ICRC2015). The Hague: Sissa Medialab (2016). p. 1–8. doi: 10.22323/1.236.1039
46. Testa M, Bajard M, Chevallier M, Dauvergne D, Freud N, Henriquet P, et al. Real-time monitoring of the Bragg-peak position in ion therapy by means of single photon detection. Radiat Environ Biophys. (2010) 49:337–43. doi: 10.1007/s00411-010-0276-2
47. Dal Bello R, Martins PM, Brons S, Hermann G, Kihm T, Seimetz M, et al. Prompt gamma spectroscopy for absolute range verification of 12C ions at synchrotron based facilities. Phys Med Biol. (2020). doi: 10.1088/1361-6560/ab7973
48. Leo WR. 2. In: Techniques for Nuclear and Particle Physics Experiments: A How-to Approach. Berlin; Heidelberg: Springer Berlin Heidelberg (1994). p. 17–68. Available online at: https://doi.org/10.1007/978-3-642-57920-2_2
49. Graeff C, Weber U, Schuy C, Saito N, Volz L, Piersimoni P, et al. [OA027] Helium as a range probe in carbon ion therapy. Phys Med. (2018) 52:11. doi: 10.1016/j.ejmp.2018.06.099
50. Mazzucconi D, Agosteo S, Ferrarini M, Fontana L, Lante V, Pullia M, et al. Mixed particle beam for simultaneous treatment and online range verification in carbon ion therapy: Proof-of-concept study. Med Phys. (2018) 45:5234–43. doi: 10.1002/mp.13219
51. Blanc F. Scintillating Fiber Trackers: recent developments and applications. In: 14th ICATPP Conference on Astroparticle, Particle, Space Physics and Detectors for Physics Applications. Como (2013). p. 20–4. Available online at: https://cds.cern.ch/record/1603129
52. Joram C, Uwer U, Leverington BD, Kirn T, Bachmann S, Ekelhof RJ, et al. LHCb Scintillating Fibre Tracker Engineering Design Review Report: Fibres, Mats and Modules. Geneva: CERN (2015). Available online at: https://cds.cern.ch/record/2004811
Keywords: prompt-gamma, particle tracking, scintillating fibers, ion-beam therapy, synchrotrons
Citation: Magalhaes Martins P, Dal Bello R, Seimetz M, Hermann G, Kihm T and Seco J (2020) A Single-Particle Trigger for Time-of-Flight Measurements in Prompt-Gamma Imaging. Front. Phys. 8:169. doi: 10.3389/fphy.2020.00169
Received: 07 December 2019; Accepted: 22 April 2020;
Published: 26 May 2020.
Edited by:
Vincenzo Patera, Sapienza University of Rome, ItalyReviewed by:
Matteo Morrocchi, University of Pisa, ItalyGiuseppe Battistoni, National Institute for Nuclear Physics, Italy
Copyright © 2020 Magalhaes Martins, Dal Bello, Seimetz, Hermann, Kihm and Seco. This is an open-access article distributed under the terms of the Creative Commons Attribution License (CC BY). The use, distribution or reproduction in other forums is permitted, provided the original author(s) and the copyright owner(s) are credited and that the original publication in this journal is cited, in accordance with accepted academic practice. No use, distribution or reproduction is permitted which does not comply with these terms.
*Correspondence: Paulo Magalhaes Martins, p.martins@dkfz.de