Single-Cell RNA Analysis of Type I Spiral Ganglion Neurons Reveals a Lmx1a Population in the Cochlea
 Fiorella Carla Grandi
 Lara De Tomasi
 Mirna Mustapha
- 1Cancer Biology Program, Stanford University, Stanford, CA, United States
- 2Department of Biomedical Science, University of Sheffield, Sheffield, United Kingdom
- 3Department of Otolaryngology-Head and Neck Surgery, Stanford University School of Medicine, Stanford, CA, United States
In the mature cochlea, each inner hair cell (IHC) is innervated by multiple spiral ganglion neurons of type I (SGNI). SGNIs are morphologically and electro-physiologically diverse. Also, they differ in their susceptibility to noise insult. However, the molecular underpinnings of their identity and physiological differences remain poorly understood. In this study, we developed a novel triple transgenic mouse, which enabled the isolation of pure populations of SGNIs and the analysis of a 96-gene panel via single-cell qPCR. We found three distinct populations of Type I SGNs, which were marked by their exclusive expression of Lmx1a, Slc4a4, or Mfap4/Fzd2, respectively, at postnatal days P3, P8, and P12. Our data suggest that afferent SGN subtypes are established genetically before the onset of hearing and that the expression of key physiological markers, such as ion channels, is heterogeneous and may be underlying the heterogeneous firing proprieties of SGNIs.
Introduction
The inner and outer hair cells (IHC and OHC) of the organ of Corti allow us to perceive sound using spiral ganglion neurons (SGNs). SGNs type I and type II, which innervate the IHC and OHC, respectively, are structurally and functionally different. Type I SGNs (SGNI) make up 90–95% of SGNs and are the main cells that transmit complex sound information to the brain (Berglund and Ryugo, 1987; Nayagam et al., 2011). The remaining 5–10% of type II SGNs (SGNII) are the sensory drive for the olivocochlear efferent reflex (Froud et al., 2015).
In the mature cochlea, each IHC is innervated by multiple SGNI fibers that have varying morphological and electrophysiological properties, such as low and high thresholds of sound detection. Heterogeneous electrophysiological features of postnatal SGNI can be distinguished tonotopically and within the same cochlear region (Davis and Liu, 2011). In addition to their functional and morphological differences, studies have suggested that SGNIs also exhibit differential vulnerability to aging and noise-induced excitotoxicity. Single-fiber recording studies have shown a selective reduction of high-threshold neurons in noise-exposed and aging rodents, resulting in auditory synaptopathy (Kujawa and Liberman, 2015) The mechanisms, as to why high-threshold fibers are predominantly affected by noise remain elusive.
SGNs and vestibular ganglion neurons (VGNs), which are both derived from the proneurosensory tissue, are defined early in development by the transcription factor networks of GATA3 and TLX3, respectively (Appler and Goodrich, 2011). However, little is known about the subsequent mechanisms involved in specifying the terminal differentiation of SGNIs to low- and high-threshold neurons. The identities of other molecular selectors, be they intrinsic or extrinsic to the cell, remain unknown. Recent studies of the retina may provide clues about the developmental regime operating in the inner ear. Lineage tracing studies of retinal progenitor cells have determined that they are multipotent and they differentiate via defined, irreversible states (Goetz et al., 2014). Although these progenitors can, to some degree, be influenced by extrinsic cues, a growing list of transcription factors have been suggested as intrinsic regulators of retinal cell specification. Many of these genes also affect hearing, leading us to hypothesize that SGNI subtypes are also genetically defined by intrinsic cues.
Validating this hypothesis requires the ability to specifically sort out and profile single SGNIs from cochlear tissue. With this goal, we established a transgenic mouse model capable of differentially fluorescently labeling SGNI and SGNII. This allowed us to isolate pure, single-cell populations and perform single-cell transcriptomic analysis. The single-cell transcriptomic analysis is a powerful tool to understand cellular diversity in complex tissues, and has been successfully used in the inner ear (Durruthy-Durruthy et al., 2014; Waldhaus et al., 2015; Petitpré et al., 2018; Shrestha et al., 2018; Sun et al., 2018). However, these previous studies focused primarily on adult SGNs. To test our hypothesis about the intrinsic genetic definition of SGN subtypes before the onset of hearing, we profiled SGNs at postnatal day 3 (P3) and P8, before the onset of hearing and at P12, around the onset of hearing in most mice. Using a 96-gene targeted single-cell RT-PCR platform, we identified and validate three main clusters of SGNIs in the neonatal ear. Lmx1a, Slc4a4, and Mfap4/Fzd2 designate the three clusters, respectively. This targeted approach allowed us to amplify low-abundance genes that were absent from other studies.
Materials and Methods
A Mouse Model for SGN Labeling
All the animal experiments were performed following institutional and governmental regulations approved by the Stanford University Institutional Animal Care and Use Committee. A triple transgenic mouse line was generated by systematically crossing three lines: Ai14-tdTomato (Jax:007908) mice were crossed with Bhlhb5-cre mice, a neuronal-specific transcriptional factor (Lu et al., 2011). These mice were subsequently crossed with peripherin (Prph)-GFP mice (McLenachan et al., 2008; Huang et al., 2014) to generate triple transgenic Ai14-tdTomato, Bhlhb5-cre, Prph-GFP mice. Peripherin is a type III intermediate filament protein expressed in SGNIIs (Hafidi et al., 1993). In this scheme, SGNI cells are labeled in red, and SGNII is labeled in red and green. We have used a similar approach to create the Lmx1a reporter line. We have crossed a Lmx1a-cre (Chizhikov et al., 2010) to Ai14-tdTomato and Prph-GFP mouse line.
Cochlea Dissociation and Cell Culture
For single-cell experiments, 4–6 of each of the postnatal ages P3, P8 or P12 cochleae were incubated in digestion solution [50 μM kynurenic acid (Sigma–Aldrich, K3375), 10 mM MgCl2, 10 mM glucose in MEM Hanks (Life Technologies, 11575-032)] with 50 μg/ml collagenase (Roche, 10269638001) and 6 μg/ml DNAseI (Worthington, LS002004) for 15 min at 37°C with continuous shaking at 50 rpm (Excella E24 Incubator Shaker Series, New Brunswick Scientific). Tissue was dissociated with gentle pipetting four to six times during digestion. Subsequently, trypsin (Gibco, 15090046) was added to a final concentration of 0.05%, and tissues were and incubate for another 15 min at 37°C and 50 rpm. For P12 cochleae, we replaced trypsin with milder recombinant enzyme 0.05% TrypLE Select (Gibco, A12177-01) for better cell viability. After digestion, the cell suspension was placed on ice and remaining clumps were dissociated by pipetting. The enzymatic digestion was stopped using the fetal bovine serum. The samples were centrifuged at 0.8× g for 5 min at 4°C, and cells were resuspended in 500 μl HBSS (Hyclone, ADD20159) and passed through a 35 μm cell strainer (Corning, 352235) and used directly for fluorescence-activated cell sorting (FACS) analysis or culture.
To prepare neuronal cultures, the cells were resuspended in Neurobasal-A media supplemented with glutamax (Gibco, 35050079), 1× B27 (Gibco, 17504-044), 10 ng/ml BDNF (Sigma, B3795) and 10 ng/ml NT-3 (Sigma, N1905), and cultured overnight on 0.5 mg/ml poly-D-lysine (Sigma, P6407) coated coverslip in a 35 mm cell culture dish.
Immunostaining and Neuron Quantification
Cells cultured overnight were fixed with 4% paraformaldehyde in PBS for 30 min at room temperature, then were washed three times for 10 min in room temperature PBS. Cells were blocked with 5% BSA/0.5% Triton-X 100/PBS for 1 h at room temperature, then washed three times in PBS. Cells were incubated overnight with the TUJ1 antibody (BioLegend, 801202) at a 1:500 dilution at 4°C, then washed three times with 0.1% Tween20 in PBS for 10 min at room temperature, before incubating with secondary antibody for 1 h and repeating wash steps. Slides were mounted with anti-fade mounting media with DAPI (Invitrogen, 1010789). Cells were manually counted from different areas on coverslip under a 20× fluorescent microscope.
Single Neuron Sorting by Fluorescence-Activated Cell Sorting (FACS)
Cochleae were dissected out from triple transgenic animals and enzymatically dissociated as described in the cochlea dissociation section. Cells were then stained with Sytox red (Life Technologies, S34859) and sorted on the FACS Aida and FACS Falstaff (BD Biosciences) at the Stanford FACS core facility. Cells debris and dead cells were removed by gating forward scatter area (FSC-A) and side scatter area (SSC-A; Supplementary Figures S1D–H for FACS gating strategies). Finally, tdTomato and GFP positive cells were gated and high tomato positive cells were sorted into 96-wells plate, with each well, containing 5 μl of 2× reaction mix (Invitrogen, CellsDirect, 1753-500) mixed with 0.05 units of SUPERase-In RNase inhibitor (Ambion, PN AM2696) and stored at −80°C until use. The total time from animal sacrifice to single-cell sorting was ~2.5 h. A subset of cells was always kept for culture to ensure minimal cell stress to the cells being analyzed by single-neuron qRT-PCR.
Single-Neuron Multiplex qRT-PCR
Single-neuron multiplex qRT-PCR assays were performed on sorted cells following the manufacturer’s guidelines (Fluidigm manual-PN 68000088 L) and as previously described (Durruthy-Durruthy et al., 2014). Briefly, each cell was placed in a well containing CellsDirect reagents (Invitrogen, CellsDirect, 11753-500) to isolate RNA. RNA was then transcribed to cDNA, and specific target genes were pre-amplified with one step PCR using SuperScript III RT Platinum Taq Mix and 500 nM primer (DELTAgene). Samples were treated with ExoI (NEB, M0293L) to cleave off single-stranded DNA. Exo-treated samples were diluted five times with nuclease-free water. Samples were then prepared for qRT-PCR analysis as per manufacturer specifications (Fluidigm, 85000736). qRT-PCR experiments were performed on the Biomark HD (Fluidigm manual, PN 68000088 L1) with pre-defined protocol GE96.96 Fast PCR+Melt v2.PCI for 30 cycles using the 96.96 dynamic arrays integrated fluidic circuit chip (IFC, Fluidigm). Data are available in Supplementary Table S1. For P3, the data represent 203 single cells aggregated from three independent runs. For P8, the data represent 383 single cells aggregated from seven independent runs, and for P12, data represents 230 single cells aggregated from three runs. Each run consists of four to six pups pooled from a litter.
Data Processing and Bioinformatics
A series of preliminary experiments were conducted to validate that: (a) the primers amplify single amplicons in the expected size range; (b) the target mRNA is indeed expressed in neonatal and young cochlea; and (c) to determine the limit of detection (LOD), which is the cycle threshold (Ct value) for each primer/gene combination. Quantitative single-cell RT-PCR cannot be normalized to a single housekeeping gene or groups of genes, but rather to the individually determined detection limit for each primer pair. Ultimately, quantitative gene expression for each primer pair and cell is presented as expression level above detection limit on a log scale using Log2Ex values [Log2Ex = Ct(LOD) − Ct(measured); Durruthy-Durruthy et al., 2014]. In simple terms, Log2Ex for a gene represents transcript level above background in log base 2. LOD Ct values for each primer pair were determined in dilutions of bulk cochlear cDNA (neonatal and P21) over 16 orders of magnitude. Primers that did not meet the three above stated validation requirements were eliminated. A list of 96 genes (Supplementary Table S1) was used for gene expression profiling, and the Log2Ex values were used for downstream analysis.
Before clustering, the data set was cleaned by removing cells with low expression of housekeeping genes Gapdh and Actb, as well as removing any non-neuronal contaminants by selecting cells, which expressed Map2 and Tubb3. We used HDBSCAN, implemented in python, to cluster single cells obtained from P3, P8, and P12 cochlea, and obtained six clusters. In selecting our clustering method, we sought to find a method that would agree with our underlying assumptions about the cell populations, namely that: (1) the variance between different cell populations might not be the same; (2) the size of each subpopulation may be different; (3) some rare cell populations might not be sufficiently sampled; and (4) variance in the data can be introduced by additional factors, such as RNA degradation. HDBSCAN (McInnes et al., 2017) has many advantages over traditional k-means clustering, including its ability to deal with data with variable density and variance, fulfilling goals (1) and (2), and the ability to deal with noisy data by assigning some points to no cluster, fulfilling conditions (3) and (4). We restricted our analysis to five of these six clusters, as the sixth was found not to express any of the selected genes. To visualize the cells, we utilized UMAP, a dimensionality-reducing algorithm, to project the cells into 2D space and mapped the HDBSCAN called cluster identities. Here, we present all cells, including those cells that HDBSCAN did not cluster due to low confidence about their identity. Enrichment for a particular marker gene was tested using a one-factor ANOVA with correction for multiple hypothesis testing (alpha = 0.05/96), and then each significant ANOVA was tested using the post hoc Tukey test. Statistical analysis was performed in Python and Prism (Graphpad).
We also repeated the same clustering process using PCA analysis plus K-means clustering and hierarchical clustering. K-means clustering was applied in each data sets using the algorithm “Hartigan-Wong” with one thousand iterations (iter.max = 1,000) in R. Hierarchical clustering was computed by Ward’s minimum variance method (Ward.D2). The numbers of stable clusters generated were assessed by gap statistic (Tibshirani et al., 2001).
RNAscope in situ Hybridization and Conventional in situ Hybridization
RNAscope in situ hybridization was performed according to RNAscope guidelines (ACD, document number, 320293; Wang et al., 2012). Briefly, temporal bones were removed in ice-cold PBS and cleaned. Cochleae were placed in 4% PFA at 4°C for 22–24 h with gentle shaking. After fixation, samples were washed 2× with PBS and dehydrated overnight with 30% sucrose at 4°C, for 24 h, the mounted in OCT. Fourteen micrometer cochlear section was cut using a cryostat. The manufacturer designed probes were used for double fluorescent labeling (Cacna1a: 493141-C2, Mfap4: 421391, Kcnd2: 452581-C3) according to manufacturer specifications. Conventional in situ hybridization procedures for Cacna1a and Nefm were performed as described (Mendus et al., 2014). Briefly, in situ probes were cloned into the pGEM-T vector (Promega, Madison, WI, USA), with the following primers: Cacna1a: GAGAGAATTCGGGCGCACTGCAAATGATAA and GAGAAAGCTTGTCCCAAGCCCACGTTTTTC. In situ hybridization was carried out as previously described (Schwander et al., 2007).
Confocal Imaging and Signal Quantification
Images were acquired on a confocal microscope (Zeiss, LMS700) as previously described (Mendus et al., 2014). A 0.5 μm z-stack of images was collected. The signals for specific genes such as Cacna1a, Mfap4, and Kcnd2 in each cell were visualized in Velocity 3D image analysis software (PerkinElmer, Inc., Waltham, MA, USA). The boundary of a cell was defined by merging fluorescent images with bright-field images and manually tracing cell borders. The numbers of fluorescent signals in each defined boundary were quantified manually.
Results
Isolation of Type I and Type II SGNs From the Cochlea
To prepare single-cell suspensions of SGNs from the cochlea, we utilized a triple transgenic mouse model in which Type I and II SGNs are uniquely labeled with different fluorescent reporters. Briefly, we crossed Ai14-tdTomato to Bhlhb5-cre mice and Prph-GFP mice (see “Materials and Methods” section). This resulted in cochlear tissues where SGNIs are labeled red and SGNIIs are marked red and green (Figures 1A–E). We then isolated pure cell populations by FACS for subsequent single-cell transcriptome analysis. To validate our dissociation and sorting strategy, we immunostained cells with the neuronal marker TUJ1 (Supplementary Figures S1A,B). Our dissociation protocol resulted in 85.6% cell viability after sorting (Supplementary Figure S1C). As expected, tdTomato/GFP double-positive cells (SGNIIs) compose only 0.05% of the final viable fraction (Supplementary Figures S1D–H). Cells were directly sorted into 96-well plates and analyzed using the Fluidigm single-cell platform (Supplementary Figures S2A–F). The panel of 96 genes (Supplementary Table S1) was preselected using microarray expression profiles generated from the same mouse model and contained genes hypothesized to be either selectors or effectors for SGNI subpopulations.

Figure 1. Transgenic mouse model for spiral ganglion neuron (SGN) Type I and Type II Isolation. (A) Cross-section of the organ of Corti showing SGNs showing tdTomato; bhlhb5Cre (SGNIs) and Prph-GFP (SGNIIs) from cryopreserved tissue. (B,C) Fluorescent imaging of tdTomato and GFP. (D) Merge of panels (B,C). (E) Whole-mount of the organ of Corti showing cell body and projections of SGN type I (red) and type II (green) from cryopreserved tissues. All images are representative fields from experiments repeated three times (n = 3).
After quality control and filtering (see “Materials and Methods” section), the single-cell data was visualized using the UMAP projection, which visualizes high-dimensional data on a 2D axis and whose utility for single-cell data has been recently shown (McInnes et al., 2018; Becht et al., 2019). We analyzed 203 cells at P3, 383 cells at P8, and 230 cells at P12.
Zic1, Pax6, and Nfix Serve as Novel Markers of Type I SGNs
We first sought to determine the broad molecular features separating Type I and Type II SGNs at postnatal day 8 (P8), before the onset of hearing. Mapping the FACs gating information onto the UMAP projection of SGNs, we observed that Cluster I is enriched for tdTomato/GFP expressing cells, suggesting that this cluster corresponds to Type II SGNs (Supplementary Figure S3A). Classically, SGNII has been defined by the expression of Prph (Hafidi et al., 1993). Cells in Cluster I were enriched for Prph expression (Figure 2A) as well as Mafb and Gata3 (Figures 2B,C), which also have been suggested as markers of postnatal Type II cells (Petitpré et al., 2018; Shrestha et al., 2018; Sun et al., 2018). We also found Gata3/Mfab positive cells that are not Prph positive (Figures 2A–C), as has been observed by other studies (Petitpré et al., 2018; Shrestha et al., 2018; Sun et al., 2018). The ambiguity of this expression highlights the need for better molecular markers to distinguish between Type I and Type II SGNs.
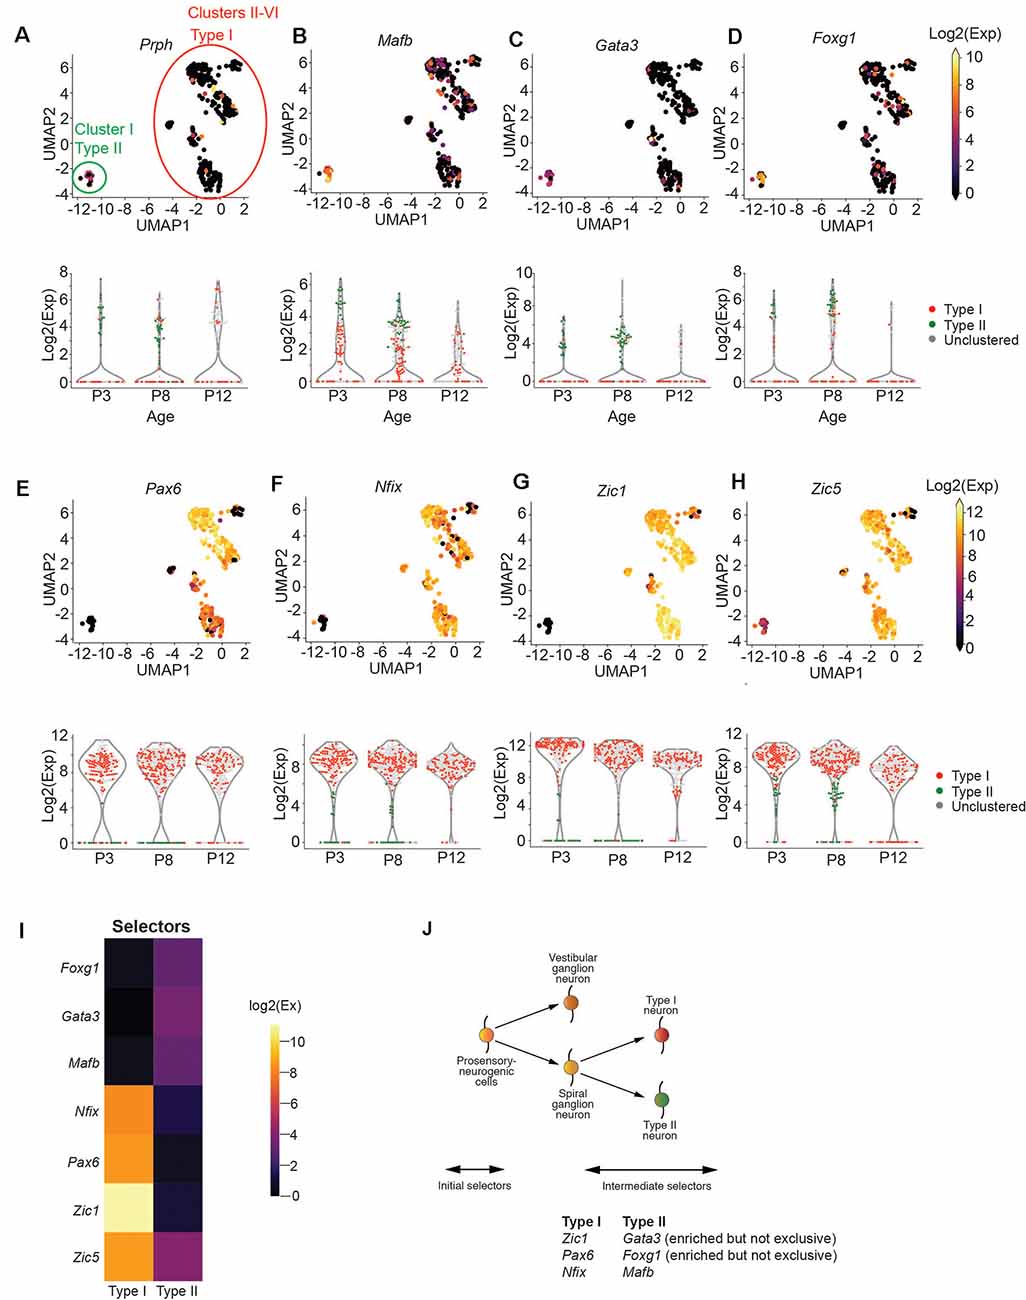
Figure 2. Zic1, Zic5, Pax6, and Nfix are Type I SGN markers. (A–D) UMAP projection of all SGNs from postnatal day 8 cochlea (n = 383 cells, pooled from 7 technical runs representing 28 animals). Each point represents a single cell. Type I and Type II cells are circled in red and green, respectively. Cells are colored by the expression of Prph (A), Mafb (B), Gata3 (C), and Foxg1 (D). The expression scale is given on the right. Violin plots for each gene are given below the UMAP plot. Each point represents a cell. Cells are colored either red (Type I), green (Type II), or gray (unclustered). (E–H) UMAP projections and violin plots as in (a) for Pax6 (E), Nfix (F), Zic1 (G), and Zic5 (H). (I) Heatmap for effector genes. (J) Proposed schematic for Type I and Type II specification based on data above.
With this goal, we focused on the transcription factors in our panel to find those that might act as selectors to designate Type II vs. Type I cells. We observed that Type I cells were strongly enriched for Pax6, Nfix, and Zic1 (Figures 2E–G), while Type II cells were enriched for Foxg1 (Figure 2D). In contrast, Zic5, although highly expressed in Type I cells, was also mildly expressed by Type II cells (Figure 2H). We observed that while Zic1 expression was highest in early development (P3) and decreased slightly with time, Pax6 and Nfix expression stayed constant from P3 to P12 (Figures 2E–H), suggesting they would be optimal markers to identify Type I and II cells over time. In addition to these transcription factors, we find that Cadps2 and Tmem178 are broadly enriched in Type I SGNs (Supplementary Figure S3B), as well as Cacna1g, which although expressed in Type II SGNs, is more strongly expressed in Type I cells (Supplementary Figure S3B) in contrast to previous findings. Collectively, these data provide us with novel genetic markers for Type I and II SGNs (Figures 2I,J).
Type I SGNs Cluster Into Three Major Subtypes
We next focused our attention on identifying subsets of Type I SGNs at post-natal day 8 (P8). Previous work has shown a variety of physiologically distinct SGNI cells (Taberner and Liberman, 2005; Davis and Liu, 2011) and we hypothesize that these cells should have unique molecular signatures. Therefore, we used machine learning to cluster all the Type I SGNs based on their 96-dimensional gene expression profiles. We chose to use HDBSCAN clustering because it can deal with data of variable density and variance (see “Materials and Methods” section). After data transformation, we selected cells that expressed the housekeeping genes B-actin and Gapdh, as well as high levels of neuronal markers Map2 and Tubb3 (Supplementary Figures S3C–F). HDBSCAN was run on this set of Type I SGNs and provided five high confidence clusters (II-VI), of varying sizes (Supplementary Figures S3G–I). Three of these clusters contained a substantial number of cells with clear delineating markers, which we termed Type IA, IB, and IC (Figure 3A). Similar delineations were found using k-means clustering following PCA analysis (Supplementary Figure S4) as well as hierarchical clustering (Supplementary Figure S5), validating our findings. Type IA, B, and C cells were distinguished by their expression of the Lmx1a (Figure 3B), Slc4a4 (Figure 3E), and Mfap4 and Fzd2 (Figures 3F,G), respectively. Both Type IA and IB cells express Cacna1a (Figure 3C) and Kcnd2 (Figure 3D). The additional two subtypes were characterized by a complex pattern of gene expression (Supplementary Figure S6). For completeness, we projected all cells, including those that were not assigned to any subset, onto the UMAP axes when displaying gene expression.
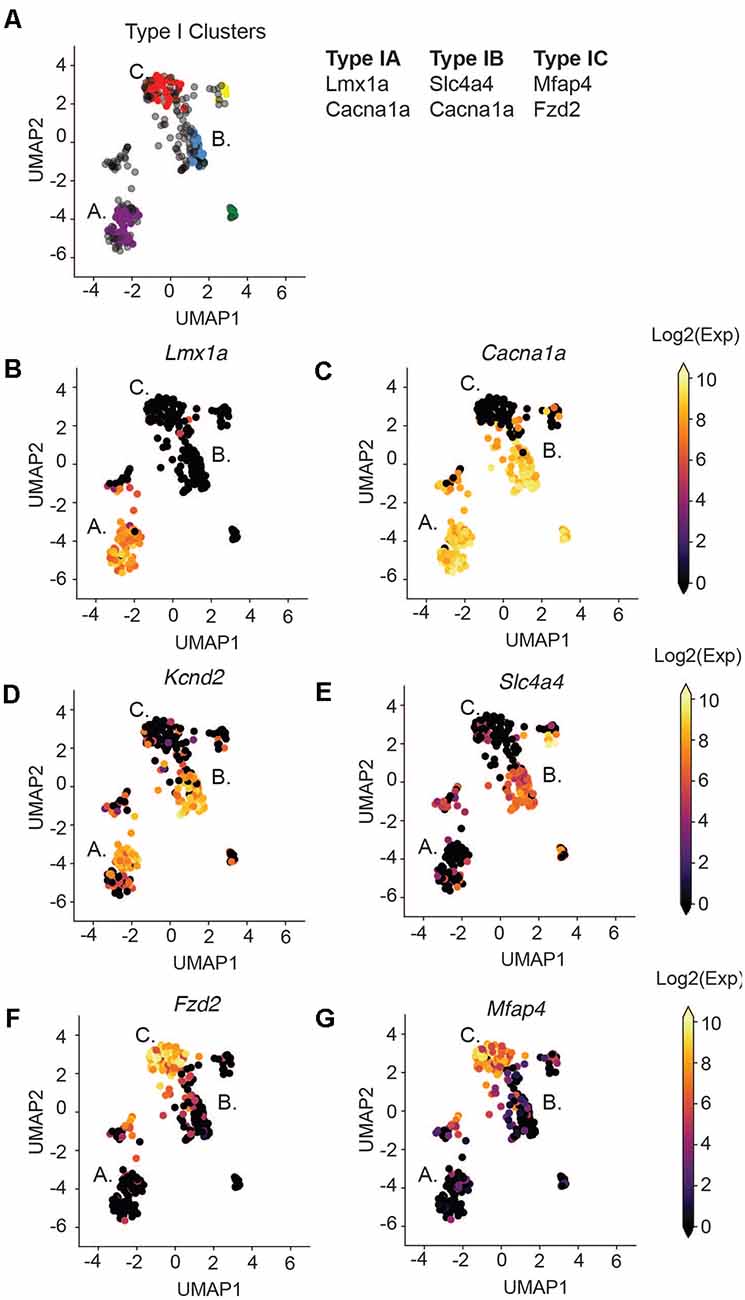
Figure 3. Type I SGNs cluster into three subtypes. (A) UMAP projection of the Type SGNs at postnatal day 8. Each point represents a cell. Cells clustering to Type IA, IB, IC are colored in purple, blue, and red, respectively. The major gene markers for each subtype are given on the right. Two additional clusters were found (in yellow and green) but are not considered in this analysis as they did not have clear marker genes. Cells in gray were not clustered into any of the subgroups. (B–G) UMAP projection of Type I cells. Each cell is colored by the expression of (B) Lmx1a, (C) Cacna1a, (D) Kcnd2, (E) Slc4a4, (F) Fzd2, (G) Mfap4. The expression scale is given on the right.
Some of these marker genes have been previously implicated in SGN biology, in particular Lmx1a and Cacna1a. Lmx1a belongs to the family of LIM-domain containing transcription factors (Rétaux and Bachy, 2002) and is known to play roles in regulating fate decisions, and defining neural boundaries and domains in both the central and peripheral nervous system and the inner ear (Millonig et al., 2000; Chizhikov and Millen, 2004; Nichols et al., 2008; Koo et al., 2009). Cacna1a (encoding CAV2.1) has been shown to control fast excitatory synaptic transmission and low threshold exocytosis in the CNS (Jun et al., 1999; Pagani et al., 2004; Weiss and Zamponi, 2013), and its expression in SGNs has been determined by whole-cell and single-channel recordings (Lv et al., 2012, 2014; Stephani et al., 2019). Less is known about Slc4a4 in SGNs, however, mutations in the human SLC4A4 gene have been associated with neurosensory disorders including glaucoma and hereditary sensory neuropathy type I (Kok et al., 2003; Dinour et al., 2004). Although the Fzd2 gene has not been characterized in SGNs, its ligand WNT5A plays an important role in planar cell polarity and cochlear development (Qian et al., 2007; Munnamalai and Fekete, 2013). Therefore, our identified marker genes are instrumental to distinguish functional subsets of SGN cells.
The Abundance of IA, IB and IC SGNIs Changes During Neonatal Development
We next sought to trace the number and fate of these subpopulations over-development by performing single-cell qPCR on SGNIs, before and at the onset of hearing from P3 and P12 cochlea, respectively. We clustered these cells together with P8 neurons and projected them onto the same UMAP embedding. At P3 and P12, we can see cells belonging to all the clusters we described (Figure 4A). However, we observed age-related changes in their abundance. IA cells are abundant at pre-hearing stages (P3, P8) representing 85% and 38% of the total SGNs analyzed, and decrease after the onset of hearing to 9% (Figure 4B). On the other hand, IB and IC cells are low at P3 (0.9% and 2.8%) and increase significantly at P8 (20% and 32%), stabilizing by P12 (35% and 35%; Figure 4B). The expression markers genes for the IB and IC subtypes stayed fairly constant from P8 to P12, after the large increase in these cell populations (Figures 4D–H). In contrast, expression levels of Lmx1a also decreased mildly with the concurrent loss of IA cells (Figure 4C). The loss of the IA population may either reflect differentiation or death with development or increased sensitivity of these cells to manipulation with age. Intriguingly, Lmx1a expression was not found by single-cell SGN studies focusing on the adult cochlea (Petitpré et al., 2018; Shrestha et al., 2018; Sun et al., 2018).
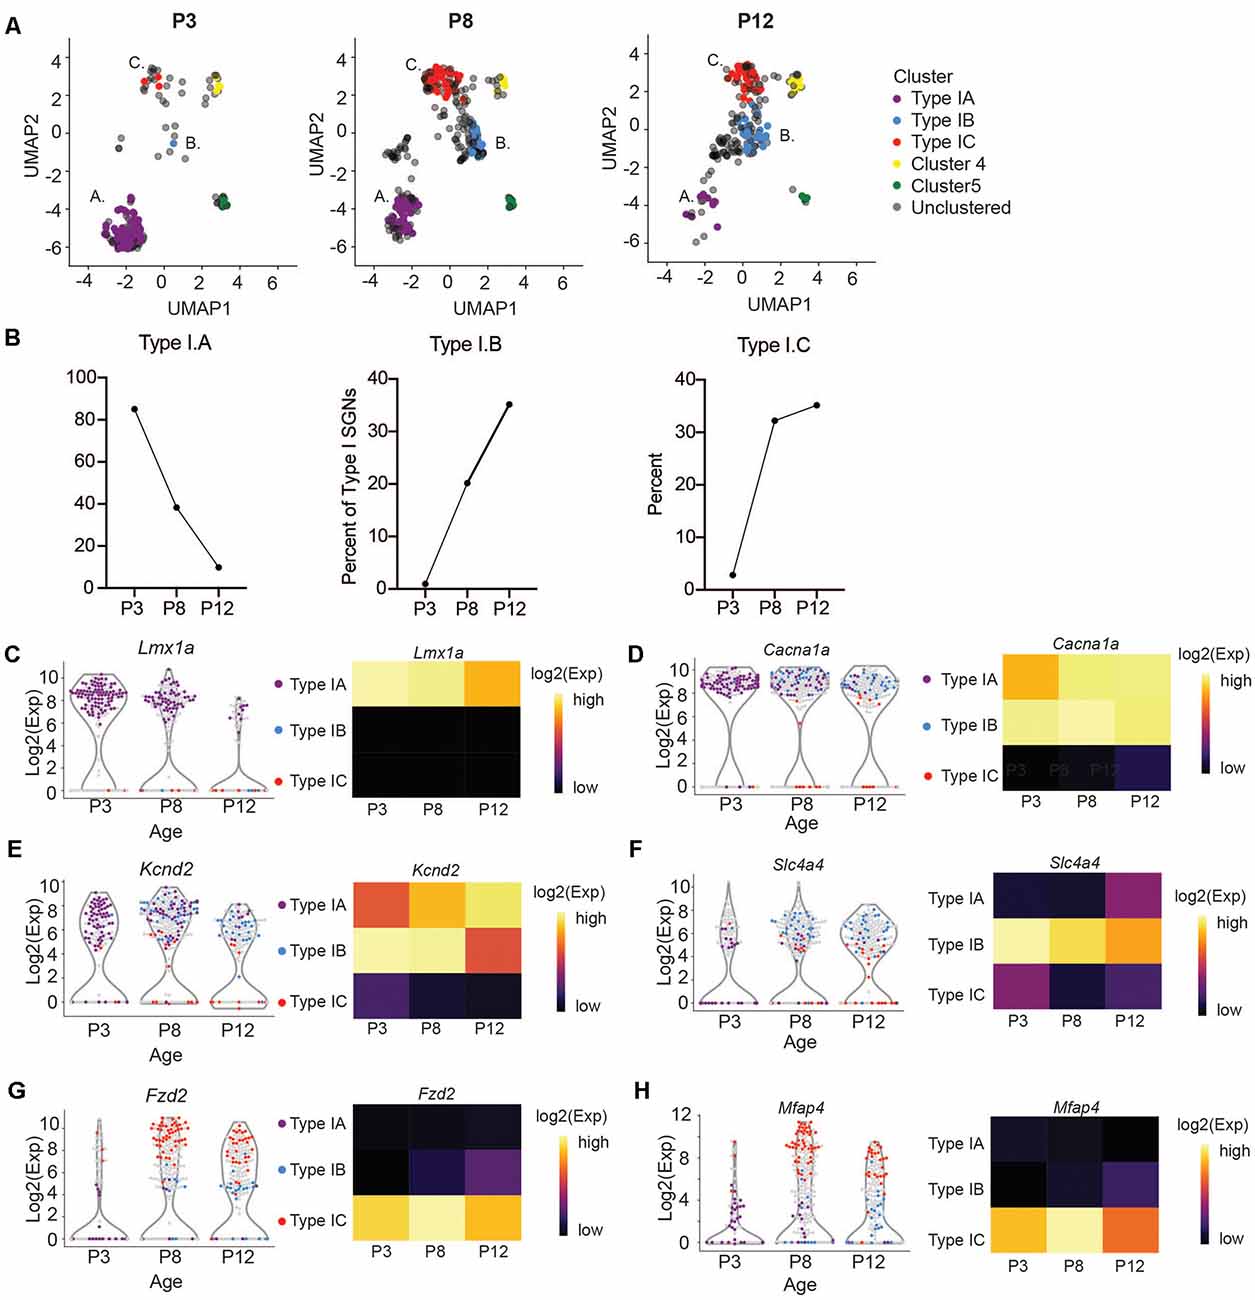
Figure 4. Subtypes of Type I change in abundance at the onset of hearing. (A) UMAP projections of Type I SGNs colored by subtypes at postnatal days 3, 8, and 12 (n = 203 single cells at P3 and n = 230 single cells at P12, representing three independent technical runs, each with four to six animals). Postnatal day 8 is reproduced from Figure 3A for clarity. (B) Quantification of the percentage of Type IA, IB, and IC cells as a fraction of the total Type I SGNs at each age. (C–H) Violin plot of (C) Lmx1a, (D) Cacna1a, (E) Kcnd2, (F) Slc4a4, (G) Fzd2, (H) Mfap4. Each point represents a single cell, colored according to its subtype or gray if outside the IA, IB, IC. On the right, a heatmap of the same data. The expression scale is giving on the right side.
SGNI Subtypes Have Distinct Physiological and Signaling Properties
We next sought to understand the unique functions or properties of the Type I SGN subtypes by analyzing the expression patterns of the other genes beyond those defining the subtypes in our assay. As demonstrated by our PCA analysis (Supplementary Figure S4D), none of these genes has a role in exclusively defining a particular subtype, but several are enriched in only one or two of the subtypes. Genes were classified by their broad functions: transcription factor, signaling, physiology, guidance, and adhesion (Supplementary Figure S6). Overall, we observed that transcription factor expression (beside Lmx1a and Zeb1) from our selected gene set was generally homogenous between all three identified subsets of Type I SGNs, while some of the signaling and physiology related genes have more distinct expression patterns among the subtypes.
We found that subtype IA cells were enriched for a variety of sodium channels, including Scn1a (Nav1.1) Scn2b (Nav1.5), and Scn9a (Nav1.7; Figures 5A,G, Supplementary Figure S6). These channels activate at a more negative membrane potential than the other Nav channels and therefore may contribute to making fibers sensitive to the lower intensity of sound (Royeck et al., 2008; Fryatt et al., 2009; Browne et al., 2017). In addition to these channels, the IA subtype differentially express channels that mediate SGNI resting membrane potential and control neuronal excitability such as hyperpolarization-activated cyclic nucleotide-gated channel α-subunit 2 and 4 (HCN2 and HCN4; Figures 5A,C) and the K+-selective leak channels (KCNK9; Figure 5E; Welker and Woolsey, 1974; Mo and Davis, 1997; Kim and Holt, 2013; Liu et al., 2014).
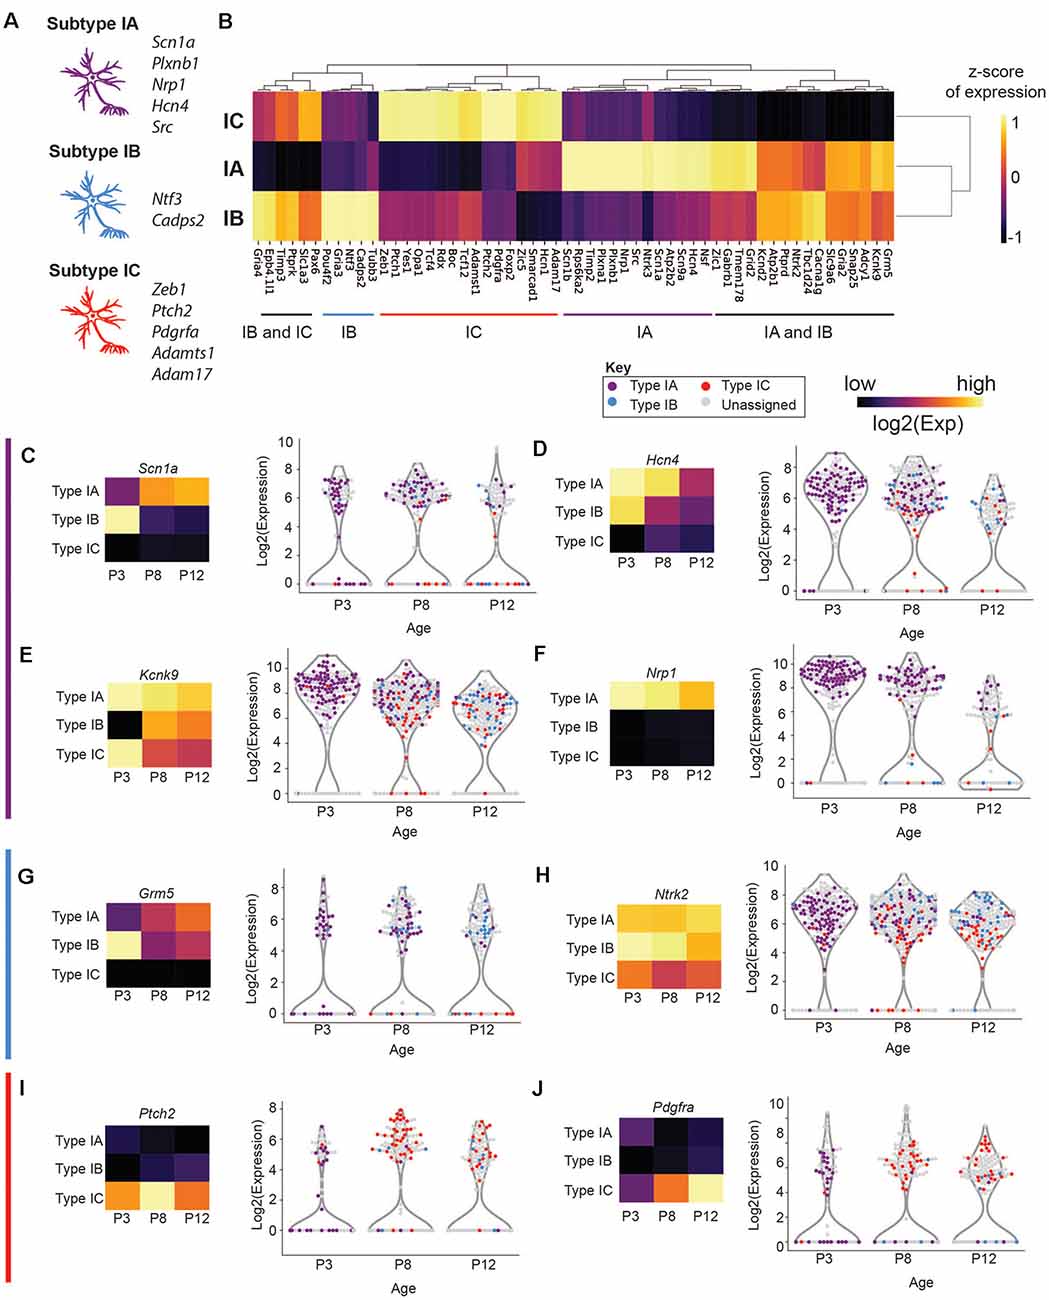
Figure 5. Expression of physiologically relevant genes in SGN Type I subtypes. (A,B) Hierarchical clustering of genes that are differentially enriched in Type I (A,B,C) SGNs and schematic of the most important effectors (on the left). (C–J) Violin plot of (C) Scn1a, (D) Hcn4, (E) Kcnk9, (F) Nrp1, (G) Grm5, (H) Ntrk2, (I) Ptch2, and (J) Pdgfra. Each point represents a single cell, colored according to its subtype or gray if outside the IA, IB, IC. On the left, a heatmap of the same data. Each square has the average expression of cells in that subtype. The expression scale and color key are on the top of the page.
IA cells were also enriched for markers related to neural branching and patterning, suggesting that these cells may still be migrating or differentiating into their mature forms between P3 and P12. In IA cells, we find enrichment for Plxna1 and Plxnb1 (Figure 5A). Plxna1, the receptor for class 3 semaphorin (Sema3a) was recently shown to be involved in SGNI branching and refinement during postnatal synapse maturation (Katayama et al., 2013; Jung et al., 2019). Plxnb1 also plays a role in axonal guidance through Sema2a in the CNS (Ayoob et al., 2006). Finally, IA cells are enriched in Nrp1 (Figures 5A,F), a receptor involved in neural pathfinding, survival, and maintenance (Cariboni et al., 2011; Guaiquil et al., 2014). Together these genes expressed by the IA subtype, in addition to Lmx1a, maybe representing a subset of mid or low threshold neurons that are refining their final connections with target cells.
Subtype IB was enriched in physiological markers involved in increased neural excitability such as Kcnd2 (Kv4.2; Figures 4E, 5A), a potassium voltage-gated channel. Interestingly, Kv4.2 expression in the SGNs is regulated by neurotrophins (Adamson et al., 2002). This channel is activated at membrane potentials that are below the threshold for action potentials (Shibata et al., 2000; Chen et al., 2006; Granados-Fuentes et al., 2012). Kv4.2 functions downstream of the metabotropic glutamate receptor GRM5 and plays a role in nociception mediated by activation of GRM5 (Hu et al., 2007). Grm5 is enriched in both type IA and IB as compare to IC (Figures 5A,G). IB cells are also enriched for Gria4 at P8 (Figure 5A), another glutamate receptor known to control the frequency, amplitude, and kinetics of the spontaneous excitatory postsynaptic channels of the reticular thalamic nucleus (nRT) neurons (Paz et al., 2011, p. 4). Taken together with the highest expression of Cacna1 in type IB SGNI, this subtype may be a representative of the mid to low-threshold SGNI.
Additionally, subtype IB cells had the highest expression of Ca2+-dependent activator protein for secretion 2 (Cadps2; Figure 5A), which is involved in cell survival and the activity-dependent release of the brain-derived neurotrophic factor (BDNF; Sadakata et al., 2004; Shinoda et al., 2011). BDNF is involved in neuronal maturation and synaptic plasticity (Sadakata et al., 2007, 2013). Intriguingly, Bdnf, and Ntf3 expression, as well as their receptor Ntrk2, are high in type IB, although present in the other subtypes (Figure 5A, Supplementary Figure S7). Previous studies have shown a graded expression of neurotrophins in the cochlea, with BDNF expression being highest at the basal turn, while NTF3 is highest at the apical edge (Adamson et al., 2002; Schimmang et al., 2003), suggesting that type IB cells originate from many tonotopic areas. Although expression analysis cannot definitively establish electrophysiological properties, these patterns suggest that IA and IB are more closely related molecularly than IC and may the low or mid-low neurons.
Subtype IC cells are defined by their specific expression of adhesion and signaling molecules Mfap4 and Fzd2. They are also enriched for two members of the Tcf transcription factor family: Zeb1 (Tcf8) andTcf12 (Figure 5A), which may be involved in establishing the IC cluster during early development. Several members of the hedgehog-signaling pathway, Ptch1, Ptch2, and Yes1, are also enriched in this subtype (Figure 5A). Ptch2 expression (Figure 5I) has previously been shown to influence neural cell fate decisions and regulate synaptic plasticity and neuronal activity in the CNS (Konířová et al., 2017, p. 2; Herholt et al., 2018). Type IC cells also expressed high platelet-derived growth factor receptor alpha (Pdgrfa; Figure 5J). PDGF receptors and their ligands play essential roles in neuronal differentiation during embryonic stages and in adult neuronal maintenance (Funa and Sasahara, 2014). PDGF receptors were elevated in cochlear tissues, including SGNs, following noise injury (Fetoni et al., 2014; Bas et al., 2015), suggesting their role in cochlear tissue protection following noise trauma. These expression patterns indicate that IC neurons may be the high-threshold SGNIs. Collectively, our findings suggest that the three SGNI subtypes defined by their distinctive transcriptional profiles represent physiologically distinct subpopulations.
Validation of Type I SGNs in the Mouse Cochlea
After identifying IA, IB, and IC to be the main three subpopulations arising from our single-cell dataset, we sought to validate these three populations in vivo. First, we designed in situ probes against Cacna1a, which we observed to be enriched in both the IA and IB subtypes. Indeed, we see a strong signal of Cacna1a in cochlear tissues at both P3 and P8 (Supplementary Figures S6D,E). However, due to the low resolution of traditional in situ, we were not able to localize the expression of more than one gene to individual populations of neurons. Therefore, we opted to use RNA-scope technology, an in situ hybridization approach with low background signal, that allows us to visualize and/or co-localize two or more probes (Wang et al., 2012). We designed and tested probes against several of the defining population markers (see “Materials and Methods” section). For the validated probes, we were able to observe subpopulations of SGNs that exclusively expressed Cacna1a, representing Type IA and Type IB cells and Mfap4 expressing cells, representing Type IC cells (Figures 6A,B). We also tested the co-localization of Cacna1a and Kcnd2. From the single-cell data, we expected to observe two populations, one that would only express the Cacna1a representing Type IA cells without Kcnd2 (Figure 4G) and those expressing Cacna1a and Kcnd2, pooled both from Type IA and Type IB. In concordance with this data, in RNA-scope images of the cochlea, we observed both cells only expressing Cacna1a and others expressing both Cacna1a and Kcnd2 (Figures 6C,D).
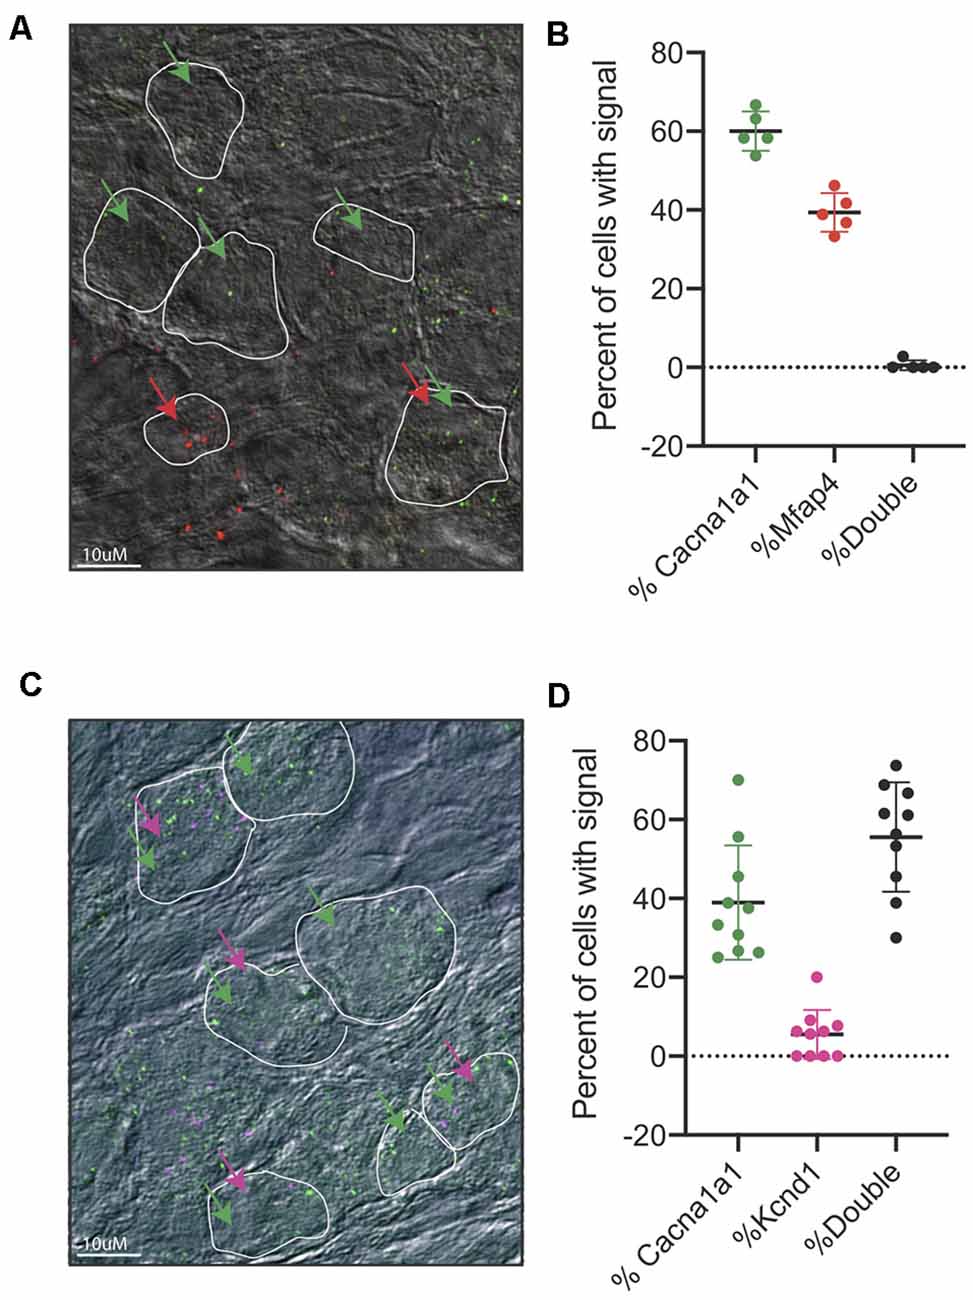
Figure 6. RNA-scope of Cacna1a and Kcnd2. (A) Representative image from RNAscope in situ hybridizations of Cacn1a1 (green) and Mfap4 (red) with bright field merge at postnatal day 8 from cryopreserved cochlear tissue. White boundaries indicate cells; green arrows indicate cells expressing Cacna1a, and red arrows indicate cells expressing Mfap4. (B) Quantification of cells expressing either Cacna1 only (60% ± 5%) or Mfap4 only (39.4% ± 4.8%) or both (0.6% ±1.25%) as percentage of all cells scored per image. Cells were considered positive if they had >1 dot per cell, 5 independent images (n = 5 mice) were scored. Each point represents a scored image; all data presented as average ± STD. (C) Representative image from RNAscope in situ hybridizations of Cacn1a1 (green) and Kcnd2 (purple) with bright field merge at postnatal day 8. White boundaries indicate cells; green arrows indicate cells expressing Cacna1a, and purple arrows indicate cells expressing Kcnd2. (D) Quantification of cells expressing either Cacna1 only (38% ± 14.5%) or Kcnd2 only (5% ± 6%) or both (55.9% ±13.9%) as a percentage of all cells scored per image. Cells were considered positive if they had >1 dot per cell, 10 independent images (n = 10 mice) were scored. Each point represents a scored image; all data presented as average ± STD.
Previous studies had established a role for Lmx1a in inner ear cell fate decisions (Nichols et al., 2008; Koo et al., 2009). However, we were unable to establish robust probes for Lmx1a. Therefore, to validate the existence of SGNI cells which expressed Lmx1a, we established a new triple transgenic mouse line using a Lmx1a-cre line (Chizhikov et al., 2010) crossed to the Ai14-tdTomato reporter line and Peripherin-GFP lines. Our in vivo data revealed that only a subset of SGNIs (i.e., cells not showing GFP expression) was red at P8 (Figure 7A), validating that IA cells are indeed a unique subset of SGNIs distinct from the SGNII (Figure 7B). Further studies need to be performed on this mouse model to analyze the dynamics of this cell population over time (Figure 7C).
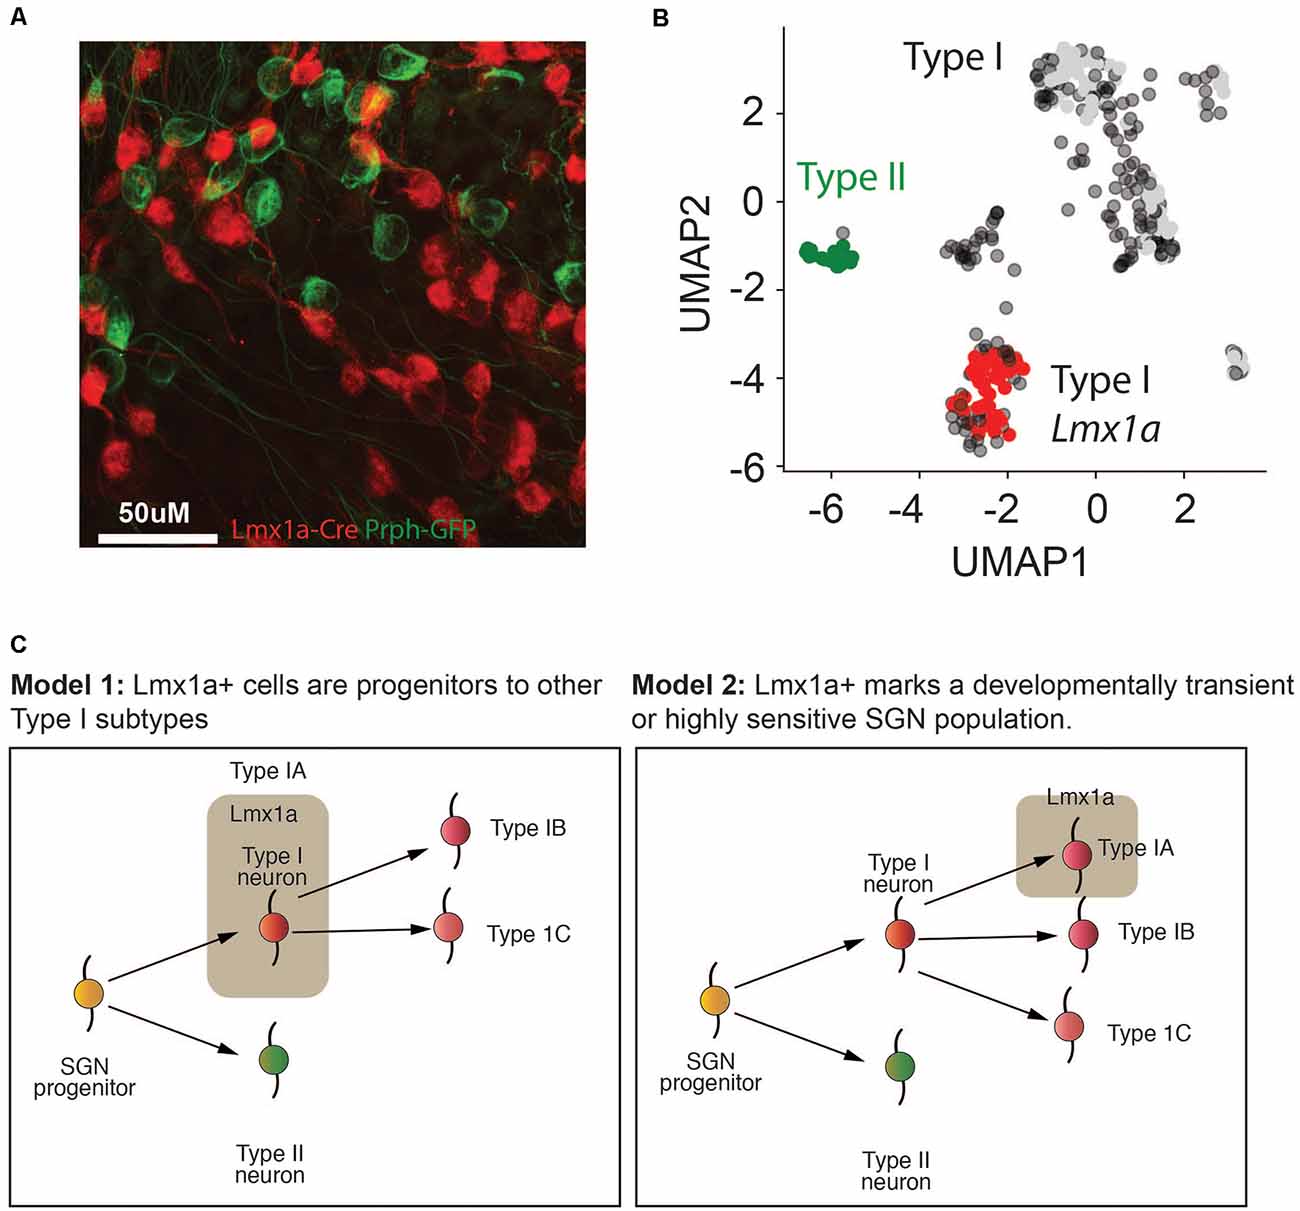
Figure 7. Lmx1a marks a distinct population of Type I SGNs. (A) Representative fluorescent image of Lmx1a-tdTomato x GFP-Prph at P8 from cryopreserved tissue. Magnification at 66×. (B) UMAP of P8 SGN Type I and Type II cells, colored according to the mouse model in (A). (C) Two putative models for how the different Type I SGN subtypes identified in this article might form in the cochlea. In model 1, the Type IA Lmx1a cells form an early progenitor population that is more immature and gives rise to the Type IB and Type IC cells, thereby explaining the age-related decline in these cells. In model 2, the Type IA Lmx1a cells are an independent subtype, but they are either more sensitive to stress at later ages, because they are more sensitive, or they are a developmentally transient population that begins to decline by P8.
Comparison to a Previously Published Dataset of P3 SGNs
We next sought to compare our study to the previously published results from whole-genome single-cell studies (Petitpré et al., 2018; Shrestha et al., 2018; Sun et al., 2018). Of these, two focused primarily on adult SGNs, and therefore were not suitable for comparison with our study, as neuronal properties are known to change from neonate to adult (Crozier and Davis, 2014). We thus chose to compare our work to the Pvalb-cre P3 neurons sequenced by Petitpré et al. (2018) although the two studies use different transgenic mouse models for sorting.
In both the adult and P3 data, Petitpré et al. (2018) found three subtypes of SGNs, characterized by their expression of Calb1, Runx1, and Calb2 (Type IA), Lypd1, Grm8 and Runx1 (Type IB) and, Trim54, Pcdh20, Rxrg and Calb2 (Type IC). We did not have any of these markers in our targeted panel, except Calb1, whose expression we compared (Supplementary Figures S7A,B). We see a more limited expression of Calb1, although it is enriched in Type IA (Lmx1a positive) neurons at P3, suggesting that these two subtypes may be similar (Supplementary Figure S7B). However, by P8, we observe the majority of the Calb1 expressing cells to be Type II cells (Supplementary Figure S7C).
We next wanted to determine if we could sort out our subtypes using the Petitpré et al.’s (2018) data. Thus, we selected the same 96 genes found in our panel, and projected and clustered the cells as before, but were not able to form the same clusters. We noted several differences between our data and Petitpré et al. (2018): (1) SGNI markers Zic1 and Zic5 were not expressed (Supplementary Figures S7D,E), although they are expressed in previous studies of bulk SGN tissues at P0 and P6 (Supplementary Figure S7F, Lu et al., 2011). (2) Two of our marker genes (Lmx1a and Mfap4) were not expressed (Supplementary Figures S7G,H). Fzd2 was lowly expressed by a few of their Type IC cells, but these did not cluster together in our analysis (Supplementary Figure S7F). Finally, Slc4a4 and Cacna1a were broadly expressed across all subtypes (Supplementary Figures S7J,K).
These discrepancies in the two datasets may suggest that transcripts like Lmx1a and Mfap4 may be low-abundance and therefore need to be pre-amplified to be detected. The limited detection of low-abundance transcripts is a known problem with both the 10× and Smart-seq2 pipelines, as these transcripts are not efficiently converted into cDNA. Thus, our dataset complements previous whole sequencing studies that set the outlines of SGN subtypes with the detection of these low abundance transcripts.
Discussion
In the mature cochlea, each IHC is innervated by multiple spiral ganglion neuron subtype-I (SGNI) cells that are morphologically and physiologically diverse. SGNIs possess complex endogenous firing properties that enable them to rapidly and faithfully transmit the wide dynamic range of sound information to the auditory brainstem (Taberner and Liberman, 2005; Davis and Liu, 2011). However, the factors that define the molecular and physiological diversity of SGNIs remain poorly understood. In this study, we identified marker genes that distinctively label different neonatal SGNI neuron subtypes by using a novel transgenic reporter mouse. This model was designed to distinguish the SGNI and II by their already known exclusive markers and allowed us to isolate pure populations of SGNI (Bhlhb5-cre × tdTomato) and SGNII (Peripherin-GFP) neurons by FACS. This step facilitated the construction of single-cell transcriptomes of SGNIs and SGNIIs neurons.
Using our single-cell dataset of SGNI cells from P3, P8 and P12 cochlea’s we identified three distinct populations: Type IA, marked by Lmx1a expression, Type IB marked by Slc4a4 and Type IC marked by Mfap4/Fzd2. Although, we observed all three subtypes of Type I SGNs at each developmental age, their relative sizes varied throughout development. This might be due to the differentiation of progenitor-like SGNs at earlier time points, or selective loss of certain subtypes that are more sensitive to stress (Figure 7C). Previous work has highlighted the existence of three electrophysiological categories whose proportions changed between early postnatal (P0-P3) and adult (Crozier and Davis, 2014). Intriguingly, although a previous study also found three subtypes of SGNs at postnatal day 3 (P3; Petitpré et al., 2018), we found little overlap between the marker genes defining the populations. In particular, Lmx1a expression was absent from this dataset. This discrepancy between the datasets may be due to the qPCR-based technique allowing pre-amplification of low abundance transcripts, the technique of cochlear dissociation, or the choice of transgenic mouse models. These differences, however, highlight the importance of using several orthogonal methods to investigate complex biological systems, as each technique can reveal unique and complementary features of the tissue.
Previous studies have established that type I SGNs have a variety of physiological phenotypes, corresponding to the so-called low, mid and high threshold neurons (Adamson et al., 2002; Taberner and Liberman, 2005; Liu et al., 2014; Kujawa and Liberman, 2015). We hypothesized that these identities were genetically encoded early in the development of the cochlea, before the onset of hearing. Our observation that we can sort out at least three distinct subsets of neurons at P3, based on 96-gene markers, is in line with this hypothesis. To characterize the physiological identity of these subtypes, we analyzed the expression of effectors that could define and maintain a particular SGNI subtype’s electrophysiological characteristics. We found both heterogeneities between SGNI subtypes (Figure 5) and also variable expression between SGNI cells of the same subtype.
A recent modeling study of spinal dorsal horn neurons showed that within a single neuron population, varying the densities of just two ion channels could reproduce five patterns of neuronal firing (Balachandar and Prescott, 2018). This work implied that subtle changes in ion channel expression can cause changes to cell physiology and that multiple combinations of ion channel densities may give similar firing patterns. This study, taken in combination with our findings in SGNs, suggests that while specific selector molecules may establish subtypes (IA, IB, IC), each subtype may represent a wide variety of excitation potentials. The heterogeneity in the expression of ion channels was also observed in the ganglion retinal cells and has been suggested to allow neuron populations to encode more information (Berry et al., 2018). The heterogeneity we observe in these ion channels may be due to cells originating in different tonotopic regions of the cochlea.
Among the three subtypes, the IA cells drew our attention the most, due to their expression of Lmx1a. The Lmx1 family of genes is known to act as selector molecules in a variety of different developmental contexts, including the development of the CNS (Chizhikov et al., 2010; Kee et al., 2017). Lmx1a is one of the early determinants of the fate of midbrain dopaminergic (mDA) neuronal generation (Chizhikov et al., 2010; Deng et al., 2011; Yan et al., 2011). Also, to its role development, it was recently shown to play an important role in maintaining adult mDA circuitry (Doucet-Beaupré et al., 2015). Lmx1a expression has long been seen in the mammalian inner ear and cochlea. Data from human studies reported that loss of function mutations lead to deafness in human populations (Schrauwen et al., 2018; Wesdorp et al., 2018). Furthermore, mutations in Lmx1a in mice lead to the improper establishment of the sensory-non-sensory regions of the ear, leading to altered ear morphology (Koo et al., 2009). Lmx1a has been suggested to be part of the transcription factor network, together with Gata3, that define SGN from the VGN population in early development stages (Appler and Goodrich, 2011). Besides, loss of Lmx1a also leads to an expansion of the vestibular ganglion region of the inner ear (Huang et al., 2018). Despite these reports, which establish the importance of Lmx1a in the inner ear, little attention has been paid to the expression of Lmx1a in the SGN population. Our single-cell high-throughput qPCR reveals a population of Lmx1a positive cells at P3, whose abundance decreased with age toward P12. We further validated the selective expression of Lmx1a in Type IA SGNs by generating a triple transgenic mouse model using Lxm1a-Cre X tdTomato and Prph-GFP. We observed that the subset of Type I SGNs was labeled in red, but not the Type II Prph-GFP.
To fully establish the bona fide role of IA neurons, future studies will have to assess the electrophysiological properties of these Lmx1a positive cells. From their expression of Snap25 and Grm5, we hypothesize that IA cells will represent neurons with a high spontaneous firing rate property. However, it is also possible that Lmx1a will not define a physiologically homogeneous subpopulation (i.e., only high or low threshold cells), as we observe that they have varied expression patterns of effectors genes such as Scn1a, Scn9a, Scn1b, and Grm5. These heterogeneous features will be better explored by deep-sequencing studies that can assess the full transcriptome of each IA SGN, and by electrophysiology experiments using specific blocking agents against each channel.
Taken together, our data provide several novel markers of Type I cells (Zic1, Pax6, and Nfix) and their subtypes (Lmx1a, Mfap4, Fzd2, Slc4a4, Cacna1a) and will enable future efforts to generate subtype-specific reporter lines. These tools will allow the study of the precise interplay of intrinsic genetic factors and extrinsic cues in defining SGNI diversity and their differential susceptibility to noise-induced hearing impairment.
Data Availability Statement
All datasets generated for this study are included in the article/Supplementary Material.
Ethics Statement
The animal study was reviewed and approved by Stanford University Institutional Animal Care and Use Committee.
Author Contributions
FG analyzed and visualized the data and wrote the manuscript. LDT collected the data. MM conceptualized and oversaw the study and data analysis and wrote the manuscript.
Funding
This work was supported by research grants from the National Institute in Deafness and other Communicative Disorders: R01 DC09590 (to MM) and the Mauritius Research Council: MR/S002510/1(to MM). FG is supported by the National Science Foundation Graduate Fellowship (GRFP).
Conflict of Interest
The authors declare that the research was conducted in the absence of any commercial or financial relationships that could be construed as a potential conflict of interest.
Acknowledgments
We sincerely thank Drs. Stefan Heller and Marta Milo for help with data analysis, and Dr. Walter Marcotti for helpful discussion. We also thank Dr. Kathleen J. Millen for generously providing the Lmx1a-cre mice and Dr. Theresa Zwingman for answering the many questions we had concerning these mice (Seattle Children’s Research Institute Center for Integrative Brain Research, The University of Washington). We thank Dr. Joseph P. Sarsero (Murdoch Children’s Research Institute, Australia) for sharing Peripherin-GFP mice with us and Dr. Lin Gan (Flaum Eye Institute, University of Rochester School of Medicine) for sharing Bhlhb5-cre line.
Supplementary Material
The Supplementary Material for this article can be found online at: https://www.frontiersin.org/articles/10.3389/fnmol.2020.00083/full#supplementary-material.
FIGURE S1 | (A) P8 cultured SGN neurons immunostained for TUJ1, in red. (B) P8 cultured SGN neurons stained with DAPI, in blue. (C) Quantification of total cultured cells after dissection as determined by DAPI and neurons determined by TUJ1 with and without Trypsin (n = 3 independent neuronal cultures). (D–H) Representative FACS gating strategy for separation of type I spiral ganglion neurons. Percentage (%) of cells in each gate (D–H) are shown in red. Cell debris was removed by plotting FSC and SSC to remove doublets and tissue clumps (D–F). Dead cells were removed by staining cells with Sytox Red (G). Finally, we gated tdTomato and GFP cells (H) and collected high tdTomato positive cells (outlined in the box).
FIGURE S2 | Spiral ganglion neurons single-cell multiplex qRT-PCR quality control. (A) B-actin (B) Gapdh, (C) percentage of genes expressed per cell. (D) Summary of P8 healthy cells, negative control, death, and doublet cells. (E) Cells were excluded based on B-actin and Gapdh expression, lower Log2Ex values indicate death cells or empty wells, and higher Log2Ex values indicate doublet. (F) Healthy cells expressed 52.2 ± 13.6% genes, death cells expressed 13.8 ± 4.3% genes, and doublet cells expressed 85.93 ± 0.7% genes of 96 genes analyzed in 96 cells.
FIGURE S3 | (A) UMAP projection of SGN cells, colored by the FACs gating, green for GFP-Prph, red for tdTomato. (B) UMAP projection of SGN cells at P8. Each cell is colored by the expression of genes enriched in Type I cells: Cadps2, Tmem178, and Cacna1a. The expression scale is given on the right. (C–F) UMAP projection of SGN cells at P8. Each cell is colored by the expression of (C) Bactin, (D) Map2, (E) Gapdh, and (F) Tubb3. The expression scale is given on the right. (G) UMAP projection of the Type SGNs at postnatal day 8. Each point represents a cell. Cells clustering to Type IA, IB, IC are colored in purple, blue, and red, respectively. Type II cells are colored in brown. The major gene markers for each subtype are given on the right. Two additional clusters were found (in yellow and green) but are not considered in this analysis as they did not have clear marker genes. Cells in gray were not clustered into any of the subgroups. Partially reproduced from Figure 3A for clarity. (H) Probability calculated by HDBSCAN that each cell belongs to the cluster assigned in (G). The color key is given to the right. (I) Clustering tree generated by the HDBSCAN algorithm to generate clusters in (G).
FIGURE S4 | (A) Principal components were analyzed, and PC1 to PC10 were plotted in X-axis with the respective variance in Y-axis. (B) K-means clustering was performed. The stable numbers of clusters were chosen based on Gap statistic. The dotted line indicates three stable clusters. (C) K-means clustering of PC1 and PC2 with pre-defined three clusters (K = 3). Black, red, and green dots represent cluster-1, cluster-2, and cluster-3 respectively. PC1 and PC2 are plotted in X-axis and Y-axis, respectively. (D) Cluster-1 specific genes are Cacna1a, Lmx1a, Nrp1, Snap25 and Timp2. The cluster-2 specific genes are Gria3, Sclc4a4, Cacna1a. The cluster-3 specific genes are Fzd2 and Mfap4. (E–J) representative genes in each cluster were plotted in PC1 and PC2. A color key (horizontal bar) with red, green, and gray colors represents high, low, and not detectable of genes expression respectively in cells.
FIGURE S5 | Hierarchical clustering of the same cells analyzed for Kmeans clustering. Three clusters labeled in black, red, and green.
FIGURE S6 | (A–C) Heat maps of gene expression in Type II, Type IA, Type IB, and Type IC Genes are grouped by transcription factors, signaling, physiology, and guidance and adhesion and (A) P3, (B) P8, (C) P12. Each square represents the average expression in each cell category. (D–E) Representative images of in situ hybridizations of Cacna1a at (D) P3 and (E) P8 in the cryopreserved whole cochlea. (F) Representative images of in situ hybridization for Nefm at P8 as a positive control.
FIGURE S7 | (A) UMAP projection of SGN cells at P3 from Peptitpre et al. Each point represents a cell, which is colored by the gene count of Calb1. The scale is given at the right. (B) UMAP projection of SGN cells at P3 from this study colored by expression of Calb1. (C) Violin plots of the expression level of Calb1 at P3, P8, and P12. The different subtypes are colored and indicated on the top. (D–E) Data presented as in (A) for Zic1 and Zic5. (F) Microarray values for Zic1 and Zic5 at P0 and P6 in bulk SGN samples taken from Lu et al. (2011). (G–K) Data presented as in (A) for Lmx1a, Mfap4, Fzd2, Slc4a4 and Cacna1a.
TABLE S1 | Raw data + clustering.
References
Adamson, C. L., Reid, M. A., and Davis, R. L. (2002). Opposite actions of brain-derived neurotrophic factor and neurotrophin-3 on firing features and ion channel composition of murine spiral ganglion neurons. J. Neurosci. 22, 1385–1396. doi: 10.1523/JNEUROSCI.22-04-01385.2002
Appler, J. M., and Goodrich, L. V. (2011). Connecting the ear to the brain: molecular mechanisms of auditory circuit assembly. Prog. Neurobiol. 93, 488–508. doi: 10.1016/j.pneurobio.2011.01.004
Ayoob, J. C., Terman, J. R., and Kolodkin, A. L. (2006). Drosophila plexin B is a Sema-2a receptor required for axon guidance. Development 133, 2125–2135. doi: 10.1242/dev.02380
Balachandar, A., and Prescott, S. A. (2018). Origin of heterogeneous spiking patterns from continuously distributed ion channel densities: a computational study in spinal dorsal horn neurons. J. Physiol. 596, 1681–1697. doi: 10.1113/jp275240
Bas, E., Goncalves, S., Adams, M., Dinh, C., Bas, J. M., Van De Water, T. R., et al. (2015). Spiral ganglion cells and macrophages initiate neuro-inflammation and scarring following cochlear implantation. Front. Cell. Neurosci. 9:303. doi: 10.3389/fncel.2015.00303
Becht, E., McInnes, L., Healy, J., Dutertre, C.-A., Kwok, I. W. H., Ng, L. G., et al. (2019). Dimensionality reduction for visualizing single-cell data using UMAP. Nat. Biotechnol. 37, 38–44. doi: 10.1038/nbt.4314
Berglund, A. M., and Ryugo, D. K. (1987). Hair cell innervation by spiral ganglion neurons in the mouse. J. Comp. Neurol. 255, 560–570. doi: 10.1002/cne.902550408
Berry, M. J. II., Lebois, F., Ziskind, A., and da Silveira, R. A. (2018). Functional diversity in the retina improves the population code. Neural Comput. 31, 270–311. doi: 10.1162/neco_a_01158
Browne, L., Smith, K. E., and Jagger, D. J. (2017). Identification of persistent and resurgent sodium currents in spiral ganglion neurons cultured from the mouse cochlea. eNeuro 4:ENEURO.0303–17.2017. doi: 10.1523/eneuro.0303-17.2017
Cariboni, A., Davidson, K., Dozio, E., Memi, F., Schwarz, Q., Stossi, F., et al. (2011). VEGF signalling controls GnRH neuron survival via NRP1 independently of KDR and blood vessels. Development 138, 3723–3733. doi: 10.1242/dev.063362
Chen, X., Yuan, L.-L., Zhao, C., Birnbaum, S. G., Frick, A., Jung, W. E., et al. (2006). Deletion of Kv4.2 gene eliminates dendritic A-type K+ current and enhances induction of long-term potentiation in hippocampal CA1 pyramidal neurons. J. Neurosci. 26, 12143–12151. doi: 10.1523/JNEUROSCI.2667-06.2006
Chizhikov, V. V., Lindgren, A. G., Mishima, Y., Roberts, R. W., Aldinger, K. A., Miesegaes, G. R., et al. (2010). Lmx1a regulates fates and location of cells originating from the cerebellar rhombic lip and telencephalic cortical hem. Proc. Natl. Acad. Sci. U S A 107, 10725–10730. doi: 10.1073/pnas.0910786107
Chizhikov, V. V., and Millen, K. J. (2004). Control of roof plate formation by Lmx1a in the developing spinal cord. Development 131, 2693–2705. doi: 10.1242/dev.01139
Crozier, R. A., and Davis, R. L. (2014). Unmasking of spiral ganglion neuron firing dynamics by membrane potential and neurotrophin-3. J. Neurosci. 34, 9688–9702. doi: 10.1523/JNEUROSCI.4552-13.2014
Davis, R. L., and Liu, Q. (2011). Complex primary afferents: what the distribution of electrophysiologically-relevant phenotypes within the spiral ganglion tells us about peripheral neural coding. Hear. Res. 276, 34–43. doi: 10.1016/j.heares.2011.01.014
Deng, Q., Andersson, E., Hedlund, E., Alekseenko, Z., Coppola, E., Panman, L., et al. (2011). Specific and integrated roles of Lmx1a, Lmx1b and Phox2a in ventral midbrain development. Development 138, 3399–3408. doi: 10.1242/dev.065482
Dinour, D., Chang, M.-H., Satoh, J., Smith, B. L., Angle, N., Knecht, A., et al. (2004). A novel missense mutation in the sodium bicarbonate cotransporter (NBCe1/SLC4A4) causes proximal tubular acidosis and glaucoma through ion transport defects. J. Biol. Chem. 279, 52238–52246. doi: 10.1074/jbc.m406591200
Doucet-Beaupré, H., Ang, S.-L., and Lévesque, M. (2015). Cell fate determination, neuronal maintenance and disease state: The emerging role of transcription factors Lmx1a and Lmx1b. FEBS Lett. 589, 3727–3738. doi: 10.1016/j.febslet.2015.10.020
Durruthy-Durruthy, R., Gottlieb, A., Hartman, B. H., Waldhaus, J., Laske, R. D., Altman, R., et al. (2014). Reconstruction of the mouse otocyst and early neuroblast lineage at single-cell resolution. Cell 157, 964–978. doi: 10.1016/j.cell.2014.03.036
Fetoni, A. R., Lattanzi, W., Eramo, S. L. M., Barba, M., Paciello, F., Moriconi, C., et al. (2014). Grafting and early expression of growth factors from adipose-derived stem cells transplanted into the cochlea, in a guinea pig model of acoustic trauma. Front. Cell. Neurosci. 8:334. doi: 10.3389/fncel.2014.00334
Froud, K. E., Wong, A. C. Y., Cederholm, J. M. E., Klugmann, M., Sandow, S. L., Julien, J.-P., et al. (2015). Type II spiral ganglion afferent neurons drive medial olivocochlear reflex suppression of the cochlear amplifier. Nat. Commun. 6:7115. doi: 10.1038/ncomms8115
Fryatt, A. G., Vial, C., Mulheran, M., Gunthorpe, M. J., and Grubb, B. D. (2009). Voltage-gated sodium channel expression in rat spiral ganglion neurons. Mol. Cell. Neurosci. 42, 399–407. doi: 10.1016/j.mcn.2009.09.001
Funa, K., and Sasahara, M. (2014). The roles of PDGF in development and during neurogenesis in the normal and diseased nervous system. J. Neuroimmune Pharmacol. 9, 168–181. doi: 10.1007/s11481-013-9479-z
Goetz, J. J., Farris, C., Chowdhury, R., and Trimarchi, J. M. (2014). Making of a retinal cell: insights into retinal cell-fate determination. Int. Rev. Cell Mol. Biol. 308, 273–321. doi: 10.1016/B978-0-12-800097-7.00007-5
Granados-Fuentes, D., Norris, A. J., Carrasquillo, Y., Nerbonne, J. M., and Herzog, E. D. (2012). IA channels encoded by Kv1.4 and Kv4.2 regulate neuronal firing in the suprachiasmatic nucleus and circadian rhythms in locomotor activity. J. Neurosci. 32, 10045–10052. doi: 10.1523/JNEUROSCI.0174-12.2012
Guaiquil, V. H., Pan, Z., Karagianni, N., Fukuoka, S., Alegre, G., and Rosenblatt, M. I. (2014). VEGF-B selectively regenerates injured peripheral neurons and restores sensory and trophic functions. Proc. Natl. Acad. Sci. U S A 111, 17272–17277. doi: 10.1073/pnas.1407227111
Hafidi, A., Després, G., and Romand, R. (1993). Ontogenesis of type II spiral ganglion neurons during development: peripherin immunohistochemistry. Int. J. Dev. Neurosci. 11, 507–512. doi: 10.1016/0736-5748(93)90024-8
Herholt, A., Brankatschk, B., Kannaiyan, N., Papiol, S., Wichert, S. P., Wehr, M. C., et al. (2018). Pathway sensor-based functional genomics screening identifies modulators of neuronal activity. Sci. Rep. 8:17597. doi: 10.1038/s41598-018-36008-9
Hu, H.-J., Alter, B. J., Carrasquillo, Y., Qiu, C.-S., and Gereau, R. W. (2007). Metabotropic glutamate receptor 5 modulates nociceptive plasticity via extracellular signal-regulated kinase-Kv4.2 signaling in spinal cord dorsal horn neurons. J. Neurosci. 27, 13181–13191. doi: 10.1523/JNEUROSCI.0269-07.2007
Huang, Y., Hill, J., Yatteau, A., Wong, L., Jiang, T., Petrovic, J., et al. (2018). Reciprocal negative regulation between lmx1a and Lmo4 is required for inner ear formation. J. Neurosci. 38, 5429–5440. doi: 10.1523/JNEUROSCI.2484-17.2018
Huang, L., Hu, F., Feng, L., Luo, X.-J., Liang, G., Zeng, X.-Y., et al. (2014). Bhlhb5 is required for the subtype development of retinal amacrine and bipolar cells in mice. Dev. Dyn. 243, 279–289. doi: 10.1002/dvdy.24067
Jun, K., Piedras-Rentería, E. S., Smith, S. M., Wheeler, D. B., Lee, S. B., Lee, T. G., et al. (1999). Ablation of P/Q-type Ca2+ channel currents, altered synaptic transmission, and progressive ataxia in mice lacking the α1A-subunit. Proc. Natl. Acad. Sci. U S A 96, 15245–15250. doi: 10.1073/pnas.96.26.15245
Jung, J. S., Zhang, K. D., Wang, Z., McMurray, M., Tkaczuk, A., Ogawa, Y., et al. (2019). Semaphorin-5B controls spiral ganglion neuron branch refinement during development. J. Neurosci. 39, 6425–6438. doi: 10.1523/JNEUROSCI.0113-19.2019
Katayama, K., Imai, F., Suto, F., and Yoshida, Y. (2013). Deletion of Sema3a or plexinA1/plexinA3 causes defects in sensory afferent projections of statoacoustic ganglion neurons. PLoS One 8:e72512. doi: 10.1371/journal.pone.0072512
Kee, N., Volakakis, N., Kirkeby, A., Dahl, L., Storvall, H., Nolbrant, S., et al. (2017). Single-cell analysis reveals a close relationship between differentiating dopamine and subthalamic nucleus neuronal lineages. Cell Stem Cell 20, 29–40. doi: 10.1016/j.stem.2016.10.003
Kim, Y.-H., and Holt, J. R. (2013). Functional contributions of HCN channels in the primary auditory neurons of the mouse inner ear. J. Gen. Physiol. 142, 207–223. doi: 10.1085/jgp.201311019
Kok, C., Kennerson, M. L., Spring, P. J., Ing, A. J., Pollard, J. D., and Nicholson, G. A. (2003). A locus for hereditary sensory neuropathy with cough and gastroesophageal reflux on chromosome 3p22–p24. Am. J. Hum. Genet. 73, 632–637. doi: 10.1086/377591
Konířová, J., Oltová, J., Corlett, A., Kopycińska, J., Kolář, M., Bartněk, P., et al. (2017). Modulated DISP3/PTCHD2 expression influences neural stem cell fate decisions. Sci. Rep. 7:41597. doi: 10.1038/srep41597
Koo, S. K., Hill, J. K., Hwang, C. H., Lin, Z., Millen, K. J., and Wu, D. K. (2009). Lmx1a maintains proper neurogenic, sensory, and nonsensory domains in the mammalian inner ear. Dev. Biol. 333, 14–25. doi: 10.1016/j.ydbio.2009.06.016
Kujawa, S. G., and Liberman, M. C. (2015). Synaptopathy in the noise-exposed and aging cochlea: primary neural degeneration in acquired sensorineural hearing loss. Hear. Res. 330, 191–199. doi: 10.1016/j.heares.2015.02.009
Liu, Q., Lee, E., and Davis, R. L. (2014). Heterogeneous intrinsic excitability of murine spiral ganglion neurons is determined by Kv1 and HCN channels. Neuroscience 257, 96–110. doi: 10.1016/j.neuroscience.2013.10.065
Lu, C. C., Appler, J. M., Houseman, E. A., and Goodrich, L. V. (2011). Developmental profiling of spiral ganglion neurons reveals insights into auditory circuit assembly. J. Neurosci. 31, 10903–10918. doi: 10.1523/JNEUROSCI.2358-11.2011
Lv, P., Kim, H. J., Lee, J.-H., Sihn, C.-R., Gharaie, S. F., Mousavi-Nik, A., et al. (2014). Genetic, cellular and functional evidence for Ca2+ inflow through Cav1.2 and Cav1.3 channels in murine spiral ganglion neurons. J. Neurosci. 34, 7383–7393. doi: 10.1523/JNEUROSCI.5416-13.2014
Lv, P., Sihn, C.-R., Wang, W., Shen, H., Kim, H. J., Rocha-Sanchez, S. M., et al. (2012). Posthearing Ca2+ currents and their roles in shaping the different modes of firing of spiral ganglion neurons. J. Neurosci. 32, 16314–16330. doi: 10.1523/JNEUROSCI.2097-12.2012
McInnes, L., Healy, J., and Astels, S. (2017). hdbscan: hierarchical density based clustering. J. Open Source Softw. 2:205. doi: 10.21105/joss.00205
McInnes, L., Healy, J., and Melville, J. (2018). UMAP: uniform manifold approximation and projection for dimension reduction. ArXiv180203426 Cs Stat. Available online at: http://arxiv.org/abs/1802.03426. Accessed September 24, 2019.
McLenachan, S., Goldshmit, Y., Fowler, K. J., Voullaire, L., Holloway, T. P., Turnley, A. M., et al. (2008). Transgenic mice expressing the Peripherin-EGFP genomic reporter display intrinsic peripheral nervous system fluorescence. Transgenic Res. 17, 1103–1116. doi: 10.1007/s11248-008-9210-7
Mendus, D., Sundaresan, S., Grillet, N., Wangsawihardja, F., Leu, R., Müller, U., et al. (2014). Thrombospondins 1 and 2 are important for afferent synapse formation and function in the inner ear. Eur. J. Neurosci. 39, 1256–1267. doi: 10.1111/ejn.12486
Millonig, J. H., Millen, K. J., and Hatten, M. E. (2000). The mouse Dreher gene Lmx1a controls formation of the roof plate in the vertebrate CNS. Nature 403, 764–769. doi: 10.1038/35001573
Mo, Z.-L., and Davis, R. L. (1997). Heterogeneous voltage dependence of inward rectifier currents in spiral ganglion neurons. J. Neurophysiol. 78, 3019–3027. doi: 10.1152/jn.1997.78.6.3019
Munnamalai, V., and Fekete, D. M. (2013). Wnt signaling during cochlear development. Semin. Cell Dev. Biol. 24, 480–489. doi: 10.1016/j.semcdb.2013.03.008
Nayagam, B. A., Muniak, M. A., and Ryugo, D. K. (2011). The spiral ganglion: connecting the peripheral and central auditory systems. Hear. Res. 278, 2–20. doi: 10.1016/j.heares.2011.04.003
Nichols, D. H., Pauley, S., Jahan, I., Beisel, K. W., Millen, K. J., and Fritzsch, B. (2008). Lmx1a is required for segregation of sensory epithelia and normal ear histogenesis and morphogenesis. Cell Tissue Res. 334, 339–358. doi: 10.1007/s00441-008-0709-2
Pagani, R., Song, M., McEnery, M., Qin, N., Tsien, R. W., Toro, L., et al. (2004). Differential expression of α1 and β subunits of voltage dependent Ca2+ channel at the neuromuscular junction of normal and p/q Ca2+ channel knockout mouse. Neuroscience 123, 75–85. doi: 10.1016/j.neuroscience.2003.09.019
Paz, J. T., Bryant, A. S., Peng, K., Fenno, L., Yizhar, O., Frankel, W. N., et al. (2011). A new mode of corticothalamic transmission revealed in the Gria4−/− model of absence epilepsy. Nat. Neurosci. 14, 1167–1173. doi: 10.1038/nn.2896
Petitpré, C., Wu, H., Sharma, A., Tokarska, A., Fontanet, P., Wang, Y., et al. (2018). Neuronal heterogeneity and stereotyped connectivity in the auditory afferent system. Nat. Commun. 9:3691. doi: 10.1038/s41467-018-06033-3
Qian, D., Jones, C., Rzadzinska, A., Mark, S., Zhang, X., Steel, K. P., et al. (2007). Wnt5a functions in planar cell polarity regulation in mice. Dev. Biol. 306, 121–133. doi: 10.1016/j.ydbio.2007.03.011
Rétaux, S., and Bachy, I. (2002). A short history of LIM domains (1993–2002): from protein interaction to degradation. Mol. Neurobiol. 26, 269–281. doi: 10.1385/mn:26:2-3:269
Royeck, M., Horstmann, M.-T., Remy, S., Reitze, M., Yaari, Y., and Beck, H. (2008). Role of axonal NaV1.6 sodium channels in action potential initiation of CA1 pyramidal neurons. J. Neurophysiol. 100, 2361–2380. doi: 10.1152/jn.90332.2008
Sadakata, T., Mizoguchi, A., Sato, Y., Katoh-Semba, R., Fukuda, M., Mikoshiba, K., et al. (2004). The secretory granule-associated protein CAPS2 regulates neurotrophin release and cell survival. J. Neurosci. 24, 43–52. doi: 10.1523/JNEUROSCI.2528-03.2004
Sadakata, T., Shinoda, Y., Sato, A., Iguchi, H., Ishii, C., Matsuo, M., et al. (2013). Mouse models of mutations and variations in autism spectrum disorder-associated genes: mice expressing Caps2/Cadps2 copy number and alternative splicing variants. Int. J. Environ. Res. Public Health 10, 6335–6353. doi: 10.3390/ijerph10126335
Sadakata, T., Washida, M., Iwayama, Y., Shoji, S., Sato, Y., Ohkura, T., et al. (2007). Autistic-like phenotypes in Cadps2-knockout mice and aberrant CADPS2 splicing in autistic patients. J. Clin. Invest. 117, 931–943. doi: 10.1172/JCI29031
Schimmang, T., Tan, J., Müller, M., Zimmermann, U., Rohbock, K., Köpschall, I., et al. (2003). Lack of Bdnf and TrkB signalling in the postnatal cochlea leads to a spatial reshaping of innervation along the tonotopic axis and hearing loss. Development 130, 4741–4750. doi: 10.1242/dev.00676
Schrauwen, I., Chakchouk, I., Liaqat, K., Jan, A., Nasir, A., Hussain, S., et al. (2018). A variant in LMX1A causes autosomal recessive severe-to-profound hearing impairment. Hum. Genet. 137, 471–478. doi: 10.1007/s00439-018-1899-7
Schwander, M., Sczaniecka, A., Grillet, N., Bailey, J. S., Avenarius, M., Najmabadi, H., et al. (2007). A forward genetics screen in mice identifies recessive deafness traits and reveals that pejvakin is essential for outer hair cell function. J. Neurosci. 27, 2163–2175. doi: 10.1523/JNEUROSCI.4975-06.2007
Shibata, R., Nakahira, K., Shibasaki, K., Wakazono, Y., Imoto, K., and Ikenaka, K. (2000). A-type K+ current mediated by the Kv4 channel regulates the generation of action potential in developing cerebellar granule cells. J. Neurosci. 20, 4145–4155. doi: 10.1523/JNEUROSCI.20-11-04145.2000
Shinoda, Y., Sadakata, T., Nakao, K., Katoh-Semba, R., Kinameri, E., Furuya, A., et al. (2011). Calcium-dependent activator protein for secretion 2 (CAPS2) promotes BDNF secretion and is critical for the development of GABAergic interneuron network. Proc. Natl. Acad. Sci. U S A 108, 373–378. doi: 10.1073/pnas.1012220108
Shrestha, B. R., Chia, C., Wu, L., Kujawa, S. G., Liberman, M. C., and Goodrich, L. V. (2018). Sensory neuron diversity in the inner ear is shaped by activity. Cell 174, 1229.e17–1246.e17. doi: 10.1016/j.cell.2018.07.007
Stephani, F., Scheuer, V., Eckrich, T., Blum, K., Wang, W., Obermair, G. J., et al. (2019). Deletion of the Ca2+ channel subunit α2δ3 differentially affects Cav2.1 and Cav2.2 currents in cultured spiral ganglion neurons before and after the onset of hearing. Front. Cell. Neurosci. 13:278. doi: 10.3389/fncel.2019.00278
Sun, S., Babola, T., Pregernig, G., So, K. S., Nguyen, M., Su, S.-S. M., et al. (2018). Hair cell mechanotransduction regulates spontaneous activity and spiral ganglion subtype specification in the auditory system. Cell 174, 1247.e15–1263.e15. doi: 10.1016/j.cell.2018.07.008
Taberner, A. M., and Liberman, M. C. (2005). Response properties of single auditory nerve fibers in the mouse. J. Neurophysiol. 93, 557–569. doi: 10.1152/jn.00574.2004
Tibshirani, R., Walther, G., and Hastie, T. (2001). Estimating the number of clusters in a data set via the gap statistic. J. R. Stat. Soc. Ser. B Stat. Methodol. 63, 411–423. doi: 10.1111/1467-9868.00293
Waldhaus, J., Durruthy-Durruthy, R., and Heller, S. (2015). Quantitative high-resolution cellular map of the organ of corti. Cell Rep. 11, 1385–1399. doi: 10.1016/j.celrep.2015.04.062
Wang, F., Flanagan, J., Su, N., Wang, L.-C., Bui, S., Nielson, A., et al. (2012). RNAscope: a novel in situ RNA analysis platform for formalin-fixed, paraffin-embedded tissues. J. Mol. Diagn. 14, 22–29. doi: 10.1016/j.jmoldx.2011.08.002
Weiss, N., and Zamponi, G. W. (2013). Control of low-threshold exocytosis by T-type calcium channels. Biochim. Biophys. Acta 1828, 1579–1586. doi: 10.1016/j.bbamem.2012.07.031
Welker, C., and Woolsey, T. A. (1974). Structure of layer IV in the somatosensory neocortex of the rat: description and comparison with the mouse. J. Comp. Neurol. 158, 437–453. doi: 10.1002/cne.901580405
Wesdorp, M., de Koning Gans, P. A. M., Schraders, M., Oostrik, J., Huynen, M. A., Venselaar, H., et al. (2018). Heterozygous missense variants of LMX1A lead to nonsyndromic hearing impairment and vestibular dysfunction. Hum. Genet. 137, 389–400. doi: 10.1007/s00439-018-1880-5
Keywords: type I spiral ganglion neurons, single-cell transcriptome, Lmx1a, development, cochlea
Citation: Grandi FC, De Tomasi L and Mustapha M (2020) Single-Cell RNA Analysis of Type I Spiral Ganglion Neurons Reveals a Lmx1a Population in the Cochlea. Front. Mol. Neurosci. 13:83. doi: 10.3389/fnmol.2020.00083
Received: 06 March 2020; Accepted: 24 April 2020;
Published: 25 May 2020.
Edited by:
Jiangteng Lu, Shanghai Jiao Tong University, ChinaReviewed by:
Agnieszka J. Szczepek, Charité–Universitätsmedizin Berlin, GermanySangyong Jung, Singapore Bioimaging Consortium (A*STAR), Singapore
Copyright © 2020 Grandi, De Tomasi and Mustapha. This is an open-access article distributed under the terms of the Creative Commons Attribution License (CC BY). The use, distribution or reproduction in other forums is permitted, provided the original author(s) and the copyright owner(s) are credited and that the original publication in this journal is cited, in accordance with accepted academic practice. No use, distribution or reproduction is permitted which does not comply with these terms.
*Correspondence: Mirna Mustapha, mirna.m@sheffield.ac.uk