Identifying Drivers of Seasonality in Lena River Biogeochemistry and Dissolved Organic Matter Fluxes
 Bennet Juhls1*
  Colin A. Stedmon2
  Anne Morgenstern3
  Hanno Meyer3
  Jens Hölemann4
  Birgit Heim3 Vasily Povazhnyi5
  Pier P. Overduin3
- 1Department of Earth Sciences, Institute for Space Sciences, Freie Universität Berlin, Berlin, Germany
- 2National Institute of Aquatic Resources, Technical University of Denmark, Copenhagen, Denmark
- 3Helmholtz Centre for Polar and Marine Research, Alfred Wegener Institute, Potsdam, Germany
- 4Helmholtz Centre for Polar and Marine Research, Alfred Wegener Institute, Bremerhaven, Germany
- 5Otto Schmidt Laboratory for Polar and Marine Research, Arctic and Antarctic Research Institute, Saint Petersburg, Russia
Warming air temperatures, shifting hydrological regimes and accelerating permafrost thaw in the catchments of the Arctic rivers is affecting their biogeochemistry. Arctic river monitoring is necessary to observe changes in the mobilization of dissolved organic matter (DOM) from permafrost. The Lena River is the second largest Arctic river and 71% of its catchment is continuous permafrost. Biogeochemical parameters, including temperature, electrical conductivity (EC), stable water isotopes, dissolved organic carbon (DOC) and absorption by colored dissolved organic matter (aCDOM) have been measured as part of a new high-frequency sampling program in the central Lena River Delta. The results show strong seasonal variations of all biogeochemical parameters that generally follow seasonal patterns of the hydrograph. Optical indices of DOM indicate a trend of decreasing aromaticity and molecular weight from spring to winter. High-frequency sampling improved our estimated annual fluvial flux of annual dissolved organic carbon flux (6.79 Tg C). EC and stable isotope data were used to distinguish three different source water types which explain most of the seasonal variation in the biogeochemistry of the Lena River. These water types match signatures of (1) melt water, (2) rain water, and (3) subsurface water. Melt water and rain water accounted for 84% of the discharge flux and 86% of the DOC flux. The optical properties of melt water DOM were characteristic of fresh organic matter. In contrast, the optical properties of DOM in subsurface water revealed lower aromaticity and lower molecular weights, which indicate a shift toward an older organic matter source mobilized from deeper soil horizons or permafrost deposits. The first year of this new sampling program sets a new baseline for flux calculations of dissolved matter and has enabled the identification and characterization of water types that drive the seasonality of the Lena River water properties.
Introduction
The current warming of the Siberian Arctic (Richter-Menge et al., 2019) is causing intense changes in atmospheric forcing, precipitation, subsurface water storage and runoff from rivers to the Arctic Ocean (Yang et al., 2002; Velicogna et al., 2012; Bintanja and Selten, 2014; Niederdrenk et al., 2016). A number of studies report an increase of runoff from the Eurasian Arctic Rivers (Peterson, 2002; McClelland et al., 2006; Shiklomanov and Lammers, 2009). Of all Arctic Rivers, the Lena River is the second largest in annual discharge. Its annual discharge increased by 15.6% since 1936 (Ye et al., 2003; Shiklomanov, 2010), which may primarily be due to a winter discharge increase by 93% (Tananaev et al., 2016). Furthermore, increasing Lena River temperature (Yang et al., 2002; Liu et al., 2005) leads to more intense thermal erosion along the river shores and the coast of the Laptev Sea (Aré, 1988; Bareiss and Görgen, 2005), warms the surface waters of the central Laptev Sea, and accelerates thawing of newly formed subsea permafrost (Angelopoulos et al., 2019). A change of the river discharge, as well as changes of temperature and biogeochemical properties of river water, can strongly affect the physical state of the Arctic Ocean and marine ecosystems, especially in coastal waters. Increased export of dark, organic-rich river water leads to stronger absorption of sunlight and an increased heat flux, which can, in turn, contribute to sea ice decline (Pegau, 2002; Hill, 2008).
The carbon reservoirs of Arctic river watersheds are currently in transition. Thawing permafrost is releasing previously stored carbon (Schuur et al., 2015; Plaza et al., 2019; Turetsky et al., 2019) and increasing seasonal growth of vegetation (Schuur et al., 2009; Keuper et al., 2012). Both of these processes will increase the particulate and dissolved organic matter flux into rivers and the fluvial flux to coastal waters (Frey and Smith, 2005). Hydrological flow paths will shift toward increased groundwater flow and affect the source and composition of dissolved organic matter (DOM) (Amon et al., 2012). While particulate material is mostly deposited in shelf sea sediments to become mineralised or buried (Charkin et al., 2011; Wegner et al., 2013), dissolved organic matter is exported offshore into the open Arctic Ocean (i.e., Juhls et al., 2019) and approximately 50% is thought to be exported onwards to the Atlantic (Granskog et al., 2012). Most of the DOM transported by the Lena River originates from leaching of surface soils of dominantly boreal forest vegetation (Amon et al., 2012; Kaiser et al., 2017). However, the effect of ongoing permafrost thaw on hydrological pathways will affect DOM fluxes (Freeman et al., 2001; Frey and Smith, 2005). In addition to the amount of DOM, its composition, source and age in the Lena River are expected to change (Amon et al., 2012; Walker et al., 2013; Mann et al., 2016; Wild et al., 2019).
Initiation of the pan-Arctic River sampling programs PARTNERS (2003–2007), Student Partners (2004-2009) and ArcticGRO (since 2009), have provided invaluable insights into the quantitative and qualitative properties of dissolved and particulate matter exported into the Arctic Ocean (Raymond et al., 2007; Holmes et al., 2008; Stedmon et al., 2011; Amon et al., 2012; Mann et al., 2016). Results of PARTNERS and ArcticGRO (Raymond et al., 2007) show that the Lena River contributes 20–29% of the total circumpolar fluvial dissolved organic carbon (DOC) export to the Arctic Ocean. However, reported estimates of annual Lena River DOC fluxes span a wide range between 3.6 Tg C (Gordeev and Kravchishina, 2009) and 7.67 Tg C (Kicklighter et al., 2013). This is likely because the calculation of annual flux is based on a few water samples per year, which are usually taken during open water season (Raymond et al., 2007; Stedmon et al., 2011; Holmes et al., 2012). Such estimates are susceptible to systematic biases: limited sampling can miss seasonal peaks of DOC concentration and lead to subsequent underestimation of the DOC flux (Jollymore et al., 2012). Furthermore, samples from the Lena River are mostly taken in Zhigansk, which is located ~800 km upstream of the river mouth (Figure 1). Little is known about DOM transformation, mineralization and release to the atmosphere on the way from Zhigansk to the river mouth (Amon et al., 2012). In order to identify a trend in DOC flux, it is crucial to reduce uncertainty in the calculated annual flux to below the interannual variability. While most research attention has focused on potential long-term trends of river DOC export (Kicklighter et al., 2013; Tank et al., 2016), seasonal variations of ice break-up and freeze-up timing and the associated discharge, material load and biogeochemistry are also affected by the changing climate and require research attention. Earlier spring ice break-up and later freeze-up in fall result in longer open water and shorter winter flow periods and will have an impact on the annual organic matter flux. Monitoring river water biogeochemistry may provide insights into the progress of this change, since the river water chemistry, measured near its mouth, integrates the changes occurring in the catchment as a whole. DOM fluxes and composition can be expected to change and this will also ultimately influence the fate of terrestrial carbon in the Arctic, including that carbon stored in shelf sediments, mineralised in the Arctic, and exported to the north Atlantic Ocean.
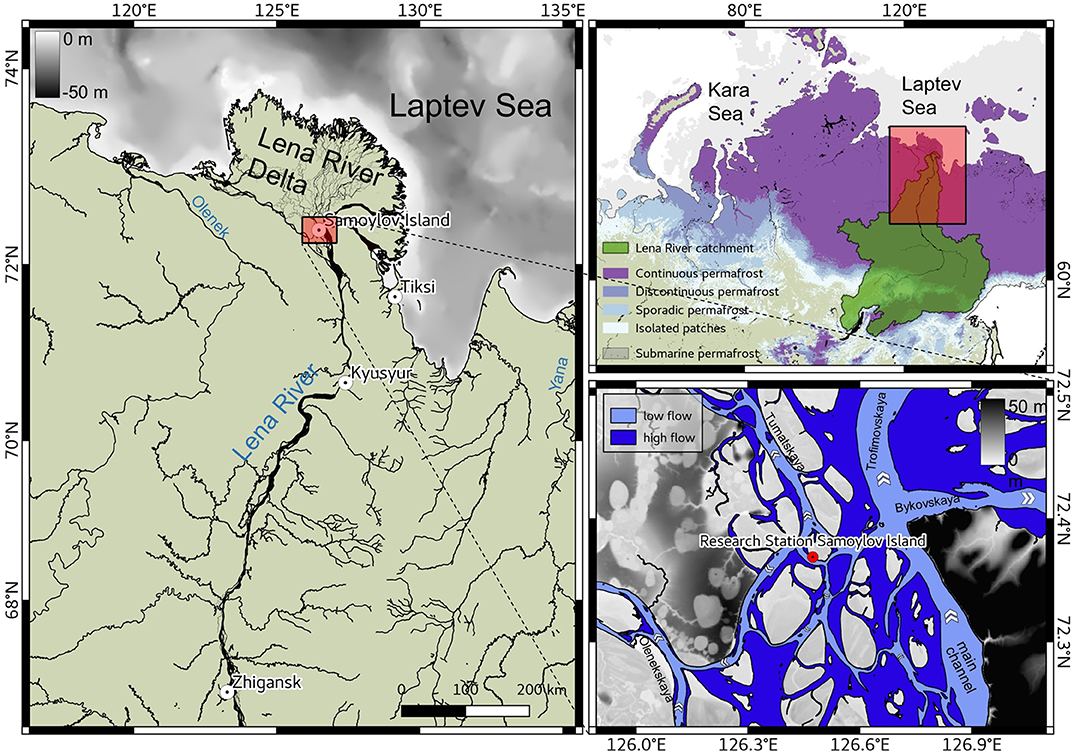
Figure 1. Lena River Delta region. The upper right panel shows an overview map of the study area with permafrost zones (Obu et al., 2019; Overduin et al., 2019). The left panel shows the northern part of the Lena River catchment with the Lena River Delta at the coast of the Laptev Sea. The lower right panel the central Lena River Delta with the location of the Research Station Samoylov Island and the Lena River channels (blue) and flow directions; DEM is based on ArcticDEM (Porter et al., 2018). Dark blue indicates Lena River channels during high flow right after spring ice break-up and light blue indicates Lena River channels during low flow in late summer (based on Sentinel 2 imagery1).
To accurately capture short-term variability and understand how changing climate influences in-river processes that affect organic matter quality and its function in the fluvial ecosystem, it is necessary to monitor water constituents with a high temporal resolution and throughout the whole season (including both open water and ice-covered periods). To characterize fluxes from land to sea, this should be done as close as possible to the river mouth. Such sampling, carried out over multiple years, can enable prediction of future responses of river flux to projected change. The Research Station Samoylov Island provides an opportunity to meet these criteria in the central Lena River Delta as it serves as the basis for regular, frequent and year-round sampling for major biogeochemical parameters. The goal of this study is to better understand and decipher seasonal variations of hydrochemical characteristics and organic matter and its optical properties of the Lena River. We aim to identify how changing water sources drive seasonal changes in fluvial biogeochemistry by putting such a sampling program into place over 1 year at the Research Station Samoylov Island. With this, we provide a basis for future trend analyses and remote sensing studies that may be used to upscale observations from the hydrographic point scale.
Materials and Methods
Study Area and Sample Collection
The Lena watershed area (2.61 × 10⁶ km2) extends ~2,400 km from north to south and is underlain by all types of permafrost: continuous (70.5%), discontinuous (10.6%), sporadic (6.0%), and isolated (7.3%). 5.6% of the watershed, on the northern side of the Lake Baikal, is free of permafrost [numbers calculated using permafrost zones by Obu et al. (2019)]. The catchment is dominantly covered by forest (72.1%) and shrubland (12.5%) (Amon et al., 2012).
We collected water samples from the river surface in the center of the Olenekskaya Channel near Samoylov Island using a pre-rinsed HDPE 1 L bottle (in summer) or a UWITEC 1 L water sampler (under ice) for 1 year beginning in April 2018 (Figure 1). The island is located in the central Lena River Delta and hosts a permanently staffed research station (Research Station Samoylov Island), which has been operating since 2013. Additional 1 sample sets with higher temporal resolution, from different years and from Lena River ice, are listed in Table 1. During the open water period (28 May 2018 to 22 October 2018), water was sampled from a small boat, and during ice-covered period (until 27 May 2018 and from 23 October 2018), through a hole drilled through the river ice. Two samples during the river ice break-up as well as four samples during the ice freeze-up in October were taken from the shore due to the inaccessibility of a more centered location on the river channel. Water samples were subsampled, filtered and conserved at the research station directly after sampling.
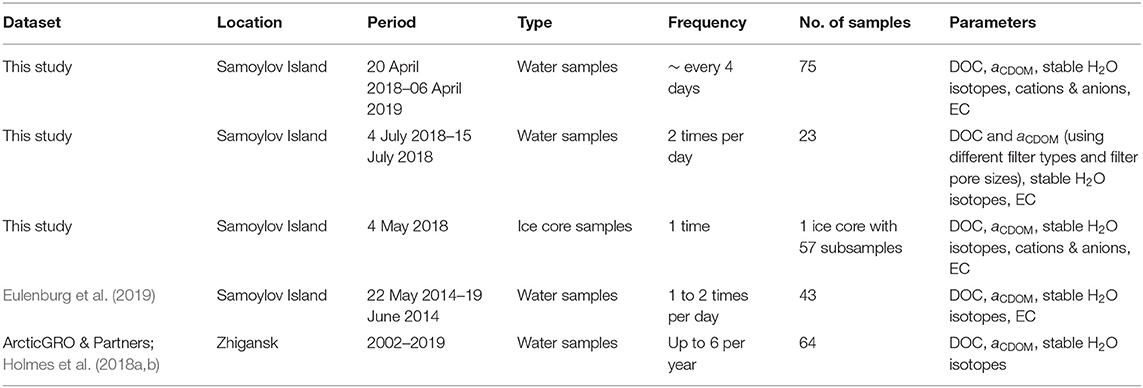
Table 1. Sampling period, frequency, sample type and measured parameters of datasets used in this study.
Sampling started on 20 April 2018 at a frequency of ~4 days and is ongoing. For this study, we use a dataset of almost one complete year (until 6 April 2019). For each sample, in situ temperature and electrical conductivity (EC) were measured using a hand-held conductivity meter (WTW COND 340I, accuracy ± 0.5%). For all samples, a series of biogeochemical parameters were analyzed (Table 1). The EC was additionally re-measured on each sample in the lab using a hand-held conductivity meter (WTW Multilab 540, accuracy ± 0.5%) after transport to Germany. For 11 days, from 4 July 2018 to 15 July 2018, samples were taken at a higher frequency and for additional parameters (Table 1).
Discharge
The discharge of the Lena River is monitored by the Russian Federal Service for Hydrometeorology and Environmental Monitoring (Roshydromet) and data are available at www.r-arcticnet.sr.unh.edu (Shiklomanov, 2010; 1936–2009) and www.arcticgreatrivers.org (Shiklomanov et al., 2018, 1999 to present). All discharge data shown in this study were corrected for the distance difference between the gauge station at Kyusyur and water sampling station at Samoylov Island (~220 km) using a Lena River propagation speed estimate (88 km d−1) from Smith and Pavelsky (2008).
Biogeochemical Parameters
For each sample of the Lena River monitoring program, 1 L of surface river water was collected and subsequently subsampled. For DOC and CDOM absorption (aCDOM), the sample was filtered through a 0.45 μm cellulose acetate filter which had been rinsed with 20 mL sample water. Over 10 days in July 2018, additional filter type and pore size tests for DOC and aCDOM were carried out (Supplementary Figures 1, 2). DOC samples were filled into a pre-rinsed 20 mL glass vial and acidified with 25 μL HCl Suprapur (10 M) and stored in the dark at 4°C. After transport, DOC samples were analyzed at the Alfred Wegener Institute Helmholtz Center for Polar and Marine Research (AWI), Potsdam, Germany. DOC concentrations were analyzed using high temperature catalytic oxidation (TOC-VCPH, Shimadzu). Three replicate measurements of each sample were averaged. After every ten samples, a blank (Milli-Q water) and a standard was measured. Eight different commercially available certified standards covered a range between 0.49 mg L−1 (DWNSVW-15) and 100 mg L−1 (Std. US-QC). The results of standards provided an accuracy better than ± 5%.
aCDOM samples were collected in pre-rinsed 50 mL amber glass bottles that were stored in the dark at 4°C until analysis. aCDOM was measured at the Otto Schmidt Laboratory for Polar and Marine Research (OSL), Saint Petersburg, Russia using a SPECORD 200 spectrophotometer (Analytik Jena) and at the German Research Center for Geosciences (GFZ), Potsdam, Germany using a LAMBDA 950 UV/Vis (PerkinElmer). The median absorbance (Aλ) of three replicate measurements was used to calculate the aCDOM (λ):
where l is the path length (length of cuvette). Fresh Milli-Q water was used as reference. To detect chemical composition and molecular structure of the DOM, two optical indices, SUVA and S275-295, were used. Both indices correlate with aromaticity and molecular weight of bulk DOC (Weishaar et al., 2003; Helms et al., 2008). SUVA (m2 g C−1) was calculated by dividing the decadal absorption A/l (m−1) at 254 nm by DOC concentration (mg L−1). The spectral slope of aCDOM(λ) between 275 and 295 nm (S275–295) is an index for photodegradation (Helms et al., 2008). S275–295 was calculated by fitting a regression for the wavelength ranges 275–295 nm to the exponential function (Helms et al., 2008):
where aCDOM(λ0) is the absorption coefficient at reference wavelength λ0 and S is the spectral slope of aCDOM(λ) for the chosen wavelength range.
Water samples for stable isotopes were collected untreated in 10 mL HDPE vials, sealed tightly, stored in the dark at 4°C. Measurements were conducted at the laboratory facility for stable isotopes at AWI Potsdam using a Finnigan MAT Delta-S mass spectrometer equipped with equilibration units for the online determination of hydrogen and oxygen isotopic composition. The data is given as δD and δ18O values, which is the per mille difference to standard V-SMOW. The deuterium excess (d-excess) is calculated by:
The measurement accuracy for hydrogen and oxygen isotopes was better than ±0.8%¸ and ±0.1%¸, respectively (Meyer et al., 2000).
Water samples for concentrations of major dissolved components were filtered using a syringe-mounted 0.45 μm CA filter and kept cool and dark until analysis. Concentrations of major anions (, Cl−, Br−, F−, NO3−, and ) were determined using ion chromatography (Thermo-Fischer ICS 2100; Weiss, 2001). Total dissolved elemental concentrations (for Al, Ba, Ca, Fe, K, Mg, Mn, Na, P, Si, and Sr) were measured with inductively coupled plasma optical emission spectroscopy (ICP-OES; Perkin Elmer Optima 8300DV; Boss and Fredeen, 1997).
In addition, one ice core (LE08) was drilled on the river channel at Samoylov Island on 4 May 2018 (Figure 1). The core was drilled using a Kovacs Mark III and wrapped in HDPE plastic sleeves and stored frozen for transport to AWI Potsdam where further subsampling and analysis were done. The core was retrieved in five pieces with a total length of 144 cm, which was close to the ice thickness measured in the borehole. The ice core was cut into 3 cm slices and analyzed for DOC, aCDOM(λ), stable oxygen isotopes, cations and anions following the methods described above.
Flux Calculations
For visualization, concentrations (Cd) between sampling dates were linearly interpolated. Then, daily fluxes were calculated by multiplying daily concentrations and the daily discharge (Qd).
Daily fluxes (Fluxd) were summed for individual periods. The annual heat flux was calculated as in Liu et al. (2005); Yang et al. (2013) to enable inter-annual comparisons. Negative river water temperatures were set to 0°C and the specific heat capacity of water was set constant to 4.184 J g−1 °C−1.
Water Source Endmember Calculation
98% of the variability of all measured parameter can be explained by three components (Supplementary Table 1). We distinguished three water source fractions using EC and water δ18O by solving the mass balance equation:
for unknowns, where f ∈ [0;1] is the fraction of each water source. We chose endmember for EC and δ18O values that encompass the overall variability of observed EC and δ18O (Table 2).
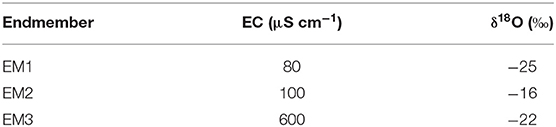
Table 2. Electrical conductivity (EC) and δ18O for water source endmember.
Results
The Lena River discharge shows strong seasonality, with low discharge during the ice-covered winter, a spring peak maximum and a moderate summer discharge (Figure 2). In some years, additional discharge peaks in late summer and fall occur. Over the period from 1936 to 2018, the Lena River's annual discharge increased (1.44 × 10⁹ m3 year−1), to a large part driven by the increasing winter (November to April) discharge flux (0.41 × 10⁹ m3 year−1; Figure 2 inset). Furthermore, trends are clearly visible in the colors of Figure 2, indicating that river ice breaks up earlier and freezes later in the year.
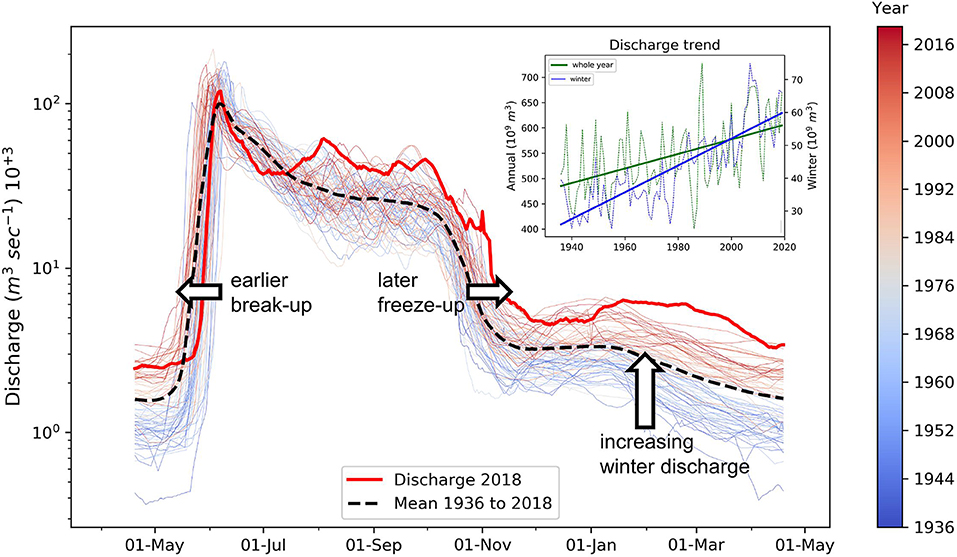
Figure 2. Discharge data from Kyusyur station from 1936 to 2018. Colors from blue to red indicate the year from 1936 to 2018. The red thick solid line shows the year 2018 and the black thick dashed shows the mean of the period from 1936 to 2018. The inset figure shows the discharge flux for the whole year (green) and for November to April (blue). Discharge data: A.I. Shiklomanov (2010) 1939–2008, ArcticGRO 2009–2019.
Putting the year 2018 into the long-term context, the winter (November to April) and late summer (August to October) discharge were significantly higher than their 1938–2018 means. The timing and intensity of the 2018 spring discharge peak was close to the long-term median. Summer 2018 was also characterized by multiple higher discharge events, which rise above the long-term mean. The elevated discharge continues into the first 3 months of 2019 (dashed line in Figures 3B,C).
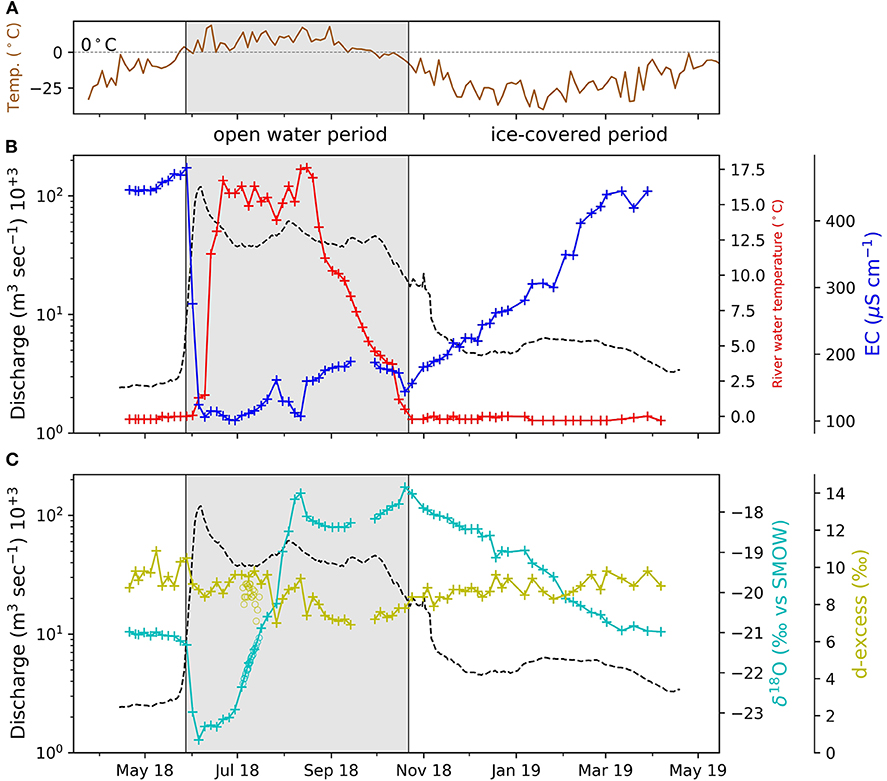
Figure 3. Air temperature, measured Figure 2 in Tiksi (A), discharge (black dashed line) (B,C), river water temperature and EC (B) and δ18O and d-excess (C). The gray area indicates the period where the Lena River channels around Samoylov Island were not ice covered (dates are based on optical satellite imagery). The EC values are those from measurements made in the laboratory following sampling. Circles in respective colors in (C) show high frequency measurements from July 2018.
Lena River Temperature and Chemistry
During the period when the Lena River is ice-covered, the mean river water temperature below the ice is slightly below 0°C (−0.2 to −0.01°C; Figure 3A). During the first days of spring peak discharge, the temperature only marginally increases to 1.5°C. About 2 weeks after the start of spring peak discharge, the temperature rises within 1 week to a relatively stable summer level around 16°C. With decreasing air temperatures in fall, the river temperature gradually decreases and reaches 0°C in mid-October when the Lena River starts to freeze. The highest river water temperature (17.6°C) was recorded on 15. August 2018. The EC drops almost simultaneously with the onset of the spring peak discharge from its annual maximum of 490 μS/cm to its annual minimum of 99 μS/cm. The EC is generally low in summer, and gradually increases during the ice-covered period. The summer discharge peaks coincide with decreases in the EC.
A strong seasonality in river water δ18O values was observed, ranging between −17.4%0 and −23.7%0 in the sampling period. During late winter, when the Lena River ice thickness reached its maximum (March-April), δ18O was stable at around −21%0. The lowest δ18O values (−23.7%0) occurred during the spring freshet in the first days of June, coinciding with the highest discharge. The highest δ18O (−17.4%0) occurred shortly before freeze-up at the end of October. Similarly high δ18O (−17.5%0) occurred during the mid-summer discharge peak. With decreasing discharge and freezing of the Lena River and its catchment, δ18O gradually decreased toward −21%0. d-excess values were highest (+10.9%0) during late winter and lowest (+6.9%0) in late summer. The d-excess of the measurements in July 2018 were about 0.5%0 lower than long-term values. Additional measurements of δ18O in July 2018 agreed with the long-term measurements.
For all samples in the Lena River dataset, we observed a very strong relationship (r2 = 0.996) between δ18O and δD (Figure 4). The slope of the linear regression is lower (7.73) than the Global Meteoric Water Line (slope GMWL = 8.0), but almost identical to the Local Meteoric Water Line (the slope of the LMWL is 7.6 for 381 event-based samples, and 7.7 for 41 monthly means; Spors, 2018). Lena River ice core samples (LE08) showed overall higher δ18O and δD than water samples and the regression line showed a clear offset compared to river water samples (Figure 4). The slope of the linear regression of ice core samples (8.32) was higher than that of Lena River water. Lena River water samples from 2014 were similarly strongly correlated (r2 = 0.987) and had a similar slope (7.6) compared to the Lena River samples from 2018. Both slopes, from 2014 and 2018, are lower, compared to the GMWL. Ice core samples had higher mean δ18O and δD values, but with a shift to lower δD for similar δ18O.
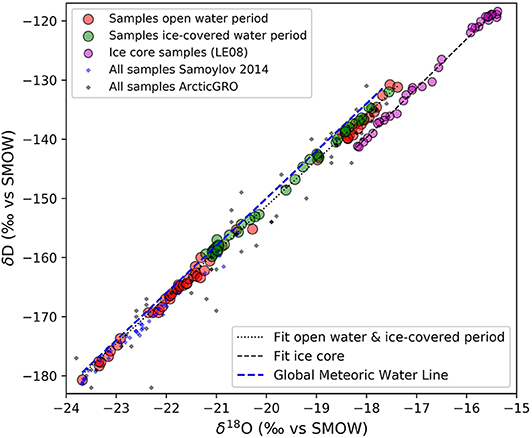
Figure 4. Relationship between δ18O and δD for open water (red) and ice-covered (green) samples. The black dotted line shows the linear regression of samples from open water period (28 May 2018 to 22 October 2018) and ice-covered period (until 27 May 2018 and from 23 October 2018) combined (δD = 7.73 × δ18O + 3.36). The black dashed line shows the linear regression of ice core samples (δD = 8.33 × δ18O + 10.14). The blue dashed line shows the global meteoric water line after Craig (1961). Additional samples from Samoylov 2014 (blue crosses) and ArcticGRO (gray crosses) include samples from the ice-covered period as well as open water period.
The concentrations of most of the major cations and anions correlated with the seasonal variability in EC (Supplementary Figure 3). Whereas concentrations of all ions increased during the ice-covered period, the concentration of K behaved differently, with lower values during January and February 2019. During the ice-covered period, Na and Cl− dominated, while in summer and during the spring discharge peak, Ca and Cl− and dominated. Whereas concentrations for some species regained over 50% of their late winter concentration during summer (F−, Si), others did not increase until mid-winter (Na, Ba, Cl−, Br−). The end of the open water period was marked by a small decrease in concentration that lasted for almost 2 weeks for all species. Si concentration was hardly affected by precipitation events during the open water period, in contrast to all other measured concentration (for example, the precipitation peak centered at August 20, 2018). Annual fluxes of major ions are presented in Table 3. Note that some concentrations fell below analytical detection limits and this prevented a meaningful flux calculation.
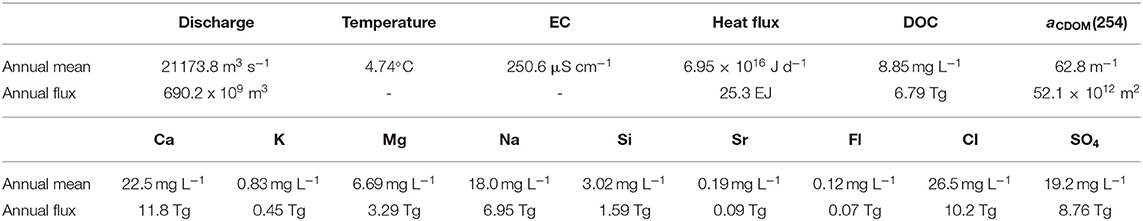
Table 3. Annual mean values and annual fluxes of Lena River biogeochemical parameter.
Dissolved Organic Carbon (DOC) and Colored Dissolved Organic Matter (CDOM)
Dissolved organic matter in the Lena River varied with the hydrograph, with DOC concentrations ranging from 4.9 to 18.2 mg L−1 and aCDOM(254) ranging from 40.8 to 150.92 m−1 (Figure 5A). Lowest values were observed at the end of winter, right before or with the onset of the spring ice break-up, whereas highest values occurred only a few days later during the spring ice break-up. In summer (July to October) both DOC and aCDOM(254) returned to values near pre-break-up [~6–7 mg L−1 DOC and ~44 to 50 m−1 aCDOM(254)] but then increased during the mid-summer discharge peak from 6.2 to 10.2 mg L−1 and from 45.3 to 85.6 m−1 aCDOM(254). High frequency sampling during July 2018 agreed closely with the overall pattern from the annual sampling (circles in Figure 5).
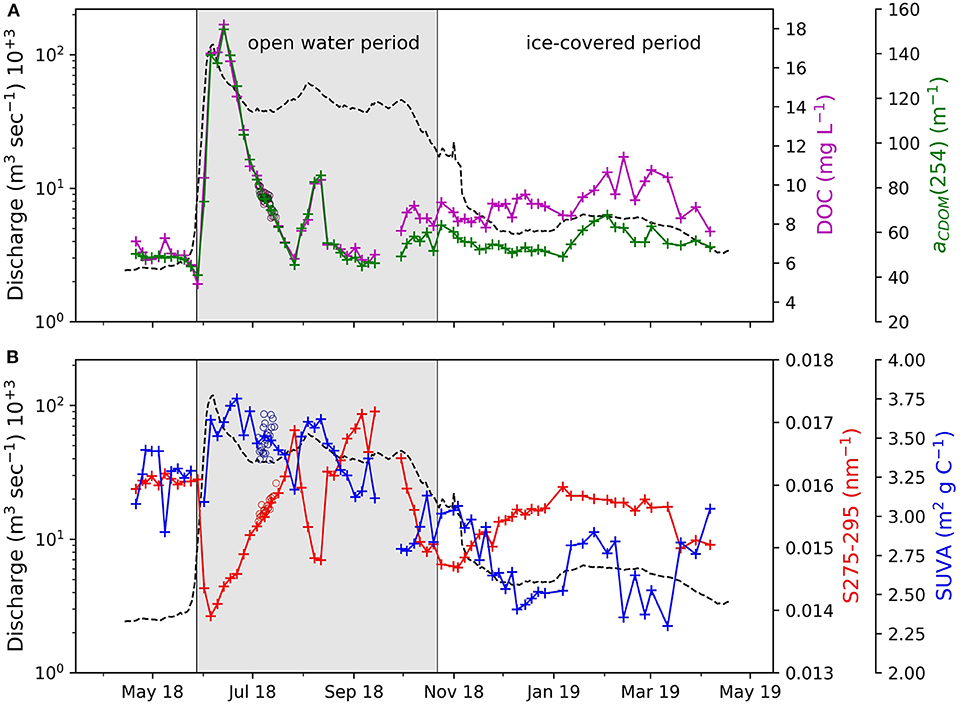
Figure 5. Seasonal variation of DOC and aCDOM(254) (A) and S275-295 and SUVA (B). Black dashed line shows the discharge. Circles in respective colors show high frequency measurements from July 2018.
In winter, DOC and aCDOM(254) increased in response to comparatively minor fluctuations in discharge, with winter maxima of 11.4 mg L−1 and 67.8 m−1, respectively. DOC and aCDOM(254) in the river ice had means of 1.04 mg L−1 DOC and 0.96 m−1 aCDOM(254), with no clear systematic vertical trend down core (Supplementary Figure 4).
Two periods with clear correlations between DOC and aCDOM(254) were apparent: one for the open water period (28 May 2018 to 22 Oct. 2018), and another for the rest of the time series, with ice cover. This separation indicates qualitative differences in the river DOM (Figure 6). The slope for the aCDOM(254) vs. DOC regression was significantly steeper for the open water period (8.86 m2 g−1) while the ice covered period had a low slope (2.91 m2 g−1) and greater intercept. These seasonal qualitative changes were also reflected in S275-295 and SUVA. The lowest slopes (0.0139 nm−1) were measured during the spring ice break-up and the highest during late summer (0.172 nm−1). In winter, during the ice-covered period, S275-295 varied between 0.0147 and 0.0162 nm−1. The SUVA peaked during the spring ice break-up (3.75 m2 g C −1) and during the early summer discharge peak (3.62 m2 g C−1) and reached a minimum in late winter (2.3 m2 g C−1). Beginning at spring ice break-up, SUVA decreased until late winter. In April 2019, almost 2 months before the return of the spring ice break-up, SUVA increased from 2.2 to 3.1 m2 g C−1.
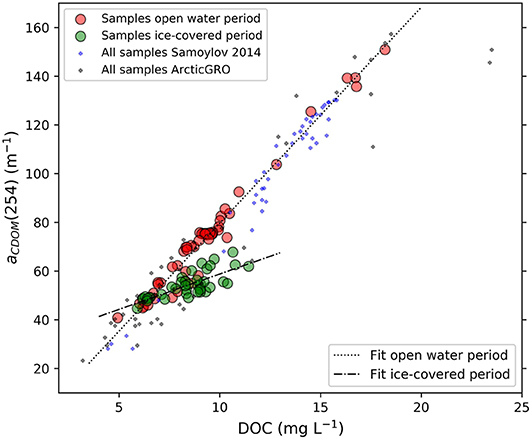
Figure 6. Relationship of Lena River DOC and aCDOM(254) samples. Samples from 2018/19 are shown as circles. Samples from the open water period (28 May 2018 to 22 October 2018) are displayed as red circles, r2: 0.97, samples from the ice covered period (until 27 May 2018 and from 23 October 2018) as green circles, r2 = 0.59). ArcticGRO data (gray crosses) sampled near Zhigansk (r2 = 0.89, Holmes et al., 2018b) and monitoring data from the 2014 freshet (blue crosses) sampled near Samoylov Island (Samoylov 2014, r2 = 0.96, Eulenburg et al., 2019) are added for comparison. The dotted black line shows the linear regression of the samples from the open water period (aCDOM(254) = 8.86 × DOC−8.98) and the dashed-dotted black line shows the linear regression of the samples from the ice-covered period (aCDOM(254) = 2.91 × DOC + 29.74).
DOC Flux
We calculated an annual DOC flux of 6.79 Tg C and a discharge flux of 690.2 x 10⁹ m3 for the considered period of 1 year starting 20 April 2019, during which 2.78 Tg C (41% of annual flux) were transported in spring, 3.26 Tg C (48% of annual flux) in summer and 0.75 Tg C in winter (11% of annual flux) (Supplementary Figure 5).
Next, we compare the DOC concentration, aCDOM(254) and calculated fluxes of the spring period in 2014 (Figure 7A) with the hydrologically aligned similar period in 2018 (Figure 7B). In 2014, the spring ice break-up discharge peak occurred 6 days earlier than in 2018. Thus, we compare period of similar length in 2018 (29 days) which is shifted 6 days later. In 2014, the discharge flux was 23.3% higher than in 2018, whereas the DOC flux was only 9% higher. This was due to the maximum DOC concentrations being slightly lower in 2014. Both years showed a similar pattern of decreasing DOM concentrations right before the start of the discharge peak followed by a rapid increase of DOM. Right after the discharge reached its maximum, it decreased again rapidly, whereas the DOM concentration remained high and decreased slowly.
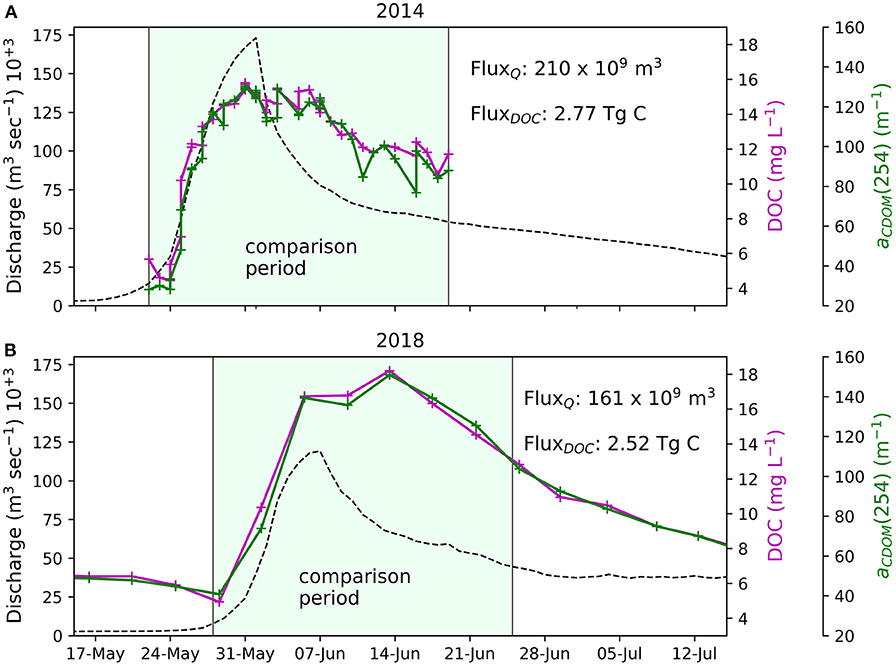
Figure 7. DOC and aCDOM(254) concentrations in 2014 (A) and 2018 (B). The 2014 sampling period, was compared to the hydrologically same period in 2018. The flux of discharge (Q) and DOC for the period (29 days) is presented in each panel.
Discussion
Drivers of Seasonal Variability in Hydrochemistry and DOM
The Lena River is characterized by a strong seasonality in discharge and its water biogeochemistry and the hydrograph can generally be divided into three periods: the spring ice break-up, summer to fall, and winter. Hence, we compare and contrast these three hydrologically and biogeochemically distinct periods and speculate about the shifts in the provenance of the water and its dissolved load.
(1) Spring Ice Break-up is the period when air temperatures are consistently positive in most of the catchment and major parts of the winter-accumulated snow and ice melt. Snowmelt does not occur simultaneously across the whole catchment, but begins in the south and moves northward. About 4 days after the ice break-up of the Lena River, the annual discharge maximum (~120 000 m3 s−1) is reached. River water temperatures during the first days of the spring discharge peak remain around 0°C, resulting in an export of large volumes of cold water to the Laptev Sea. Simultaneously with the discharge maximum, the water source endmember EM1 peaks (80% on 5 June) and remains the dominant water source until mid-July (Figure 8). We identified this endmember as melt water due to the sudden drop of EC (Figure 3B), major ions (Supplementary Figure 3) as well as δ18O values (Figure 3C). Chosen endmember values for EM1 with low EC (80 μS cm−1) and low δ18O (−25%0) are characteristic for snow melt water and agree well with reported values (Sugimoto and Maximov, 2012; Spors, 2018; Bonne et al., 2020). With regards to the DOM results it is clear that this pulse has two portions associated with it. The initial input of snow meltwater has low DOM and likely reflects snow not in contact with soil. This results in an initial decrease in DOM in the river which lasts on the order of a week, captured by the high temporal resolution of sampling. This interpretation is supported by the fact that the qualitative measures of DOM (SUVA and S275-295) do not change, essentially reflecting dilution of river water. This is then followed by the discharge maximum, where DOC reaches highest annual concentrations (18.2 mg L−1). In only 2 months (between 2. June 2018 and 2 August 2018), 53.2% (3.62 Tg C) of the total annual DOC flux (6.79 Tg C) is exported to the Laptev Sea. By applying water source fractions, we estimate that 43.3% (2.9 Tg C) of the annual DOC flux is transported with melt water into the river (Figure 9). Moreover, melt water accounts for 35% (242 × 109 m3) of the total annual discharge flux (690.18 × 10⁹ m3). This volume agrees well with the accumulated snow volume in the Lena River catchment. Using a mean (1988 to 2000) winter peak value of 120 mm as the snow water equivalent in the catchment (Yang et al., 2007), we derive a snow to water equivalent volume of 295.2 × 10⁹ m3.
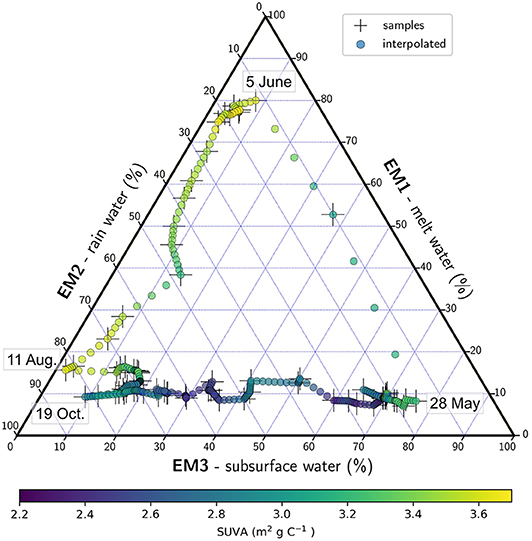
Figure 8. Water source fractions for each sample (cross) and each interpolated day (colored circle) based on EC and stable isotope endmember calculations; Color shows the SUVA. The extreme values of the water source fractions are indicated by dates.
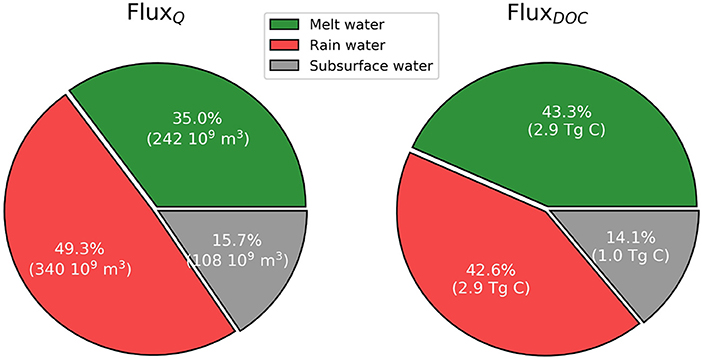
Figure 9. Percentage and absolute fractions of discharge flux (FluxQ) and DOC flux (FluxDOC) for each endmember water source.
With the discharge peak and high DOM concentrations, the quality of the organic matter also changes. Optical indices of DOM (SUVA and S275-295) were comparable to reported values (Walker et al., 2013). The changes occurring during the freshet indicate an organic matter source with high molecular weight and aromaticity (Figure 5B) (Weishaar et al., 2003; Helms et al., 2008) which is likely young DOM (Amon et al., 2012). During this period, the frozen ground beneath the snowpack during melt limits infiltration, confining most flow to a thin desiccated organic layer and to overland or snowpack flow. The DOM thus likely originates from modern plant litter, which is washed into the Lena River by the rapid and extensive snowmelt (Amon et al., 2012). Very low S275-295 during the spring ice break-up also suggests the input of fresh DOM.
(2) Open Water Period in Summer and Fall is the period during which Lena River water temperatures reach the annual maximum. In this period, the discharge decreases to about half of the spring peak values (40 000 to 60 000 m3 s−1). The fraction of EM1 (melt-water) decreases and another water source endmember—EM2—becomes dominant. f EM2 peaks during the discharge events in summer (82.3% on 11 August and 81.6% on 19 October) (Figure 8). At the same time, δ18O reaches its highest annual values and the EC is dropping. Such high δ18O and low EC suggest that this end member is meteoric in origin. For these rain-induced discharge maxima, δ18O and d-excess co-vary. This is likely related to less evaporative fractionation (and thus a higher d-excess), when more moisture is transported to the catchment. On the other hand, the highest evaporative fractionation is observed during the late summer (lowest d-excess). When discharge in summer is low, DOM concentrations are likewise low (~6 mg L−1). During these periods, little DOM is mobilized and transported into the Lena River. In total, rain water accounts for 49.3% (340 x 109 m3) of annual discharge. 42.6% (2.9 Tg C) of DOC is transported by rain water into the Lena River (Figure 9).
During the summer period the quality of the DOM changes (lower SUVA, higher S275-295). This could reflect the progress of soil thawing and a deepening active layer. Percolation and the leaching of older and more degraded DOM from deeper in the soil would explain both observations. Changes in SUVA can be linked to changes in source and age of DOM (Stedmon et al., 2011; O'Donnell et al., 2014; Coch et al., 2019) and can indicate the intensity of permafrost degradation within the catchment (Abbott et al., 2014). Furthermore, direct relationships are found between dissolved organic δ14C and SUVA (Neff et al., 2006; Butman et al., 2012; O'Donnell et al., 2014). Annual maxima in S275-295 during low discharge in summer points toward a higher degree of (photo)-degradation in the river, which can be a result of longer transport time from its source to the sampling station and an exposure of DOM to photodegradation.
There are peaks in DOM concentrations during the distinct rain-induced discharge peaks in summer and fall (Figure 2). During these periods, that are likely caused by precipitation events over a large area, more DOM is mobilized from the catchment and transported into the Lena River. The general trend toward older and more degraded DOM is interrupted for those events and DOM similar to that transported by the spring snow melt enters the river. However, during the second strong rain event with peak values of rain water fraction (19 Oct.), higher SUVA values compared to the first summer rain event (11 Aug.) point toward a smaller fraction of young organic material. We suggest that reservoirs of young organic material on the land surface of the Lena River catchment are continuously washed out throughout the summer and thus higher relative fractions of older DOM from deeper soil horizons or permafrost become visible in the water samples. Additionally, rain events cause higher water levels in the Lena River that can re-connect isolated waterbodies and flush lakes, ponds and wetlands. In this way, DOM from phytoplankton production and bleached DOM from standing water bodies can be introduced to the Lena River.
Generally, during the open water period a trend toward lower SUVA and higher S275-295 values is present and continues into the early winter along with a decreasing fraction of rain water. Thus, the amount of fresh and young DOM transported with rain water from the Lena River catchment decreases.
(3) Winter is the period when the Lena River is entirely covered with ice and the discharge is low (<6,000 m3 s−1) compared to the other seasons and to the annual mean of 21 885 m3 s−1. During this period, most precipitation in the Lena River catchment accumulates as snow on land and the water level is gradually lowered. The remaining rain water is removed from the hydrological system of the Lena River catchment and the rain water fraction decreases gradually during the first half of the winter (Figure 8).
In early March, δ18O and EC reach a stable level. At this time, the third endmember (EM3) becomes the dominant water source (76.1% on 28 May) (Figure 8). We suggest that this water source endmember represents subsurface water such as groundwater, soil and pore water (Abbott et al., 2014), which are the only significant natural water sources in winter, when air temperatures are permanently below 0°C. Subsurface water represents 15.7% (105 x 109 m3) of the annual Lena River water flux. 14.1% (1 Tg C) of the DOC flux was transported with this water during our year of observation (Figure 9).
Optical DOM characteristics in winter continue the trend of summer and fall toward older and more degraded DOM until January 2019 when DOM concentrations and SUVA values begin to increase, coincident with a small increase in discharge. During low discharge in winter, a substantial part of the basin outlet discharge originates from the Vilui reservoir (Tananaev et al., 2016), which is regulated by a dam (Viluyskaya HPS) constructed in the 1970s. Changes of DOM concentration and composition may be caused by the higher relative fraction of reservoir water that is released through the Vilui dam. In reservoir water all water sources are pooled throughout the year, leading to DOC concentrations elevated above the otherwise low winter levels. The major increase in long term winter discharge of the Lena River in the late 1970s (Figure 2) coincides with the completion of Vilui dam construction and its reaching full capacity (Ye et al., 2003; Tananaev et al., 2016). In late winter, before the spring ice break-up, SUVA increases which likely coincides with first input of fresh DOM from the southern most parts of the catchment, where temperatures begin to rise above 0°C during the day.
Data from the ice core samples suggest that only low concentrations of DOM are incorporated into the river ice. Once the river ice is exported to the Laptev Sea shelf after spring ice break-up, it tends to dilute the shelf waters rather than act as a source of high DOM (Amon et al., 2012). However, patches of high sediment load on the Lena River ice (Fedorova et al., 2015) and the erosion of shorelines during ice jams (van Huissteden, 2020) contribute to the particulate organic matter flux to the Laptev Sea. There is likely a contribution to DOM from dissolution of the transported POM but this is expected to be quantitatively low in comparison to the river load of DOM.
The results presented here show that high frequency sampling reveals subtle changes in water chemistry reflecting the seasonal changes in the hydrology of the Lena River catchment. Most of the intra-annual variation in the Lena River water biogeochemistry can be captured by the 3-component endmember analysis presented here. However, river water at the basin outlet represents an integrated signal from the entire catchment and geographical and temporal variations of biogeochemical signals within the catchment cannot be detected by sampling.
Comparison of Reported DOM Values and Fluxes for the Lena River
Overall, our observed ranges of DOC concentrations and aCDOM(254) agree well with reported values from sampling programs of shorter duration or substantially lower sampling frequency (ArcticGRO and PARTNERS (Holmes et al., 2018a,b); Lena River freshet 2014 (Eulenburg et al., 2019)). ArcticGRO and PARTNERS samples have significantly higher DOC concentrations compared to samples from Samoylov Island in 2014 and 2018. Generally, these samples show a lower r2 (0.89) of their DOC to aCDOM(275) regression, compared to the dataset shown in this study (r2 = 0.97). This may indicate either a prominent local influence of anomalous DOM or the impact of analytical differences and different sampling protocols.
A number of studies have reported annual organic carbon fluxes of the Lena River (Table 4). Reported values range between 3.6 Tg C (Gordeev and Kravchishina, 2009) and 7.67 Tg C (Kicklighter et al., 2013). Variability in DOC flux estimates is likely not only the result of inter-annual variability, but probably also results from differences in sampling frequency, sampling strategy and methods of calculating flux. All of the reported studies are based on a lower number of samples per year and/or on statistical models that are used to pair discharge measurements with concentration (Table 4). With statistical models, such as LOADEST (Runkel et al., 2004), estimated daily concentrations can be generated, with which seasonal or annual fluxes can be calculated. Although seasonal changes for the relation of discharge to concentration are taken into account in such models, the very low number of samples is critical and simplifying assumptions can cause systematic biases in flux estimates. Our dataset improves sample frequency and reveals that there is no clear relationship between discharge and DOC concentration. A relationship only persists during spring (r2 =0.87, not shown). The impact of methodological differences for flux calculations becomes clear when comparing reported DOC flux values for 2004 and 2005 from Raymond et al. (2007) and Stedmon et al. (2011), that are based on precisely the same data but differ by 22.3% (1.46 Tg C). Furthermore, the reported fluxes that used models to relate discharge and DOC concentration tacitly assume that variations in DOC concentration are driven by processes changing the discharge, which is equivalent to a one-component system. Thus, the expected increase of DOC mobilization from degrading and thawing permafrost, which does not significantly affect discharge, cannot be reflected by such models.
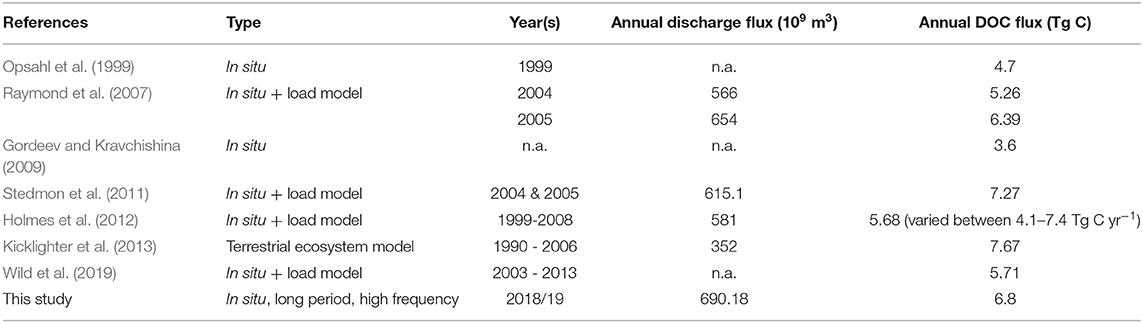
Table 4. Previously published discharge and DOC fluxes and type of sampling and calculation.
The identification of seasonal fluxes by selecting certain time periods (Stedmon et al., 2011; Holmes et al., 2012) throughout different years is a method of addressing this shortcoming but prevents meaningful direct comparisons. The timing of seasonal changes such as the spring ice break-up varies between years and thus influence flux calculations for time periods defined by the calendar. Differences in seasonal fluxes between years (Supplementary Figure 5) thus are more likely to show shifts in seasonal timing than in water or dissolved load provenance.
We compared DOC fluxes during the spring discharge peak of 2 years (2014 and 2018). Although the discharge flux between both years differs by 26.4% (4.9 km3), the difference in DOC flux is not as severe (9.4%). At least for the spring discharge peak, lower discharge is compensated by higher concentrations, which results in a similar flux. This is, however, not the case for summer and fall rain events where high DOC concentrations are triggered by rain that washes organic matter from land surfaces into the Lena River. Thus, recurrence intervals and the intensity of such rain events dominate inter-annual variability in DOC fluxes.
The high temporal resolution of the sampling program presented in this study improves our ability to capture all seasonal events relevant to organic carbon fluxes, without assuming a relationship between DOC concentration and discharge. Thus, we are confident that our flux calculation can be used as a baseline for future trend analysis of Lena River DOC fluxes and, in particular, for the identification of changing seasonality. Little is known about changes in biogeochemistry between sampling locations further upstream (e.g., Zhigansk) and Samoylov Island. Continuous sampling of both programs (Samoylov sampling and ArcticGRO) will, however, enable future comparative studies.
Conclusion
In a warming Arctic, we expect permafrost landscapes to change dramatically. One result will be the remobilization of dissolved matter from permafrost. In particular, the release of dissolved organic carbon is under immense research attention due to its strong potential feedbacks for the climate. By monitoring the biogeochemistry of Arctic river water at the river mouth, we can observe ongoing changes that reflects change at the catchment scale.
In this study, we present 1 year of biogeochemical data from the Lena River, one of the largest Arctic Rivers. We improve on existing studies by sampling at high temporal frequency throughout the whole year. The main drivers that are responsible for the strong seasonality of water discharge and DOC flux were ascribed to three water sources—melt water, rain water and subsurface water. Melt and rain water were found to be the prevailing water sources that transport together 5.8 Tg C dissolved organic matter (85% of annual flux) into the Lena River. Optical DOM indices revealed changing composition and sources of DOM throughout the year. The high resolution sampling also revealed two phases of melt water introduction, with an initial phase of approximately 1 week, during which melt water carries little or no DOM and dilutes river DOM concentrations without altering DOM character, followed by a large pulse of fresher organic matter from the catchment that substantially changes the river DOM characteristics. Future studies including δ14C measurements of the age of the DOM will enable direct relation of optical DOM indices to the DOM age and the contribution of permafrost thaw as shown in Neff et al. (2006).
The results of this sampling program provide a baseline for future shifts in seasonal variations as well as inter-annual variation of DOM and the chemistry of the Lena River. The annual flux of 6.8 Tg C was calculated without recourse to load models, which are probably the source of discrepancies between existing estimates. Continuous under-ice sampling revealed that high winter DOM concentrations are probably related to the discharge of reservoir water from the Vilui tributary.
This dataset represents the first year of a planned long-term monitoring program at the Research Station Samoylov Island and provides a reference data set against which future change of this large integrative system may be measured. Continuous sampling of Arctic River water will facilitate identification of intra and inter-annual trends during ongoing climate change.
Data Availability Statement
The data sets used here are available online (https://doi.org/10.1594/PANGAEA.913196, https://doi.org/10.1594/PANGAEA.913279).
Author Contributions
BJ, PO, and AM initiated the sampling program. BJ and PO designed the study with contributions of all authors. BJ prepared the figures and led the writing of the paper. All authors contributed to the discussion and the editing of the paper.
Funding
This research has been supported by Geo. X, the Research Network for Geosciences in Berlin and Potsdam (grant no. SO_087_GeoX). VP was supported from the Ministry of Higher Education and Science of the Russian Federation project RFMEFI61617X0076. This work was supported by funding from the Helmholtz Association in the framework of MOSES (Modular Observation Solutions for Earth Systems). We acknowledge support from the Open Access Publication Initiative of Freie Universität Berlin.
Conflict of Interest
The authors declare that the research was conducted in the absence of any commercial or financial relationships that could be construed as a potential conflict of interest.
Acknowledgments
We are grateful to Andrey Astapov, Sergey Volkov, and Ekaterina Abramova who were involved in continuous sampling. We are eminently thankful to Antje Eulenburg for her massive efforts to support this sampling program and the analysis of several parameter shown in this study. Furthermore, we thank the Trofimuk Institute of Petroleum Geology and Geophysics, Siberian Branch of the Russian Academy of Sciences (IPGG SB RAS), Novosibirsk, Russia, for their efforts to run the Research Station Samoylov Island and the team of the Otto Schmidt Laboratory for Polar and Marine Research in St. Petersburg for support in logistics and sample analysis. Furthermore, we thank the logistics of the Alfred Wegener Institute, Potsdam, Germany, specifically Waldemar Schneider and Volkmar Aßmann as well as Luidmila Pestryakova from the Northeastern Federal University (NEFU), Yakutsk, Russia. Projects from the EU Horizon 2020 programme (Nunataryuk, grant no. 773421) and from BMBF-NERC's Changing Arctic Ocean programme (CACOON, NERC grant no. NE/R012806/1, BMBF grant no. 03F0806A) supported discussions within a larger group of experts.
Supplementary Material
The Supplementary Material for this article can be found online at: https://www.frontiersin.org/articles/10.3389/fenvs.2020.00053/full#supplementary-material
Footnote
1. ^Copernicus Open Access, Hub. Available online at: https://scihub.copernicus.eu/.
References
Abbott, B. W., Larouche, J. R., Jones, J. B., Bowden, W. B., and Balser, A. W. (2014). Elevated dissolved organic carbon biodegradability from thawing and collapsing permafrost. J. Geophys. Res. Biogeosciences 119, 2049–2063. doi: 10.1002/2014JG002678
Amon, R. M. W., Rinehart, A. J., Duan, S., Louchouarn, P., Prokushkin, A., Guggenberger, G., et al. (2012). Dissolved organic matter sources in large Arctic rivers. Geochim. Cosmochim. Acta 94, 217–237. doi: 10.1016/J.GCA.2012.07.01
Angelopoulos, M., Westermann, S., Overduin, P., Faguet, A., Olenchenko, V., Grosse, G., et al. (2019). Heat and salt flow in subsea permafrost modeled with CryoGRID2. J. Geophys. Res. Earth Surf. 124, 920–937. doi: 10.1029/2018JF004823
Aré, F. E. (1988). Thermal abrasion of sea coasts (part I). Polar Geogr. Geol. 12:1. doi: 10.1080/10889378809377343
Bareiss, J., and Görgen, K. (2005). Spatial and temporal variability of sea ice in the Laptev Sea: Analyses and review of satellite passive-microwave data and model results, 1979 to 2002. Glob. Planet. Change 48, 28–54. doi: 10.1016/j.gloplacha.2004.12.004
Bintanja, R., and Selten, F. M. (2014). Future increases in Arctic precipitation linked to local evaporation and sea-ice retreat. Nature 509, 479–482. doi: 10.1038/nature13259
Bonne, J.-L., Meyer, H., Behrens, M., Boike, J., Kipfstuhl, S., Rabe, B., et al. (2020). Moisture origin as a driver of temporal variabilities of the water vapour isotopic composition in the Lena River Delta, Siberia. Atmos. Chem. Phys. Discuss. Rev. doi: 10.5194/acp-2019-942
Boss, C. B., and Fredeen, K. J. (1997). Concepts, Instrumentation, and Techniques in Inductively Coupled Plasma Optical Emission Spectrometry. Shelton, CT: Perkin Elmer.
Butman, D., Raymond, P. A., Butler, K., and Aiken, G. (2012). Relationships between Δ 14 C and the molecular quality of dissolved organic carbon in rivers draining to the coast from the conterminous United States. Global Biogeochem. Cycles 26. doi: 10.1029/2012GB004361
Charkin, A. N., Dudarev, O. V., Semiletov, I. P., Kruhmalev, A. V., Vonk, J. E., Sánchez-García, L., et al. (2011). Seasonal and interannual variability of sedimentation and organic matter distribution in the Buor-Khaya Gulf: the primary recipient of input from Lena River and coastal erosion in the southeast Laptev Sea. Biogeosciences 8, 2581–2594. doi: 10.5194/bg-8-2581-2011
Coch, C., Juhls, B., Lamoureux, S. F., Lafrenière, M. J., Fritz, M., Heim, B., et al. (2019). Comparisons of dissolved organic matter and its optical characteristics in small low and high Arctic catchments. Biogeosciences 16, 4535–4553. doi: 10.5194/bg-16-4535-2019
Craig, H. (1961). Isotopic variations in meteoric waters. Science. 133, 1702–1703. doi: 10.1126/science.133.3465.1702
Eulenburg, A., Juhls, B., and Hölemann, J. A. (2019). Surface water dissolved organic matter (DOC, CDOM) in the Lena River (2014). PANGAEA. 16, 2693–2713. doi: 10.1594/PANGAEA.898711
Fedorova, I., Chetverova, A., Bolshiyanov, D., Makarov, A., Boike, J., Heim, B., et al. (2015). Lena Delta hydrology and geochemistry: long-term hydrological data and recent field observations. Biogeosciences 12, 345–363. doi: 10.5194/bg-12-345-2015
Freeman, C., Evans, C. D., Monteith, D. T., Reynolds, B., and Fenner, N. (2001). Export of organic carbon from peat soils. Nature 412, 785–785. doi: 10.1038/35090628
Frey, K. E., and Smith, L. C. (2005). Amplified carbon release from vast West Siberian peatlands by 2100. Geophys. Res. Lett. 32:L09401. doi: 10.1029/2004GL022025
Gordeev, V. V., and Kravchishina, M. D. (2009). “River flux of dissolved organic carbon (DOC) and particulate organic carbon (POC) to the Arctic Ocean: what are the consequences of the global changes?,” in Influence of Climate Change on the Changing Arctic and Sub-Arctic Conditions, ed J. Nihoul (Dordrecht: Springer Netherlands), 145–160. Available online at: https://www.springer.com/gp/book/9781402094583
Granskog, M. A., Stedmon, C. A., Dodd, P. A., Amon, R. M. W., Pavlov, A. K., de Steur, L., et al. (2012). Characteristics of colored dissolved organic matter (CDOM) in the Arctic outflow in the fram strait: assessing the changes and fate of terrigenous CDOM in the Arctic Ocean. J. Geophys. Res. Ocean. 117. doi: 10.1029/2012JC008075
Helms, J. R., Stubbins, A., Ritchie, J. D., Minor, E. C., Kieber, D. J., and Mopper, K. (2008). Absorption spectral slopes and slope ratios as indicators of molecular weight, source, and photobleaching of chromophoric dissolved organic matter. Limnol. Oceanogr. 53, 955–969. doi: 10.4319/lo.2008.53.3.0955
Hill, V. J. (2008). Impacts of chromophoric dissolved organic material on surface ocean heating in the Chukchi Sea. J. Geophys. Res. 113:C07024. doi: 10.1029/2007JC004119
Holmes, R. M., McClelland, J. W., Peterson, B. J., Tank, S. E., Bulygina, E., Eglinton, T. I., et al. (2012). Seasonal and annual fluxes of nutrients and organic matter from large rivers to the arctic ocean and surrounding seas. Estuar. Coast. 35, 369–382. doi: 10.1007/s12237-011-9386-6
Holmes, R. M., McClelland, J. W., Raymond, P. A., Frazer, B. B., Peterson, B. J., and Stieglitz, M. (2008). Lability of DOC transported by Alaskan rivers to the Arctic Ocean. Geophys. Res. Lett. 35:L03402. doi: 10.1029/2007GL032837
Holmes, R. M., McClelland, J. W., Tank, S. E., Spencer, R. G. M., and Shiklomanov, A. I. (2018a). ArcticGRO Absorbance Dataset. Available online at: https://www.arcticrivers.org/data (accessed January 10, 2020).
Holmes, R. M., McClelland, J. W., Tank, S. E., Spencer, R. G. M., and Shiklomanov, A. I. (2018b). ArcticGRO Water Quality Dataset. https://www.arcticrivers.org/data (accessed January 10, 2020).
Jollymore, A., Johnson, M. S., and Hawthorne, I. (2012). Submersible UV-Vis spectroscopy for quantifying streamwater organic carbon dynamics: implementation and challenges before and after forest harvest in a headwater stream. Sensors 12, 3798–3813. doi: 10.3390/s120403798
Juhls, B., Paul Overduin, P., Hölemann, J., Hieronymi, M., Matsuoka, A., Heim, B., et al. (2019). Dissolved organic matter at the fluvial-marine transition in the Laptev Sea using in situ data and ocean colour remote sensing. Biogeosciences 16, 2693–2713. doi: 10.5194/bg-16-2693-2019
Kaiser, K., Canedo-Oropeza, M., McMahon, R., and Amon, R. M. W. (2017). Origins and transformations of dissolved organic matter in large Arctic rivers. Sci. Rep. 7:13064. doi: 10.1038/s41598-017-12729-1
Keuper, F., Bodegom, P. M., Dorrepaal, E., Weedon, J. T., Hal, J., Logtestijn, R. S. P., et al. (2012). A frozen feast: thawing permafrost increases plant-available nitrogen in subarctic peatlands. Glob. Chang. Biol. 18, 1998–2007. doi: 10.1111/j.1365-2486.2012.02663.x
Kicklighter, D. W., Hayes, D. J., McClelland, J. W., Peterson, B. J., McGuire, A. D., and Melillo, J. M. (2013). Insights and issues with simulating terrestrial DOC loading of Arctic river networks. Ecol. Appl. 23, 1817–1836. doi: 10.1890/11-1050.1
Liu, B., Yang, D., Ye, B., and Berezovskaya, S. (2005). Long-term open-water season stream temperature variations and changes over Lena River Basin in Siberia. Glob. Planet. Change 48, 96–111. doi: 10.1016/J.GLOPLACHA.2004.12.007
Mann, P. J., Spencer, R. G. M., Hernes, P. J., Six, J., Aiken, G. R., Tank, S. E., et al. (2016). Pan-Arctic trends in terrestrial dissolved organic matter from optical measurements. Front. Earth Sci. 4:25. doi: 10.3389/feart.2016.00025
McClelland, J. W., Déry, S. J., Peterson, B. J., Holmes, R. M., and Wood, E. F. (2006). A pan-arctic evaluation of changes in river discharge during the latter half of the 20th century. Geophys. Res. Lett. 33:L06715. doi: 10.1029/2006GL025753
Meyer, H., Schönicke, L., Wand, U., Hubberten, H. W., and Friedrichsen, H. (2000). Isotope studies of hydrogen and oxygen in ground ice - Experiences with the equilibration technique. Isotopes Environ. Health Stud. 36, 133–149. doi: 10.1080/10256010008032939
Neff, J. C., Finlay, J. C., Zimov, S. A., Davydov, S. P., Carrasco, J. J., Schuur, E. A. G., et al. (2006). Seasonal changes in the age and structure of dissolved organic carbon in Siberian rivers and streams. Geophys. Res. Lett. 33, L23401. doi: 10.1029/2006GL028222
Niederdrenk, A. L., Sein, D. V., and Mikolajewicz, U. (2016). Interannual variability of the Arctic freshwater cycle in the second half of the twentieth century in a regionally coupled climate model. Clim. Dyn. 47, 3883–3900. doi: 10.1007/s00382-016-3047-1
Obu, J., Westermann, S., Bartsch, A., Berdnikov, N., Christiansen, H. H., Dashtseren, A., et al. (2019). Northern Hemisphere permafrost map based on TTOP modelling for 2000–2016 at 1 km2 scale. Earth Sci. Rev. 193, 299–316. doi: 10.1016/j.earscirev.2019.04.023
O'Donnell, J. A., Aiken, G. R., Walvoord, M. A., Raymond, P. A., Butler, K. D., Dornblaser, M. M., et al. (2014). Using dissolved organic matter age and composition to detect permafrost thaw in boreal watersheds of interior Alaska. J. Geophys. Res. Biogeosciences 119, 2155–2170. doi: 10.1002/2014JG002695
Opsahl, S., Benner, R., and Amon, R. M. W. (1999). Major flux of terrigenous dissolved organic matter through the Arctic Ocean. Limnol. Oceanogr. 44, 2017–2023. doi: 10.4319/lo.1999.44.8.2017
Overduin, P. P., Schneider von Deimling, T., Miesner, F., Grigoriev, M. N., Ruppel, C., Vasiliev, A., et al. (2019). Submarine permafrost map in the Arctic modeled using 1-D transient heat flux (SuPerMAP). J. Geophys. Res. Ocean. 124. doi: 10.1029/2018JC014675
Pegau, W. S. (2002). Inherent optical properties of the central Arctic surface waters. J. Geophys. Res. C Ocean. 107:SHE 16-1–SHE 16-7. doi: 10.1029/2000jc000382
Peterson, B. J. (2002). Increasing river discharge to the Arctic Ocean. Science. 298, 2171–2173. doi: 10.1126/science.1077445
Plaza, C., Pegoraro, E., Bracho, R., Celis, G., Crummer, K. G., Hutchings, J. A., et al. (2019). Direct observation of permafrost degradation and rapid soil carbon loss in tundra. Nat. Geosci. 12, 627–631. doi: 10.1038/s41561-019-0387-6
Porter, C., Morin, P., Howat, I., Noh, M.-J., Bates, B., Peterman, K., et al. (2018). ArcticDEM. Harvard Dataverse V1. doi: 10.7910/DVN/OHHUKH
Raymond, P. A., McClelland, J. W., Holmes, R. M., Zhulidov, A. V., Mull, K., Peterson, B. J., et al. (2007). Flux and age of dissolved organic carbon exported to the Arctic Ocean: a carbon isotopic study of the five largest arctic rivers. Global Biogeochem. Cycles 21. doi: 10.1029/2007GB002934
Richter-Menge, J., Druckenmiller, M. L., and Jeffries, M., (Eds.). (2019). 2019: Arctic Report Card 2019. Available online at: https://www.arctic.noaa.gov/Report-Card (accessed December 13, 2019).
Runkel, R. L., Crawford, C. G., and Cohn, T. A. (2004). “Load Estimator (LOADEST): a FORTRAN program for estimating constituent loads in streams and rivers,” in Techniques and Methods Book 4, Chapter A5, 69. Available online at: http://www.usgs.gov/ (accessed January 22, 2020).
Schuur, E. A. G., McGuire, A. D., Schädel, C., Grosse, G., Harden, J. W., Hayes, D. J., et al. (2015). Climate change and the permafrost carbon feedback. Nature 520, 171–179. doi: 10.1038/nature14338
Schuur, E. A. G., Vogel, J. G., Crummer, K. G., Lee, H., Sickman, J. O., and Osterkamp, T. E. (2009). The effect of permafrost thaw on old carbon release and net carbon exchange from tundra. Nature 459, 556–559. doi: 10.1038/nature08031
Shiklomanov, A. I. (2010). Observed and naturalized discharge data for large Siberian rivers. Available at: http://www.r-arcticnet.sr.unh.edu/ObservedAndNaturalizedDischarge-Website/ (accessed December 9, 2019).
Shiklomanov, A. I., Holmes, R. M., McClelland, J. W., Tank, S. E., and Spencer, R. G. M. (2018). ArcticGRO Discharge Dataset, Version 2020-01-23. Arct. Gt. Rivers Obs. Discharge. Available online at: https://arcticgreatrivers.org/data/
Shiklomanov, A. I., and Lammers, R. B. (2009). Record Russian river discharge in 2007 and the limits of analysis. Environ. Res. Lett. 4:045015. doi: 10.1088/1748-9326/4/4/045015
Smith, L. C., and Pavelsky, T. M. (2008). Estimation of river discharge, propagation speed, and hydraulic geometry from space: Lena River, Siberia. Water Resour. Res. 44, 1–11. doi: 10.1029/2007WR006133
Spors, S. (2018). Stable Water Isotope Characteristics of Recent Precipitation from Tiksi and Samoylov Island – Calibration of a Geoscientific Proxy for Northern Siberia (Bachelor Thesis). University of Potsdam, Potsdam.
Stedmon, C. A., Amon, R. M. W., Rinehart, A. J., and Walker, S. A. (2011). The supply and characteristics of colored dissolved organic matter (CDOM) in the Arctic Ocean: Pan Arctic trends and differences. Mar. Chem. 124, 108–118. doi: 10.1016/J.MARCHEM.2010.12.007
Sugimoto, A., and Maximov, T. C. (2012). Study on hydrological processes in Lena River Basin using stable isotope ratios of River water (IAEA-TECDOC−1673). Monit. Isot. Rivers Creat. Glob. Netw. Isot. Rivers. 41–49. Available online at: https://www.osti.gov/etdeweb/biblio/21570990
Tananaev, N. I., Makarieva, O. M., and Lebedeva, L. S. (2016). Trends in annual and extreme flows in the Lena River basin, Northern Eurasia. Geophys. Res. Lett. 43, 10,764-10,772. doi: 10.1002/2016GL070796
Tank, S. E., Striegl, R. G., McClelland, J. W., and Kokelj, S. V. (2016). Multi-decadal increases in dissolved organic carbon and alkalinity flux from the Mackenzie drainage basin to the Arctic Ocean. Environ. Res. Lett. 11:054015. doi: 10.1088/1748-9326/11/5/054015
Turetsky, M. R., Abbott, B. W., Jones, M. C., Walter Anthony, K., Olefeldt, D., Schuur, E. A. G., et al. (2019). Permafrost collapse is accelerating carbon release. Nature 569, 32–34. doi: 10.1038/d41586-019-01313-4
van Huissteden, J. (2020). “Permafrost carbon quantities and Fluxes,” in Thawing Permafrost (Cham: Springer Nature), 179–274. doi: 10.1007/978-3-030-31379-1
Velicogna, I., Tong, J., Zhang, T., and Kimball, J. S. (2012). Increasing subsurface water storage in discontinuous permafrost areas of the Lena River basin, Eurasia, detected from GRACE. Geophys. Res. Lett. 39:9403. doi: 10.1029/2012GL051623
Walker, S. A., Amon, R. M. W., and Stedmon, C. A. (2013). Variations in high-latitude riverine fluorescent dissolved organic matter: a comparison of large Arctic rivers. J. Geophys. Res. Biogeosciences 118, 1689–1702. doi: 10.1002/2013JG002320
Wegner, C., Bauch, D., Hölemann, J. A., Janout, M. A., Heim, B., Novikhin, A., et al. (2013). Interannual variability of surface and bottom sediment transport on the Laptev Sea shelf during summer. Biogeosciences 10, 1117–1129. doi: 10.5194/bg-10-1117-2013
Weishaar, J. L., Aiken, G. R., Bergamaschi, B. A., Fram, M. S., Roger, F., and Mopper, K. (2003). Evaluation of specific ultraviolet absorbance as an indicator of the chemical composition and reactivity of dissolved organic carbon. Environ Sci Technol. 37, 4702–4708. doi: 10.1021/ES030360X
Wild, B., Andersson, A., Bröder, L., Vonk, J., Hugelius, G., McClelland, J. W., et al. (2019). Rivers across the Siberian Arctic unearth the patterns of carbon release from thawing permafrost. Proc. Natl. Acad. Sci. U.S.A. 116, 10280–10285. doi: 10.1073/pnas.1811797116
Yang, D., Kane, D. L., Hinzman, L. D., Zhang, X., Zhang, T., and Ye, H. (2002). Siberian Lena River hydrologic regime and recent change. J. Geophys. Res. Atmos. 107, 14–10. doi: 10.1029/2002JD002542
Yang, D., Marsh, P., and Shaoqing, G. E. (2013). Cold and Mountain Region Hydrological Systems Under Climate Change. IAHS Publ. Available online at: http://www.usgs.gov/ (accessed December 16, 2019).
Yang, D., Zhao, Y., Armstrong, R., Robinson, D., and Brodzik, M.-J. (2007). Streamflow response to seasonal snow cover mass changes over large Siberian watersheds. J. Geophys. Res. 112:F02S22. doi: 10.1029/2006JF000518
Keywords: Lena River, Arctic, DOC, CDOM, optical indices, stable water isotopes
Citation: Juhls B, Stedmon CA, Morgenstern A, Meyer H, Hölemann J, Heim B, Povazhnyi V and Overduin PP (2020) Identifying Drivers of Seasonality in Lena River Biogeochemistry and Dissolved Organic Matter Fluxes. Front. Environ. Sci. 8:53. doi: 10.3389/fenvs.2020.00053
Received: 26 January 2020; Accepted: 22 April 2020;
Published: 15 May 2020.
Edited by:
Robyn E. Tuerena, University of Edinburgh, United KingdomReviewed by:
Bin Yang, Beibu Gulf University, ChinaNadia Valentina Martínez-Villegas, Instituto Potosino de Investigación Científica y Tecnológica (IPICYT), Mexico
Copyright © 2020 Juhls, Stedmon, Morgenstern, Meyer, Hölemann, Heim, Povazhnyi and Overduin. This is an open-access article distributed under the terms of the Creative Commons Attribution License (CC BY). The use, distribution or reproduction in other forums is permitted, provided the original author(s) and the copyright owner(s) are credited and that the original publication in this journal is cited, in accordance with accepted academic practice. No use, distribution or reproduction is permitted which does not comply with these terms.
*Correspondence: Bennet Juhls, bjuhls@wew.fu-berlin.de