Design of the CO2 Removal Section for PSA Tail Gas Treatment in a Hydrogen Production Plant
 Laura A. Pellegrini
 Giorgia De Guido
 Stefania Moioli
- GASP, Group of Advanced Separation Processes and GAS Processing, Dipartimento di Chimica, Materiali e Ingegneria Chimica “Giulio Natta”, Politecnico di Milano, Milan, Italy
CO2 capture, storage, and, recently, utilization (CCSU) is considered effective in achieving the target of 2°C established to reduce the gradual increase in global warming. In the literature, most of research has focused on the removal of carbon dioxide from power plants, particularly those fed with coal, which account for higher amounts of CO2 emissions if compared with those fed with natural gas. CCSU in other non-power sectors is still not fully considered, while its importance in mitigating the environmental impact of industrial activities is equivalent to that of power plants. In the field of hydrogen production, treatment of gaseous streams to remove carbon dioxide is performed for producing a stream of almost pure H2 starting from syngas and for reducing carbon dioxide emissions, so that CO2 removal units can be part of different sections of the plant. In this work, a state-of-the-art steam-methane-reforming (SMR) plant for the production of 100,000 Nm3/h of hydrogen has been considered. Hydrogen is produced from syngas by employing the pressure swing adsorption (PSA) technology, and the exiting tail gas is fed to the burners of the SMR unit, after removal of carbon dioxide. This work focuses on the design of the units for the treatment of the PSA tail gas by employing an aqueous solution of methyldiethanolamine (MDEA). Simulations have been performed with the commercial process simulator ASPEN Plus®, customized by the GASP group of Politecnico di Milano for best representing both the thermodynamics of the system and the mass transfer with reaction. For the scheme composed of the absorber and the regenerator, several column configurations have been considered, and the optimal solution, which minimizes the energy requirements of the plant, has been selected.
Introduction
The carbon capture and storage (CCS) technology has recently received great attention as a mitigation action for decreasing the environmental impact of energy conversion processes based on the use of fossil fuels. Another example of mitigation action includes the switch from a fossil fuel-based economy to an economy that relies on the use of renewable energy sources such as biomass, solar, and wind energies (Jäger-Waldau, 2007; Blanco, 2009; Nema et al., 2012; Schaber et al., 2012; Timilsina et al., 2012; Corsatea, 2014). However, given the current state of development of the latter ones, fossil fuels will continue to play an important role in the future, and as a result, actions such as CCS are worthy being investigated. In recent years, attention has also been paid to CO2 utilization, promoting the use of the expression “Carbon Capture, Storage, and Utilization” (CCSU) (Hasan et al., 2015).
In order to capture CO2, a number of processes are currently available, which can be categorized as follows: pre-combustion, post-combustion, and oxy-fuel combustion. A pre-combustion system consists of CO2 capture before the combustion step. In contrast, a post-combustion system consists of removing CO2 from flue gases after the combustion of fossil fuels in air has taken place (Alie et al., 2005; Rochelle, 2009; Moioli et al., 2019a,b). In oxy-fuel combustion, nearly pure oxygen is used for combustion instead of air, resulting in a flue gas that mainly consists of CO2 and H2O, which would allow using simpler post-combustion separation techniques (e.g., condensation) with significantly lower energy and capital costs. To cope with the demerits of other CCS technologies, the chemical looping combustion (CLC) process has also been recently considered as a solution for CO2 separation (De Guido et al., 2018).
Another possible integration of CCS is in a steam-methane-reforming (SMR)-based hydrogen plant. On a large industrial scale, SMR is the leading technology for H2 production from natural gas or light hydrocarbons, which involves a concurrent production of CO2 as a by-product (Rostrup-Nielsen and Rostrup-Nielsen, 2002; Riis et al., 2005). In particular, in this plant, CO2 can be captured from three possible locations: the shifted syngas, the PSA tail gas, and the SMR flue gas. Using aqueous solutions of methyldiethanolamine (MDEA) can be a possible method for removing carbon dioxide from these streams (Del Ben, 2018).
MDEA washing is certainly a well-established technology (Aroonwilas and Veawab, 2004), but it is well-known that the main drawback related to CO2 capture by amine absorption is due to the energy consumption for solvent regeneration (Pellegrini et al., 2019). This also applies when CO2 separation from natural gas is considered for producing either a pipeline-quality natural gas (De Guido et al., 2015) or liquefied natural gas (LNG) (Pellegrini et al., 2015b). Indeed, when the CO2 content exceeds 8–9 mol% (Langè et al., 2015), separation by means of chemical absorption into aqueous amine solutions becomes energy intensive and other types of technologies (e.g., low-temperature/cryogenic ones) can be considered valuable alternatives. This also applies when CO2 separation from biogas is considered for producing liquefied biomethane (Pellegrini et al., 2017), since biogas can be seen as a particular natural gas stream, characterized by a fixed composition (i.e., about 40 mol% CO2). Indeed, also for biogas upgrading, even if MDEA washing is more profitable than water scrubbing considering the same feedstock (Pellegrini et al., 2015a), it involves higher energy consumption (due to the heat needed for solvent regeneration and for CO2 pressurization, if considered) with respect to low-temperature technologies (Pellegrini et al., 2017).
Considering the integration of CCS in an SMR-based hydrogen plant and the energy-consumption-related issues associated with MDEA washing for CO2 capture, this work investigates the CO2 removal section for the treatment of the PSA tail gas, which can achieve a CO2 avoidance of 52% (IEAGHG, 2017) with additional energy consumption. The reference plant is the one presented in the IEAGHG technical report, which produces 100,000 Nm3/h of H2 using natural gas as feedstock and fuel. It includes the hydrogen plant, the cogeneration plant, the demi-water plant, and utilities and balance of plant (BOP) consisting of other systems (cooling water system, etc.).
The capture step, based on chemical absorption of CO2 into an MDEA aqueous solution, consists of an absorber, a flash unit, and a distillation column for solvent regeneration. Several column configurations have been taken into account. For each of them, a sensitivity analysis has been performed varying the CO2 lean loading, in order to determine the optimal configuration from an energy point of view, namely, the one that minimizes the energy required for solvent regeneration.
Methods
In the following, the model used in the simulations and the analysis procedure are outlined.
Model Used for Simulation
The analysis of the system has been carried out by using the commercial process simulator ASPEN Plus® V9.0 (AspenTech, 2016), which was previously user customized.
In particular, vapor-liquid equilibrium with chemical reactions generating ions in the liquid phase occurs and the system is strongly non-ideal. Its description can be well-accomplished by a γ/ϕ method, based on Electrolyte-NRTL (Chen et al., 1979, 1982; Chen and Evans, 1986; Mock et al., 1986) for the calculation of the activity coefficient in the liquid phase and on the Redlich-Kwong equation of state (Redlich and Kwong, 1949) for the calculation of the fugacity coefficient in the vapor phase.
The kinetics and mass transfer of reactions have also been considered in the simulation, and the performance of the columns has been determined on the basis of a rate-based approach. To this purpose, ASPEN Plus® V9.0 has been integrated with a homemade routine developed by the GASP group of Politecnico di Milano (Moioli et al., 2013).
Procedure Employed in This Study
The analysis, the results of which are presented in this work, involved the simulation of the CO2 capture section from the PSA tail gas for the reference plant previously reported. The following seven alternatives have been taken into account, which differ because of the internal configuration of the absorption column:
- case A: tray column with 51 four-pass valve trays;
- case B: tray column with 51 two-pass valve trays;
- case C: tray column with 21 four-pass valve trays;
- case D: tray column with 21 two-pass valve trays;
- case E: packed column with structured packing (Sulzer Mellapak Standard 250X);
- case F: tray column with 24 four-pass valve trays;
- case G: tray column with 24 two-pass valve trays.
Case E is the only one involving a packed column: for it, the structured Sulzer Mellapak Standard 250X packing has been chosen because of its excellence performance in columns with a diameter of up to 15 m as reported industrially (Mellapak, 2015) and because of its choice also in previous literature studies (Zhang and Rochelle, 2014; Moioli and Pellegrini, 2019). Indeed, it offers a low pressure drop and it can be used for a quite wide range of liquid loads. For the simulation of this case, 51 stages have been considered for the discretization of the column height.
As far as the other cases, which involve a tray column, are concerned, the choice of the tray type has been made on the basis of a previous work (Cassiano, 2015). The standard tray spacings of 0.60 m and 0.76 m have been considered, and the column dimensions have been selected taking into account the sizes provided in the report (IEAGHG, 2017). According to the available data, the internal diameter and the total height of the absorption column are, respectively, 3.399 and 20 m. The value of the column diameter has been checked in the simulations by means of the tool Tray Sizing available in ASPEN Plus® V9.0 (AspenTech, 2016): the result has been found to be in accordance with the one provided in the IEAGHG report.
Case A and case B refer to an absorber with a different height, selected on the basis of a previous work concerning CO2 removal by MDEA scrubbing applied to pre-combustion syngas purification (Cassiano, 2015).
A sensitivity analysis of the CO2 lean loading has been performed, varying it in a suitable range depending on the case study under investigation, with the aim of determining the value that minimizes the reboiler duty. For each value of the CO2 lean loading, the solvent flow rate has been varied in order to meet the design specification on the CO2 capture rate (i.e., 96.49%), which can be calculated on the basis of the data available in the report (IEAGHG, 2017), as explained in the next section.
In the following, the reference case and the data available for it and relevant to the analysis are described for the sake of clarity (section Reference Case). Then, more details are given about the simulations (section Simulations).
Reference Case
The flow sheet of the simulated CO2 capture section on the basis of the reference case study is shown in Figure 1, and the data on the main streams are reported in Table 1.

Figure 1. Flow sheet of the simulated CO2 capture system.
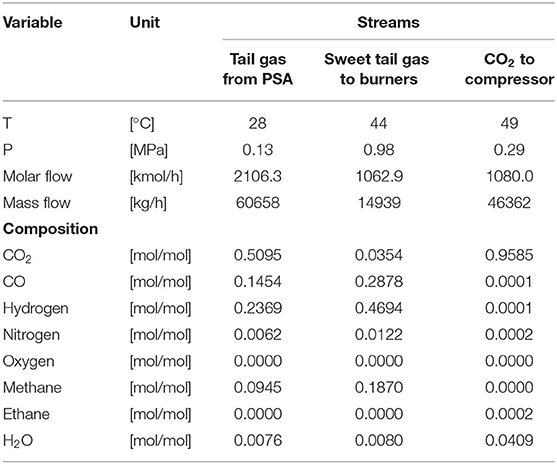
Table 1. Data on the main streams involved in the CO2 capture section studied in this work (IEAGHG, 2017).
The TAIL GAS stream, with a CO2 content of about 51 mol% on a wet molar basis, is initially compressed to 1.1 MPa, before being fed into the bottom of the absorption column (ABSORBER). Here, the CO2 in the gas stream is absorbed by contacting it counter-currently with the lean solvent fed at the top. The purified tail gas (GASOUT) that exits from the top of the absorber is characterized by a CO2 content of nearly 3.5 mol% on a wet molar basis. At the bottom of the absorption tower, the rich solvent is recovered and sent to the FLASH: the vapor outlet stream is sent to the burners to be employed as additional fuel in the steam reformer. In contrast, the liquid outlet stream, which is the rich solvent, is sent to the lean/rich heat exchanger, where it is heated up by the hot lean solvent coming from the reboiler of the solvent regeneration column (REGOCO21).
After being heated in the lean/rich heat exchanger, the hot rich solvent is fed into the top of the REGOCO21 for regeneration. This is accomplished by a counter-current contact with the vapor stream traveling upward, which is generated at the bottom reboiler, where low-pressure steam from the back-pressure steam turbine of the cogeneration plant is used as heating medium.
The gas stream leaving the top of the distillation column is sent to the condenser, where the steam present in the overhead gas is condensed, collected, and returned as reflux to the column. As for the CO2-rich gas exiting from the top condenser, it is delivered to the CO2 compression and dehydration unit.
From the data reported in Table 1, it is possible to calculate the CO2 capture rate according to Equation (1), where FCO2, GASIN and FCO2, GASOUT denote, respectively, the molar flow rate of CO2 in the gas streams entering and leaving the absorption column. Thus, the CO2 capture rate is 96.49%. It represents the target to be met in all the simulations described in the following section.
Simulations
Figure 1 illustrates the flow sheet of the CO2 capture section that has been simulated in ASPEN Plus® V9.0 (AspenTech, 2016).
The PSA tail gas (“TAIL GAS”) is compressed from 0.13 to 1.1 MPa before being fed into the bottom of the absorption column (ABSORBER). This value is different from the one reported in the IEAGHG report (i.e., 1 MPa), and this is due to the definition of the pressure profile in the absorber in the simulations: the pressure at the first stage from the top has been set equal to the pressure of the gas stream exiting the top of the absorber (i.e., 0.98 MPa, as reported in Table 1). When varying the solvent flow rate in the simulations in order to obtain the target CO2 absorption rate of 96.49% for each value of CO2 lean loading, for high values of the solvent flow rate, a high pressure was reached at the bottom of the absorber, higher than 1 MPa (i.e., the pressure of the PSA tail gas entering the bottom of the absorption column, according to the IEAGHG report). By setting the outlet pressure from the compression train at 1.1 MPa (rather than at 1 MPa), this has been avoided.
The data on the two streams entering the absorber are reported in Table 2. The conditions of the lean amine solvent stream (“LEANIN”) in terms of the temperature, pressure, and composition of the free MDEA solvent (composed only of MDEA and water) have been kept constant in this study in order to ensure comparison consistency. Obviously, its molar composition and flow rate vary in the sensitivity analysis of the CO2 lean loading, so that the target CO2 capture rate is always met. The composition of the lean solvent reported in Table 2 corresponds to an MDEA weight fraction of 0.5 and to a CO2 lean loading of 0.0203 mol CO2/mol MDEA.
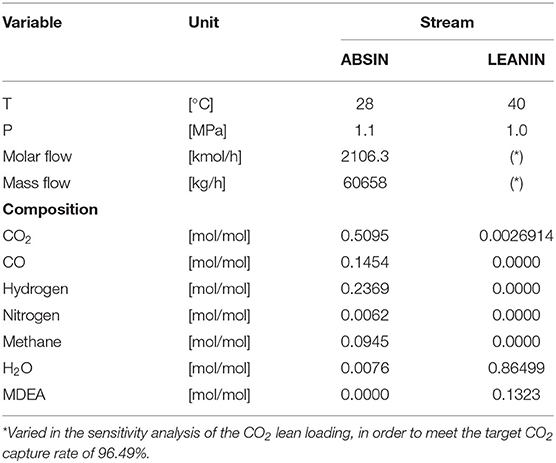
Table 2. Data on the PSA tail gas stream entering the absorber after compression (ABSIN in Figure 1) and on the lean amine solvent stream (LEANIN in Figure 1) (the composition of the lean solvent corresponds to an MDEA weight fraction of 0.5 and to a CO2 lean loading of 0.0203 mol CO2/mol MDEA).
The absorption tower has been simulated defining its internals depending on which of the seven case studies previously reported (see section Procedure Employed in This Study) is considered.
The rich solvent from the bottom of the absorption tower is sent to the separator (FLASH), which is operated at 74°C and 0.45 MPa. The liquid outlet stream (TOREG1) is sent to the lean/rich heat exchanger (CROSS1), in which the temperature approach between the hot outlet stream and the cold inlet stream has been set equal to 10°C, with the minimum temperature approach set equal to 5°C.
The pre-heated rich solvent (HOTREG1) is then fed at the top of the regeneration column (REGOCO21). It has been designed on the basis of the internal diameter and total height available in the IEAGHG report (IEAGHG, 2017) and making reference to a previous work (Cassiano, 2015) for what concerns the number of stages and internal type. The specifications and design parameters for the stripping column are reported in Table 3.
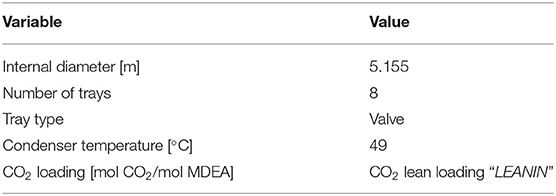
Table 3. Design parameters and specifications of the stripping column.
Taking into account the availability of cooling water at 25°C, it is assumed that the condenser works at 49°C (temperature of the stream “CO2 to compressor” in Table 1, named stream CO2REG1 in Figure 1). This specification ensures a CO2 concentration in the gas stream exiting the distillation column of 96 mol%.
The other specification required to simulate the stripping column refers to the CO2 apparent molar fraction in the regenerated solvent stream, which is equal to the CO2 apparent molar fraction in the lean solvent stream fed to the CO2 capture plant (namely, stream “LEANIN” in Figure 1).
The operating pressure has been set equal to 0.29 MPa, considering the available datum for the CO2 stream exiting from the top of the column (as reported in Table 1). A sensitivity analysis was actually performed also on this operating condition, by varying it in the range 0.1–0.3 MPa. However, the reboiler and condenser duties of the stripping column were found to vary only slightly with the regeneration pressure.
With reference to Figure 1, it is possible to define the CO2 lean loading (LL) and the CO2 rich loading (RL) according to Equations (2) and (3), respectively.
Results and Discussion
The results of the sensitivity analysis performed on the CO2 lean loading are illustrated in Figures 2–4 for case B, case E, and case G, respectively (they are representatives of the trends observed in the considered case studies), showing the effect on the most important process parameters, namely, the solvent flow rate, the CO2 rich loading, and the energy requirements. It is important to point out that while performing such analysis, the operating constraint on the CO2 rich loading should also be taken into account, considering that the maximum allowable value is in the range 0.7–0.8 [mol/mol] in the case of MDEA to avoid corrosion problems. Nevertheless, for all the examined cases, the investigated values of the CO2 lean loading have led to values of CO2 rich loading that are significantly lower than the upper operational limit (as shown in Figure 2B, in Figure 3B, and in Figure 4B). Therefore, for each of the examined configurations, the optimum CO2 lean loading can be identified on the basis of the minimization of the energy requirements only.
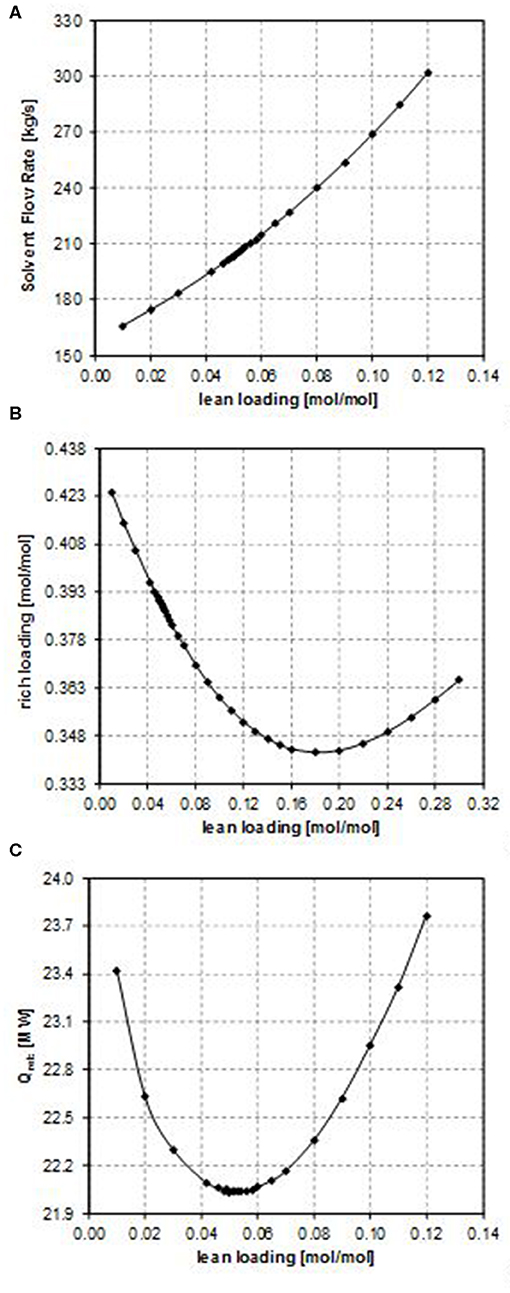
Figure 2. Effect of the CO2 lean loading on (A) the solvent flow rate, (B) the rich loading, and (C) the reboiler duty (case B).
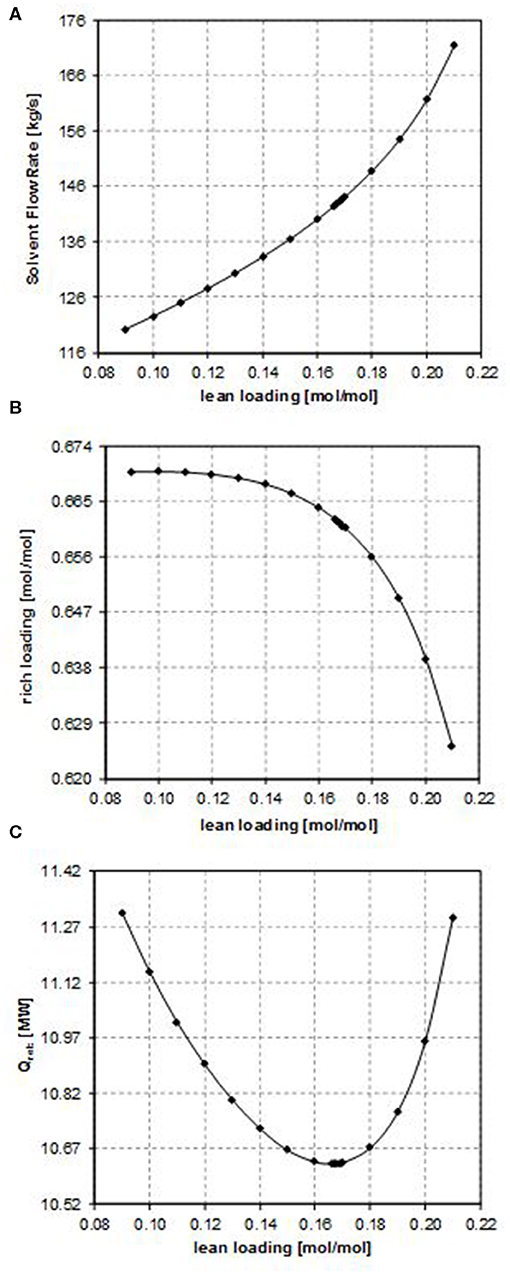
Figure 3. Effect of the CO2 lean loading on (A) the solvent flow rate, (B) the rich loading, and (C) the reboiler duty (case E).
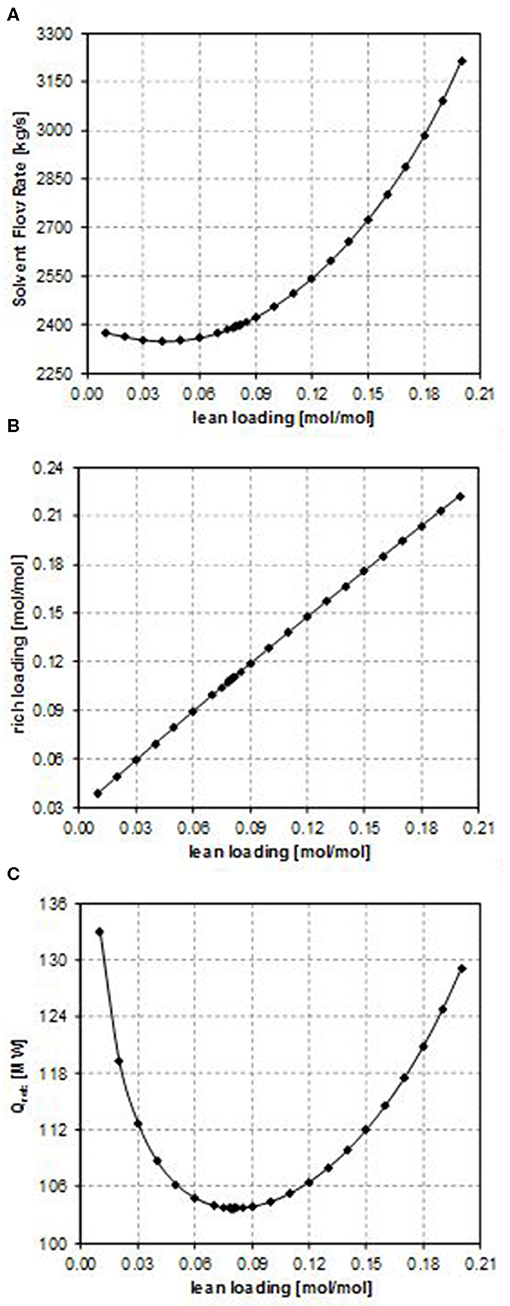
Figure 4. Effect of the CO2 lean loading on (A) the solvent flow rate, (B) the rich loading, and (C) the reboiler duty (case G).
Considering the influence of the CO2 lean loading on the solvent flow rate (as shown in Figure 2A, in Figure 3A, and in Figure 4A), obviously when increasing the CO2 lean loading, larger solvent flow rates are required to guarantee the same CO2 removal efficiency. Indeed, an increase in the LL results in a lower purity of the solvent, thus penalizing its absorption capacity. As a result, more solvent is required in order to capture the same amount of CO2.
If accounting for the influence of the CO2 lean loading on the CO2 rich loading, different trends result from the sensitivity analysis. The functional dependence of the RL on the LL is expressed by Equation (4).
Since the CO2 capture rate and the molar flow rate of CO2 in the inlet gas do not change in the sensitivity analysis and in all the considered case studies, the specific trend observed in Figure 2B, in Figure 3B, and in Figure 4B depends on the relative increase in the MDEA flow rate in the lean solvent with respect to the increase in the LL as the LL increases. This increase can be more or less relevant, thus providing different trends in Figure 2B, in Figure 3B, and in Figure 4B, on the type of the characteristics of the column considered, also because of the kinetics occurring in the system.
In particular, for case B, the rich loading presents a minimum (Figure 2B); for case E, it decreases though remaining within a small range (Figure 3B); and for case G, it monotonically increases as the lean loading increases (Figure 4B). These trends can be fully understood by considering Figures 5, 6. Indeed, as previously reported, the total flow rate generally increases as the lean loading increases. However, as can be outsourced from Figure 5, the mole fraction of MDEA in the solvent decreases (due to the higher amount of carbon dioxide), so at different values of LL, the trend of the flow rate of MDEA may be different from the one of the total amine flow rate. Considering that all the analyses are carried out with the same gaseous stream to be treated (so with a fixed amount of carbon dioxide entering the absorber) and with a constant % removal of carbon dioxide, it follows that only FMDEA, LEANIN varies in the second term of Equation (4) (named “adding group” in Figure 6). Therefore, since at different values of the lean loading different values of FMDEA, LEANIN occur, different values of the “adding group” also result. The rich loading, obtained as the sum of this term and the related lean loading, is then characterized by a specific trend depending on the considered case (Figure 6).
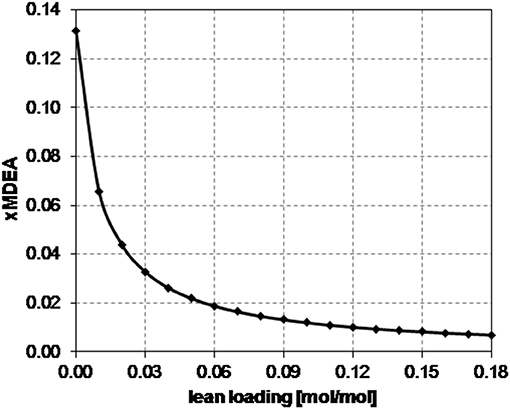
Figure 5. Effect of the CO2 lean loading on the mole fraction of MDEA in the solvent.
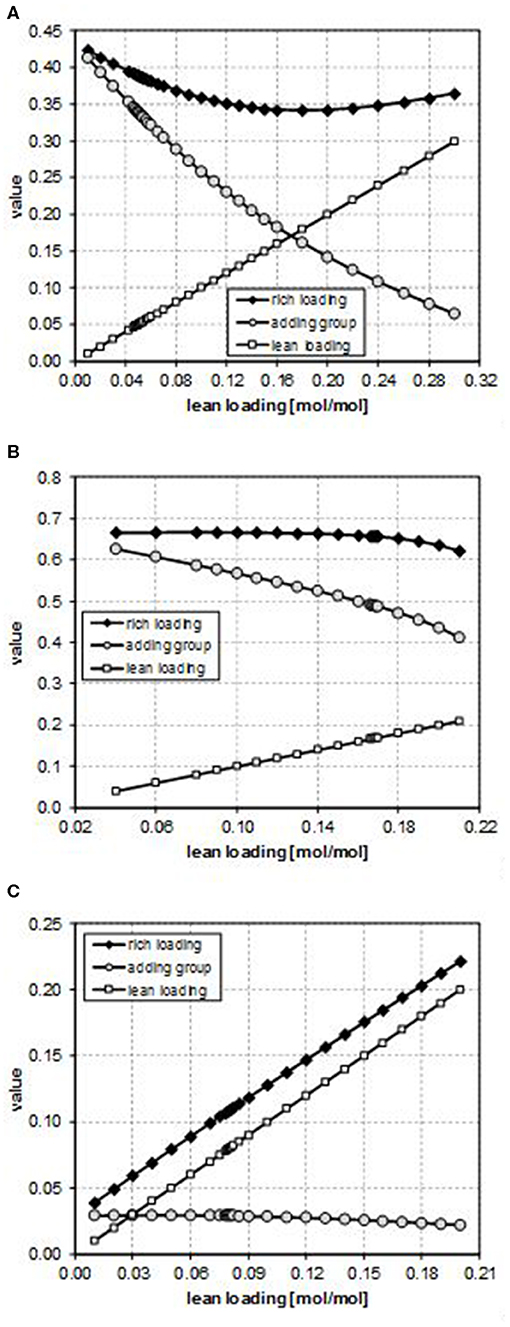
Figure 6. Effect of the CO2 lean loading on the second term (“adding group”) of Equation (4) for (A) case B, (B) case E, and (C) case G.
Finally, the dependence of the reboiler duty on the CO2 lean loading is discussed. Two factors affect this, namely, the sensible heat that has to be supplied to bring the solvent temperature to the reboiler temperature and the latent heat that must be supplied in order to vaporize the needed amount of the stripping agent in the regeneration column, provided that the heat needed to reverse the chemical reaction that occurred in the absorber is the same. At low values of the lean loading, a lower solvent flow rate is sufficient to reach the target CO2 capture rate, but a higher amount of the stripping agent is necessary in the regeneration column to strip more CO2 off. Therefore, the latent heat of vaporization plays a more important role. In contrast, at high values of the lean loading, as it increases, the solvent flow rate needed to reach the target CO2 capture rate also increases and more energy is required to heat it up to the desired temperature in the regeneration column, even if less stripping agent can be produced because less CO2 has to be stripped off. Therefore, the sensible heat plays a more important role in this case. For these reasons, a minimum in the reboiler duty as a function of the CO2 lean loading is observed (as shown in Figures 2C, 3C, 4C).
For each of the examined configurations, the optimum CO2 lean loading, which guarantees the minimum energy requirement, is reported in Table 4. It is possible to observe that the optimum CO2 lean loading obtained for case E is much higher than the one involved in all the other cases. This is a direct consequence of the fact that in this case, the absorber is a packed column, with different fluid dynamics (also influenced by the type of considered packing) and mass transfer occurring inside the unit. In addition, the number of theoretical stages is different from the one of the other cases with tray columns, thus exerting an influence on the total solvent flow rate needed to perform the CO2 removal and, thus, on the optimal lean loading.
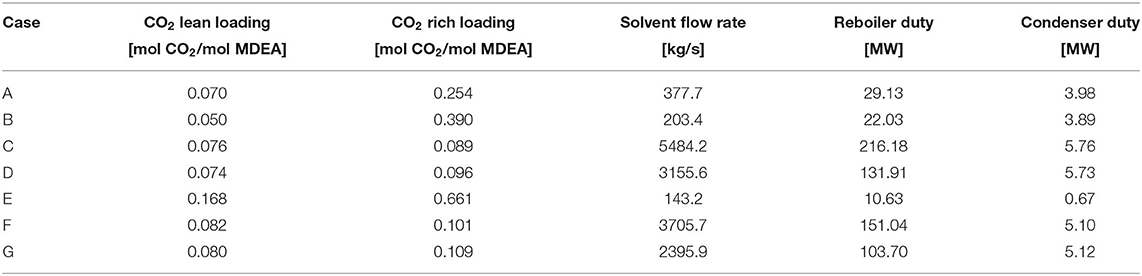
Table 4. Optimal operating conditions resulting from the lean loading sensitivity analysis.
Another important observation concerns the extremely high solvent flow rates required to reach the desired CO2 capture rate for case C, case D, case F, and case G. This is due to the fact that in these cases, the absorption column has been modeled as a tray column with a number of stages (respectively, 21 and 24) that is considerably lower than the one involved in case A and in case B (i.e., 51). For this reason, it has been necessary to significantly increase the solvent flow rate in order to push the CO2 removal from the gaseous stream to the target value.
When comparing all the investigates case studies, case E turns out to be the most convenient one from an energy point of view: indeed, the use of a packed absorption column rather than a tray column allows reaching the target CO2 capture rate using less solvent and requiring lower energy consumptions at the reboiler of the solvent regeneration column.
Conclusions
This work has focused on the study of a purification process for the CO2 removal from PSA tail gas within an SMR-based hydrogen plant, for which data are available in the literature. For this purpose, an aqueous solution of MDEA has been employed. Despite the advantages associated with this technology, it is fundamental to account for the fact that amine-based CO2 capture processes are generally quite energy intensive. Therefore, the application of this technology at a large scale is mainly subject to the optimization of the process energy performance, with the aim of specifically reducing the energy requirement at the reboiler of the regeneration column for the solvent purification.
To this aim, different configurations have been taken into account for the absorber, performing the simulations in ASPEN Plus® V9.0, integrated with a homemade routine developed by the GASP group of Politecnico di Milano. The different configurations differ for the type of column internals. A sensitivity analysis has been performed to investigate the effect of the lean loading on the reboiler duty, as well as on the rich loading and on the solvent flow rate required to meet the target CO2 capture rate of 96.49%. The lean loading, which provides the minimum reboiler duty, varies from 0.05 to 0.17 depending on the considered case. Kinetics and mass transfer influence the needed solvent flow rate, which, in turn, has an effect on the value of the rich loading, for which different trends result as the lean loading varies, each one specific for each configuration.
When comparing all the investigated case studies, the one that has turned out to be the most convenient one from an energy point of view is the case in which the absorber has been modeled as a packed column. Indeed, in such a case, because of the characteristics of the considered column, a lower solvent flow rate can be used to reach the target CO2 capture rate, requiring lower energy consumption at the reboiler of the solvent regeneration column.
Data Availability Statement
The raw data supporting the conclusions of this article will be made available by the authors, without undue reservation, to any qualified researcher.
Author Contributions
All authors listed have made a substantial, direct and intellectual contribution to the work, and approved it for publication.
Conflict of Interest
The authors declare that the research was conducted in the absence of any commercial or financial relationships that could be construed as a potential conflict of interest.
References
Alie, C., Backham, L., Croiset, E., and Douglas, P. L. (2005). Simulation of CO2 capture using MEA scrubbing: a flowsheet decomposition method. Energy Convers. Manag. 46, 475–487. doi: 10.1016/j.enconman.2004.03.003
Aroonwilas, A., and Veawab, A. (2004). Characterization and comparison of the CO2 absorption performance into single and blended alkanolamines in a packed column. Ind. Eng. Chem. Res. 43, 2228–2237. doi: 10.1021/ie0306067
Blanco, M. I. (2009). The economics of wind energy. Renew. Sust. Energy Rev. 13, 1372–1382. doi: 10.1016/j.rser.2008.09.004
Cassiano, C. (2015). Energy saving per la purificazione pre-combustione del syngas (M.Sc.thesis). Politecnico di Milano, Milan, Italy.
Chen, C. C., Britt, H. I., Boston, J. F., and Evans, L. B. (1979). Extension and application of the pitzer equation for vapor-liquid equilibrium of aqueous electrolyte systems with molecular solutes. AIChE J. 25, 820–831. doi: 10.1002/aic.690250510
Chen, C. C., Britt, H. I., Boston, J. F., and Evans, L. B. (1982). Local composition model for excess gibbs energy of electrolyte systems. Part I: single solvent, single completely dissociated electrolyte systems. AIChE J. 28, 588–596. doi: 10.1002/aic.690280410
Chen, C. C., and Evans, L. B. (1986). A local composition model for the excess gibbs energy of aqueous electrolyte systems. AIChE J. 32, 444–454. doi: 10.1002/aic.690320311
Corsatea, T. D. (2014). Technological capabilities for innovation activities across Europe: evidence from wind, solar and bioenergy technologies. Renew. Sust. Energy Rev. 37, 469–479. doi: 10.1016/j.rser.2014.04.067
De Guido, G., Compagnoni, M., Pellegrini, L. A., and Rossetti, I. (2018). Mature versus emerging technologies for CO2 capture in power plants: key open issues in post-combustion amine scrubbing and in chemical looping combustion. Front. Chem. Sci. Eng. 12, 315–325. doi: 10.1007/s11705-017-1698-z
De Guido, G., Langè, S., and Pellegrini, L. A. (2015). Refrigeration cycles in low-temperature distillation processes for the purification of natural gas. J. Nat. Gas Sci. Eng. 27, 887–900. doi: 10.1016/j.jngse.2015.09.041
Del Ben, L. (2018). Study of Energy Saving Configurations in the CO2 Removal Section of a SMR-based H2 Plant. MsC Thesis, Politecnico di Milano, Milano, Italy.
Hasan, M. F., First, E. L., Boukouvala, F., and Floudas, C. A. (2015). A multi-scale framework for CO2 capture, utilization, and sequestration: CCUS and CCU. Comput. Chem. Eng. 81, 2–21. doi: 10.1016/j.compchemeng.2015.04.034
IEAGHG (2017). Techno-Economic Evaluation of SMR Based Standalone (Merchant) Hydrogen Plant With CCS. IEAGHG Report No. 2017-02: IEA Greenhouse Gas R&D Programme.
Jäger-Waldau, A. (2007). Photovoltaics and renewable energies in Europe. Renew. Sust. Energy Rev. 11, 1414–1437. doi: 10.1016/j.rser.2005.11.001
Langè, S., Pellegrini, L. A., Vergani, P., and Lo Savio, M. (2015). Energy and economic analysis of a new low-temperature distillation process for the upgrading of high-CO2 content natural gas streams. Ind. Eng. Chem. Res. 54, 9770–9782. doi: 10.1021/acs.iecr.5b02211
Mellapak (2015). MellapakBrochure, Structured Packings - Energy-Efficient, Innovative and Profitable. Available online at: https://www.sulzer.com/-/media/files/products/separation-technology/liquid_liquid_extraction/brochures/structured_packings.ashx
Mock, B., Evans, L. B., and Chen, C. C. (1986). Thermodynamic representation of phase equilibria of mixed-solvent electrolyte systems. AIChE J. 32, 1655–1664. doi: 10.1002/aic.690321009
Moioli, S., Ho, M. T., Wiley, D. E., and Pellegrini, L. A. (2019a). Assessment of carbon dioxide capture by precipitating potassium taurate solvent. Int. J. Greenhouse Gas Control 87, 159–169. doi: 10.1016/j.ijggc.2019.05.013
Moioli, S., and Pellegrini, L. (2019). Design of a CO2 removal section treating very high flue gas flowrates. Chem. Eng. Trans. 74, 859–864. doi: 10.3303/CET1974144
Moioli, S., Pellegrini, L. A., Ho, M. T., and Wiley, D. E. (2019b). A comparison between amino acid based solvent and traditional amine solvent processes for CO2 removal. Chem. Eng. Res. Des. 146, 509–517. doi: 10.1016/j.cherd.2019.04.035
Moioli, S., Pellegrini, L. A., Picutti, B., and Vergani, P. (2013). Improved rate-based modeling of H2S and CO2 removal by methyldiethanolamine scrubbing. Ind. Eng. Chem. Res. 52, 2056–2065. doi: 10.1021/ie301967
Nema, P., Nema, S., and Roy, P. (2012). An overview of global climate changing in current scenario and mitigation action. Renew. Sust. Energy Rev. 16, 2329–2336. doi: 10.1016/j.rser.2012.01.044
Pellegrini, L. A., De Guido, G., Consonni, S., Bortoluzzi, G., and Gatti, M. (2015a). From biogas to biomethane: how the biogas source influences the purification costs. Chem. Eng. Trans. 43, 409–414. doi: 10.3303/CET1543069
Pellegrini, L. A., De Guido, G., and Langé, S. (2017). Biogas to liquefied biomethane via cryogenic upgrading technologies. Renew. Energy 124, 75–83. doi: 10.1016/j.renene.2017.08.007
Pellegrini, L. A., De Guido, G., and Valentina, V. (2019). Energy and exergy analysis of acid gas removal processes in the LNG production chain. J. Nat. Gas Sci. Eng. 61, 303–319. doi: 10.1016/j.jngse.2018.11.016
Pellegrini, L. A., Langè, S., Baccanelli, M., and De Guido, G. (2015b). “Techno-economic analysis of LNG production using cryogenic vs conventional techniques for natural gas purification,” in Offshore Mediterranean Conference and Exhibition. Offshore Mediterranean Conference (Ravenna).
Redlich, O., and Kwong, J. N. S. (1949). On the thermodynamics of solutions. V: an equation of state. fugacities of gaseous solutions. Chem. Rev. 44, 233–244. doi: 10.1021/cr60137a013
Riis, T., Hagen, E. F., Vie, P. J., and Ulleberg, Ø. (2005). Hydrogen Production and Storage- R&D Priorities and Gaps. International Energy Agency (IEA).
Rochelle, G. T. (2009). Amine scrubbing for CO2 capture. Science 325, 1652–1654. doi: 10.1126/science.1176731
Rostrup-Nielsen, J. R., and Rostrup-Nielsen, T. (2002). Large-scale hydrogen production. CATTECH 6, 150–159. doi: 10.1023/A:1020163012266
Schaber, K., Steinke, F., Mühlich, P., and Hamacher, T. (2012). Parametric study of variable renewable energy integration in Europe: advantages and costs of transmission grid extensions. Energy Policy 42, 498–508. doi: 10.1016/j.enpol.2011.12.016
Timilsina, G. R., Kurdgelashvili, L., and Narbel, P. A. (2012). Solar energy: markets, economics and policies. Renew. Sust. Energy Rev. 16, 449–465. doi: 10.1016/j.rser.2011.08.009
Zhang, Y., and Rochelle, G. T. (2014). Absorber performance with high CO2. Energy Proc. 63, 1329–1338. doi: 10.1016/j.egypro.2014.11.142
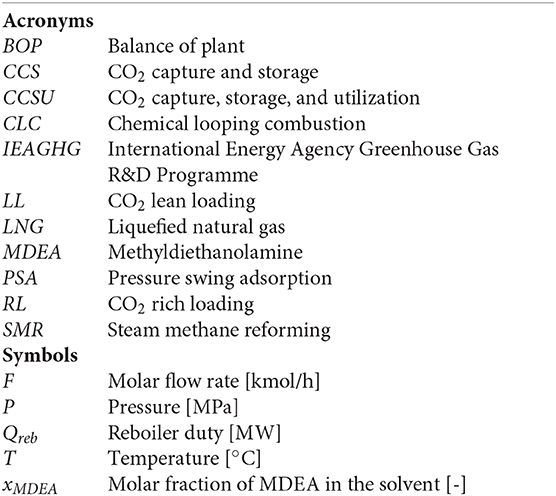
Nomenclature
Keywords: CO2, CCS, SMR, hydrogen plant, PSA tail gas, MDEA
Citation: Pellegrini LA, De Guido G and Moioli S (2020) Design of the CO2 Removal Section for PSA Tail Gas Treatment in a Hydrogen Production Plant. Front. Energy Res. 8:77. doi: 10.3389/fenrg.2020.00077
Received: 10 December 2019; Accepted: 14 April 2020;
Published: 27 May 2020.
Edited by:
Nannan Sun, Shanghai Advanced Research Institute (CAS), ChinaReviewed by:
Hasmukh A. Patel, Aramco Services Company, United StatesKun Yu, Globalfoundries, United States
Copyright © 2020 Pellegrini, De Guido and Moioli. This is an open-access article distributed under the terms of the Creative Commons Attribution License (CC BY). The use, distribution or reproduction in other forums is permitted, provided the original author(s) and the copyright owner(s) are credited and that the original publication in this journal is cited, in accordance with accepted academic practice. No use, distribution or reproduction is permitted which does not comply with these terms.
*Correspondence: Stefania Moioli, stefania.moioli@polimi.it