A Microbial Screening in Silico Method for the Fitness Step Evaluation in Evolutionary Algorithms


Department of Biodiversity, Ecology and Evolution (Biomathematics), Faculty of Biological Sciences c/Jose Antonio Novais 2, Complutense University of Madrid, 28040 Madrid, Spain
*
Author to whom correspondence should be addressed.
Appl. Sci. 2020, 10(11), 3936; https://doi.org/10.3390/app10113936
Submission received: 20 April 2020
/
Revised: 15 May 2020
/
Accepted: 22 May 2020
/
Published: 5 June 2020
(This article belongs to the Section Computing and Artificial Intelligence)
Abstract
:One of the most delicate stages of an evolutionary algorithm is the evaluation of the goodness of the solutions by some procedure providing a fitness value. However, although there are general rules, it is not always easy to find an appropriate evaluation function for a given problem. In the biological realm, today, there is a variety of experimental methods under the name of microbial screening to identify and select bacteria from their traits, as well as to obtain their fitness. In this paper, we show how given an optimization problem, a colony of synthetic bacteria or bacterial agents is able to evaluate the fitness of candidate solutions by building an evaluation function. The evaluation function is obtained simulating, in silico, a bacterial colony conducting the laboratory methods used in microbiology, biotechnology and synthetic biology to measure microbial fitness. Once the evaluation function is built, it is included in the code of the genetic algorithm as part of the fitness routine. The practical use of this approach is illustrated in two classic optimization problems. In silico routines have been programmed in Gro, a cell programming language oriented to synthetic biology, and can easily be customized to many other optimization problems.
1. Introduction
Genetic algorithms (GAs) were introduced by Holland [1] and popularized by Goldberg [2], representing at present one of the most popular optimization techniques in the field of Artificial Intelligence (AI). A GA is a stochastic optimization method inspired by the principles of natural selection [3] stated by Darwin’s evolutionary theory in 1859. The search for the optimum is carried out through the simulation of the survival of the most valid solutions or “individuals” in an environment or "problem space". For three decades now, GAs have been used in optimization and search problems, with many applications in engineering, market research, operations development, biology, sociology, game theory, computer science, etc. [4].
A GA comprises the following steps [5]. (a) The algorithm begins (t = 0) randomly generating a set of solutions (individuals). (b) Afterwards, these solutions are evaluated, and are scored according to the goodness of the solutions (environmental adaptation), obtaining a fitness value. (c) Next, selection is conducted, i.e., those solutions with the highest fitness value will have the highest probability of surviving, and therefore of reproducing by passing one or more copies to the next generation (gene propagation). (d) Subsequently, the solutions passing to the next generation (t + 1) are modified through genetic mechanisms. The solutions are encoded in strings or vectors mimicking chromosomes, and sub-strings representing the genes for which the sequence is changed. These variations are the result of mutations and/or genetic crossover, mechanisms that are present in the organisms and simulated in the GAs via genetic operators. (e) Finally, and with the new population of solutions, steps (b)–(d) are repeated, over and over again, until an optimal solution is found.
However, GA’s ability to successfully solve an optimization problem depends largely on a problem-specific procedure to obtain a fitness value of the solutions. In accordance with Reference [6], we have to distinguish when a GA is used in an artificial life model or is applied in order to solve a practical problem, e.g., in engineering. In the first case, the fitness of an agent, e.g., a virtual ant, digital organism, robot, etc., is given by its execution and interaction with the environment; whereas, in the second situation, a fitness function, i.e., an objective or evaluation function, is required to get the individual fitness. In the latter case, the evaluation function will use the values coded in the chromosome as a function argument. Usually, each optimization problem has its own fitness function, although there are some general rules. There are classic optimization problems, such as MAXONE, knapsack problem, scheduling, etc., where the fitness function is known. In other problems, for instance in classification problems, the fitness function can be obtained from error measurements. Likewise, in problems where we have information about the evolutionary surface, and therefore constraints, the fitness is calculated with the inverse of the sum of the variables. Similarly, in design problems and in multiobjective problems, the fitness is provided by cost and Pareto functions respectively, etc. Nevertheless, despite these general rules, finding a good procedure for calculating the fitness constitutes part of the state-of-the-art in the designing process of a GA.
At present, evolutionary experiments with microorganisms, and in particular with bacteria, are a common practice in microbiology, biotechnology and synthetic biology. In these experiments with bacteria, one of the decisive stages is the evaluation of fitness [7]. However, the most common methods of measuring bacterial fitness in the laboratory involve the same kind of bacterial features that are used for their screening, i.e., its identification and isolation. Usually, the classical screening methods are based on some physiological traits of bacteria. Bacterial screening is based on both static features, e.g., shape, Gram-staining, and dynamic traits, e.g., motility, antibiotic resistance, enzyme expression, growth rate, etc. Based on some of these traits, microbial fitness is evaluated by applying different experimental strategies. For example, fitness measures can be obtained from the Malthusian growth rate estimated from the bacterium growth curve [8], or from the cost to bacteria of being resistant to antibiotics [9]. Nevertheless, there are more elaborated methods for calculating bacterial fitness. For example, the authors of Reference [10] calculate fitness from the difference between the cost and benefit resulting from the level of expression of a protein in the Lac operon.
Over the last few decades, synthetic biology [11,12] has made it possible to design microorganisms that behave like a computer. In this paper, we show how synthetic biology could be a source of inspiration for the design of some steps in evolutionary algorithms. Nowadays, advances in synthetic biology have allowed the programming of bacteria in order for these organisms to carry out specific tasks. It is assumed that bacteria are agents [13], which, once programmed, receive a physical or chemical input, process it at a biochemical level under genetic control, and provide an output.
In evolutionary computing, there are evolutionary algorithms in which a human individual carries out the evaluation and selection of individuals, i.e., solutions. These kinds of algorithms are referred to as interactive evolutionary or aesthetic selection algorithms. In this paper, we introduce a different approach. We show how a colony of synthetic bacteria or bacterial agents is able to indirectly evaluate the fitness of solutions in a genetic algorithm by building an evaluation function. The evaluation function is obtained by simulating a bacterial colony in silico, emulating the laboratory methods used in microbiology, biotechnology and synthetic biology to measure microbial fitness. Once the evaluation function is found, it is included in the code of the genetic algorithm as part of the fitness routine. In silico routines have been implemented in Gro, a cell programming language [14,15,16] oriented to simulation experiments in synthetic biology. The usefulness of the procedure is illustrated in two classic optimization problems. The scripts of the designed routines are available (Supplementary Material) [17] and can be easily customized to many other optimization problems.
Microbial screening are laboratory methods for the detection of specific features in microorganisms, for example, bacteria. In summary, we design in silico routines simulating colonies of synthetic bacteria. Based on bacterial colonies, we emulate their homologues in vivo, conducting those experimental laboratory protocols developed to measure microbial fitness in silico. Using such procedures, which are referred to in the laboratory as screening methods, it is possible to obtain an evaluation function and then evaluate the candidate solutions in a genetic algorithm.
2. Materials and Methods
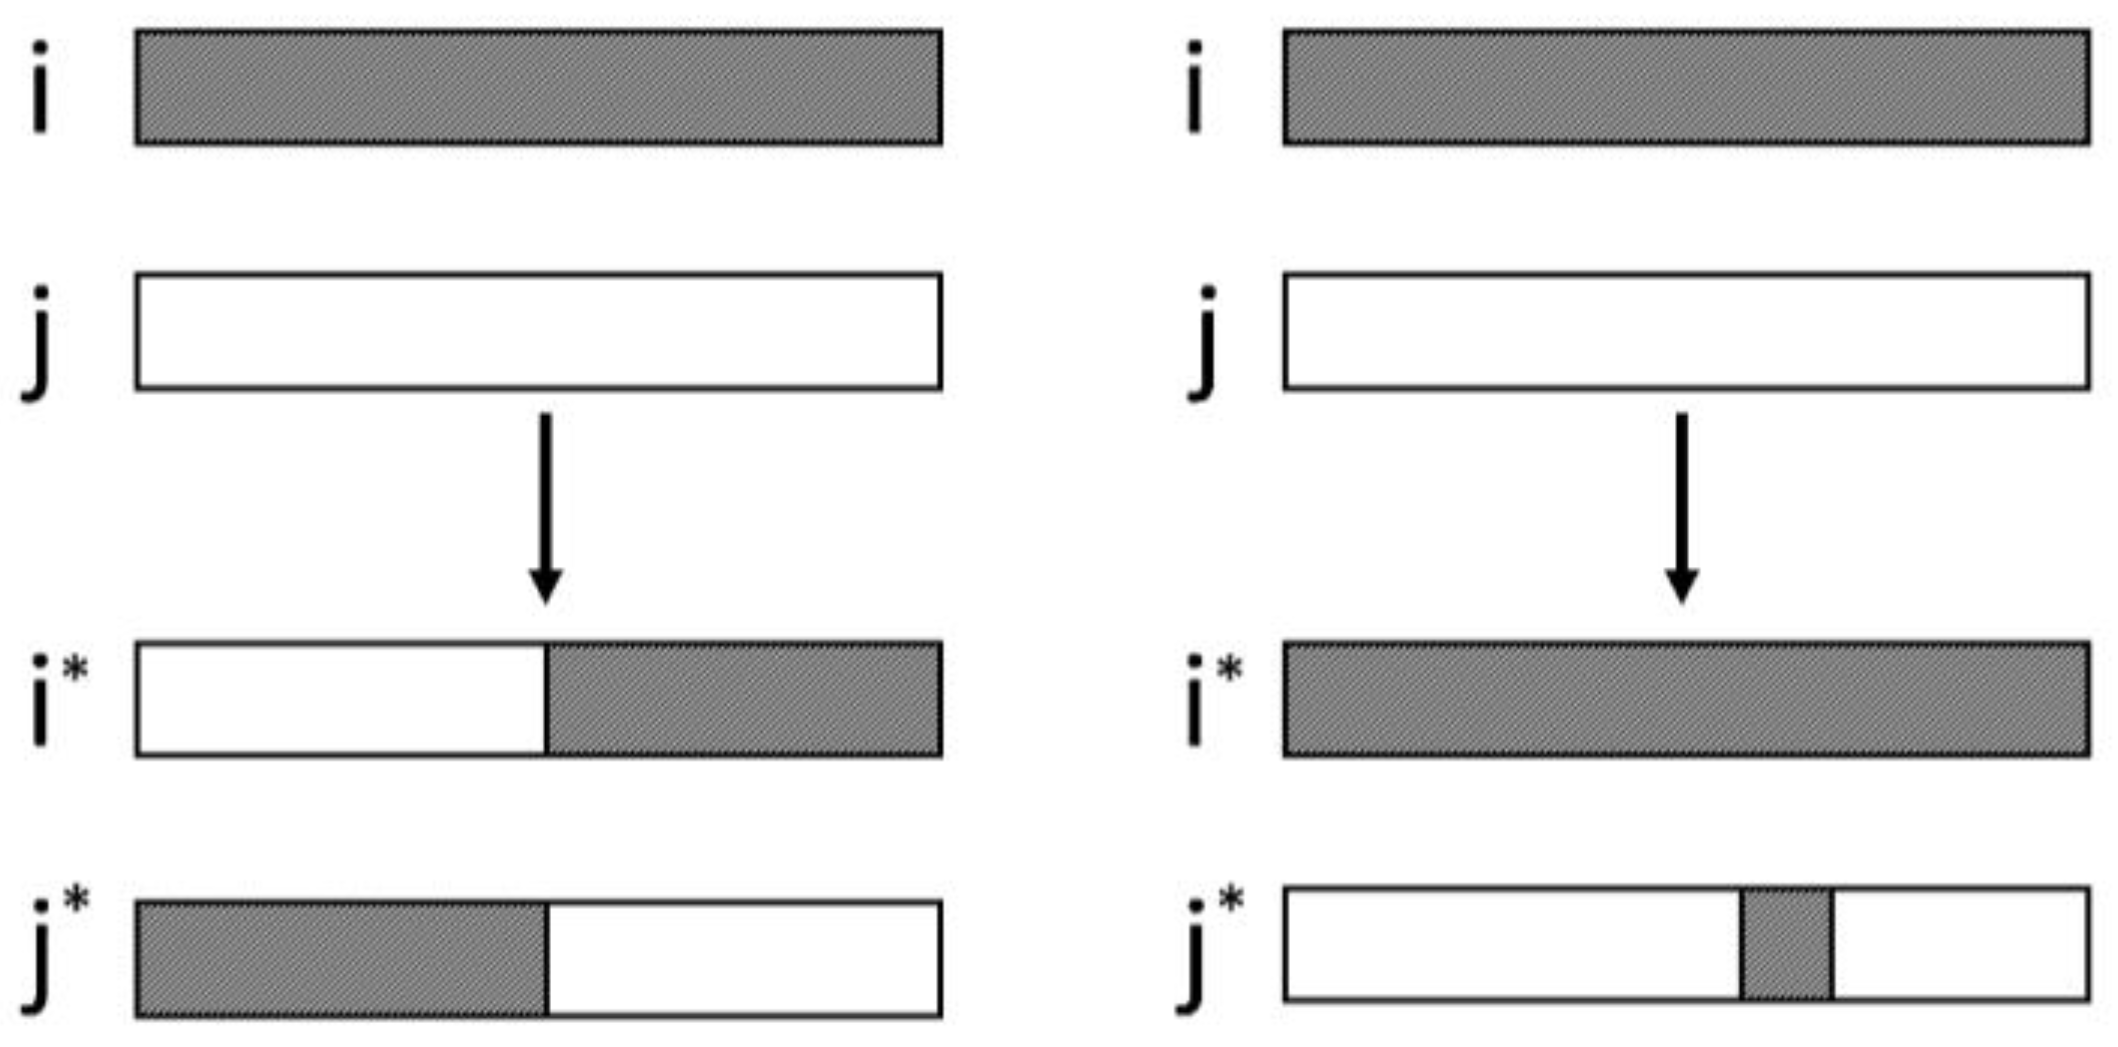
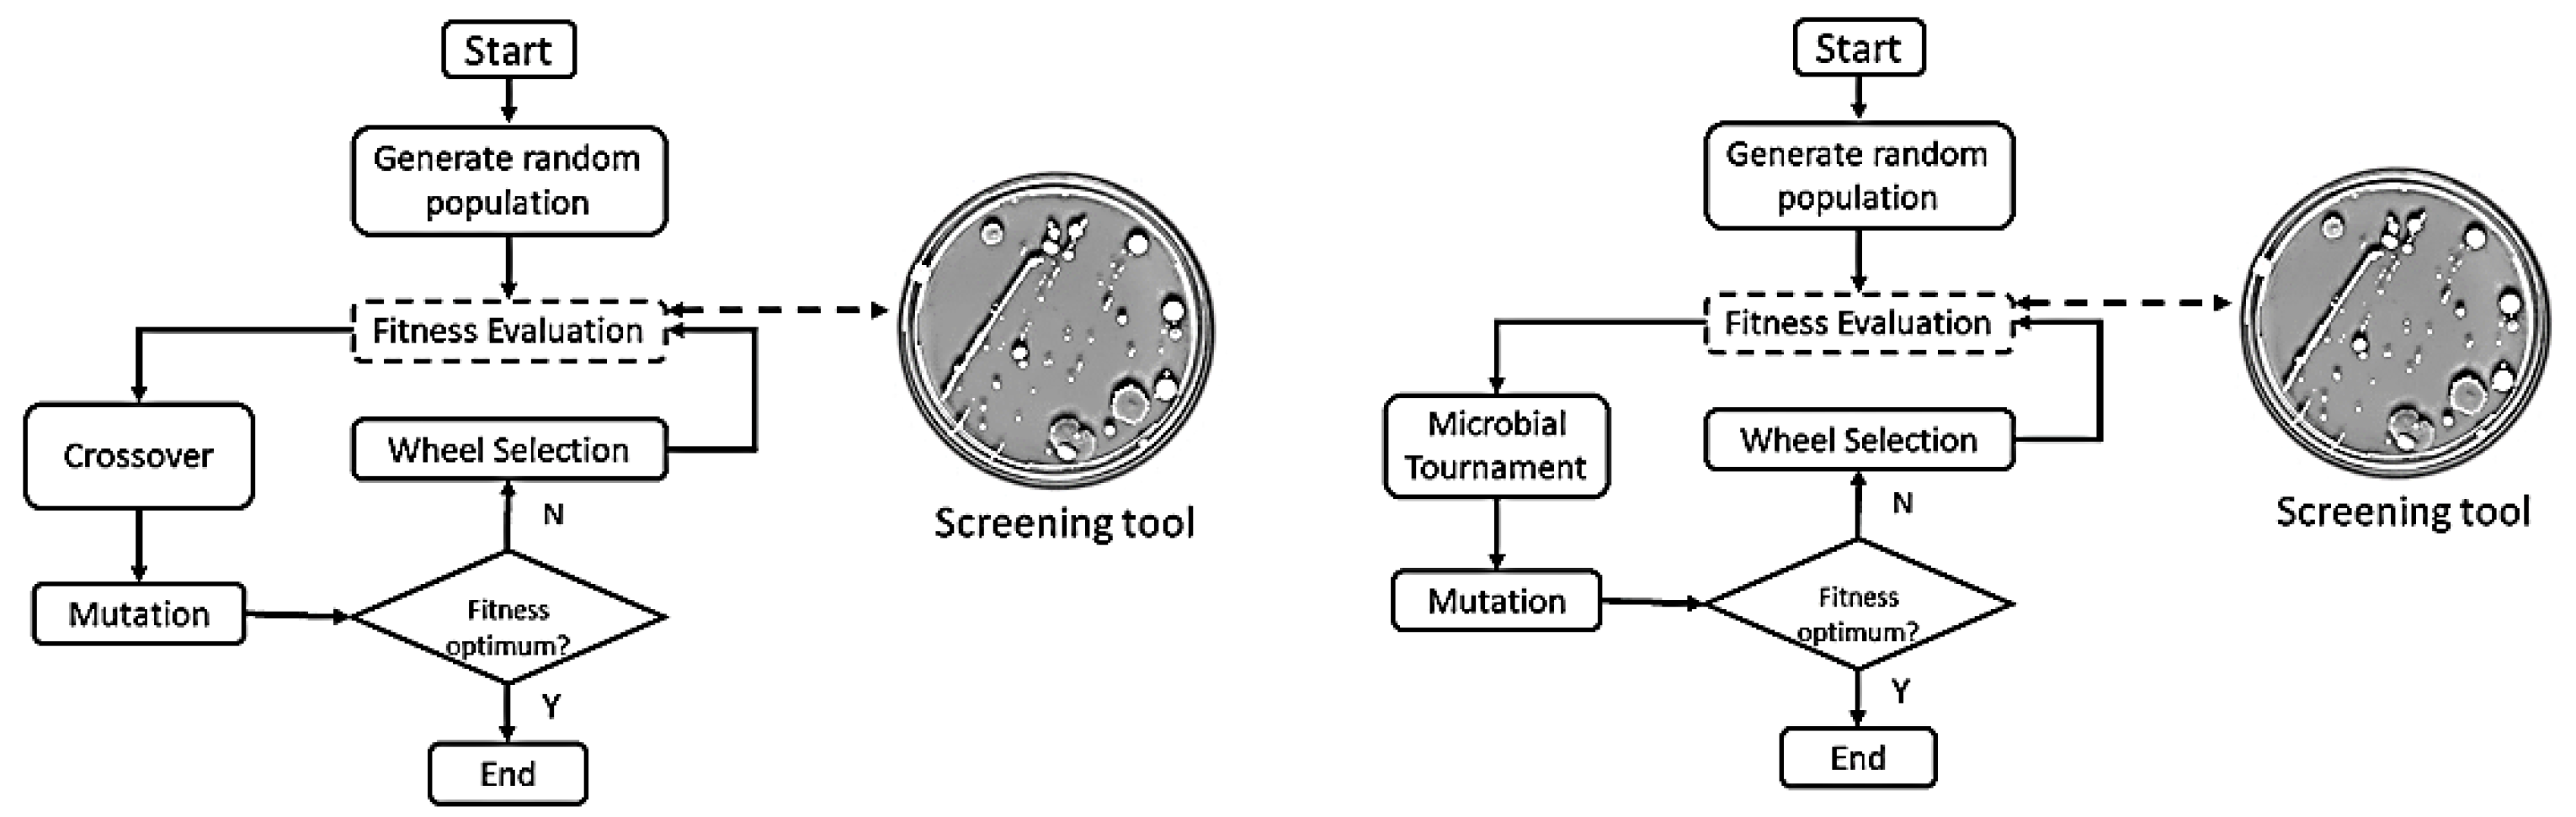
In the present work, we solved two optimization problems with evolutionary algorithms, with the novelty that the evaluation functions were designed by colonies of synthetic bacteria. In order to study their reliability in the evaluation fitness step, the evaluation functions were included in the code of two evolutionary algorithms: a Simple Genetic Algorithm (SGA) [18] and a Simple Microbial-Genetic Algorithm (SMGA). The latter algorithm [19] includes a microbial tournament operator (Figure 1). It is a special type of crossover in which the individuals are selected in pairs, their fitness values are compared and the highest fitness individual passes a copy of a randomly selected segment to the worst evaluated individual. In this paper, we found it of interest to perform experiments with the SMGA algorithm, since recombination is somewhat more similar to the mechanism of bacterial conjugation than single-point recombination of the SGA.
As mentioned above, the main contribution of this work was that in both evolutionary algorithms (Figure 2), the fitness function was obtained externally by a colony of synthetic bacteria. Bacteria are agents that were programmed in a cellular programming language, in particular, Gro 4.0 [14], incorporating the resulting fitness functions into the code of the evolutionary algorithms.
Using Gro language, we coded the scripts of the in silico microbial screening procedures and the main synthetic bacteria features. The bacterial colony executes a program written in this language parallel to each bacterium, allowing the collective colony behaviors to be explored from individual cell specifications. Specifically, the simulator can model different biological phenomena, such as cell division, chemotaxis and signal diffusion, among other physiological phenomena [14,15]. An extended version of Gro has recently been published allowing the design and recombination of plasmids [16]. Although the former feature is not used in our simulation experiments, we have used this version because the execution of the scripts is slightly faster than the original version of Gro.
2.1. Microbial Screening Methods in Silico: Procedures and Implementation
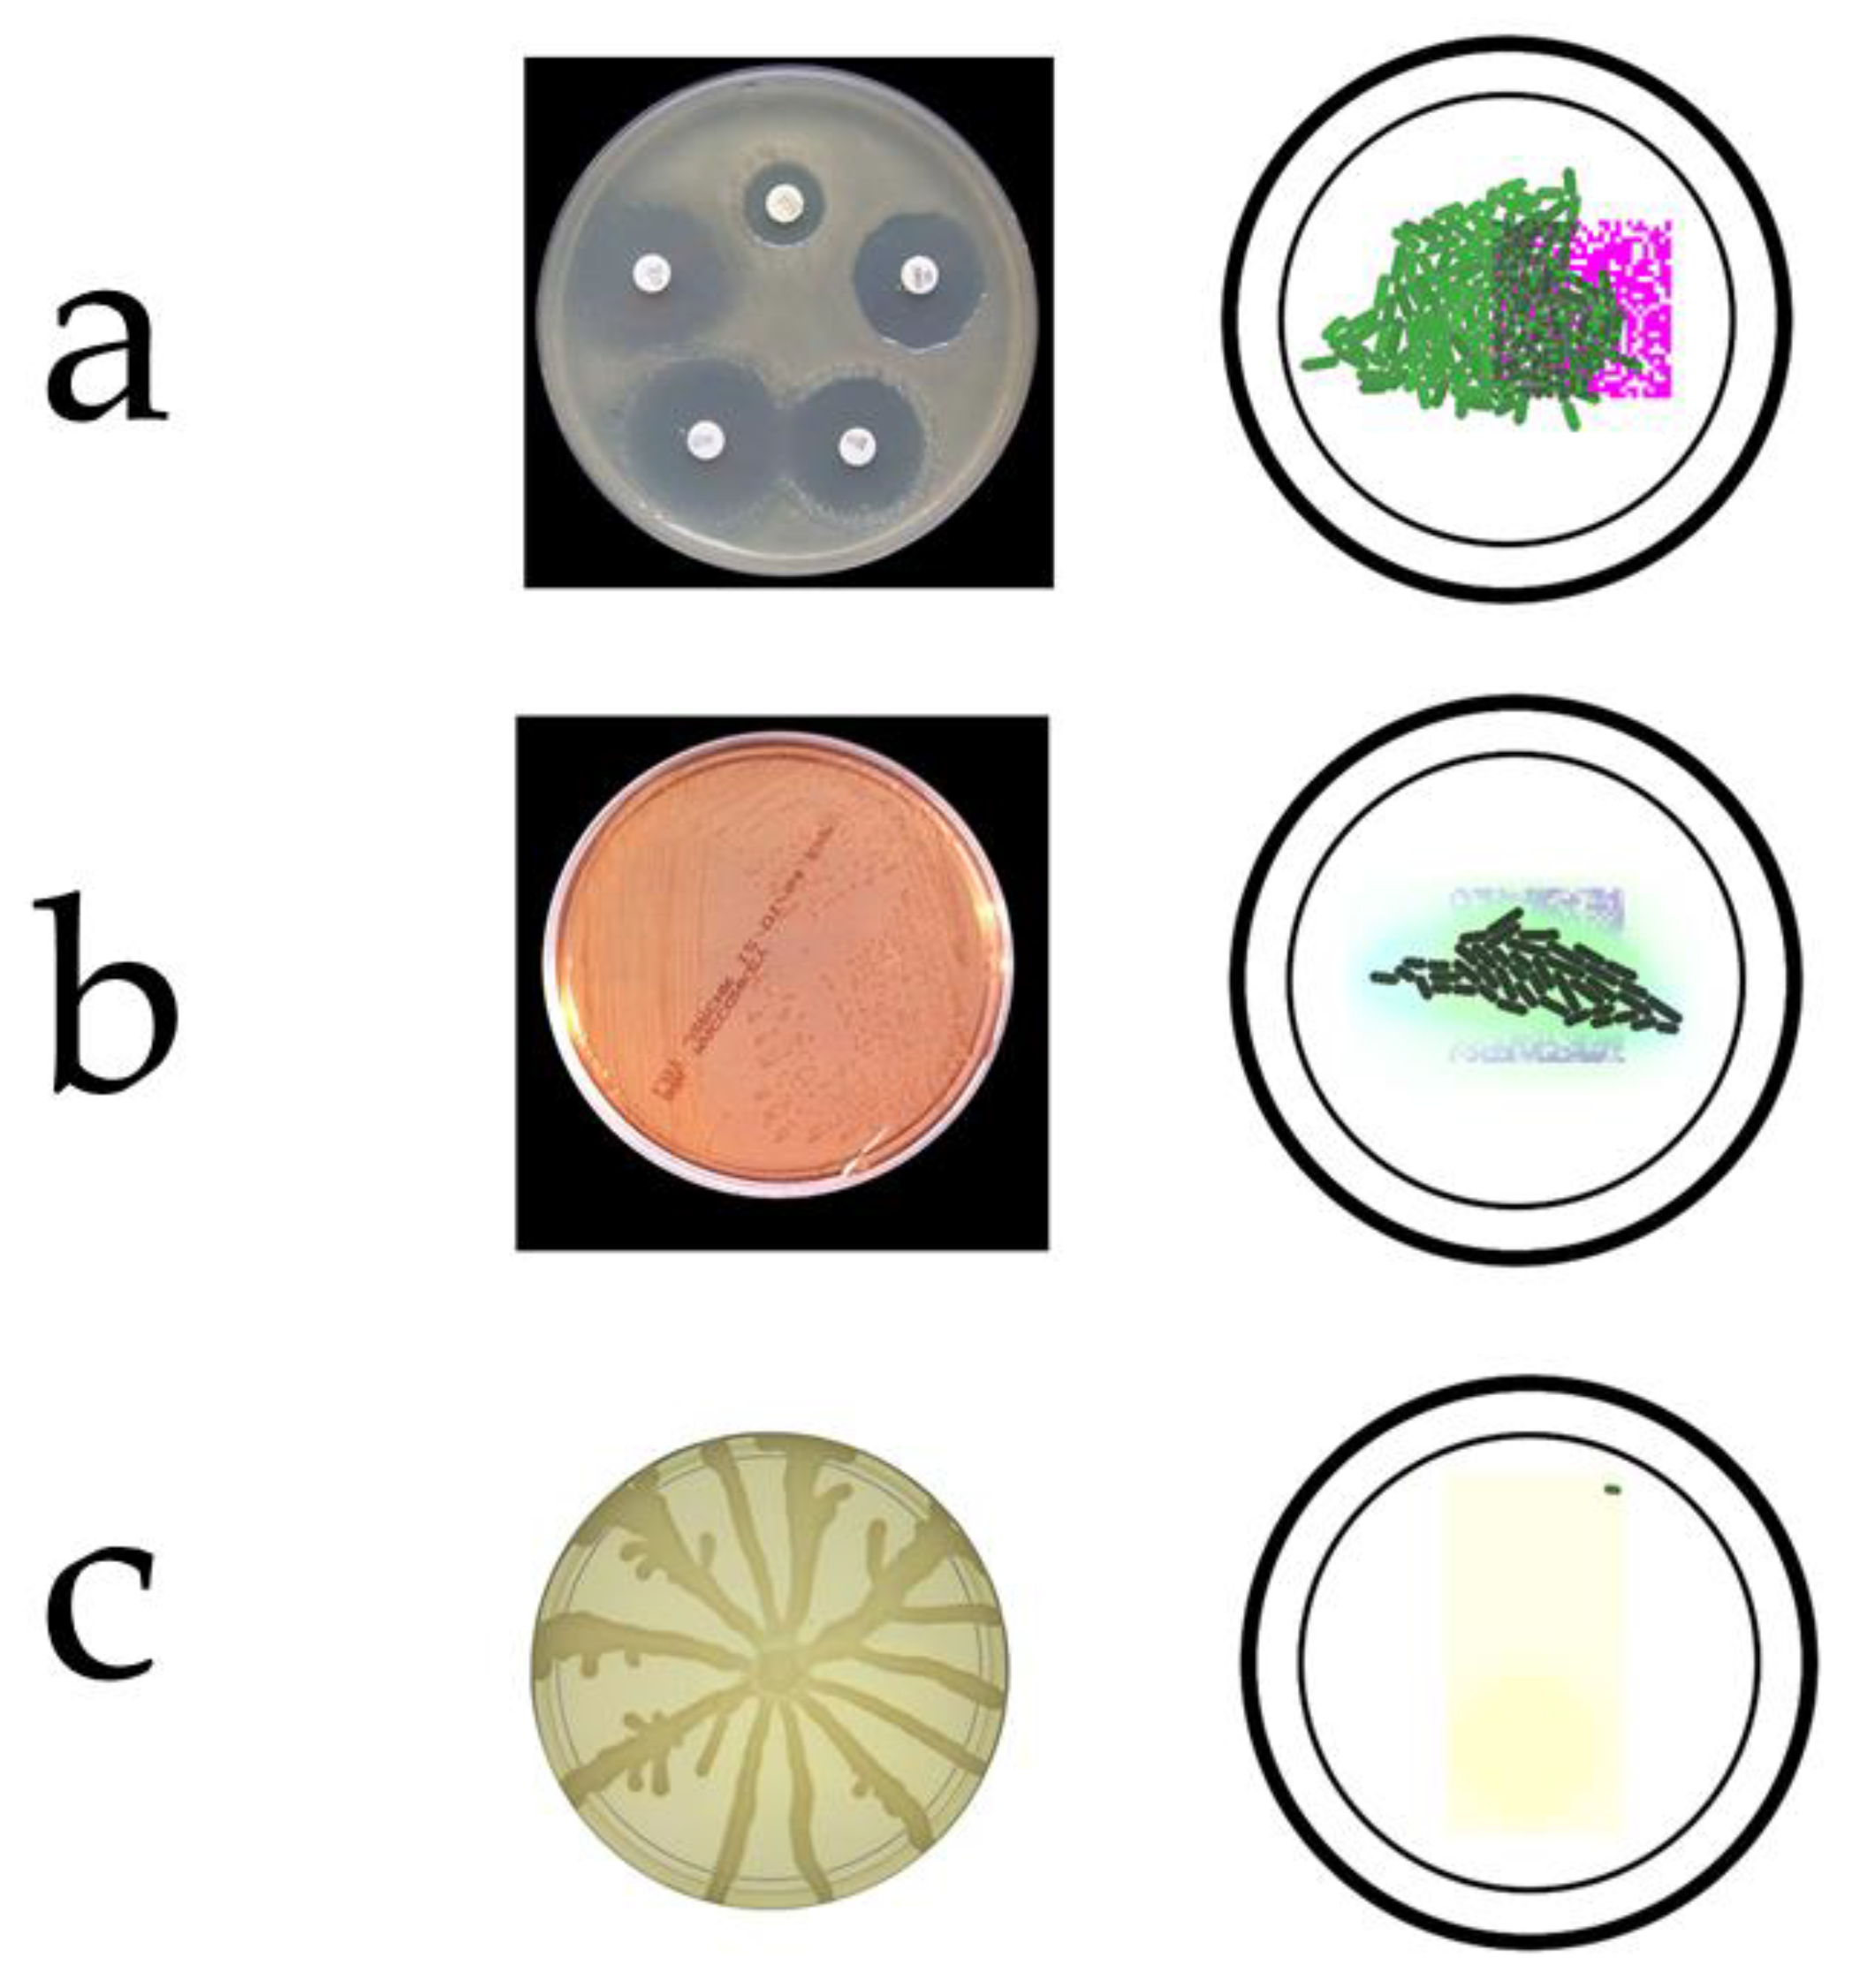
Microbial screening procedures in silico are algorithms simulating biological mechanisms and experimental protocols that are usually applied in the wet lab. In order for a screening routine to be capable of detecting and evaluating the fitness of a given candidate solution, we will need a feature which value increases according to the suitability of the solution. In our case, the size of the colony (i.e., the number of synthetic bacteria), the total expression of a reporter protein, e.g., green fluorescent protein (GFP), etc. In this work, we designed three screening procedures (Figure 3) based on the following bacterial features: (a) bacterial resistance to an antibiotic, (b) processing of lactose (i.e., bacteria use this sugar as an energy source) by Lac operon and (c) chemotaxis, i.e., the ability of bacteria to move to a food source or other attractive substance.
In the following, we describe the basis of the three screening routines, whereas the details of the scripts, i.e., their implementation in the Gro language, are described in the Appendix A:
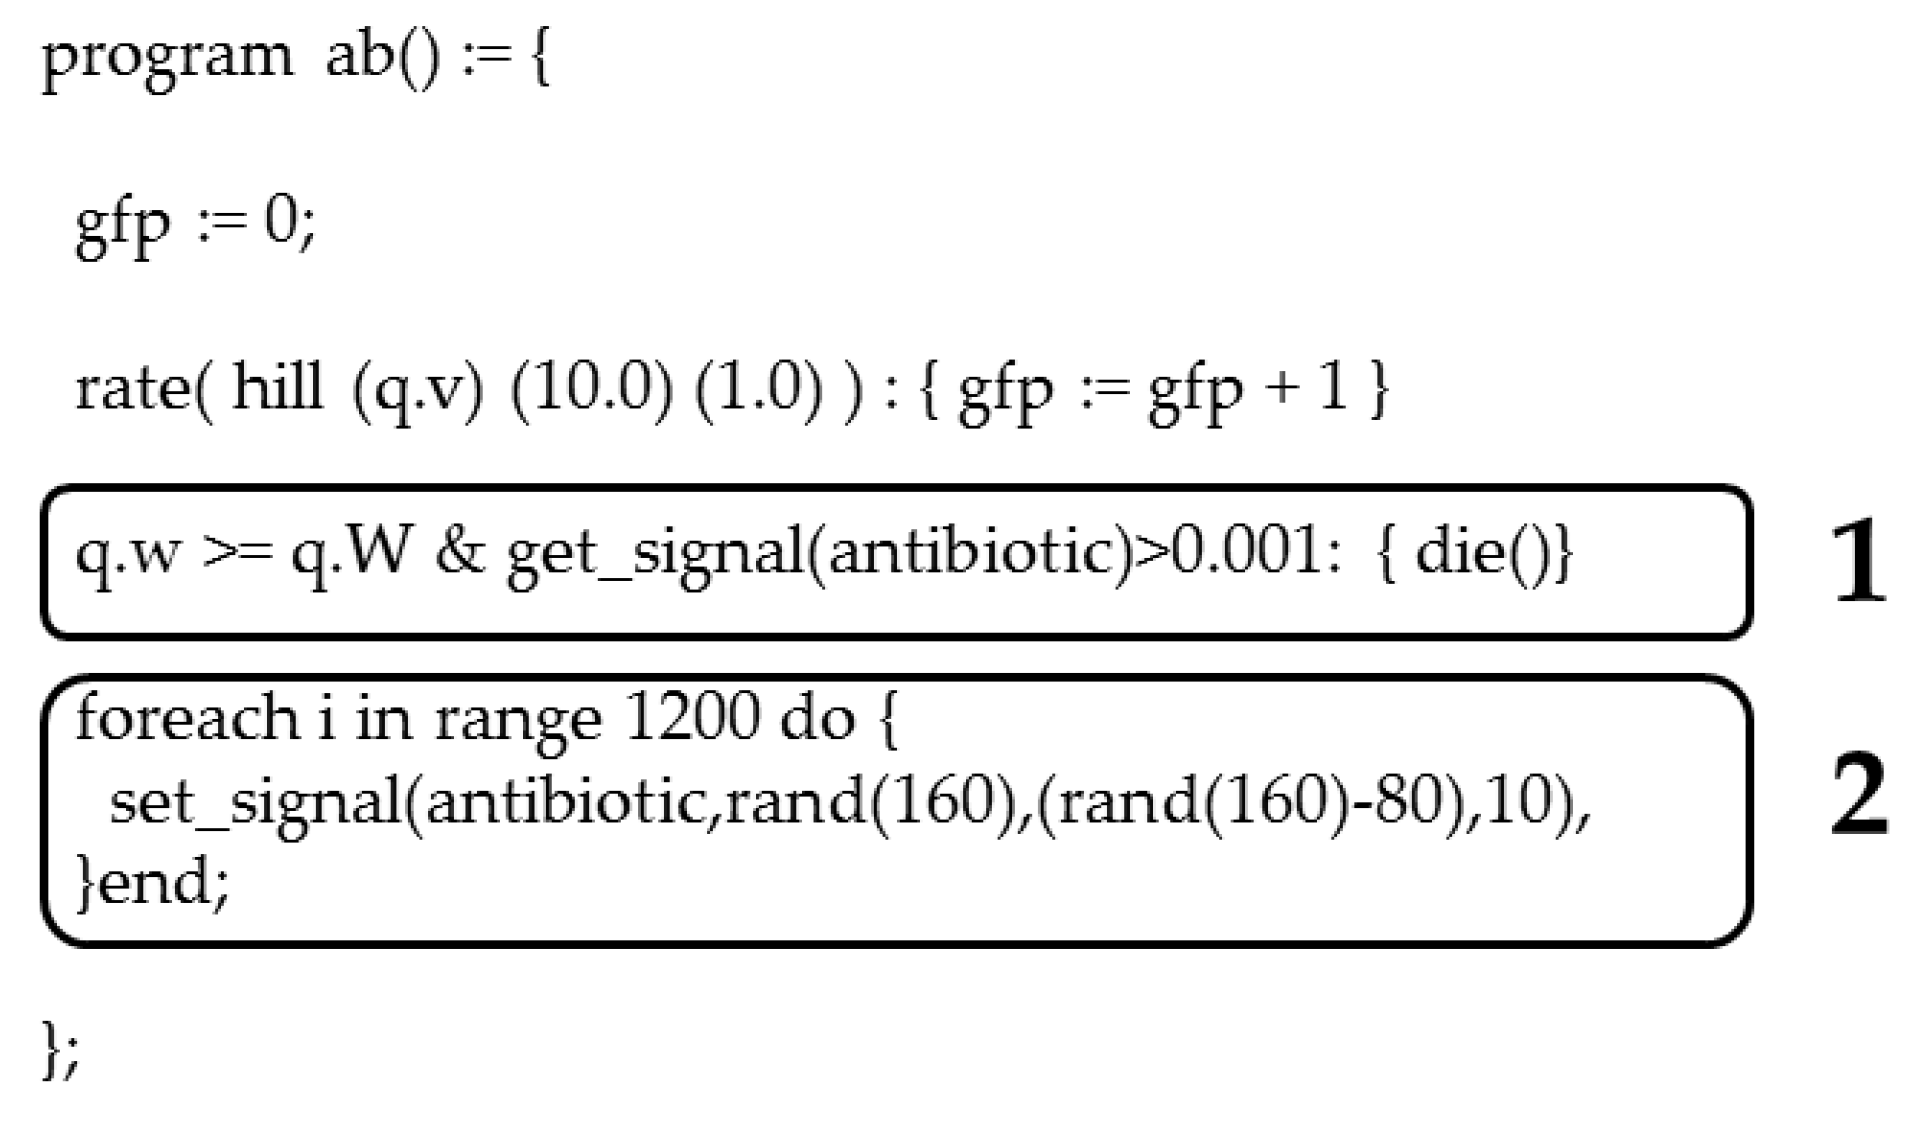
- Antibiotic resistance: This selection method is the usual one in a laboratory of microbiology, synthetic biology, etc., since it is easy to apply and resistance is known for a multitude of antibiotics [20]. The implementation in Gro (Appendix A, Figure A1) of this screening procedure simulates a randomly distributed signal emulating an antibiotic (Figure 4), being received by all synthetic bacteria. Since in Gro there is a command to cause the death of bacterial cells, this command is used to simulate the effect of the antibiotic on those bacteria that do not satisfy a particular logical condition. Thus, all synthetic bacteria with the desired phenotype will be resistant to the signal, while the rest of the bacteria will die.
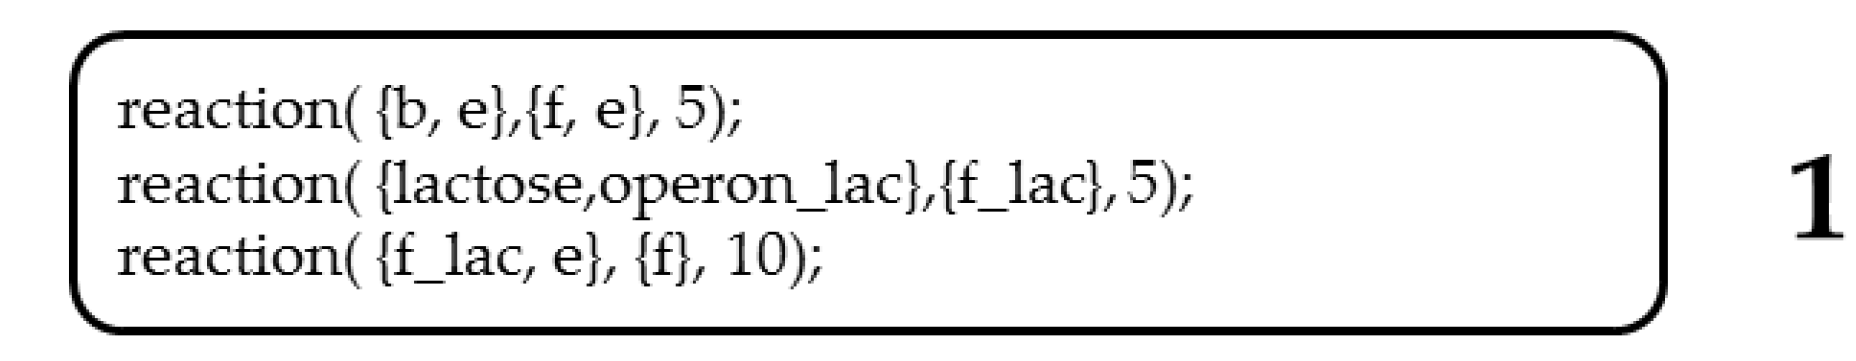
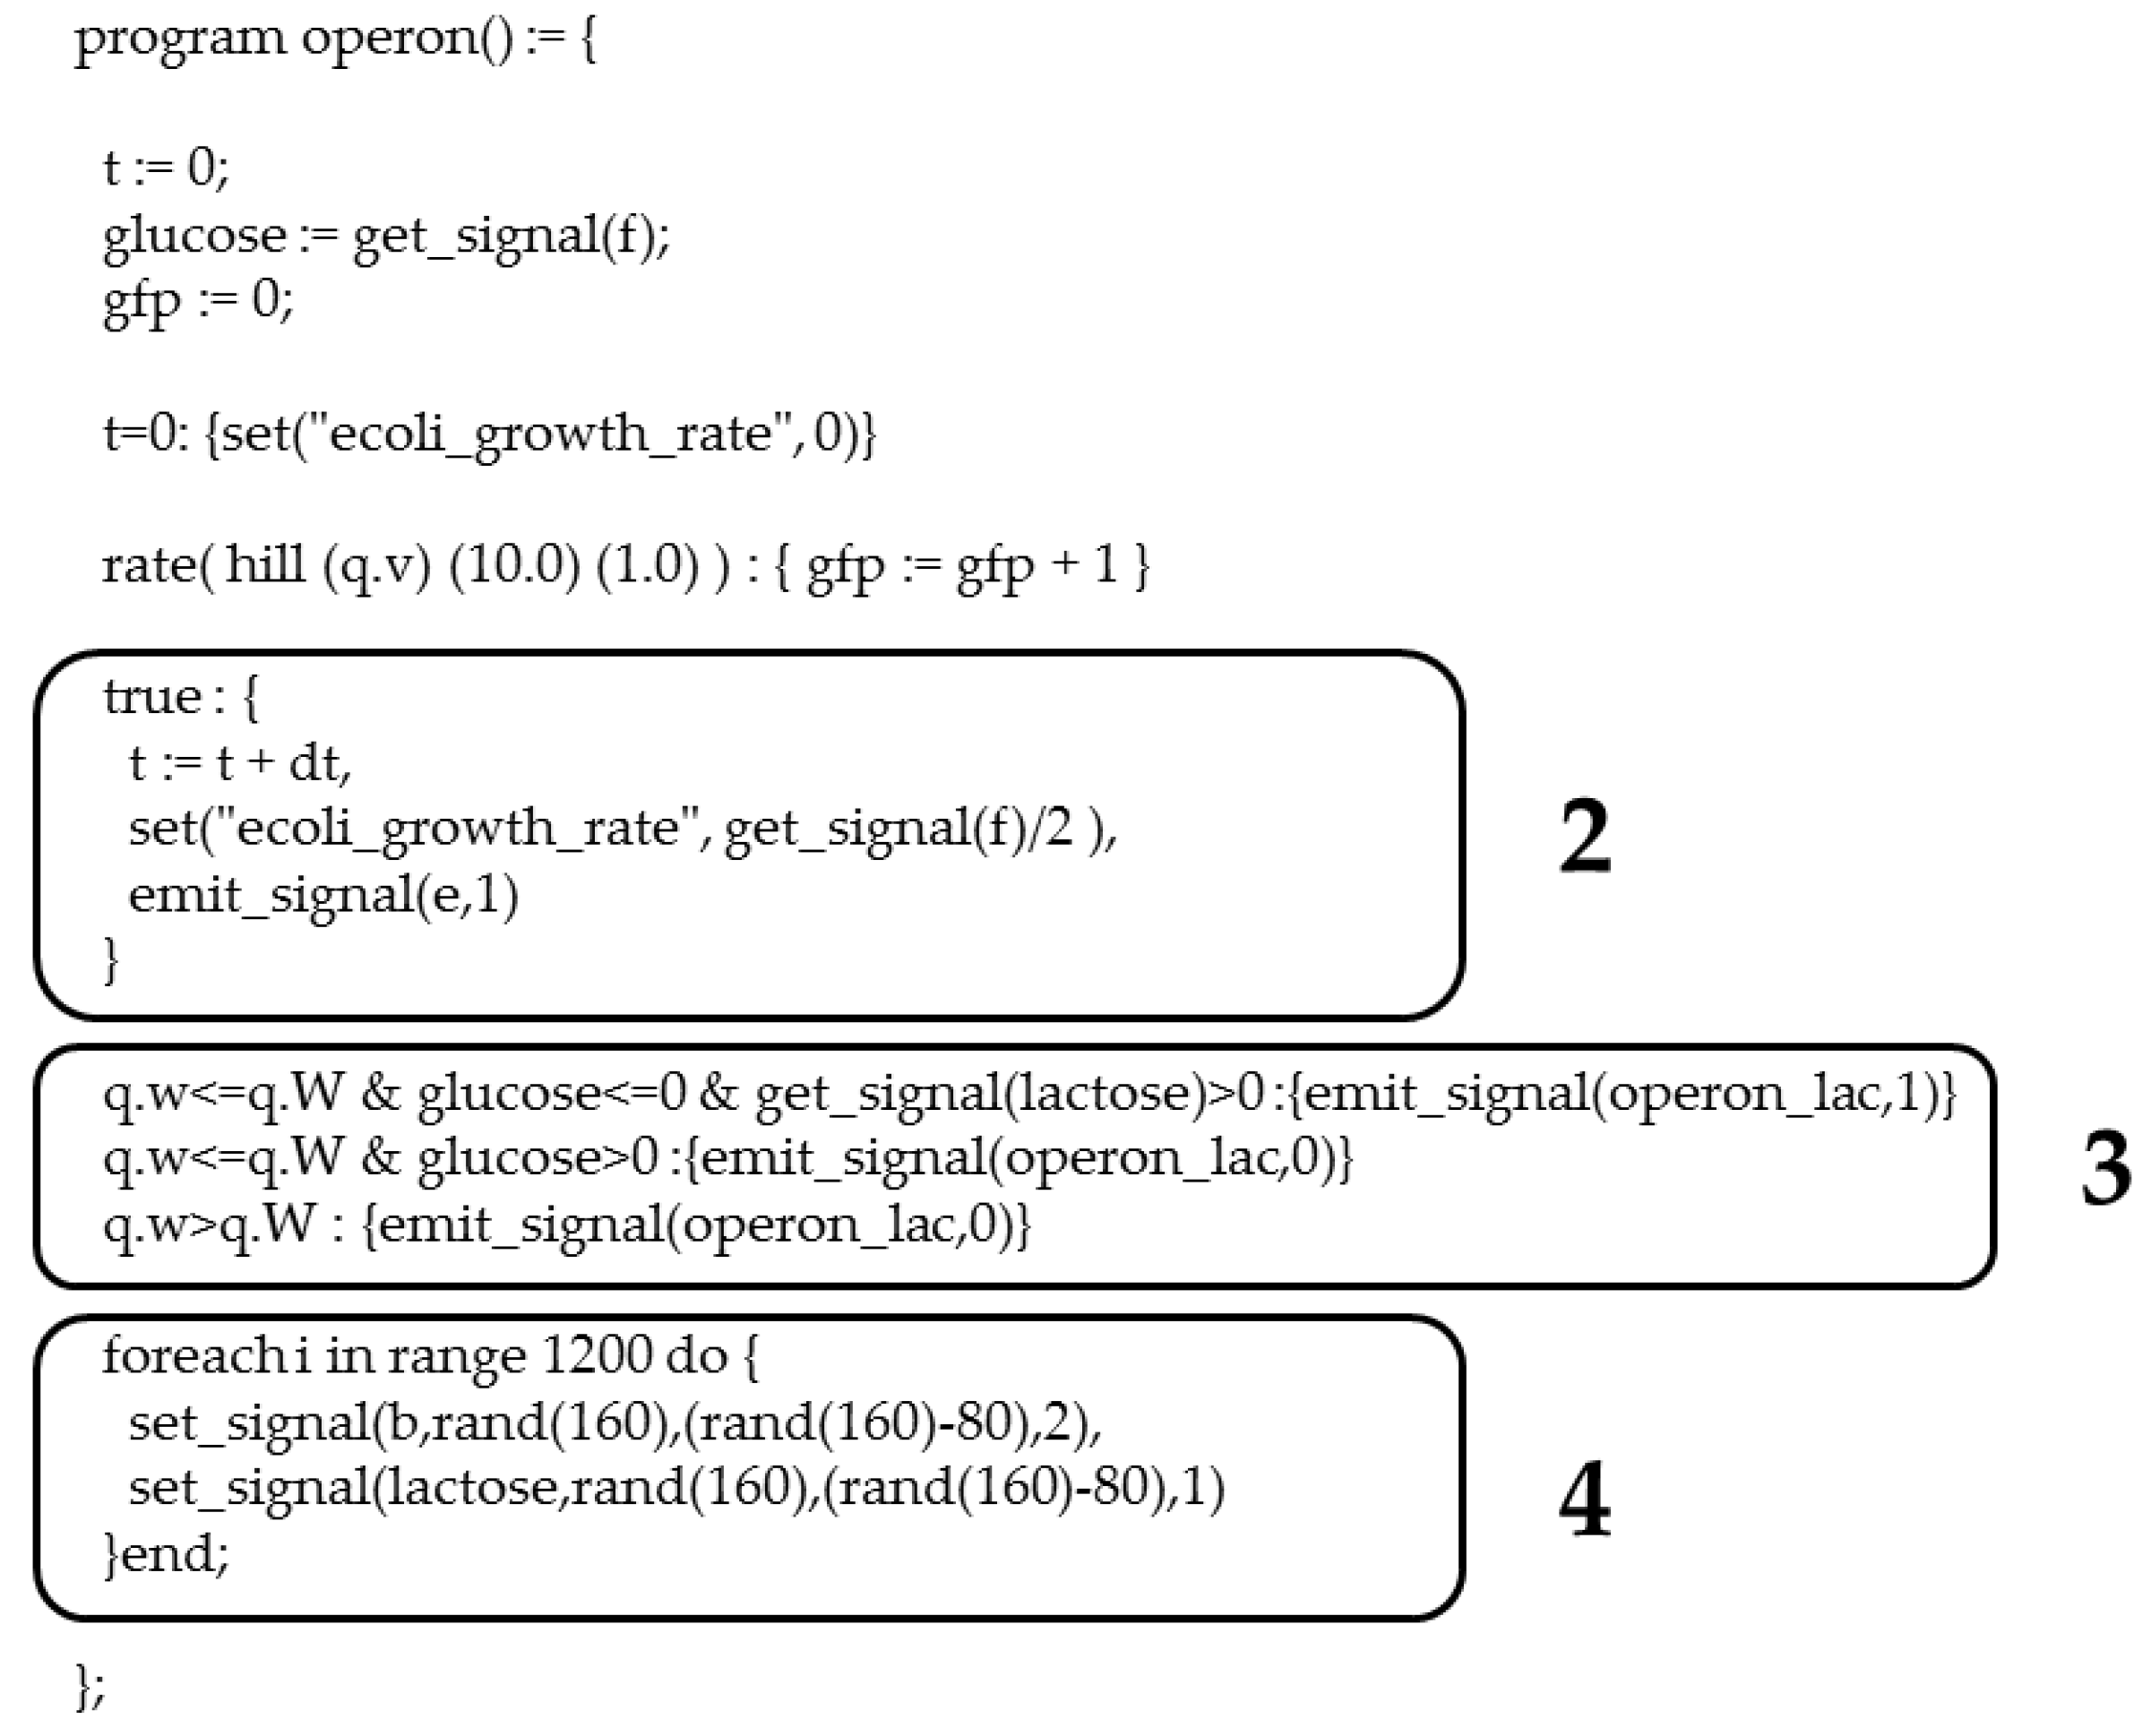
- Lac Operon: The genes of bacteria are organized into operons [21]. When nutrient levels in the environment change, the genes of the bacteria vary in their expression in response to those changes. For example, the operon lactose (Lac) changes its state depending on the levels of lactose sugar in the environment. In the experimental realm, the Lac operon is one of the most commonly used in synthetic biology experiments, contributing to the controlled and effective implementation of diverse biotechnological processes. At the cellular level, the Lac operon is in charge of regulating the synthesis of the molecular machinery necessary for lactose degradation. Therefore, its presence in the bacteria is an advantage that can be used in a selection procedure. The Lac operon implementation in Gro (Appendix A, Figure A2) is inspired by the logic that regulates the operon (Figure 5), not including the regulating elements of the operon. In this work, we have only simulated the conditions under lacZ effector acts on the operon: in the absence or low levels of glucose and presence of lactose. In the Gro routine, such conditions will be subrogated to the logical condition of the optimization problem to be solved. Therefore, if the synthetic bacterium does not meet the logical condition of the problem, the bacterium will not hold the operon, and therefore will not be able to degrade the lactose. In addition, as the bacterial growth rate is related to the amount of available nutrients, bacterial colonies unable to degrade lactose will have a lower fitness value. In this screening procedure, besides the logic described above, the different metabolic reactions that occur during the degradation of the main carbon source were also taken into account. For this reason, three reactions have been defined that will regulate the system: (a) obtaining glucose from biomass by the catalytic action of an enzyme, (b) lactose degradation by lacZ obtaining glucose and galactose and (c) degradation of galactose by an enzyme.
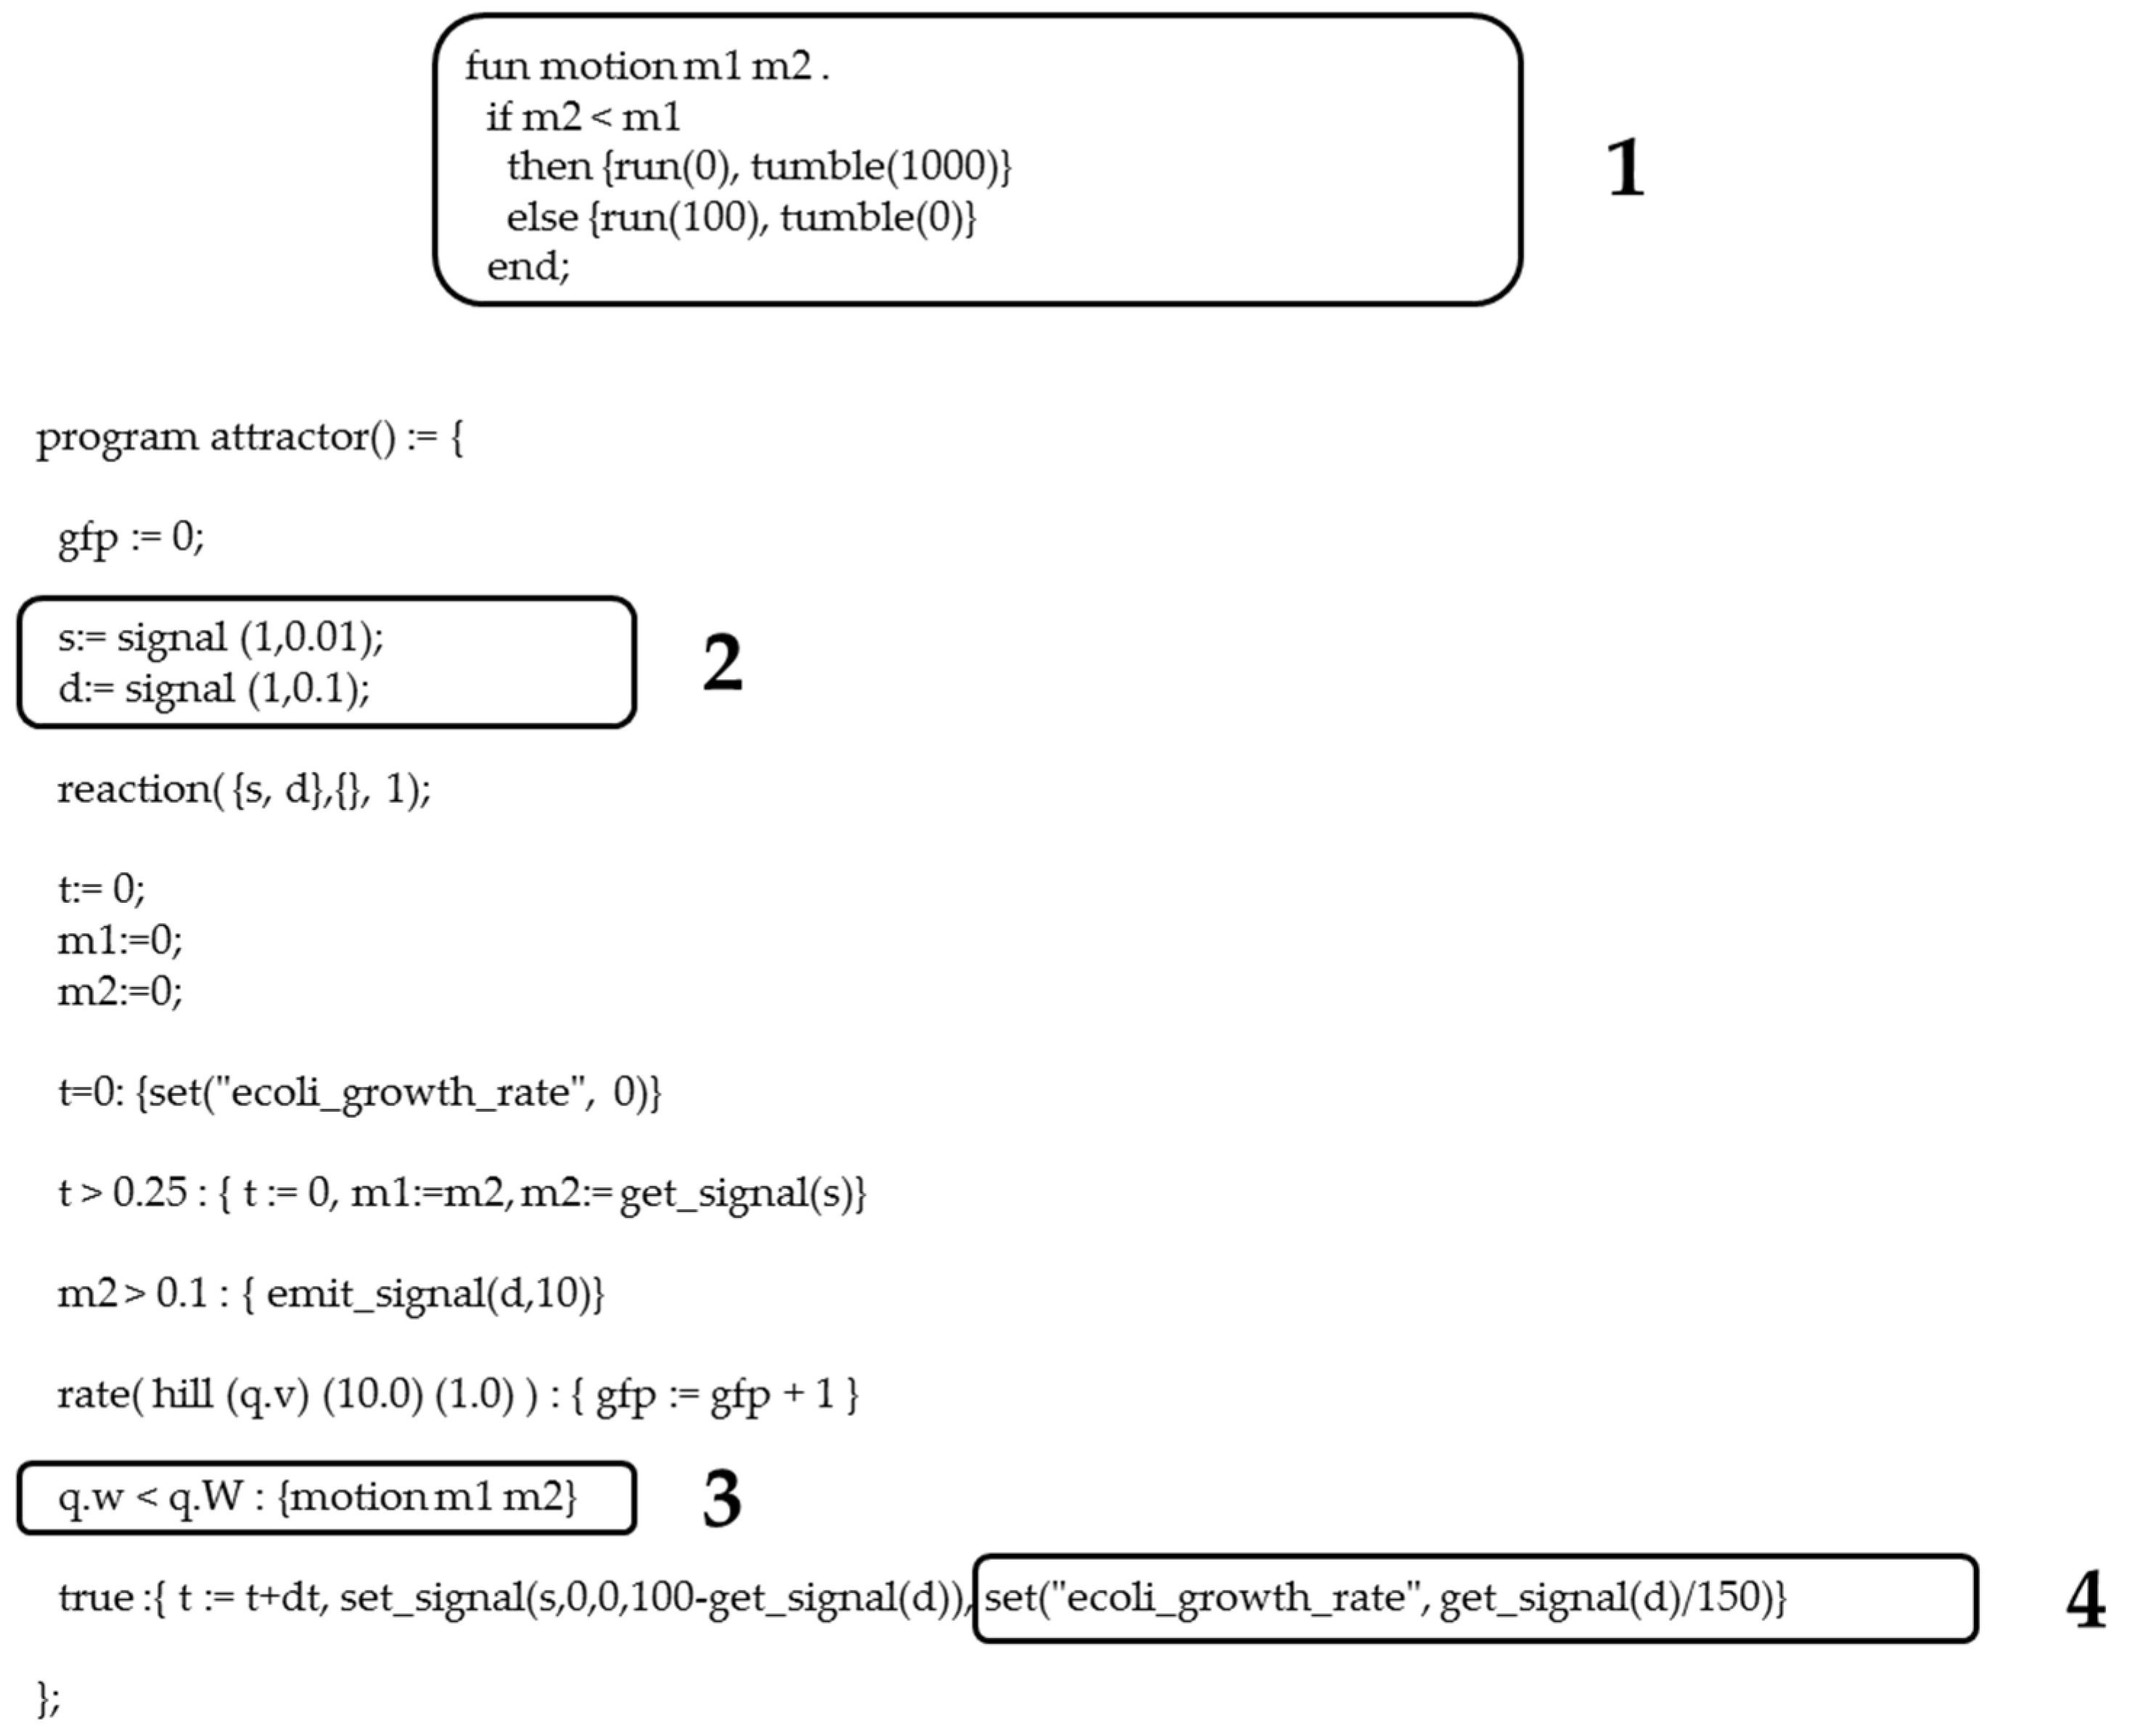
- Chemotaxis: Although this biological phenomenon is not usually part of a laboratory experimental protocol, we have designed a screening procedure based on this bacterial behavior. Chemotaxis consists of directional locomotion of bacteria towards a source of a chemical stimulus. This movement is made possible by a structure called a flagellum. A motor drives the flagellum, consisting of a rotor and stator. Motor assembly was simulated in Reference [22], regulating its assembly via the temporal expression of specific operons [23,24]. Gro routine (Appendix A, Figure A3) is inspired by the logic [25] of the molecular mechanism involved in bacterial chemotaxis (Figure 6) and in which Che proteins are the regulators of chemotaxis. The mechanism is not simulated in detail, but the function that simulates it is based on the messenger role of CheY protein. In short, the phosphorylation levels of this protein depend on signals from extracellular receptors for nutrients such as sugars or amino acids. A higher phosphorylation of CheY implies a more effective binding to the motor complex, allowing it to rotate effectively, and thus causing the bacteria to move in a specific direction. If CheY is not sufficiently phosphorylated then the binding to the motor complex is not effective, which translates into erratic movement by the bacterial cell. At a logical level, CheY checks the levels of certain nutrients, making the motor work at higher levels of phosphorylation. This behavior is modeled as follows: When the levels of an ‘attractive’ substance increase, then the levels of phosphorylation will allow an effective movement or ‘run’. Conversely, when attractor levels decrease, then CheY phosphorylation declines, and then an erratic movement of the bacterium or ‘tumble’ is induced. Since the presence of a motor system represents a bacterial advantage by allowing its access to an area with an abundance of nutrients, the bacterial growth rate is related to the concentration of attractant substance that bacteria receives. Therefore, only those synthetic bacteria that incorporate the genes necessary to synthesize the motor machinery will succeed in the selection (Appendix A, Figure A3).
The above routines were used to obtain the evaluation function, which in turn was used in the evolutionary SGA and SMGA algorithms. Next, and in order to study the usefulness of the method proposed to obtain the fitness function, the evolutionary algorithms were applied to solve two instances, one of the 0/1 knapsack problem and the other of the 2-SAT (2-satisfiability) problem. In the following, we describe the general methodology applied to obtain the evaluation function in each of the previously cited optimization problems.
2.1.1. Method for Obtaining the Evaluation Function in the 0/1 Knapsack Problem
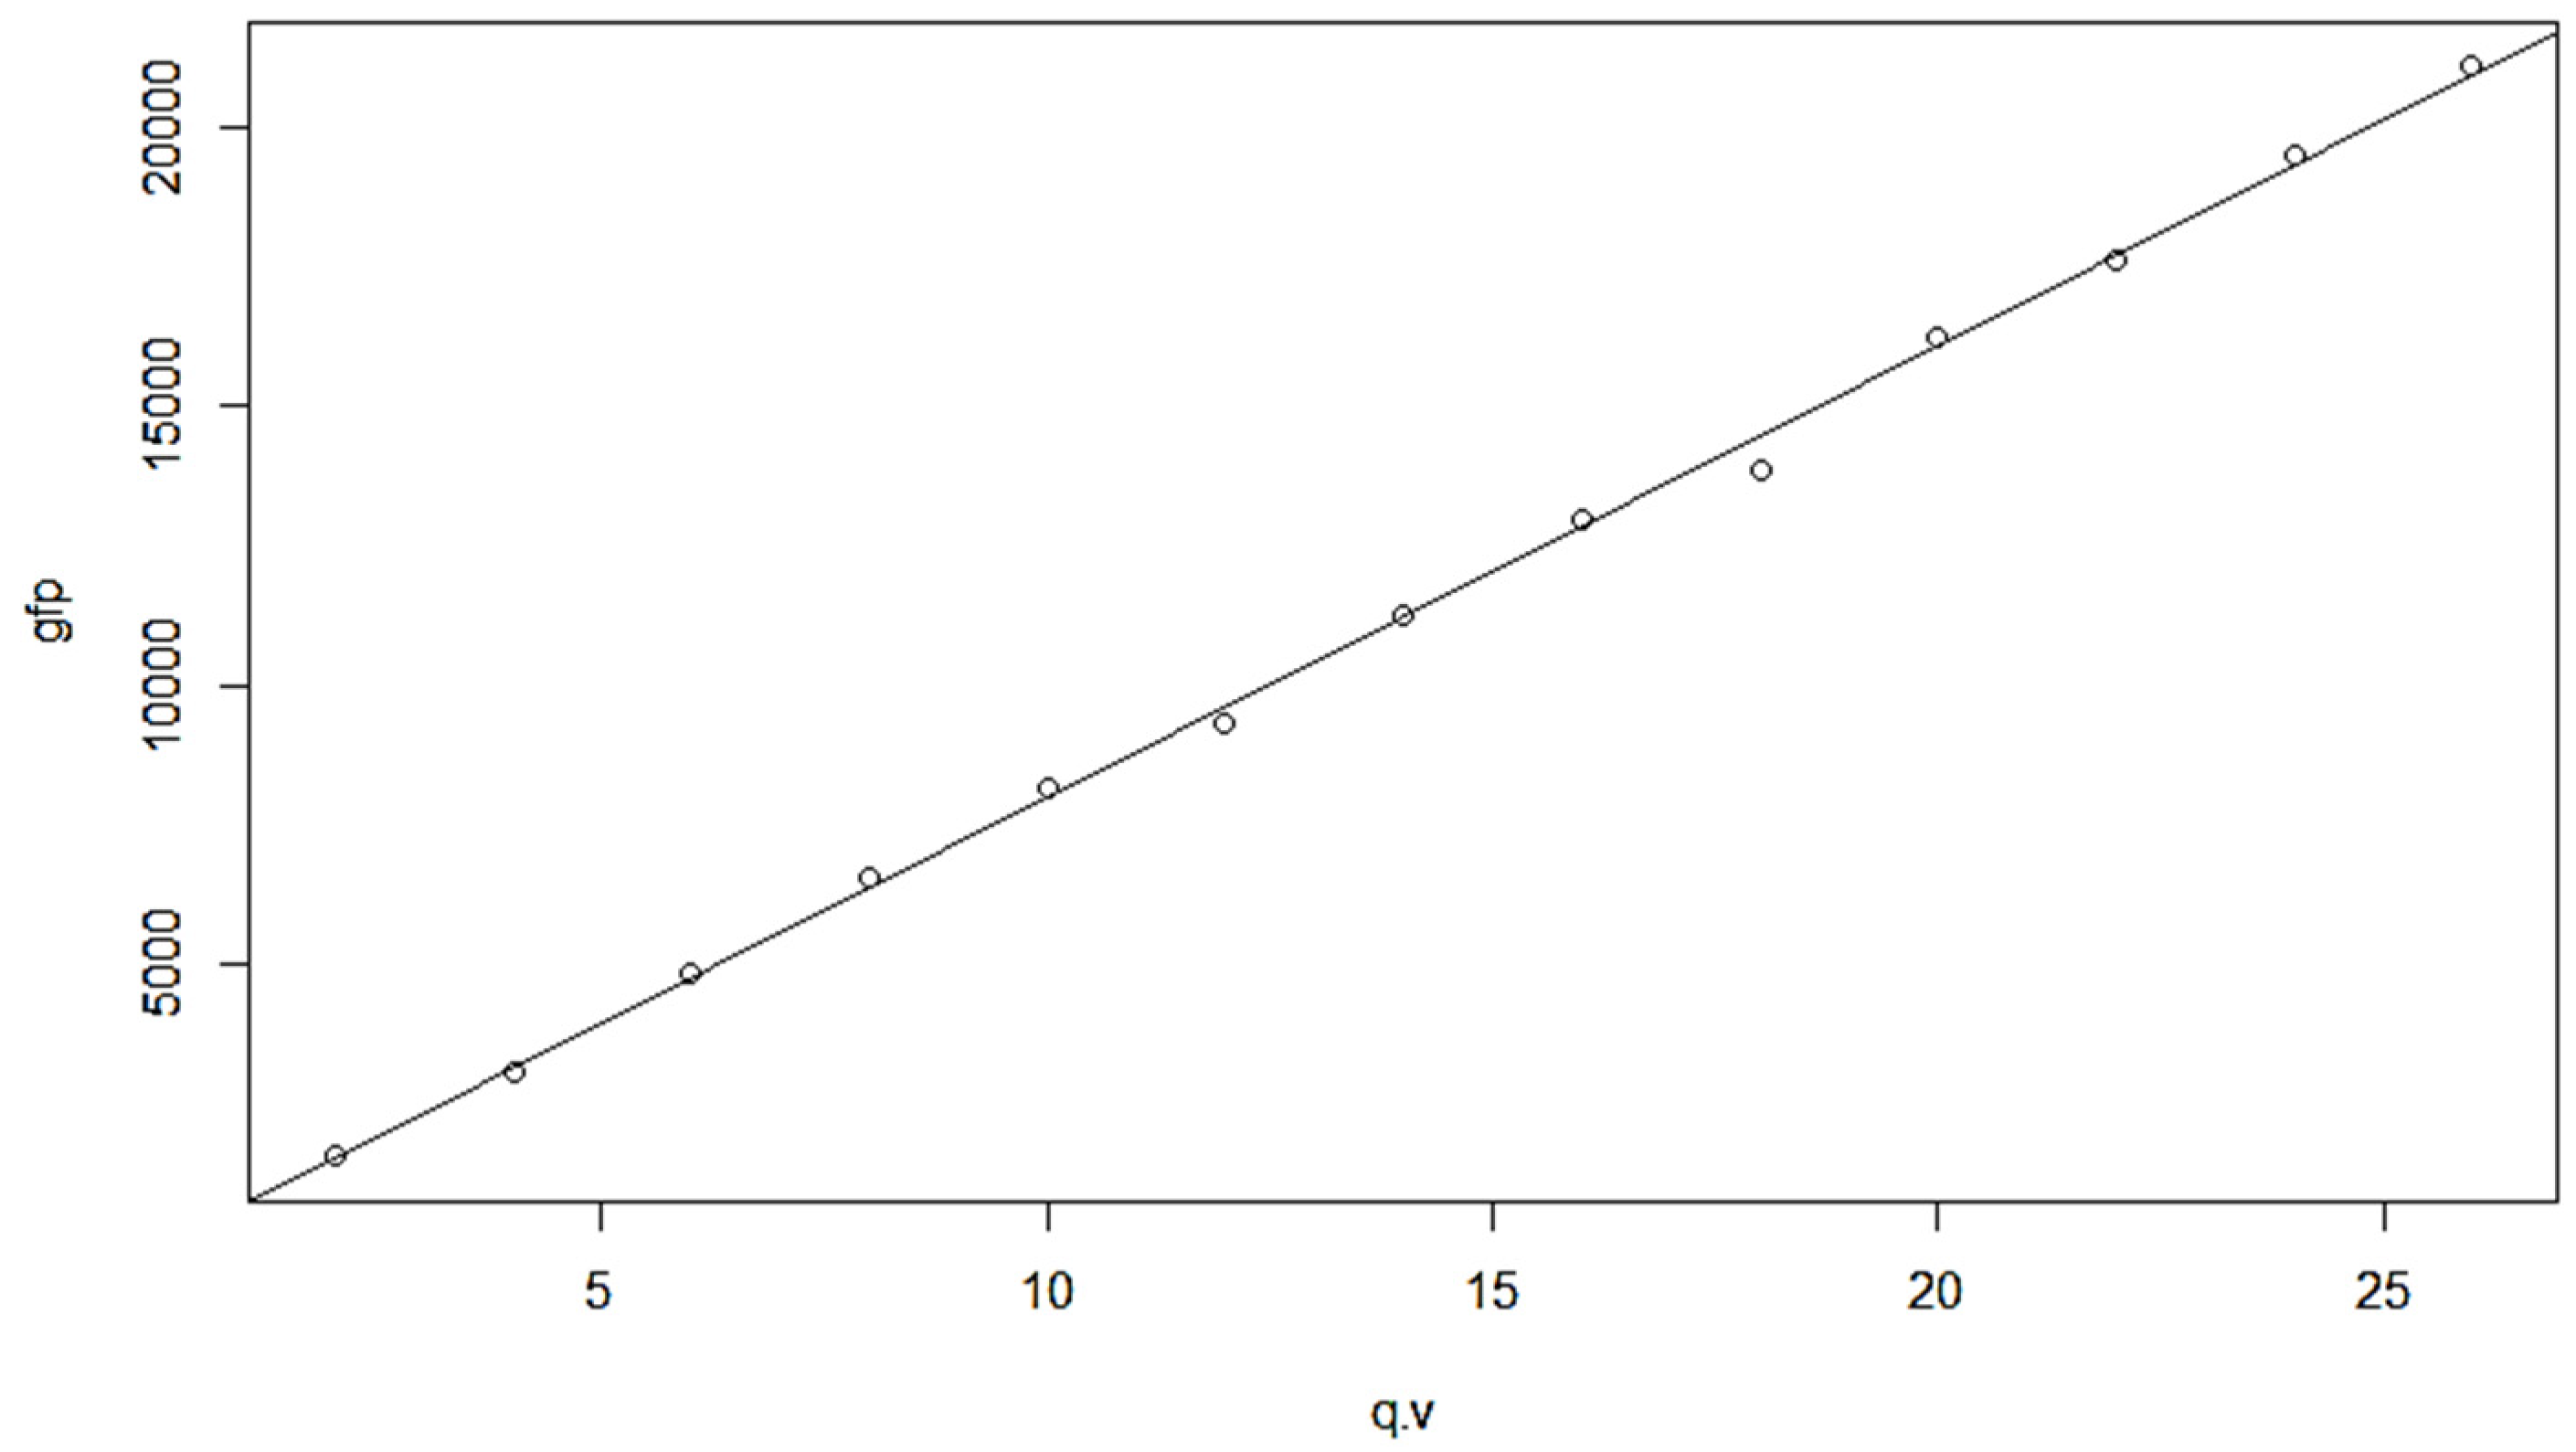
Let x be the value of a knapsack, xi the value of a set of items selected for the knapsack and yi the fitness value for xi, the value for which is estimated by applying a method of screening in silico. The procedure involves increasing x to a pre-set increase, . Once an initial value of x has been set, for instance equal to 2.0 (Figure 7), the size of the synthetic bacteria colony grows according to an exponential or Malthusian growth model [26]. As the number of bacteria increases, so do the levels of a synthesized reporter protein, i.e., the green fluorescent protein (GFP). As the colony grows, in a given time, t, the procedure records the average value of GFP/volume. The fitness value, yi, for each value of xi is calculated by multiplying the colony size, i.e., the number of bacteria, by the average GFP/volume. As a result, a scatter plot of the points (x1, y1), (x2, y2), …, (xn, yn) is obtained, and the fitness regression line y = a + bx is fitted by the least squares method (Appendix A, Figure A4).
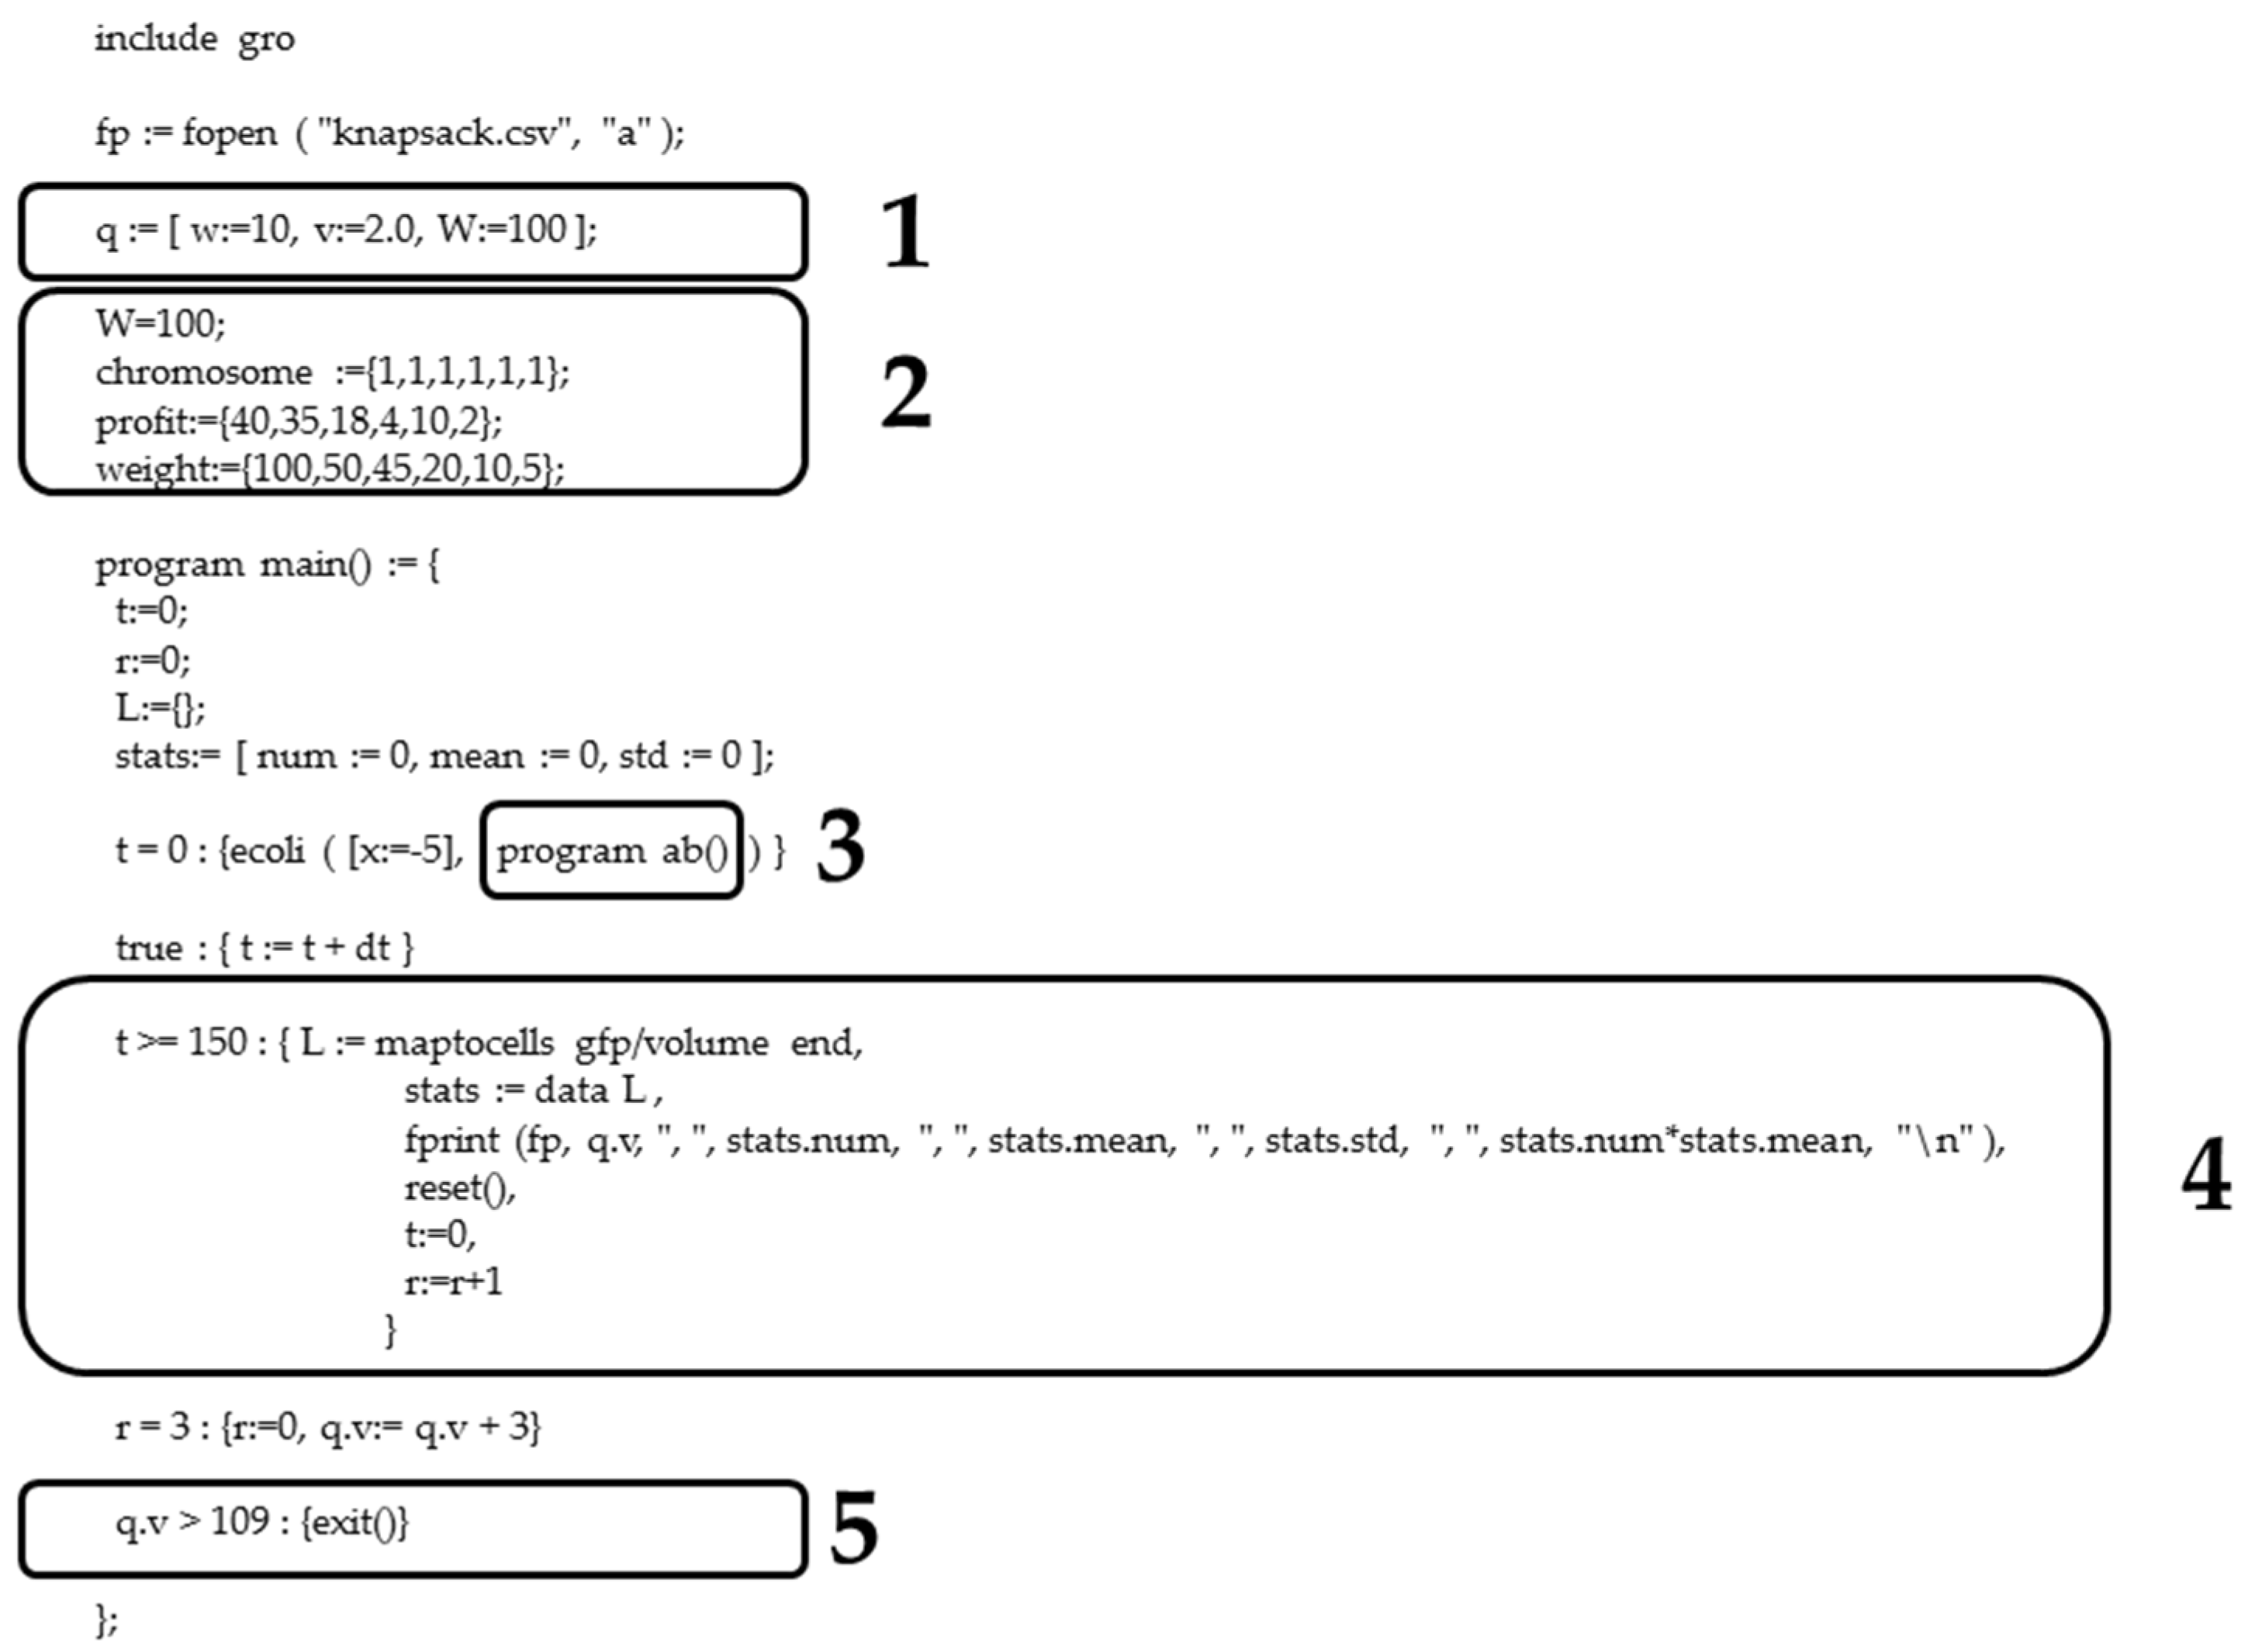
The described procedure was carried out twice, obtaining two regression lines. In one case, we will obtain the fitness function (regression line) for those instances that meet the knapsack weight restriction, i.e., the weight is less than the maximum capacity set (w < W), whereas in the other, we obtain the fitness function (regression line) for those instances that do not fulfill the constraint, and therefore, w > W. In order to obtain the first regression line, we will select in the register of the script in Gro (Figure 7; Appendix A, Figure A5) any desired value of q.w (total value of a set of items) that complies with q.w < q.W (maximum capacity restriction), i.e., q.w = 10, while to obtain the second regression line, we will set a value of q.w, i.e., q.w = 109, that satisfies q.w > q.W.
2.1.2. Method for Obtaining the Evaluation Table in the 2-SAT (2-Satisfiability) Problem
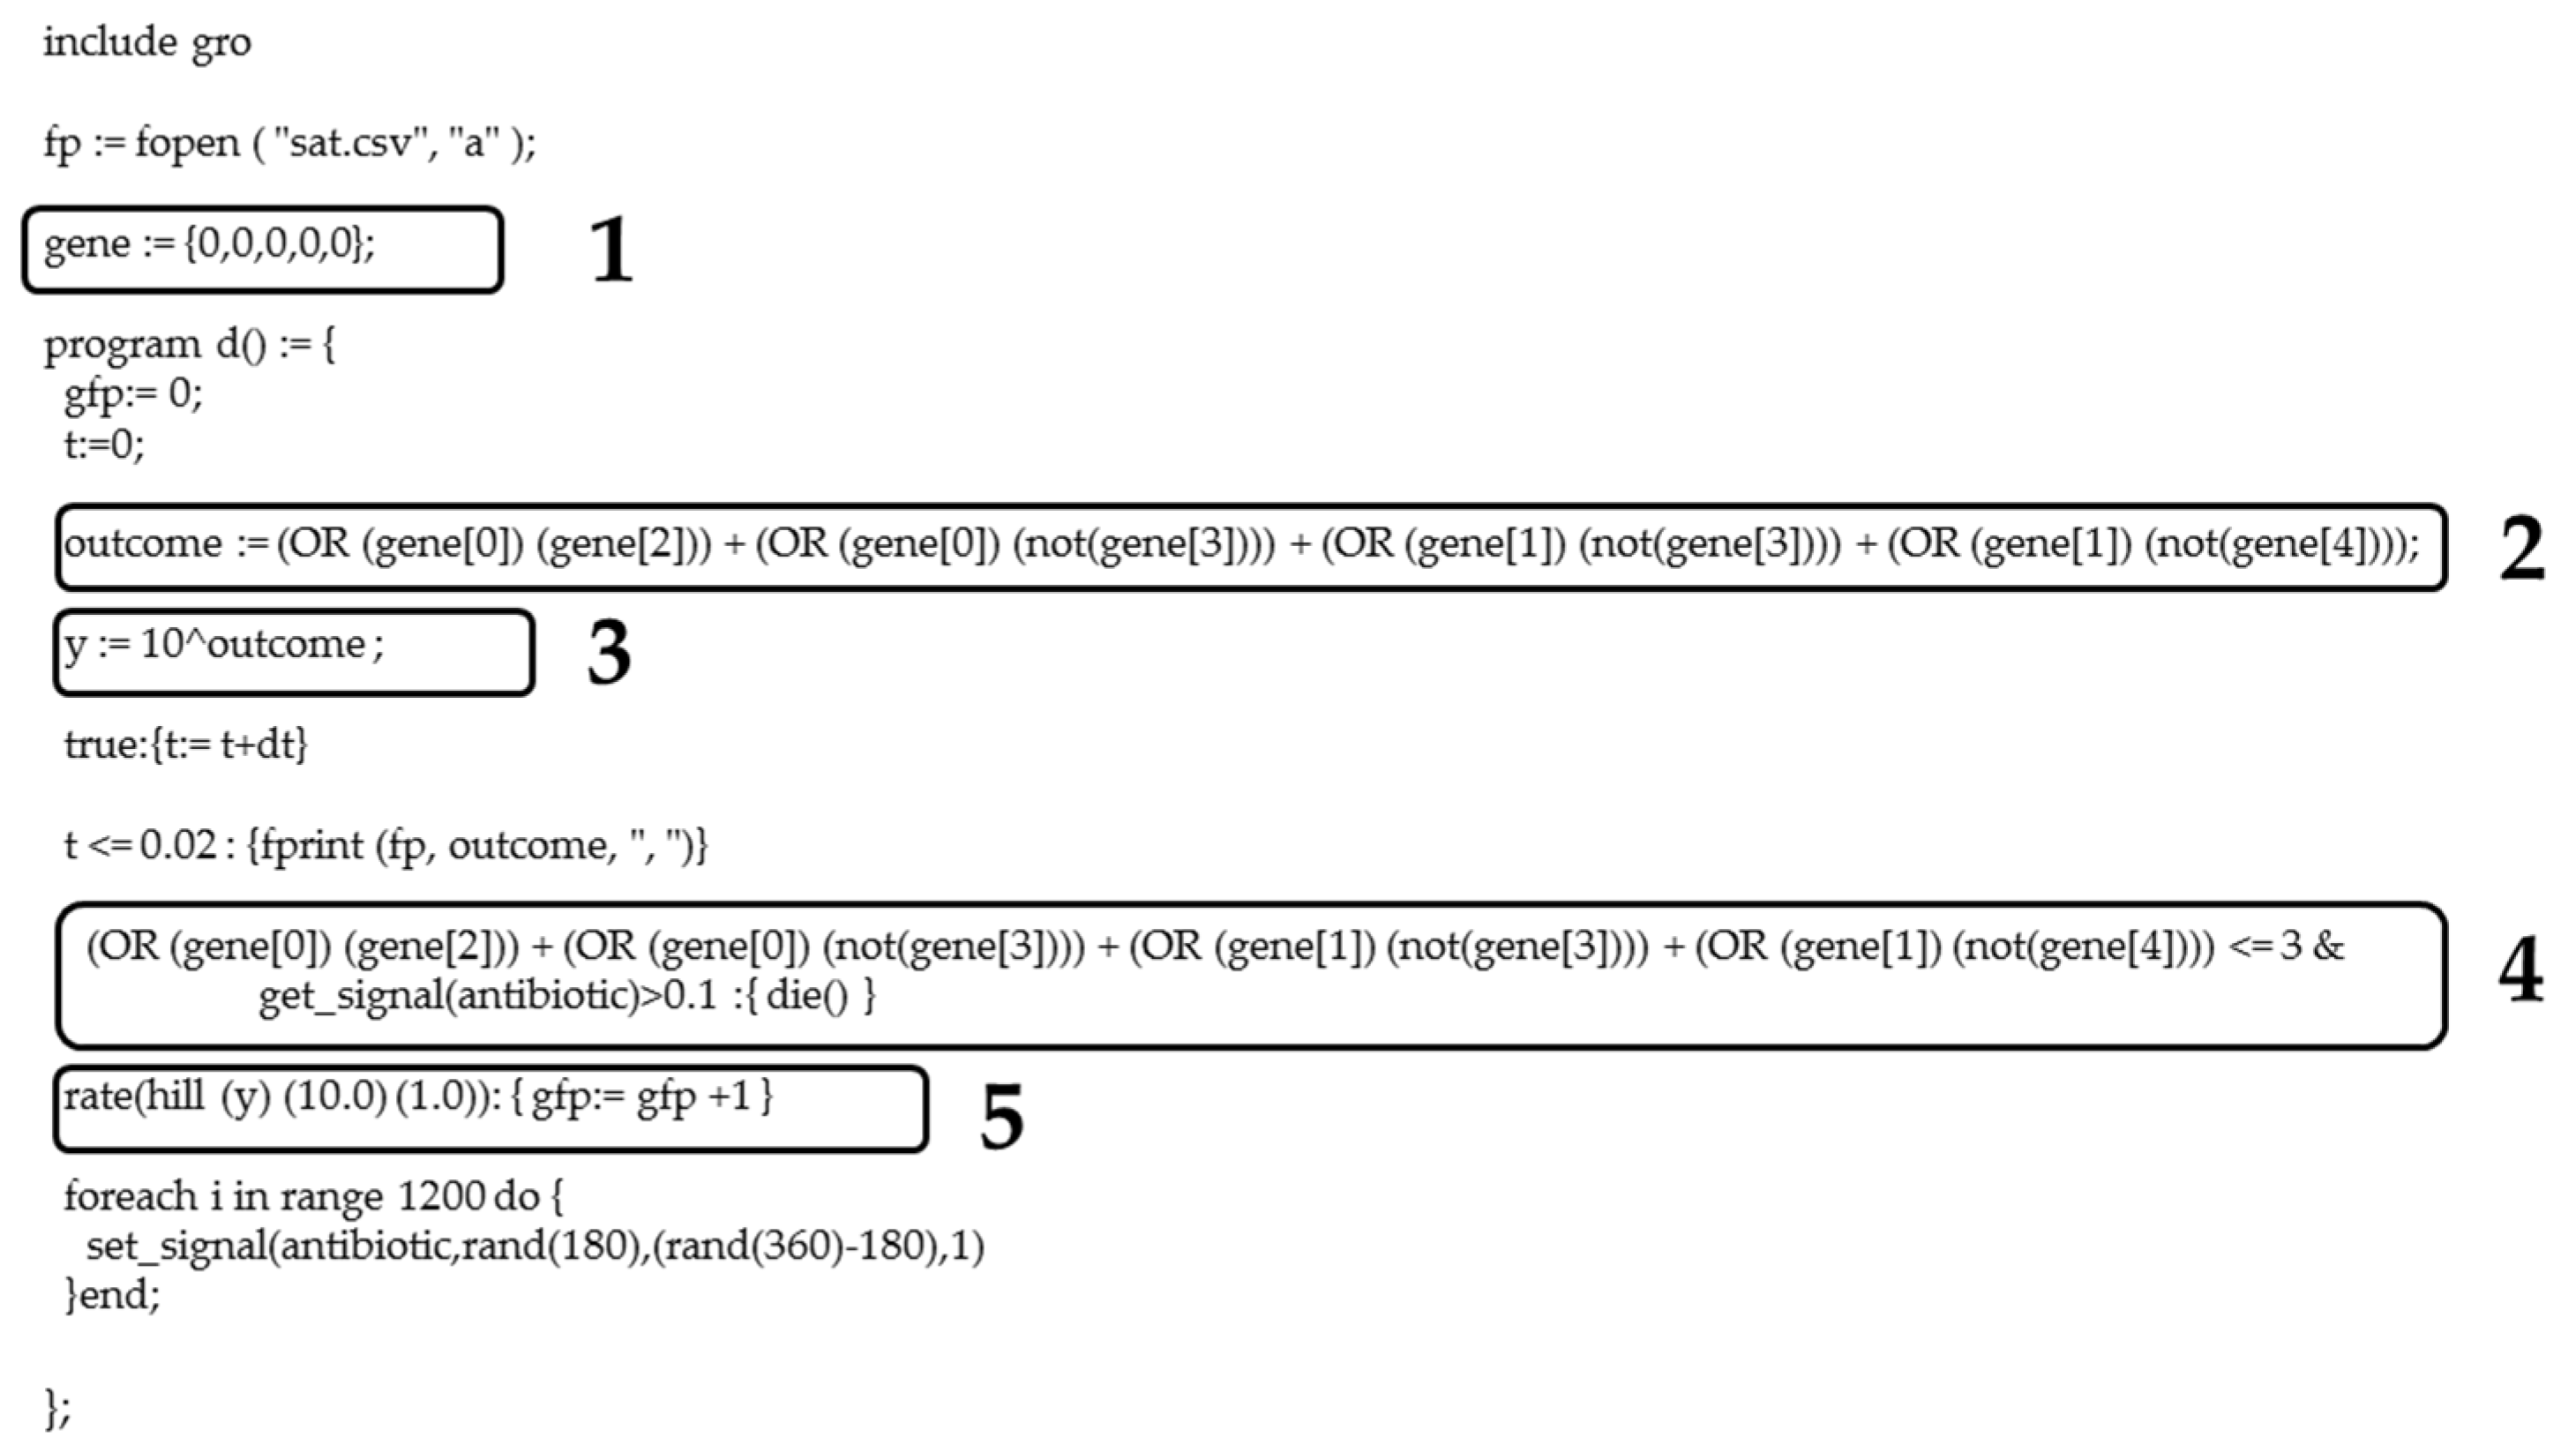
The procedure involves evaluating the Boolean expression for all possible values, 0 or 1, of the variables (Figure 8). The fast computation of the 2n (n is the number of variables) expressions is possible because synthetic bacteria multiply exponentially and the computation is in parallel. Starting with an initial value of 0 of all variables {0, 0, …, 0} of the Boolean expression, the size of the synthetic bacterial colony grows according to an exponential or Malthusian law, registering in the colony for a certain time, t, the average value of GFP/volume. Afterwards, for a particular combination of 0s and 1s, i.e., {0, 0, …, 0}, {1, 0, …, 0}, …, {1, 1, …, 1}, the value of the function y = f (outcome) is calculated, where outcome is the output of the Boolean expression. The levels of protein reporter, i.e., the GFP, depend on the value of y, synthesizing GFP according to a Hill equation. Every certain time, t, the total amount of GFP is recorded, multiplying the average value of GFP/volume by the number of bacteria, i.e., the size of the colony. As a result, a fitness table with two main columns is obtained: one of the columns with the number of variables with state 0 or 1 satisfying the expression, with each row of the table representing the value 0, 1, 2, …, 2n, and the other column with the fitness value, i.e., the total amount of GFP. Figure A6 (Appendix A) displays the script in Gro implementing the described procedure.
2.2. Simulation Experiments
In order to test the screening procedures, we performed simulation experiments with the two classic optimization problems mentioned above.
First, we solved an instance of the 0/1 knapsack problem (Table 1). For this purpose, once a microbial screening procedure has been chosen, in the script in Gro we set the optimization problem instance and restrictions, i.e., maximum weight or maximum tolerated capacity of the knapsack. Next, the script is executed in the Gro simulator, obtaining the evaluation function y = f(x). Afterwards, the function is implemented in the step that evaluates the fitness in the genetic algorithm. From the results obtained, and for each of the screening procedures, we plotted the evolutionary surfaces.
In summary, for the general protocol, it is like the chromosomes were evaluated in a microbial screening experiment with a colony of bacteria. Therefore, the simulated procedure is equivalent to performing a laboratory experiment in which the fitness of the solution is obtained. Once the DNA segment encoding the solution is inserted in a plasmid that is introduced into a bacterium, the bacterium duplicates, growing the bacterial colony. The microbial screening protocol evaluating the bacterial (solution) fitness will be applied in this colony.
Secondly, we solved an instance of the 2-SAT (2-satisfiability) problem. Similarly to the 0/1 knapsack example, we selected the microbial screening procedure, setting the optimization problem instance, etc., in the script in Gro. For instance, a logical proposition written in formal mode:
is written in Gro language according to the syntax defined for the logical functions as:
Once the evaluation table is obtained, it is included in the genetic algorithm. Since in the genetic algorithm a chromosome encodes for the values (0 or 1) of the Boolean variables, once the values are replaced in the Boolean expression, its fitness value is evaluated with the evaluation table obtained from the Gro screening routine. In order to assess the similarity of all the solutions obtained, a cluster analysis was conducted for each screening procedure, using the seaborn data representation module in Python 3.6.
From simulation experiments previously conducted, we found the proper values of the parameters in SGA and SMGA. Specifically, we found that the best number of generations was 100 and the best population size, i.e., number of chromosomes, was 24, being the same values for both algorithms. Conversely, the optimal mutation rate varies depending on the chosen algorithm, being 0.03 for SGA and 0.035 for SMGA. In the case of SGA, the recombination rate was set to 0.75.
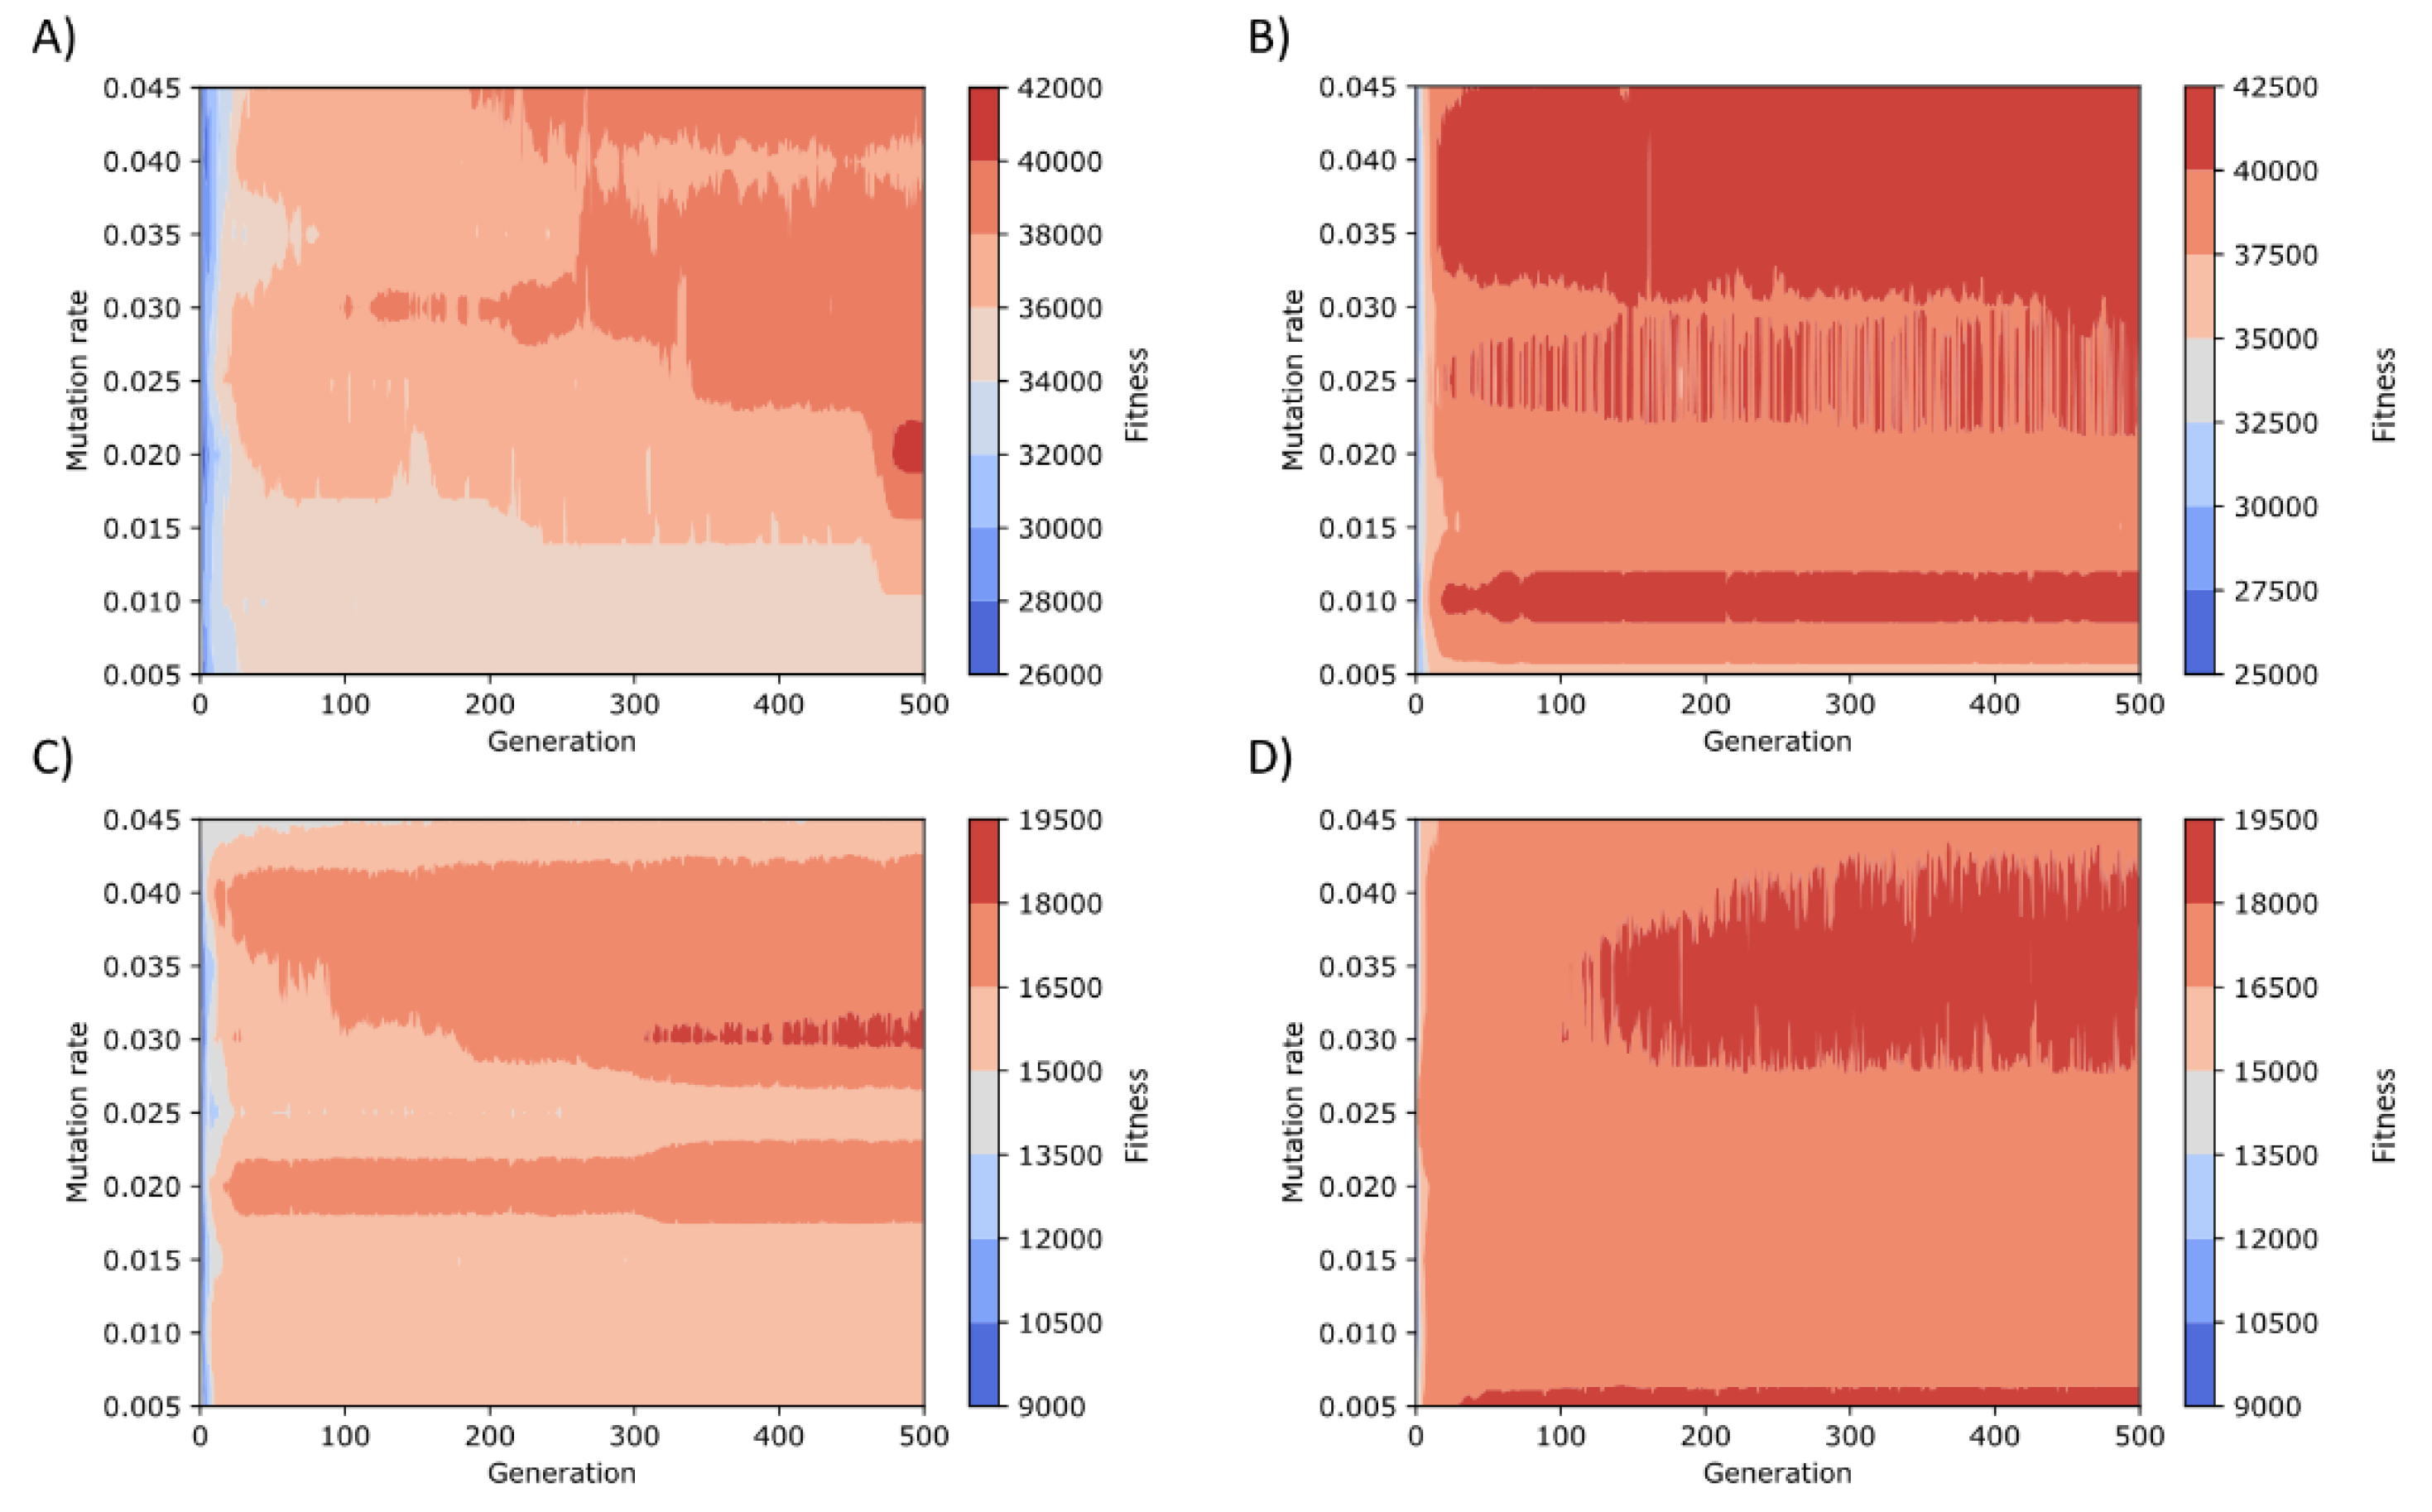
In order to find the proper values of the parameters of both SGA and SMGA, we tested different ranges for mutation rate and number of generations (Figure 9). We found that the best number of generations was 100, although for the SMGA with the antibiotic-based screening method (Figure 9B), the optimal number of generations was around 25. The population size, i.e., number of chromosomes, was set to 24 for both algorithms. Conversely, the optimal mutation rate varies depending on the chosen algorithm, being 0.03 for SGA and 0.035 for SMGA. In the case of the SGA, the crossover rate was set to 0.75.
2.3. Scalability and Run Time Complexity
One of the possible drawbacks of using a colony of synthetic bacteria to build the evaluation function of an optimization problem is scalability. Thus, the colony grows exponentially and in some class of optimization problems, this property of the bacterial agents can lead to a high computational cost. In the case that a high number of bacterial agents are needed to solve a NP hard problem, the result will be an exponential consumption of resources, e.g., memory or execution time. In addition, the version [16] of Gro runs the simulations faster than the original version beta.4 [14]. For instance, in preliminary studies, we found that in non-programmed bacteria, i.e., without holding a script to be executed, the time it takes for the colony to reach a size of 10,000 bacterial agents differs considerably (Table 2).
In order to prevent the above scenario in each of the screening in silico experiments, we set a time limit or maximum simulation time, ts, which was set at a value equal to 150. This procedure restricts the maximum time of a simulation experiment. In consequence, we avoided the excessive consumption of computer resources and an excessively long execution time. In previous experiments, it was observed that the length of 150 min (simulated time) is enough to build a satisfactory fitness function in several repetitions of the screening experiment (Figure 7 and Figure 8). In each version of Gro [14,16], we evaluated the total run time of two instances of a SAT problem with different complexity. In particular, we evaluated a 2-SAT proposition:
and 3-SAT proposition:
The experiments were conducted on a computer with an Intel Core i7-3770 CPU at 3.40 GHz with 16 GB of RAM.
3. Results
The results obtained in the experiments with the genetic algorithms (Figure 10 and Figure 11) opens the possibility of evaluating fitness in evolutionary algorithms by applying a methodology inspired by synthetic biology techniques. In consequence, the proposed screening procedures are helpful for the fitness evaluation solving optimization problems with genetic algorithms. For example, in the 0/1 knapsack problem, with the microbial screening procedure, we obtained the following fitness function:
where xi is the value of a set of items selected for the knapsack, w is the weight of the knapsack and W is the maximum weight capacity. Finally, the function was included in the genetic algorithm (in our case, written in Python language).
In the SAT optimization problem, the evaluation function is a table (Table 3) that includes the number of satisfied clauses and a fitness average score.
In general, screening methods in which the selection is based on an antibiotic or the Lac operon are more effective in evaluating fitness than the screening inspired by bacterial chemotaxis.
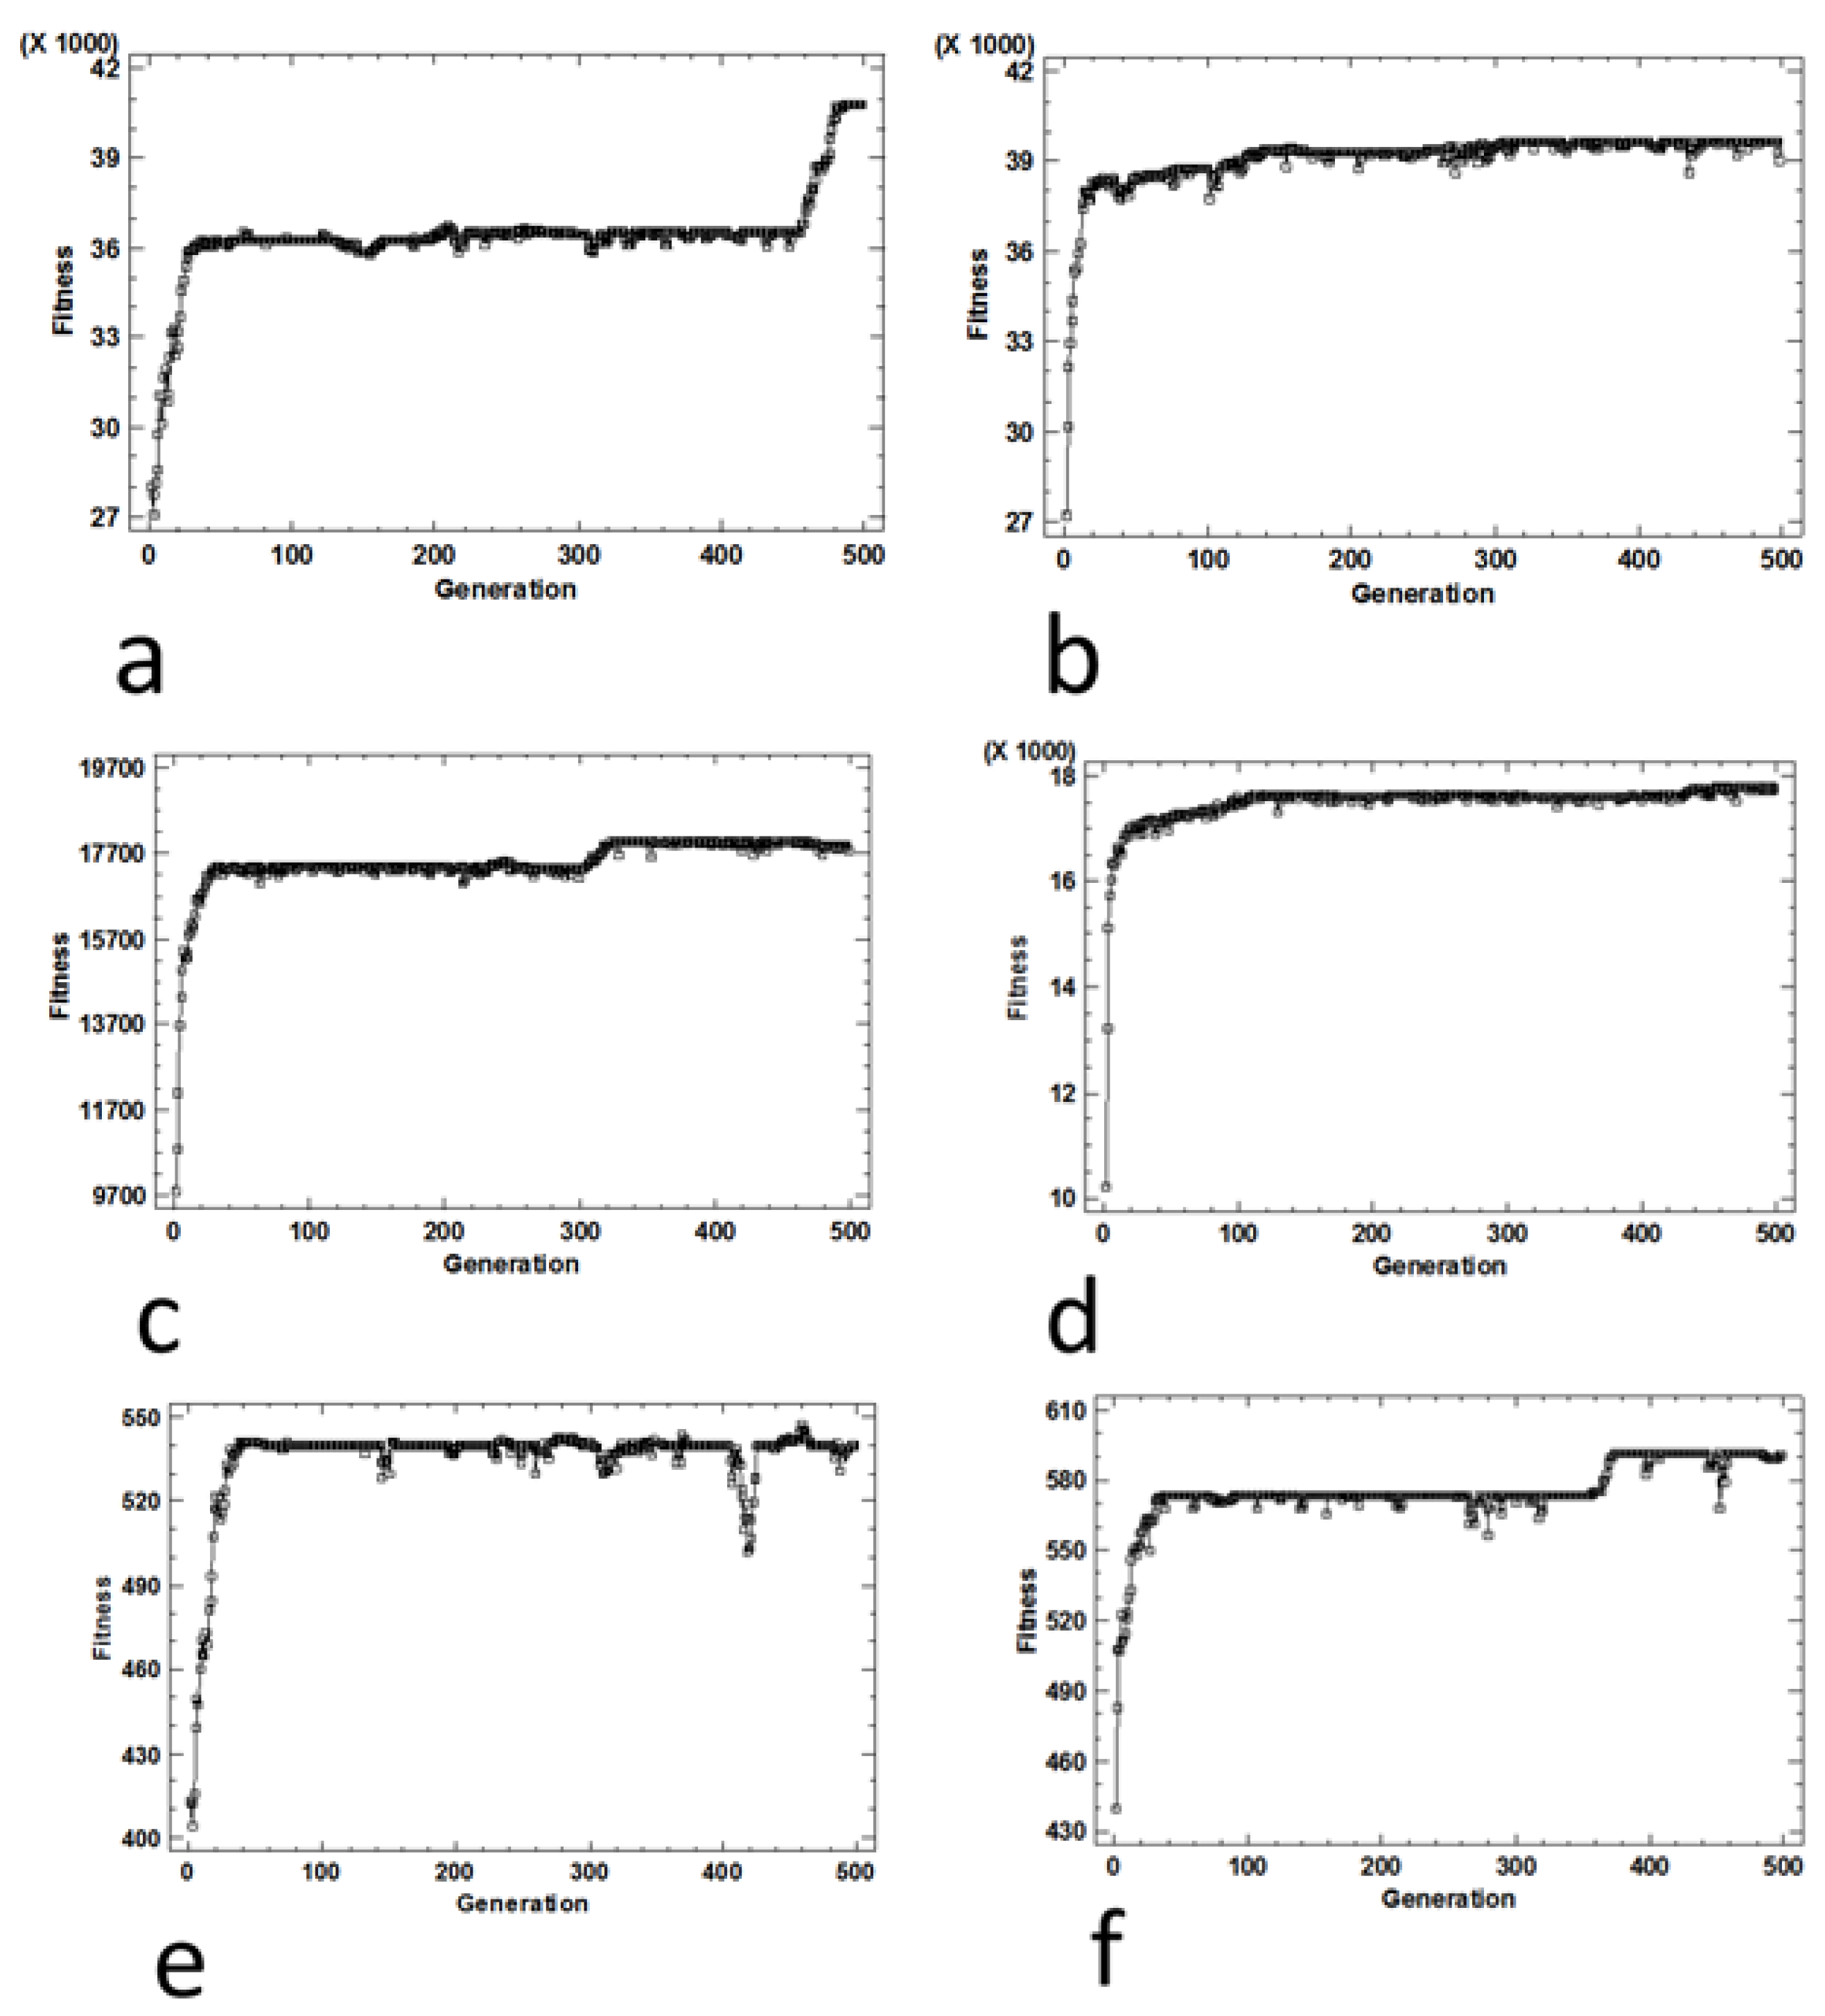
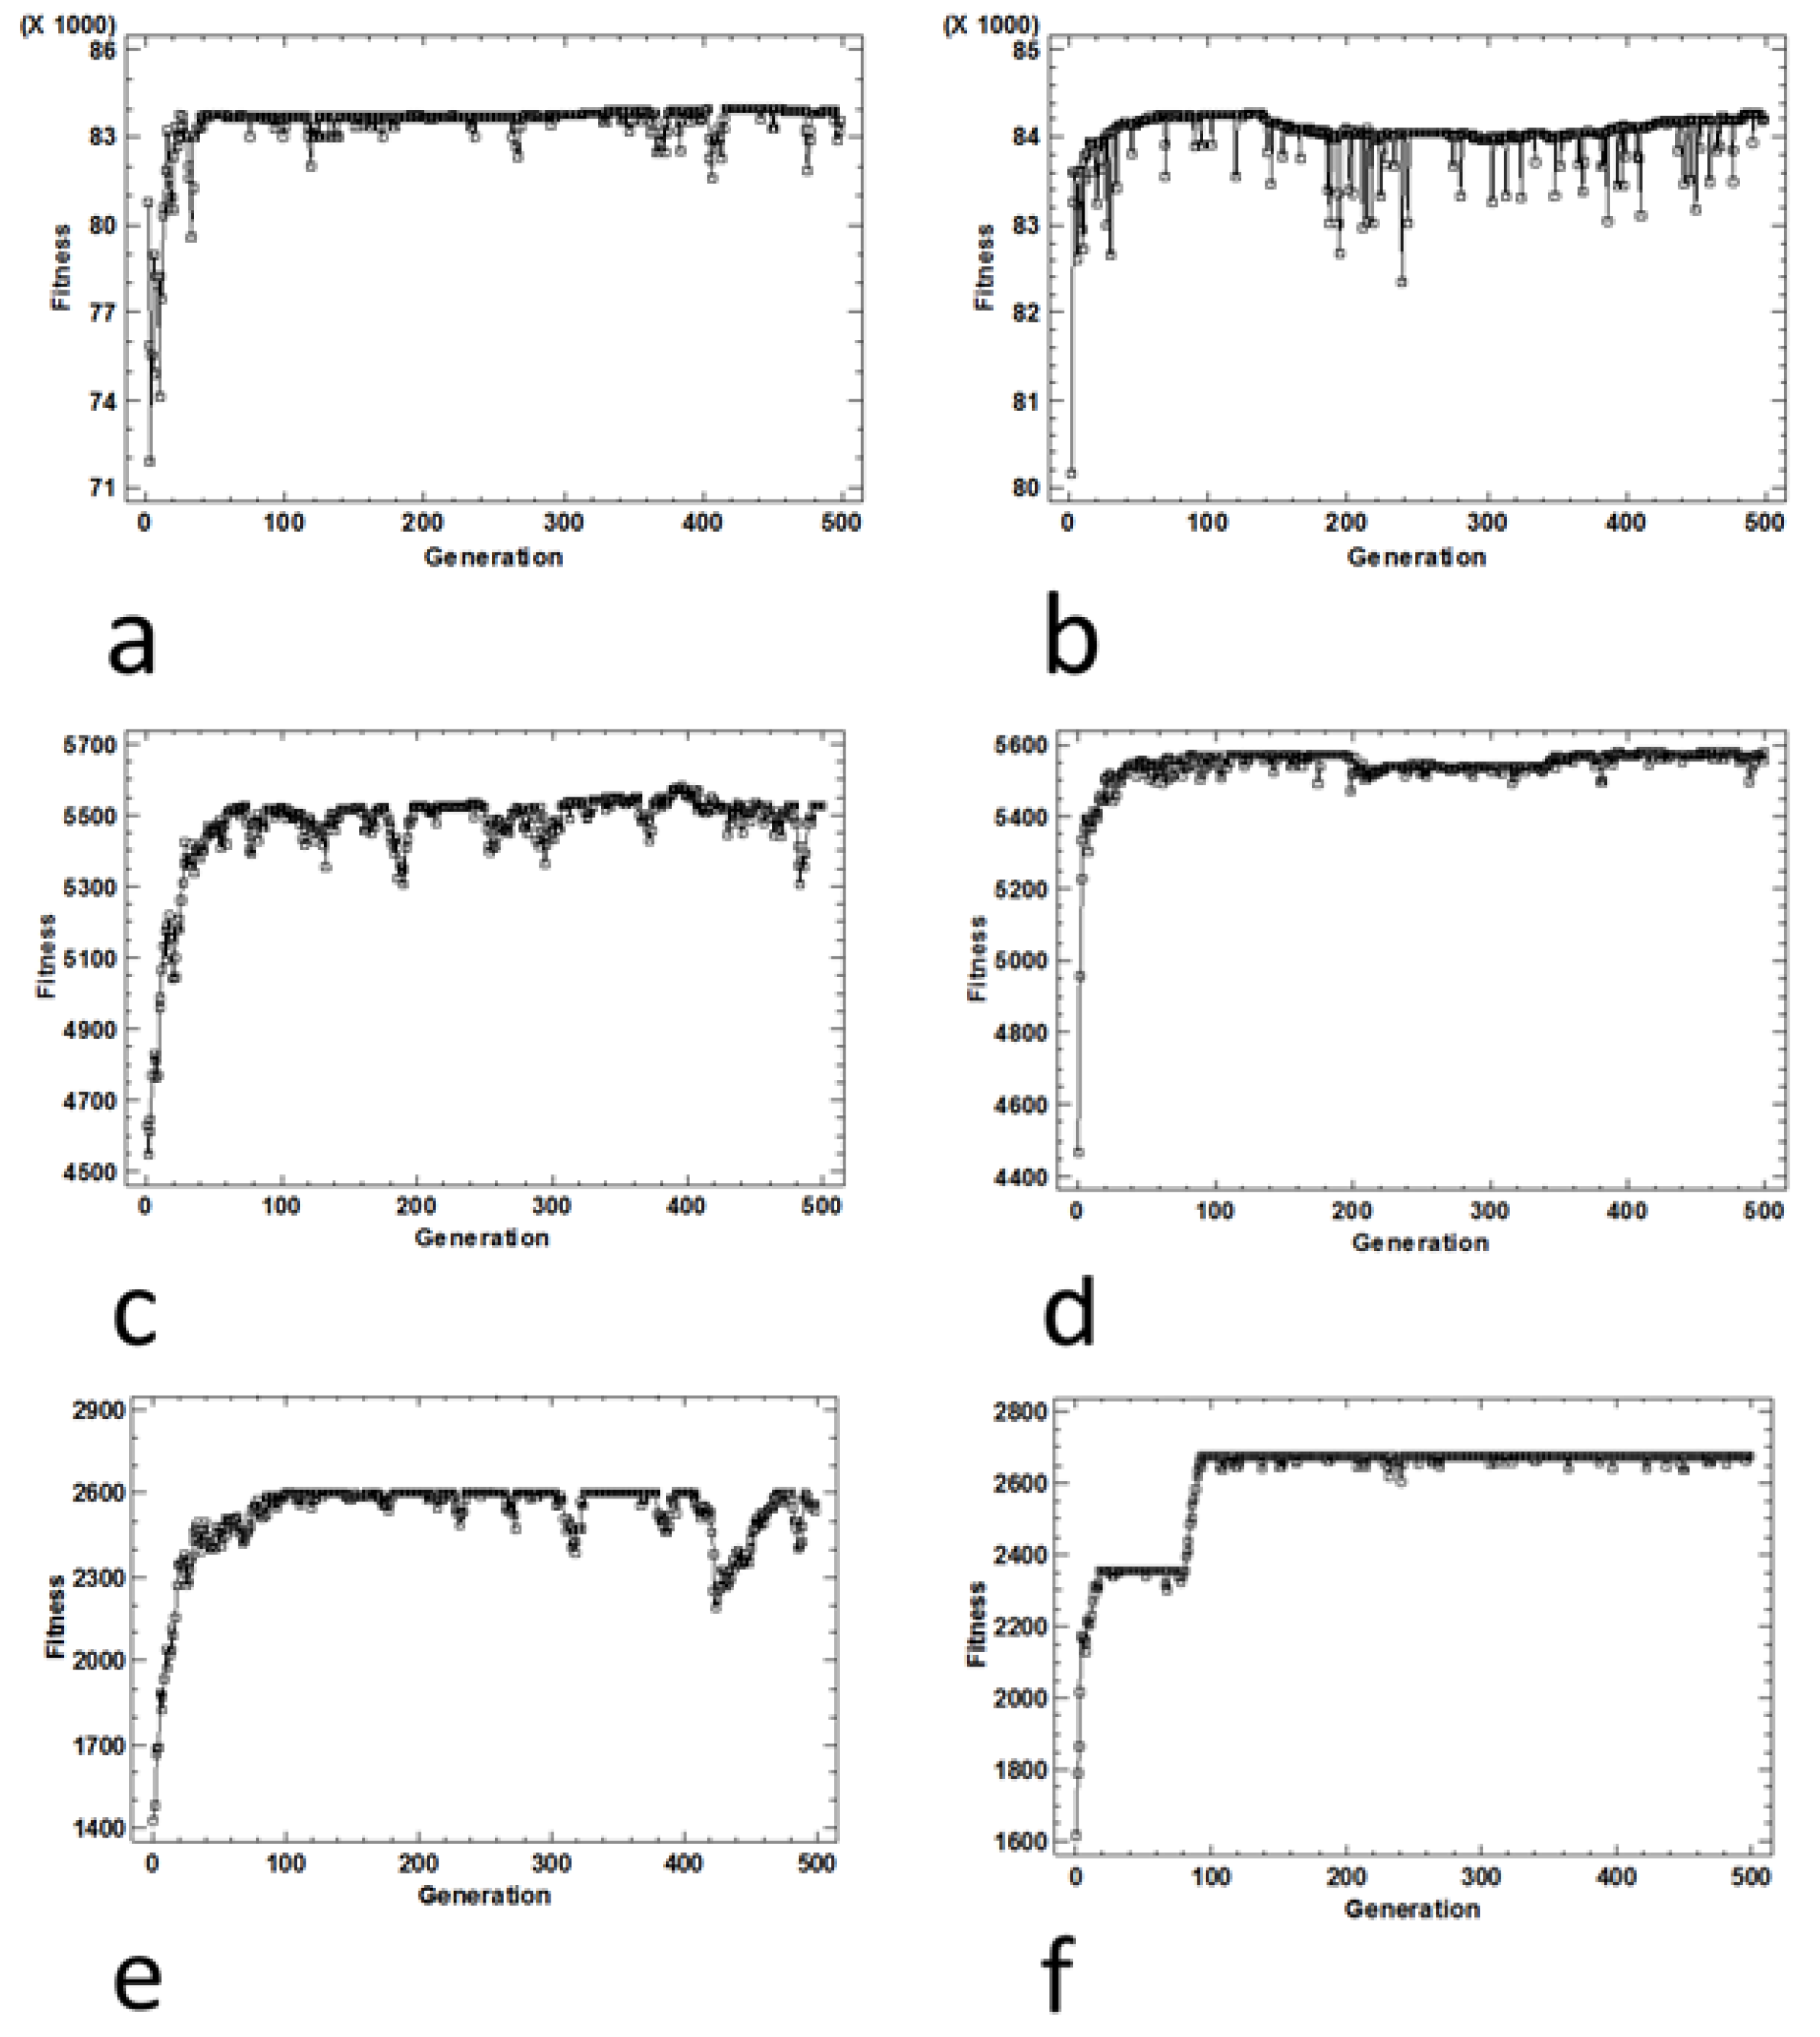
Regarding the two evolutionary algorithms, we can conclude that there are no differences in the evolutionary convergence between the SGA algorithm and the SMGA algorithm. According to Figure 10 and Figure 11, we can conclude that the kind of crossover operator does not affect the evolution of the population, and in consequence, the algorithm performance.
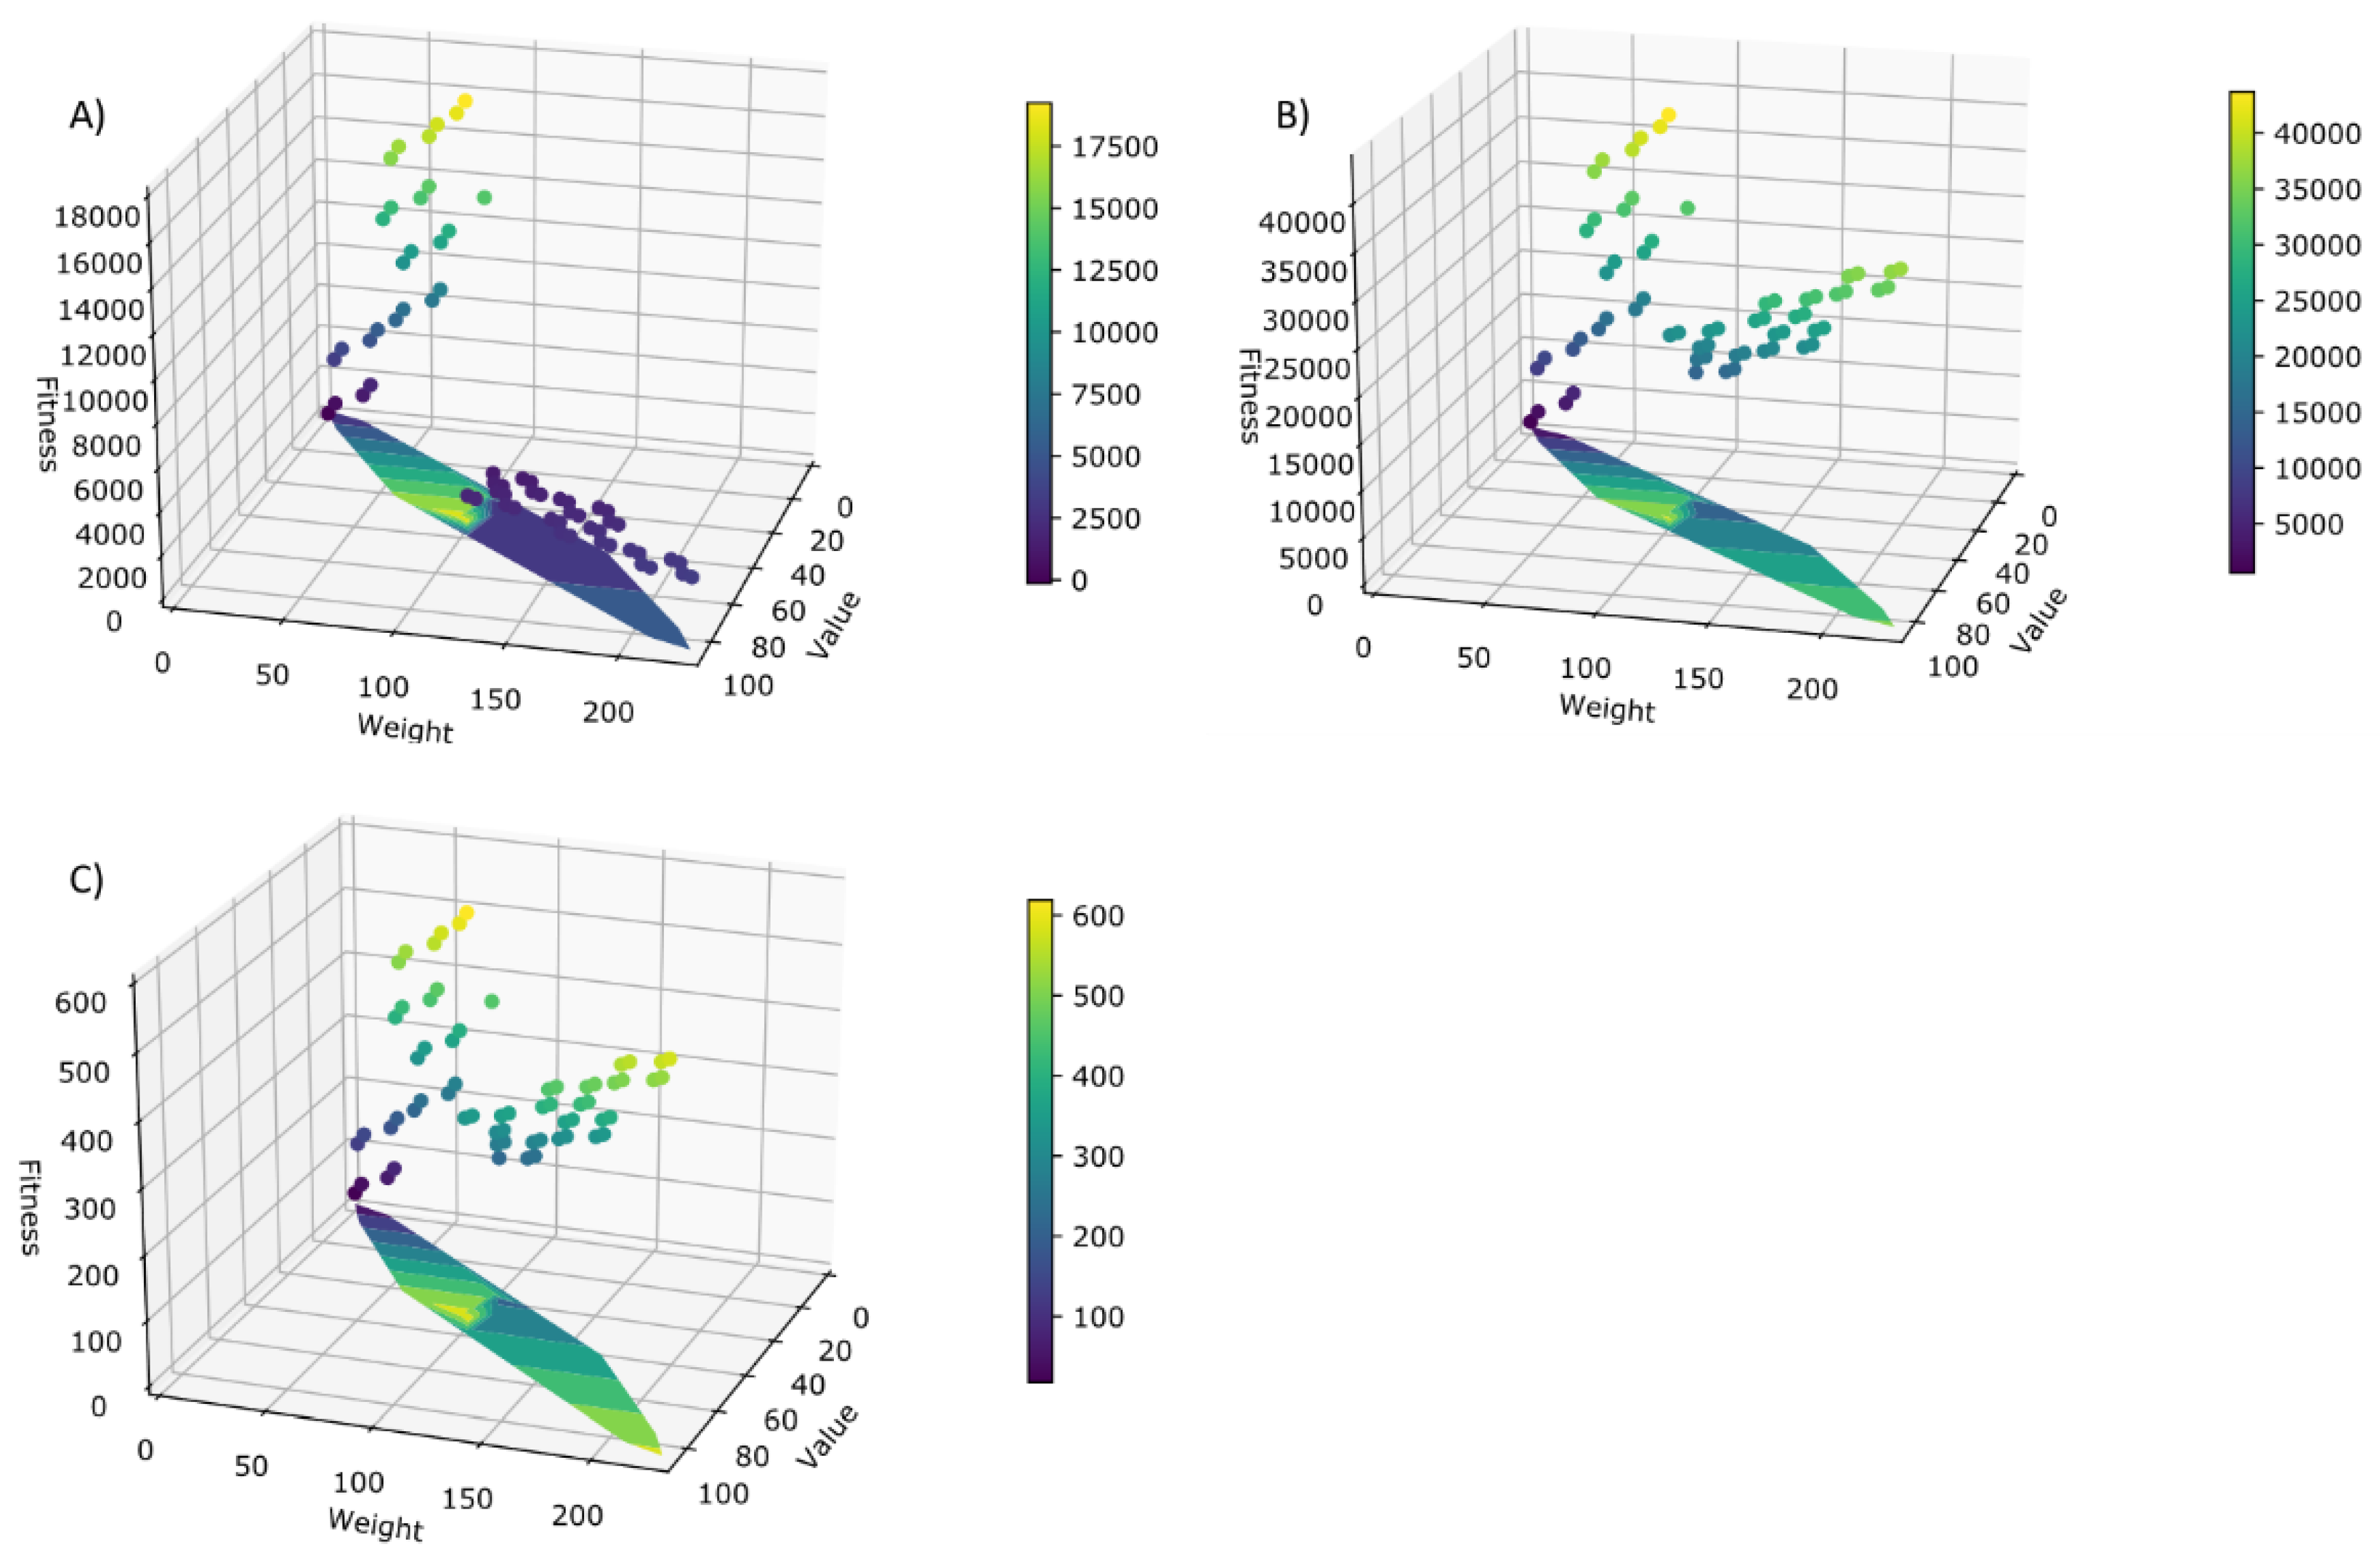
In the 0/1 knapsack problem, the evolutionary surfaces (Figure 10) obtained are very similar to each other, not depending on the screening procedure. However, the most efficient screening method is the one that simulates the Lac operon. In general, we observed a surface that rises from the solution with weight 0 and profit 0 to the optimal solution for the instance with weight 100 and profit 55. Afterwards, the surface underwent a sharp decrease, once the capacity of the knapsack was exceeded (maximum tolerated weight of 100). Therefore, it can be concluded that the proposed screening procedures are capable of generating a representative evolutionary surface (Figure 12) for the addressed problems.
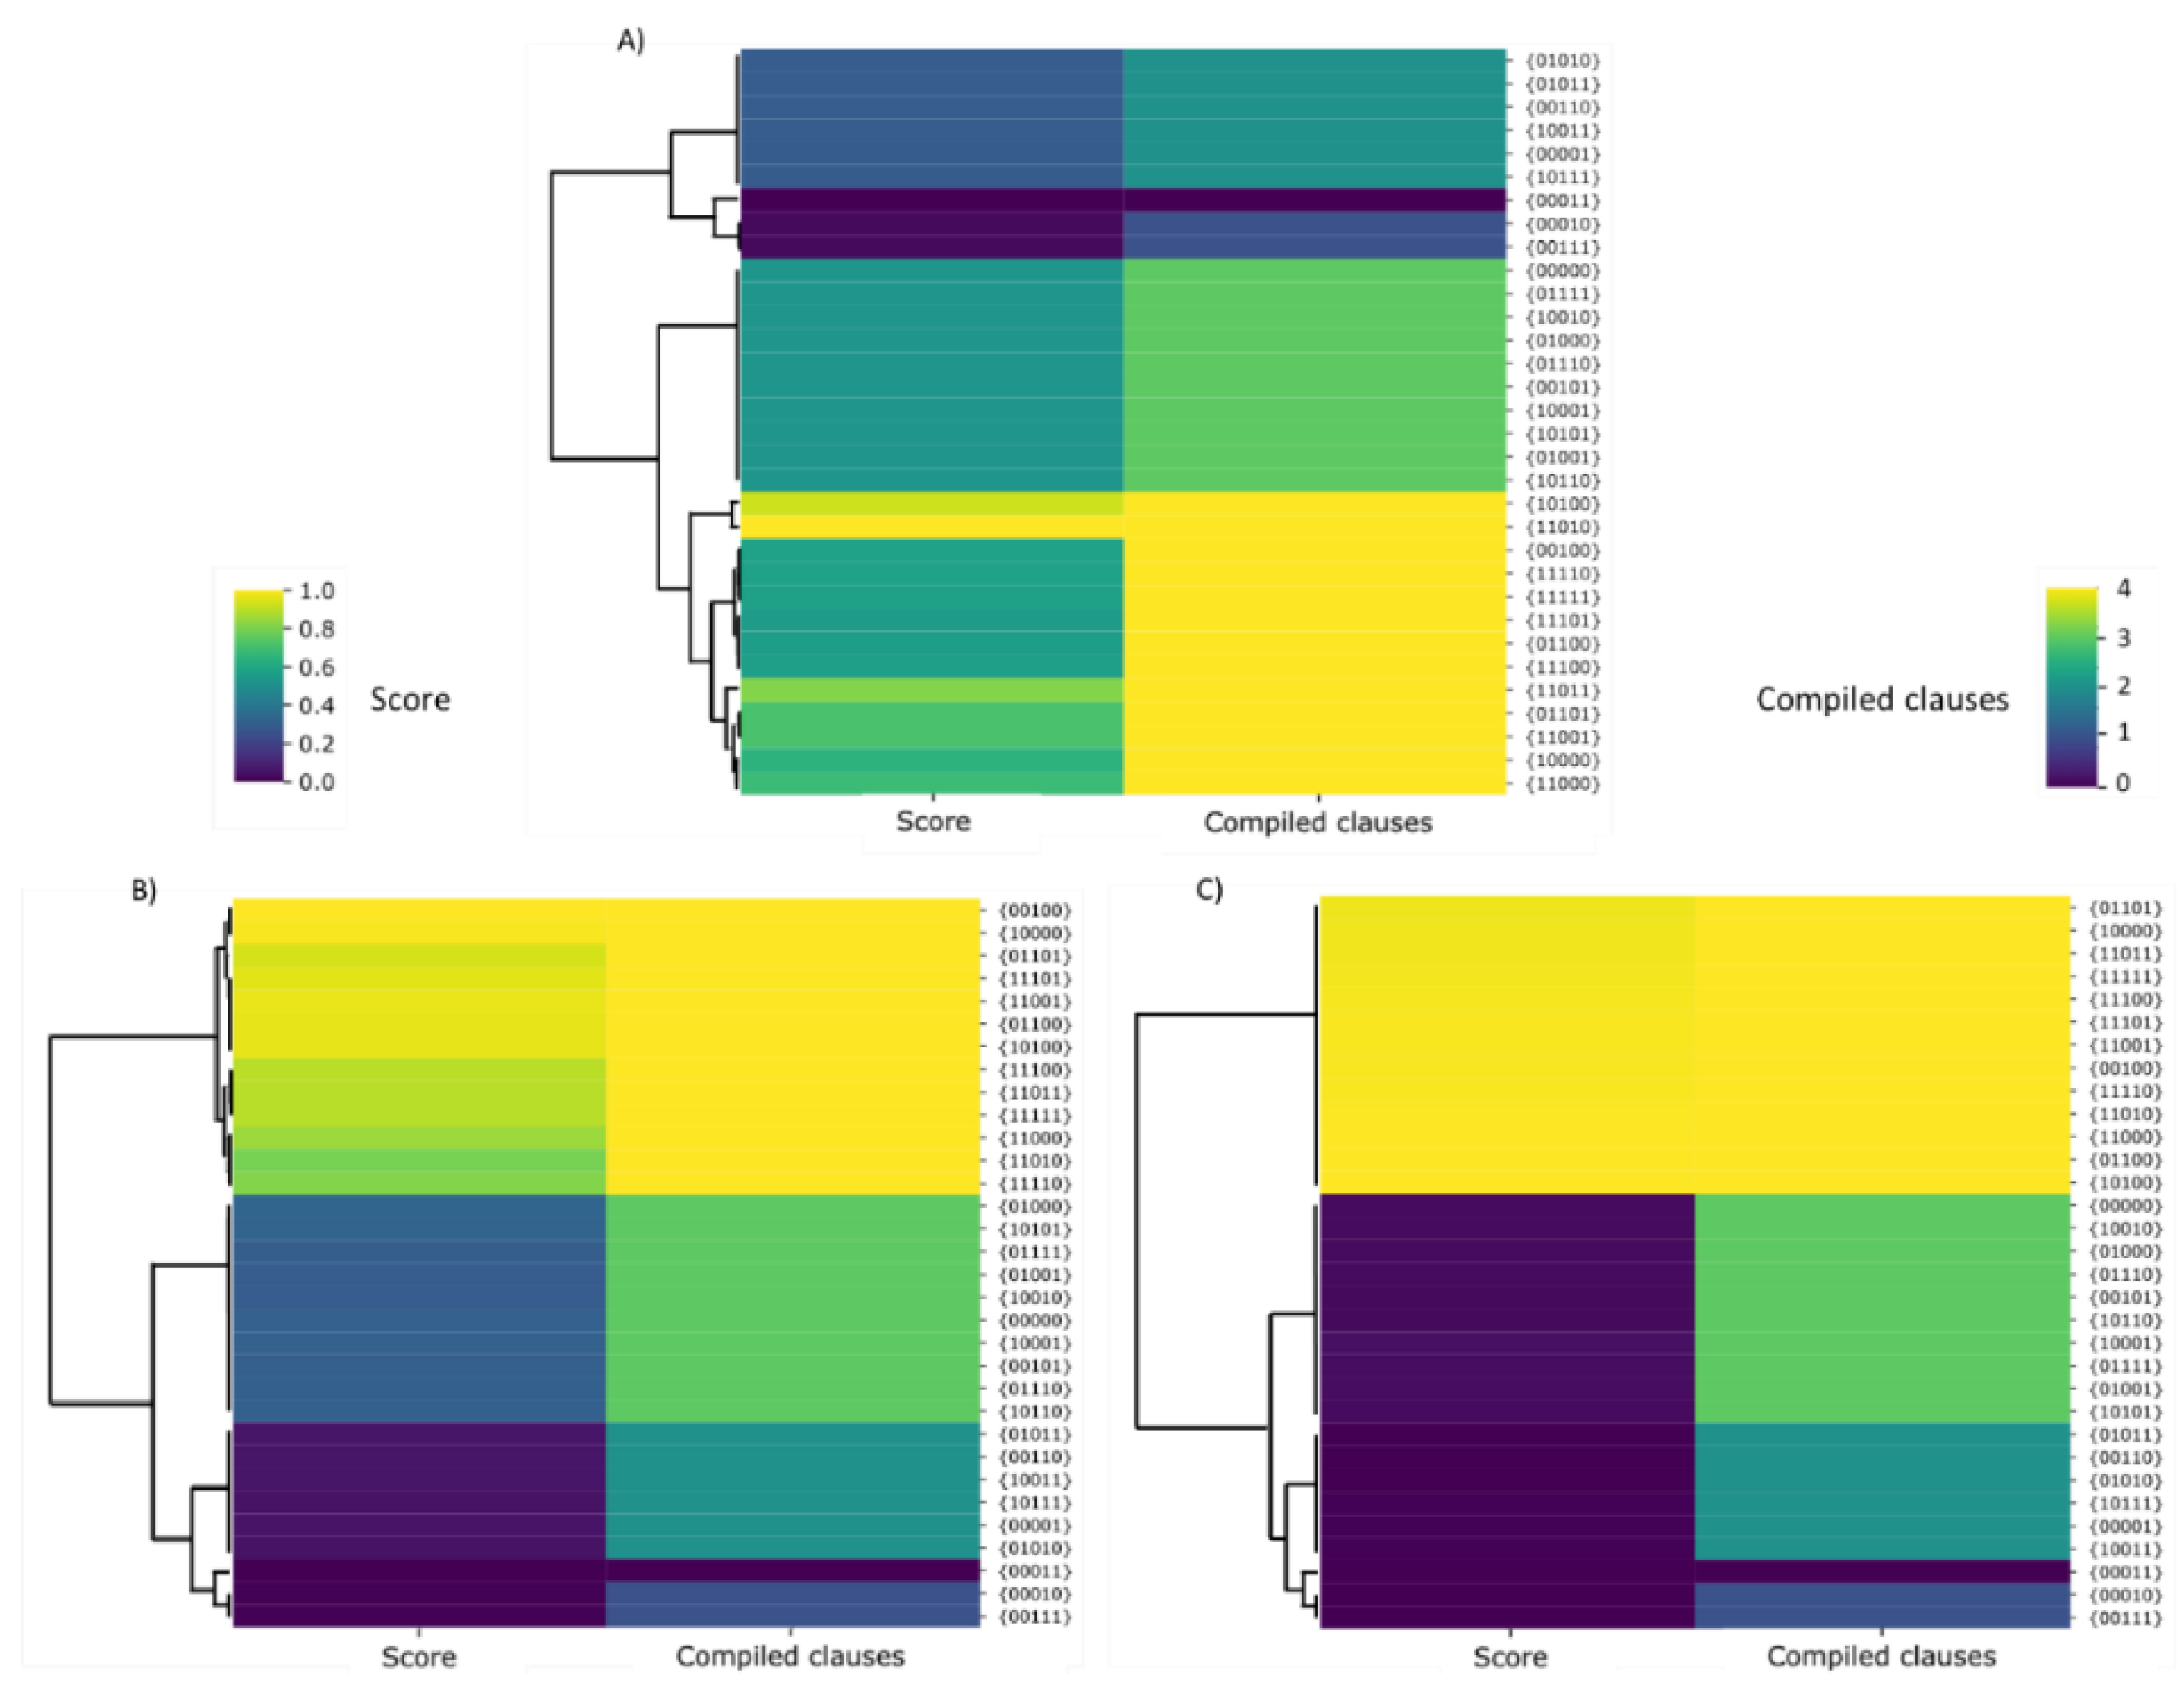
In the simulation experiments carried out to solve the 2-SAT problem (Figure 11), the screening methods were evaluated as in the previous 0/1 knapsack problem, concluding that screening based on antibiotic selection is the most suitable procedure. In order to evaluate the similarity of the solutions, a cluster analysis was carried out with the solutions obtained for each screening procedure. According to the cluster or conglomerate analysis shown in Figure 13, we can conclude that chemotaxis procedures do not adequately select the optimal solutions, i.e., those that satisfy the 4 clauses, from the remaining solutions. However, when the screening method was based on an antibiotic or Lac operon, the optimal solution was detected and therefore discriminated from the remaining solutions.
When fitness was evaluated with the antibiotic-based screening method (Figure 13), then it can be observed that there was a sharp change in the standardized fitness values or scores between the optimal solution and the remaining solutions. Thus, the resistance of the bacteria to the antibiotic was only achieved for the optimal Boolean propositions. When the screening procedure was based on antibiotic resistance, then the simulation with synthetic bacteria fairly well captured the type of selection that an antibiotic does with real bacteria. In such a case, all antibiotic-sensitive bacteria die, with only the antibiotic-resistant ones surviving. Furthermore, the results obtained with the screening procedure based on the Lac operon (Figure 13) also reflect the molecular mechanisms involved in this form of genetic regulation, which is proper to bacteria. In this case, we observed that the fitness values obtained with this screening method vary gradually, depending on the number of clauses that fulfill the proposition. The explanation behind this fact is that our simulations captured the logic of the operon, since the gradual adjustment of the output with respect to the input is required in an operon genetic network, e.g., the Lac operon. In the Lac operon network, different responses were generated depending on the range of lactose concentrations and the relative presence of its activators or inhibitors.
In the study that we conducted of the run time as a function of complexity, we have shown how it is feasible to find evaluation functions by conducting tests in triplicate by defining a time limit, ts, avoiding the exponential use of resources in the computer. Table 4 shows the total simulation time for all variable combinations in triplicate with ts = 120 (Figure 8). Therefore, we conducted 96 tests per simulation experiment for the 2-SAT and 3-SAT problems in each version of the Gro simulator.
4. Discussion
In general, the results obtained allow us to conclude that the main goal of the work has been successfully achieved. The possibility of simulating the microbial screening procedures used in the laboratory of microbiology, biotechnology or synthetic biology to obtain a fitness evaluation function, opens up interesting possibilities in evolutionary computing. The simulation of a colony of synthetic bacteria, in which we applied a method of screening in silico, also allows us to explore and generate a representative evolutionary surface for the problem addressed. Consequently, the present approach could be useful both in evolutionary computation and in synthetic biology experiments.
It is interesting to note that in SGA and SMGA, there are no differences in their evolutionary convergence to an average maximum fitness. However, we can observe that when recombination is simulated with the Harvey algorithm [19], then the average fitness of the population is slightly higher than the average fitness achieved by classical one-point recombination. Likewise, it is worth noting that of the three procedures studied, the best screening procedure is the one that simulates the presence of antibiotics, a method that constitutes one of the standard protocols in microbiology and synthetic biology laboratories.
Nevertheless, even when the proposed method to obtain the fitness function performs satisfactorily, the fact that it is based on the exponential growth of a bacterial colony could represent a high computational cost. Since the Gro simulator assumes that a synthetic bacterium is a single computational unit, then the screening routines are executed in parallel, one per bacterium. Therefore, the run-time complexity is of the order of O(N2), with N being the number of synthetic bacteria. As the simulated colony grows exponentially, simulations could become computationally demanding. In order to prevent such a scenario, in each of the screening in silico experiments, the simulation time, ts, was limited to 150 simulated minutes (in real time it is equivalent to seconds). This approach avoids the excessive consumption of computer resources, obtaining the fitness output expected to be included in a genetic algorithm.
However, many questions remain open for further study. For example, the effectiveness of screening procedures depends on the nature of the optimization problem to be solved. In the case of the 2-SAT problem, the fitness values vary gradually when the selection and evaluation of the fitness is conducted with the Lac operon, whereas in the case of screening based on antibiotic resistance, the fitness varies in a stepwise fashion (Figure 13B,C). Furthermore, the fitness values obtained by the antibiotic screening method are more homogeneous in terms of score. However, the Lac operon method yields score values that differ significantly between sequences with a different number of clauses. Therefore, in a 2-SAT problem, the antibiotic-based screening technique is the most suitable tool to differentiate between optimal and remaining solutions. However, if we want to identify the number of clauses fulfilling a given sequence, screening with the Lac Operon is more efficient. Therefore, we can conclude that the results obtained with the microbial screening procedures suggest that the selection by antibiotic better solves the problems of discontinuous type, while the selection with the Lac operon provides a better performance for the problems of continuous nature.
Although there are other programming languages [27] available in synthetic biology, the implementation of screening procedures as well as the programming of synthetic bacteria are coded in Gro language. We believe that this cellular programming language has a potential future for the design of routines that could be later used in evolutionary algorithms. The programming in Gro will allow for the design of new genetic operators to simulate many of the genetic features of bacteria [28]. For example, microbial DNA, expression of operons, conjugation, plasmids, etc., developing new protocols and algorithms in the field of evolutionary computing.
Today, advances in synthetic biology represent a source of inspiration from which to develop new algorithms in evolutionary computing. Conversely, synthetic biology finds a source of inspiration in evolutionary computing, therefore the hybridization between the two disciplines could give rise to interesting approaches. The present paper illustrated how from the crossing between both disciplines, it is possible to develop new ideas with potential practical applications.
Supplementary Materials
The scripts for the microbial screening procedures described in this paper are available online at https://doi.org/10.6084/m9.figshare.12156582.v1.
Author Contributions
A.G.B. collaborated in the revision and carried out the coding in Gro language of the microbial screening scripts and the programming in Python language of the evolutionary algorithms. He also conducted the simulation experiments that were used in his Master’s Degree in Industrial and Environmental Biotechnology 2018–2019, Complutense University of Madrid. R.L.-B. devised the general problem, supervised the work of the first author and wrote this paper. All authors have read and agreed to the published version of the manuscript.
Funding
This research received no external funding.
Conflicts of Interest
The authors declare no conflict of interest.
Appendix A
Simulation experiments have been conducted using the microbial screening routines written in Gro language. The Microbial Screening Methods In Silico (MSMIS) scripts can be downloaded from Reference [17]. In the case of the 0/1 knapsack problem, the routines based on antibiotic, Lac operon and chemotaxis are explained in Figure A1, Figure A2 and Figure A3.
However, in the 2-SAT problem, the implementation of the routines is based on a different approach. For example, in the 0/1 knapsack optimization problem, when fitness function is obtained based on the antibiotic resistance screening method, the procedure is implemented according to the script shown in Figure A1. Nevertheless, for the 2-SAT optimization problem, the antibiotic resistance screening method is implemented changing the statement 1 (Figure A1) by:
(OR (gene[0]) (gene[2])) + (OR (gene[0]) (not(gene[3]))) + (OR (gene[1]) (not(gene[3]))) + (OR (gene[1]) (not(gene[4]))) <= 3 & get_signal(antibiotic)>0.1 :{ die()}
Likewise, in the 2-SAT optimization problem, the screening procedure based on the Lac operon (Figure A2, statement 3) is coded with statements:
(OR (gene[0]) (gene[2])) + (OR (gene[0]) (not(gene[3]))) + (OR (gene[1]) (not(gene[3]))) + (OR (gene[1]) (not(gene[4]))) > 3 & glucose <= 0 :{emit_signal(operon_lac,1)}
(OR (gene[0]) (gene[2])) + (OR (gene[0]) (not(gene[3]))) + (OR (gene[1]) (not(gene[3]))) + (OR (gene[1]) (not(gene[4]))) > 3 & glucose>0 :{emit_signal(operon_lac,0)}
(OR (gene[0]) (gene[2])) + (OR (gene[0]) (not(gene[3]))) + (OR (gene[1]) (not(gene[3]))) + (OR (gene[1]) (not(gene[4]))) < 4 :{emit_signal(operon_lac,0)}
Finally, in the chemotaxis screening procedure (Figure A3, statement 3), we would write:
(OR (gene[0]) (gene[2])) + (OR (gene[0]) (not(gene[3]))) + (OR (gene[1]) (not(gene[3]))) + (OR (gene[1]) (not(gene[4]))) > 3 : {motion m1 m2}
Figure A1.
Antibiotic selection routine implemented in Gro language for the 0/1 knapsack problem. The code shows q.w or weight of the knapsack and q.W, which is the maximum capacity (weight) of the knapsack. (1) Conditional sentence of the antibiotic resistance. (2) Antibiotic signal randomly distributed in the environment where the colony of synthetic bacteria grows.

Figure A2.
Lac operon selection routine implemented in Gro language for the 0/1 knapsack problem. (1) Declaration of interactions between signals. The first-order reaction simulates the degradation of biomass (b) by an enzyme (e), i.e., a protein acting as a metabolic reaction catalyst, from which the resulting product is glucose (f). A second reaction command simulates the degradation of lactose by lacZ (operon_lac), resulting in glucose and galactose (f_lac). The third reaction command simulates the degradation of galactose (f_lac) by an enzyme (e). (2) Effect of glucose (f) on bacterial growth rate. (3) Conditional sentences of the Lac operon. (4) Glucose and lactose signals are randomly distributed in the environment where the colony of synthetic bacteria grows.


Once we have obtained the file with the points (x1, y1), (x2, y2), …, (xn, yn) of the evaluation function, for example for the 0/1 knapsack problem, we must obtain the fitness function applying the linear regression method. However, in the 2-SAT problem, this step is not required since we can use the table obtained directly as a method to evaluate the fitness. Assume in the example that we run the script in R:
Resulting in the fitting table and line regression (Figure A4). Thus, the fitness function (GFP is the fitness) is:
| # Reads in data file |
| df<-read.table(file=”C:/Users/…./Gro/knapsack.csv”,header = F, sep = “,”, dec = “.”) |
| attach(df) |
| names(df) |
| # Regression line: gfp = qv * m + b |
| fitness.model<-lm(V2 ~ V1, data = df) |
| summary(fitness.model) |
| # Plot the chart |
| plot( df$V1, df$V2, xlab = ”q.v”, ylab = ”GFP” ) |
| abline(fitness.model) |
GFP = 807.91 q.v − 68.98
| Coefficients: |
| Estimate Standard Error t value Pr(>|t|) |
| (Intercept) −68.989 80.577 −0.856 0.403 |
| V1 807.918 5.959 135.585 <2e-16 *** |
| --- |
| Significance codes: 0 ‘***’ 0.001 ‘**’ 0.01 ‘*’ 0.05 ‘.’ 0.1 ‘ ’ 1 |
| Residual standard error: 197.4 on 19 degrees of freedom |
| Multiple R-squared: 0.999, Adjusted R-squared: 0.9989 |
| F-statistic: 1.838e+04 on 1 and 19 DF, p-value: < 2.2e-16 |
Figure A3.
Chemotaxis selection routine implemented in Gro language for the 0/1 knapsack problem. (1) Code displaying the function that simulates the mechanism of bacterial chemotaxis. When the extracellular signal decreases, i.e., m2 < m1 in the Gro function, then CheY phosphorylation drops, resulting in erratic movement of the bacterium or tumble. Otherwise, if levels of extracellular substance increase, i.e., m2 > m1, then levels of CheY phosphorylation also rise, resulting in the bacterium effectively moving or running. (2) Command to declare the attractive extracellular substance(s) and its degradation (d). (3) Conditional sentence of bacterial chemotaxis. (4) Effect of the extracellular substance on bacterial growth rate.

Figure A4.
Fitness function for the example described in the Appendix A.
Figure A4.
Fitness function for the example described in the Appendix A.

Figure A5.
0/1 knapsack problem implemented in Gro language. (1) Record with the three variables of the optimization problem: weight (q.w), value (q.v) and maximum capacity or weight (q.W) of the knapsack. Note how the weight of the knapsacks is set lower (q.v = 10) than the maximum tolerated weight (q.W = 100), with the initial value of the knapsacks being set in two units (q.v = 2.0). (2) Knapsack instance. (3) Call for the screening routine, in this case, selection is conducted with antibiotics. (4) Save the evaluation or fitness in a file “knapsack.csv”. (5) The termination condition is met when the knapsack includes all items reaching the maximum value, but does not satisfy the weight restriction. In the output of the routine in Gro, i.e., the points (x1, y1), (x2, y2), …, (xn, yn), the value of x is the value of the knapsack (q.v), whereas y, i.e., the total amount of GFP or fitness value, is calculated as stats.num*stats.mean.

Figure A6.
SAT problem implemented in Gro language. (1) List (gene) of which elements are the variables included in the Boolean expression, initializing the list as {0, 0, 0, 0, 0}. (2) Boolean expression for a 2-SAT problem. (3) Calculation of y = (outcome). (4) Conditional sentence of the antibiotic resistance. (5) Hill function models the GFP reporter protein synthesis as a function of y value, and therefore, the number of satisfied clauses. In the output of the routine in Gro, i.e., evaluation table, the gene value is the number of variables that satisfy the Boolean expression (2), while the total amount of GFP or fitness is given by stats.num*stats.average.

References
- Holland, J.H. Adaptation in Natural and Artificial Systems, 1st ed.; University of Michigan Press: Ann Arbor, MI, USA, 1975. [Google Scholar]
- Goldberg, D.E. Genetic Algorithms in Search, Optimization, and Machine Learning, 1st ed.; Addison-Wesley Longman Publishing Co., Inc.: Boston, MA, USA, 1989. [Google Scholar]
- Lahoz-Beltra, R. Juega Darwin a los Dados, 1st ed.; Editorial Nivola: Madrid, Spain, 2008. [Google Scholar]
- Davis, L. (Ed.) Handbook of Genetic Algorithms, 1st ed.; Van Nostrand Reinhold: New York, NY, USA, 1991. [Google Scholar]
- Reeves, C. Genetic Algorithms. In Handbook of Genetic Algorithms, 1st ed.; Davis, L., Ed.; Van Nostrand Reinhold: New York, NY, USA, 1991; pp. 55–82. [Google Scholar]
- Mitchell, M.; Forrest, S. Genetic algorithms and artificial life. Artif. Life 1994, 1, 267–289. [Google Scholar] [CrossRef]
- Wiser, M.J.; Lenski, R.E. A comparison of methods to measure fitness in Escherichia coli. PLoS ONE 2015, 10, e0126210. [Google Scholar] [CrossRef] [PubMed] [Green Version]
- Ram, Y.; Dellus-Gur, E.; Bibi, M.; Karkare, K.; Obolski, U.; Feldman, M.W.; Cooper, T.F.; Berman, J.; Hadany, L. Predicting microbial growth in a mixed culture from growth curve data. PNAS 2019, 116, 14698–14707. [Google Scholar] [CrossRef] [PubMed] [Green Version]
- Guo, B.; Abdelraouf, K.; Ledesma, K.; Nikolaou, M.; Tam, V.H. Predicting bacterial fitness cost associated with drug resistance. J. Antimicrob. Chemother. 2012, 67, 928–932. [Google Scholar] [CrossRef] [PubMed] [Green Version]
- Dekel, E.; Alon, U. Optimality and evolutionary tuning of the expression level of a protein. Nature 2005, 436, 588–592. [Google Scholar] [CrossRef] [PubMed]
- Cameron, E.; Bashor, C.J.; Collins, J.J. A brief history of synthetic biology. Nat. Rev. Microbiol. 2014, 12, 381–390. [Google Scholar] [CrossRef] [PubMed]
- MacDonald, I.C.; Deans, T.L. Tools and applications in synthetic biology. Adv. Drug Delivey Rev. 2016, 105, 20–34. [Google Scholar] [CrossRef] [PubMed] [Green Version]
- Lahoz-Beltra, R.; Navarro, J.; Marijuan, P.C. Bacterial computing: A form of natural computing and its applications. Front. Microbiol. 2014, 5, 101. [Google Scholar] [CrossRef] [PubMed] [Green Version]
- Jang, S.S.; Oishi, K.T.; Egbert, R.G.; Klavins, E. Specification and simulation of synthetic multicelled behaviors. ACS Synth. Biol. 2012, 1, 365–374. [Google Scholar] [CrossRef] [PubMed] [Green Version]
- Oishi, K.; Klavins, E. A framework for implementing finite state machines in gene regulatory networks. ACS Synth. Biol. 2014, 3, 652–665. [Google Scholar] [CrossRef] [PubMed]
- Gutiérrez, M.; Gregorio-Godoy, P.; Pérez Del Pulgar, G.; Muñoz, L.; Sáez, S.; Rodríguez-Patón, A. A new improved and extended version of the multicell bacterial simulator gro. ACS Synth. Biol. 2017, 6, 1496–1508. [Google Scholar] [CrossRef] [PubMed]
- Gargantilla Becerra, A.; Lahoz-Beltra, R. A Novel Bio-Inspired Method of Finding the Fitness Function of an Evolutionary Algorithm: Microbial Screening Methods In Silico (MSMIS). figshare. Software. 2020. Available online: https://doi.org/10.6084/m9.figshare.12156582.v1 (accessed on 27 May 2020).
- Lahoz-Beltra, R. Simple Genetic Algorithm (SGA). figshare. Software. 2016. Available online: https://doi.org/10.6084/m9.figshare.3397714.v3 (accessed on 27 May 2020).
- Harvey, I. The microbial genetic algorithm. In Advances in Artificial Life. Darwin Meets von Neumann, Proceedings of the 10th European Conference, ECAL 2009, Budapest, Hungary, 13–16 September 2011; Kampis, G., Karsai, I., Szathmáry, E., Eds.; Lecture Notes in Computer Science, Part II. LNCS 5778; Springer: Berlin, Germany, 2009; Volume G, pp. 126–133. [Google Scholar]
- Pray, L. Antibiotic resistance, mutation rates and MRSA. Nat. Educ. 2008, 1, 30. [Google Scholar]
- Ralston, A. Operons and prokaryotic gene regulation. Nat. Educ. 2008, 1, 216. [Google Scholar]
- Lahoz-Beltra, R. Molecular automata assembly: Principles and simulation of bacterial membrane construction. Biosystems 1997, 44, 209–229. [Google Scholar] [CrossRef]
- Apel, D.; Surette, M.G. Bringing order to a complex molecular machine: The assembly of the bacterial flagella. Biochim. Biophys. Acta 2008, 1778, 1851–1858. [Google Scholar] [CrossRef] [PubMed] [Green Version]
- Lee, V.T.; Schneewind, O. Protein secretion and the pathogenesis of bacterial infection. Genes Dev. 2017, 15, 1725–1752. [Google Scholar] [CrossRef] [PubMed] [Green Version]
- Di Paola, V.; Marijuan, P.C.; Lahoz-Beltra, R. Learning and evolution in bacterial taxis: An operational amplifier circuit modeling the computational dynamics of the prokaryotic ‘two component system’ protein network. Biosystems 2004, 74, 29–49. [Google Scholar] [CrossRef] [PubMed]
- Allen, R.J.; Waclaw, B. Bacterial growth: A statistical physicist’s guide. Rep. Prog. Phys. 2019, 82, 016601. [Google Scholar] [CrossRef] [PubMed] [Green Version]
- Umesh, P.; Naveen, F.; Maheswara Rao, C.U.; Nair, A.S. Programming language for synthetic biology. Syst. Synth. Biol. 2010, 4, 265–269. [Google Scholar] [CrossRef] [PubMed] [Green Version]
- Villa, T.G.; Feijoo-Siota, L.; Sánchez-Pérez, A.; Rama, J.R.; Sieiro, C. Horizontal gene transfer in bacteria, an overview of the mechanisms involved. In Horizontal Gene Transfer; Villa, T., Viñas, M., Eds.; Springer: Cham, Switzerland, 2019; pp. 3–76. [Google Scholar]
Figure 1.
Crossover operator in Simple Genetic Algorithm (SGA) (left) and Simple Microbial-Genetic Algorithm (SMGA) (right) evolutionary algorithms. In both algorithms i, j are the parental chromosomes. In SGA i*, j* are the recombinant chromosomes replacing the parental ones. In SMGA, j* is the recombinant chromosome.

Figure 2.
SGA (left) and SMGA (right) evolutionary algorithms.

Figure 3.
Screening procedures developed in Gro language. (a) Antibiotic resistance, (left) detail of an antibiogram and (right) its simulation. (b) Lac operon, (left) A MacConkey agar plate with a bacterial culture of microbes fermenting lactose and (right) its simulation. (c) Chemotaxis, (left) Pseudomonas aeruginosa swarming motility and (right) its simulation.

Figure 4.
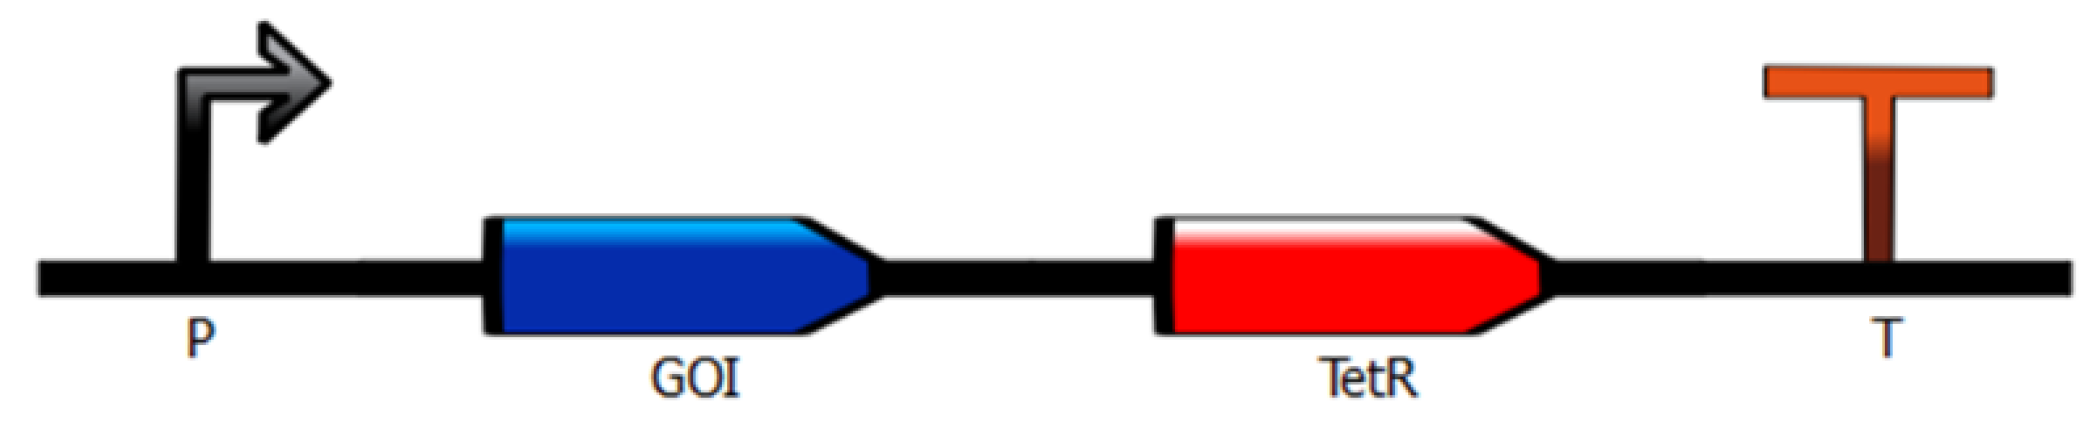
In our simulation experiments, when a bacterium satisfies a condition, it is equivalent in synthetic biology to a bacterium carrying a gene of interest (GOI). This means that the protein it synthesizes is useful in industry, clinics, etc. When GOI is expressed by synthesizing a protein, then the antibiotic resistance gene is also expressed, for example, tetracycline resistance (TetR). As a result, bacteria that do not meet the condition will not express the resistance gene and will die in the presence of the antibiotic. The genome of the bacterium shows the promoter (P) and terminator (T).
Figure 4.
In our simulation experiments, when a bacterium satisfies a condition, it is equivalent in synthetic biology to a bacterium carrying a gene of interest (GOI). This means that the protein it synthesizes is useful in industry, clinics, etc. When GOI is expressed by synthesizing a protein, then the antibiotic resistance gene is also expressed, for example, tetracycline resistance (TetR). As a result, bacteria that do not meet the condition will not express the resistance gene and will die in the presence of the antibiotic. The genome of the bacterium shows the promoter (P) and terminator (T).

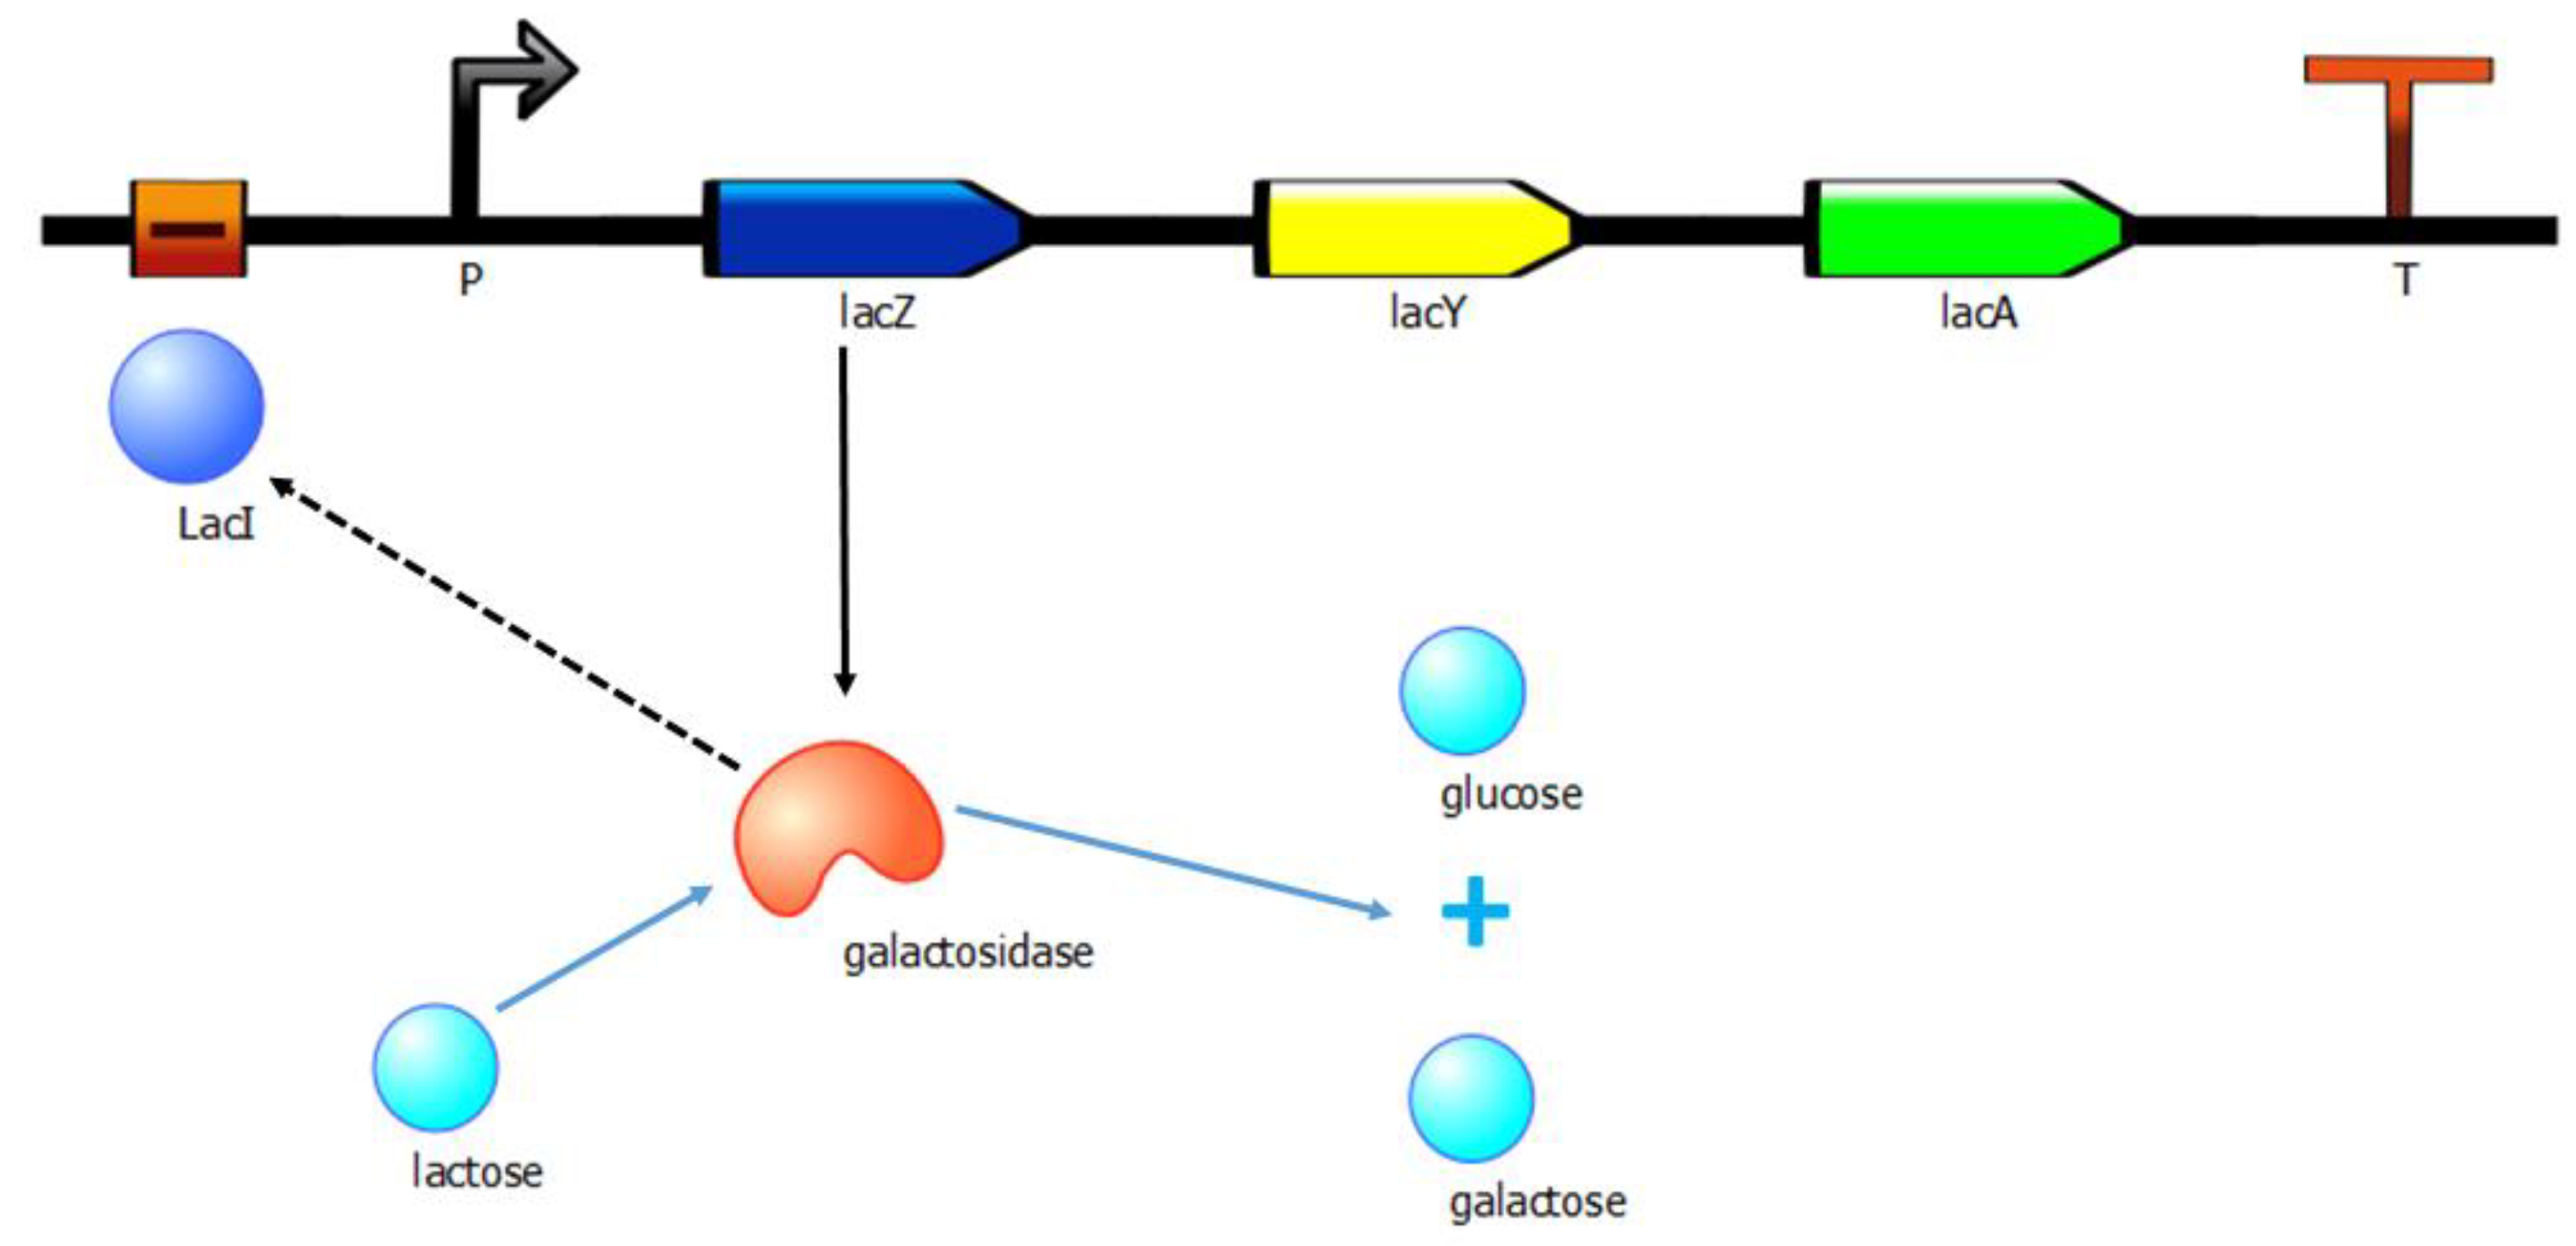
Figure 5.
In simulation experiments, when a bacterium satisfies a given condition, then the bacterium will bear the lactose (Lac) operon, being able to metabolize sugar and lactose. The figure displays an elementary model of the Lac operon: The lacZ gene synthesizes an enzyme named galactosidase, i.e., a protein with catalytic ability, transforming lactose into glucose and galactose. If the medium in which the bacteria is present has enough levels of glucose, then the Lac operon is inhibited by the action of a repressor known as LacI. Other genes in the operon are lacY involved in the entrance of lactose into the bacterium, and lacA. The genome of the bacterium shows the promoter (P) and terminator (T).

Figure 6.
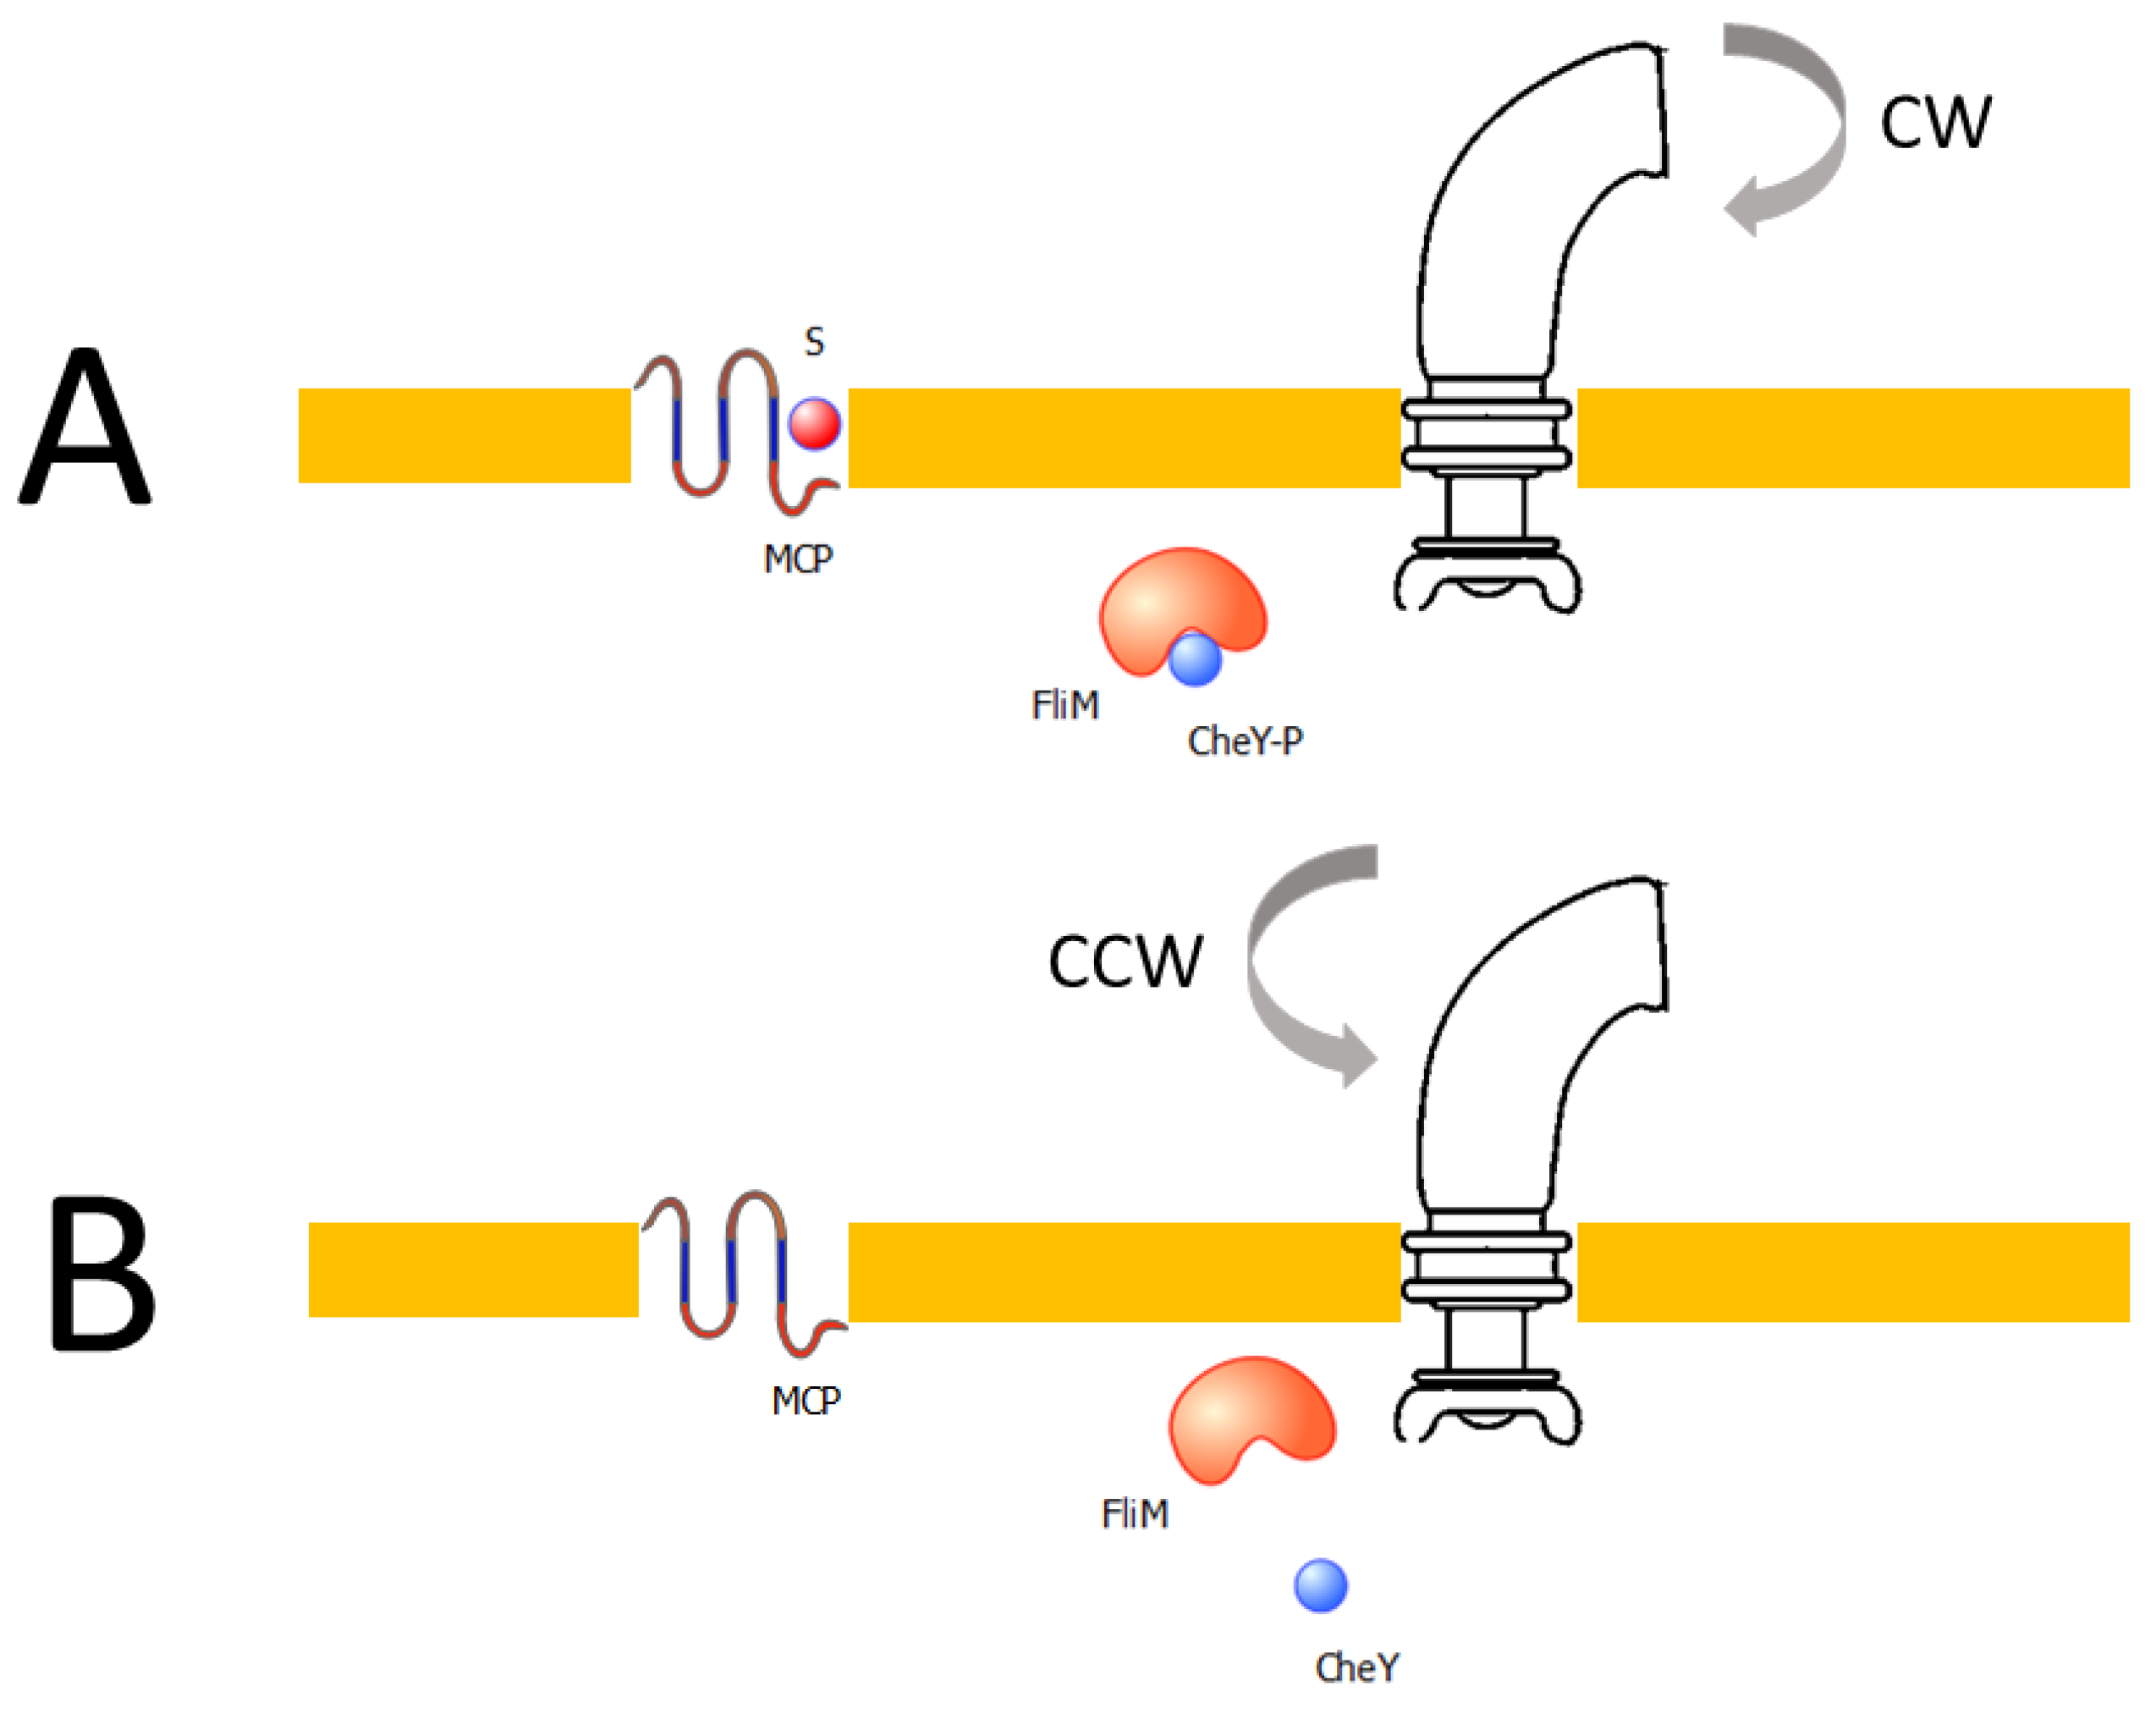
Bacterial chemotaxis. (A) When the S signal is present in the medium, S binds to the MCP (methyl-accepting chemotaxis proteins) receptor leading to CheY phosphorylation (CheY-P). Following, CheY-P will bind with the engine’s FliM protein, resulting in the clockwise (CW) motor rotation, which causes a random movement of the bacteria or bacterial ‘tumbling’. (B) On the other hand, in the absence of the S signal, CheY is defosphorylated, leading to the counterclockwise (CCW) motor rotation and therefore, the bacterium moves in a straight direction or ‘swimming’.
Figure 6.
Bacterial chemotaxis. (A) When the S signal is present in the medium, S binds to the MCP (methyl-accepting chemotaxis proteins) receptor leading to CheY phosphorylation (CheY-P). Following, CheY-P will bind with the engine’s FliM protein, resulting in the clockwise (CW) motor rotation, which causes a random movement of the bacteria or bacterial ‘tumbling’. (B) On the other hand, in the absence of the S signal, CheY is defosphorylated, leading to the counterclockwise (CCW) motor rotation and therefore, the bacterium moves in a straight direction or ‘swimming’.

Figure 7.
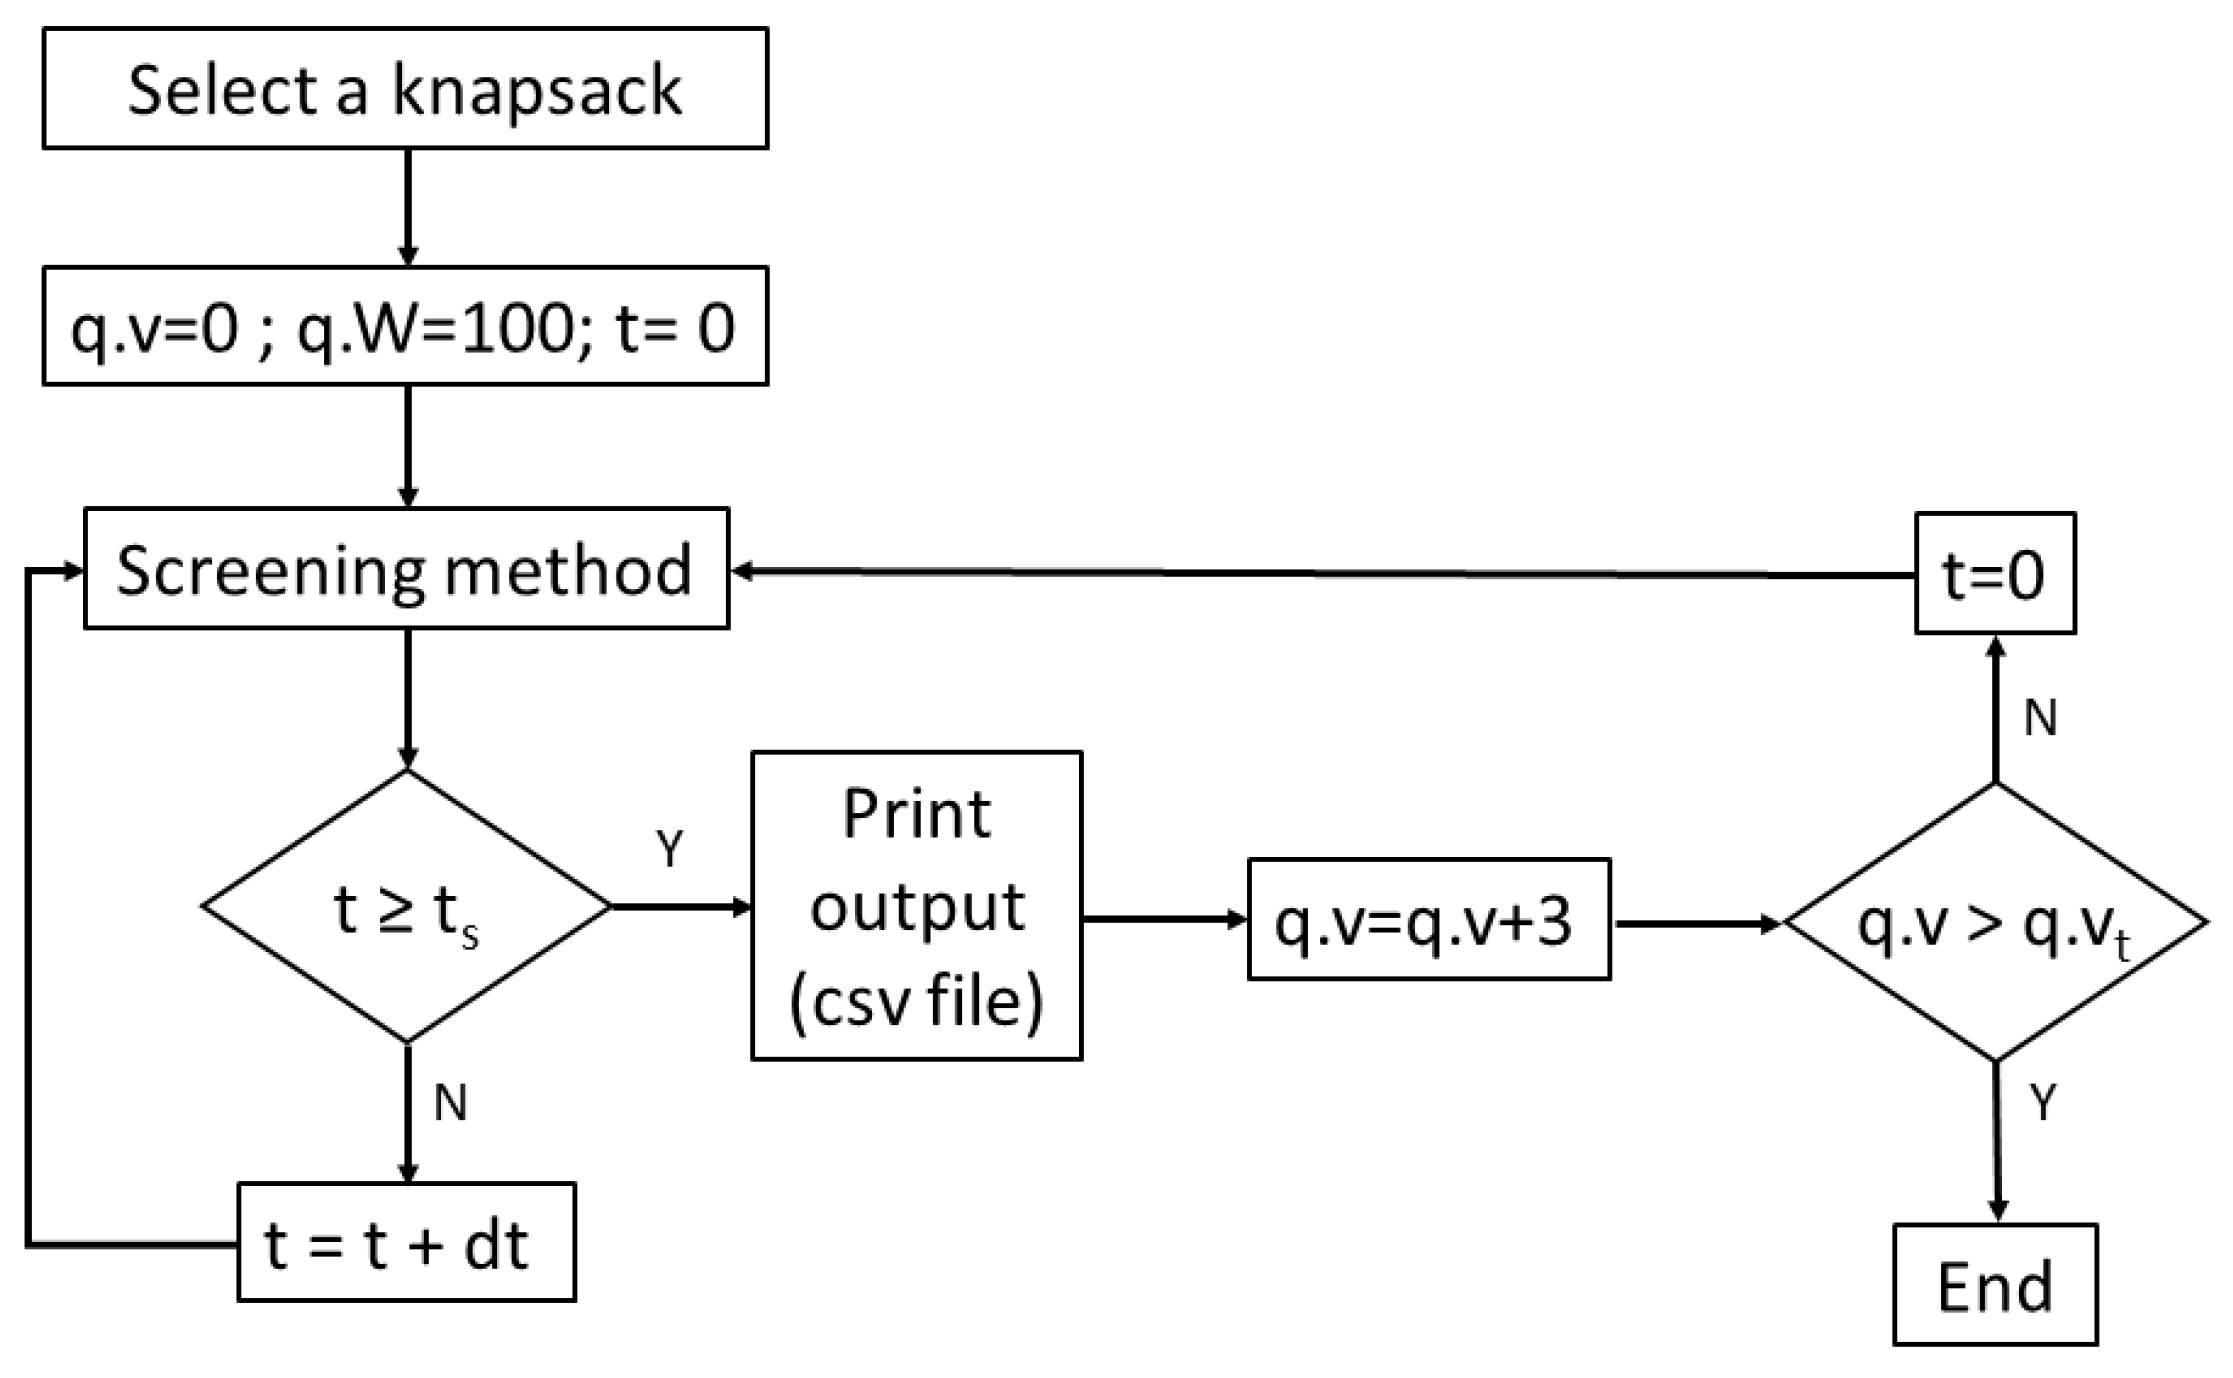
Flowchart of 0/1 knapsack problem implemented in Gro language. The routine records three variables of the optimization problem: weight (q.w), value (q.v) and maximum capacity or weight (q.W) of the knapsack. Next, the algorithm calls the screening routine, saving the output in a csv file once the time of the simulation reaches the imposed limit (ts). Afterwards, the q.v value is updated (i.e., 3 units) and in the case that the resulting value is greater than the sum of all the knapsack values (q.vt), then the Gro routine ends. Otherwise, when the condition is not satisfied, the new q.v is evaluated by the screening method again. Eventually, the output file will contain the value of a set of items q.v (i.e., xi) and its fitness (i.e., yi) for all the possible combinations.
Figure 7.
Flowchart of 0/1 knapsack problem implemented in Gro language. The routine records three variables of the optimization problem: weight (q.w), value (q.v) and maximum capacity or weight (q.W) of the knapsack. Next, the algorithm calls the screening routine, saving the output in a csv file once the time of the simulation reaches the imposed limit (ts). Afterwards, the q.v value is updated (i.e., 3 units) and in the case that the resulting value is greater than the sum of all the knapsack values (q.vt), then the Gro routine ends. Otherwise, when the condition is not satisfied, the new q.v is evaluated by the screening method again. Eventually, the output file will contain the value of a set of items q.v (i.e., xi) and its fitness (i.e., yi) for all the possible combinations.

Figure 8.
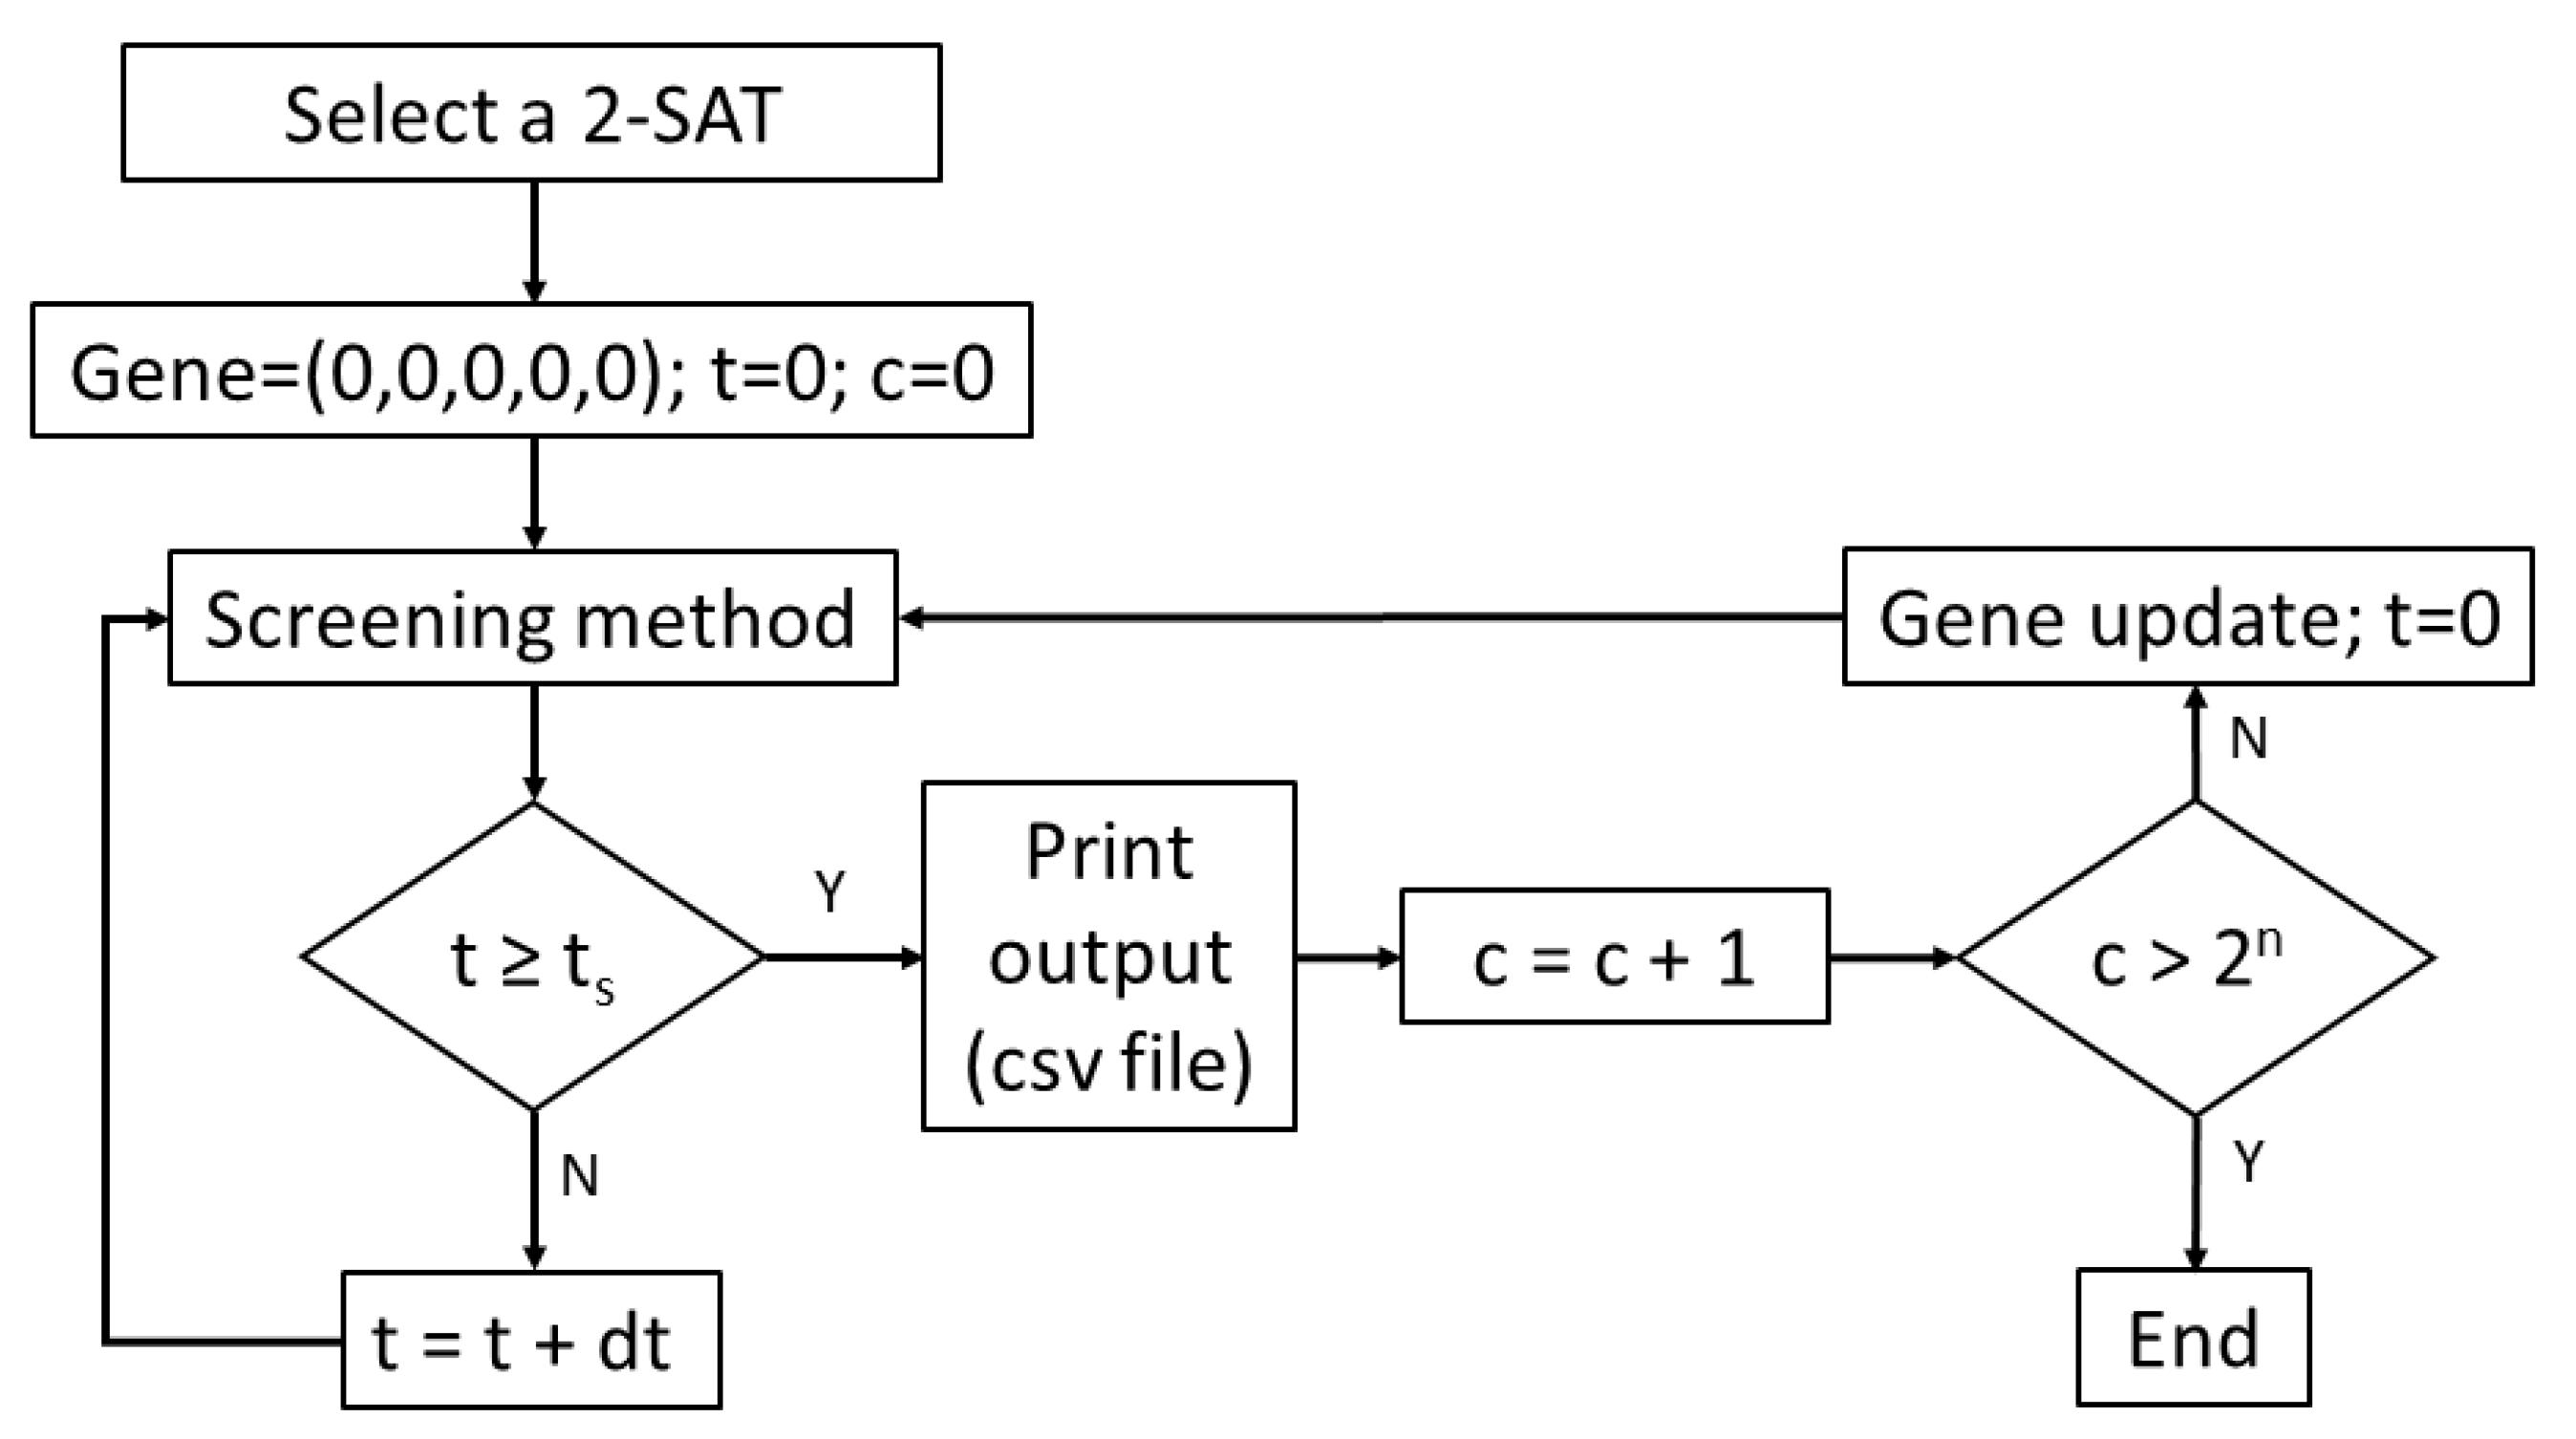
Flowchart of the 2-SAT (2-Satisfiability) problem implemented in Gro language. A list (gene) whose elements are the variables of the Boolean expression is initialized as (0, 0, 0, 0, 0). At this step, c (gene in decimal notation), which is a variable used for controlling the update of gene, is set to 0 along with the time t. Thereafter, the routine calls the screening method in order to calculate the fitness for the gene. Note that the flowchart shares the topology with the knapsack instance (Figure 7) but with c as the control variable. In the output of the routine in Gro, the gene value is the number of variables that satisfy expression while the total amount of GFP or fitness is given by multiplying the mean GFP fluorescence by the colony size (total number of synthetic bacteria).
Figure 8.
Flowchart of the 2-SAT (2-Satisfiability) problem implemented in Gro language. A list (gene) whose elements are the variables of the Boolean expression is initialized as (0, 0, 0, 0, 0). At this step, c (gene in decimal notation), which is a variable used for controlling the update of gene, is set to 0 along with the time t. Thereafter, the routine calls the screening method in order to calculate the fitness for the gene. Note that the flowchart shares the topology with the knapsack instance (Figure 7) but with c as the control variable. In the output of the routine in Gro, the gene value is the number of variables that satisfy expression while the total amount of GFP or fitness is given by multiplying the mean GFP fluorescence by the colony size (total number of synthetic bacteria).

Figure 9.
Screening for the search of the optimal combination of a mutation rate and number of generations values. Experiments conducted for the SGA (A) with antibiotic screening procedure and (C) screening based on the Lac operon. Experiments performed for the SMGA (B) with antibiotic screening procedure and (D) with the Lac operon screening method.

Figure 10.
Performance graph (average fitness per generation) for the 0/1 knapsack problem obtained under (a) SGA with antibiotic screening procedure, (b) SMGA with antibiotic screening procedure, (c) SGA with the Lac operon screening procedure, (d) SMGA with the Lac operon screening procedure, (e) SGA with chemotaxis screening procedure and (f) SMGA with chemotaxis screening procedure.

Figure 11.
Performance graph (average fitness per generation) for the 2-SAT problem obtained under (a) SGA with antibiotic screening procedure, (b) SMGA with antibiotic screening procedure, (c) SGA with Lac operon screening procedure, (d) SMGA with Lac operon screening procedure, (e) SGA with chemotaxis screening procedure and (f) SMGA with chemotaxis screening procedure.

Figure 12.
Spectra of solutions for the 0/1 knapsack problem solved with SGA genetic algorithm, evaluating fitness with (A) Lac operon screening procedure (B) antibiotic screening procedure and (C) chemotaxis screening procedure.
Figure 12.
Spectra of solutions for the 0/1 knapsack problem solved with SGA genetic algorithm, evaluating fitness with (A) Lac operon screening procedure (B) antibiotic screening procedure and (C) chemotaxis screening procedure.

Figure 13.
Spectra of solutions for the 2-SAT problem solved with the SGA, evaluating fitness with screening tools based on (A) the chemotaxis screening procedure, (B) the Lac operon screening procedure and (C) the antibiotic screening procedure.
Figure 13.
Spectra of solutions for the 2-SAT problem solved with the SGA, evaluating fitness with screening tools based on (A) the chemotaxis screening procedure, (B) the Lac operon screening procedure and (C) the antibiotic screening procedure.


Table 1.
0/1 knapsack instance.
| Profit | 40 | 35 | 18 | 4 | 10 | 2 |
|---|---|---|---|---|---|---|
| Weight | 100 | 50 | 45 | 20 | 10 | 5 |
Table 2.
Simulation times in the Gro simulator.
| Gro Version | Real Time | Simulated Time |
|---|---|---|
| [14] | 35 min | 248 min |
| [16] | 4 min | 278 min |
Table 3.
In silico screening output for the 2-SAT optimization problem.
| Satisfied Clauses | Gene | Fitness (yi) |
|---|---|---|
| 3 | {0, 0, 0, 0, 0} | 1669.2 |
| 3 | {0, 0, 0, 0, 0} | 1793.75 |
| 3 | {0, 0, 0, 0, 0} | 1848.92 |
| 2 | {0, 0, 0, 0, 1} | 290.837 |
| 2 | {0, 0, 0, 0, 1} | 282.283 |
| 2 | {0, 0, 0, 0, 1} | 319.313 |
| 1 | {0, 0, 0, 1, 0} | 36.958 |
| 1 | {0, 0, 0, 1, 0} | 31.8889 |
© 2020 by the authors. Licensee MDPI, Basel, Switzerland. This article is an open access article distributed under the terms and conditions of the Creative Commons Attribution (CC BY) license (http://creativecommons.org/licenses/by/4.0/).
Share and Cite
MDPI and ACS Style
Gargantilla Becerra, A.; Lahoz-Beltra, R. A Microbial Screening in Silico Method for the Fitness Step Evaluation in Evolutionary Algorithms. Appl. Sci. 2020, 10, 3936. https://doi.org/10.3390/app10113936
AMA Style
Gargantilla Becerra A, Lahoz-Beltra R. A Microbial Screening in Silico Method for the Fitness Step Evaluation in Evolutionary Algorithms. Applied Sciences. 2020; 10(11):3936. https://doi.org/10.3390/app10113936
Chicago/Turabian StyleGargantilla Becerra, A., and R. Lahoz-Beltra. 2020. "A Microbial Screening in Silico Method for the Fitness Step Evaluation in Evolutionary Algorithms" Applied Sciences 10, no. 11: 3936. https://doi.org/10.3390/app10113936
Note that from the first issue of 2016, this journal uses article numbers instead of page numbers. See further details here.