1. Introduction
Studies on base isolators applied to bridges or buildings started in the late 1970s in countries such as the United States, New Zealand, Japan, and European countries and began in earnest in the mid-1980s [
1,
2]. In the 1990s, seismic design of the base isolation systems, studies on the behavior of the bridges using simple models, and design of the base isolator with nonlinear hysteresis curves were carried out. Furthermore, diverse types of isolators were introduced in the 2000s, including the combination of lead and laminated rubber, the combination of friction plate and elastic springs, and steel dampers [
3].
Especially the resilient-friction base isolator (R-FBI) system has been broadly implemented as an alternative to aseismic design of long-span bridges [
4,
5,
6]. As this kind of system is independent of the changes in the magnitude of seismic load or excitation of the period, it has enhanced performance in the reduction of displacement response [
7]. Particularly, the R-FBI system has been the most applied isolator in both bridges and nuclear power plants in Korea and many researchers have studied the enhancement of its performance and application [
2,
6,
8,
9,
10].
The R-FBI dissipates seismic excitation with the frictional force of a friction plate made of polytetrafluoroethylene (PTFE) and the restoring force of lateral polyurethane springs. From previous studies, the intensity of the surface frictional coefficient of the PTFE plate increases as sliding speed rises, but when the sliding speed is above 150 m/s, it is not influenced by atmospheric temperature and the magnitude of the normal force exerted onto the friction plate. Additionally, it was revealed that there is a reverse proportional relation between the coefficient of the PTFE and contacting pressure, and the sliding speed and the ambient temperature affect an attenuating ratio of the intensity of the frictional coefficient [
10,
11].
Structural dynamics of cable-supported bridges with the base isolators should be experimentally determined in order to identify behavior characteristics under an earthquake [
12]. However, the research has been insufficiently conducted to free vibration tests on the cable-supported bridges with the R-FBI to evaluate the actual dynamics of the bridges and to present rational seismic design procedures with the evaluations.
General performance-based seismic design method stipulates not only design for seismic force and target performance but also a seismic analysis method for each level of the seismic performance of the bridges. Multimodal response spectrum method analysis, time history method analysis, or nonlinear time history method analysis should be used for serviceability performance level, long-term recovery performance level, and no collapse performance level, respectively. The serviceability performance level and the long-term recovery performance level correspond to the seismic design stage, and then the seismic performance verification is performed to evaluate the bending moment and shear forces of pylons and piers at 0.22 g of peak groun acceleration (PGA).
Conservative seismic design method for the cable-supported bridges with the base isolator systems allows the multimodal response spectrum method analysis, the linear analysis method, and the effective stiffness (Keff) should be introduced to reflect inelasticity of the isolator. Nevertheless, the Keff would not manifest the nonlinear behavior of the R-FBI since the behavior characteristics are different from an occurrence of the slip effect in the R-FBI. The objective of the present study is to establish an improved performance-based seismic design procedure for cable-supported bridges with the R-FBI. Free vibration tests were conducted to determine the dynamics of a subjective bridge, and the dynamic characteristics in elastic behavior from the field tests were compared and analyzed with modal shape analyses. Moreover, nonlinear seismic response analyses based on the experiments were performed for the rational seismic design to suggest the improved performance-based seismic design procedure by applying the nonlinearity of the R-FBI.
2. Resilient-Friction Base Isolation System
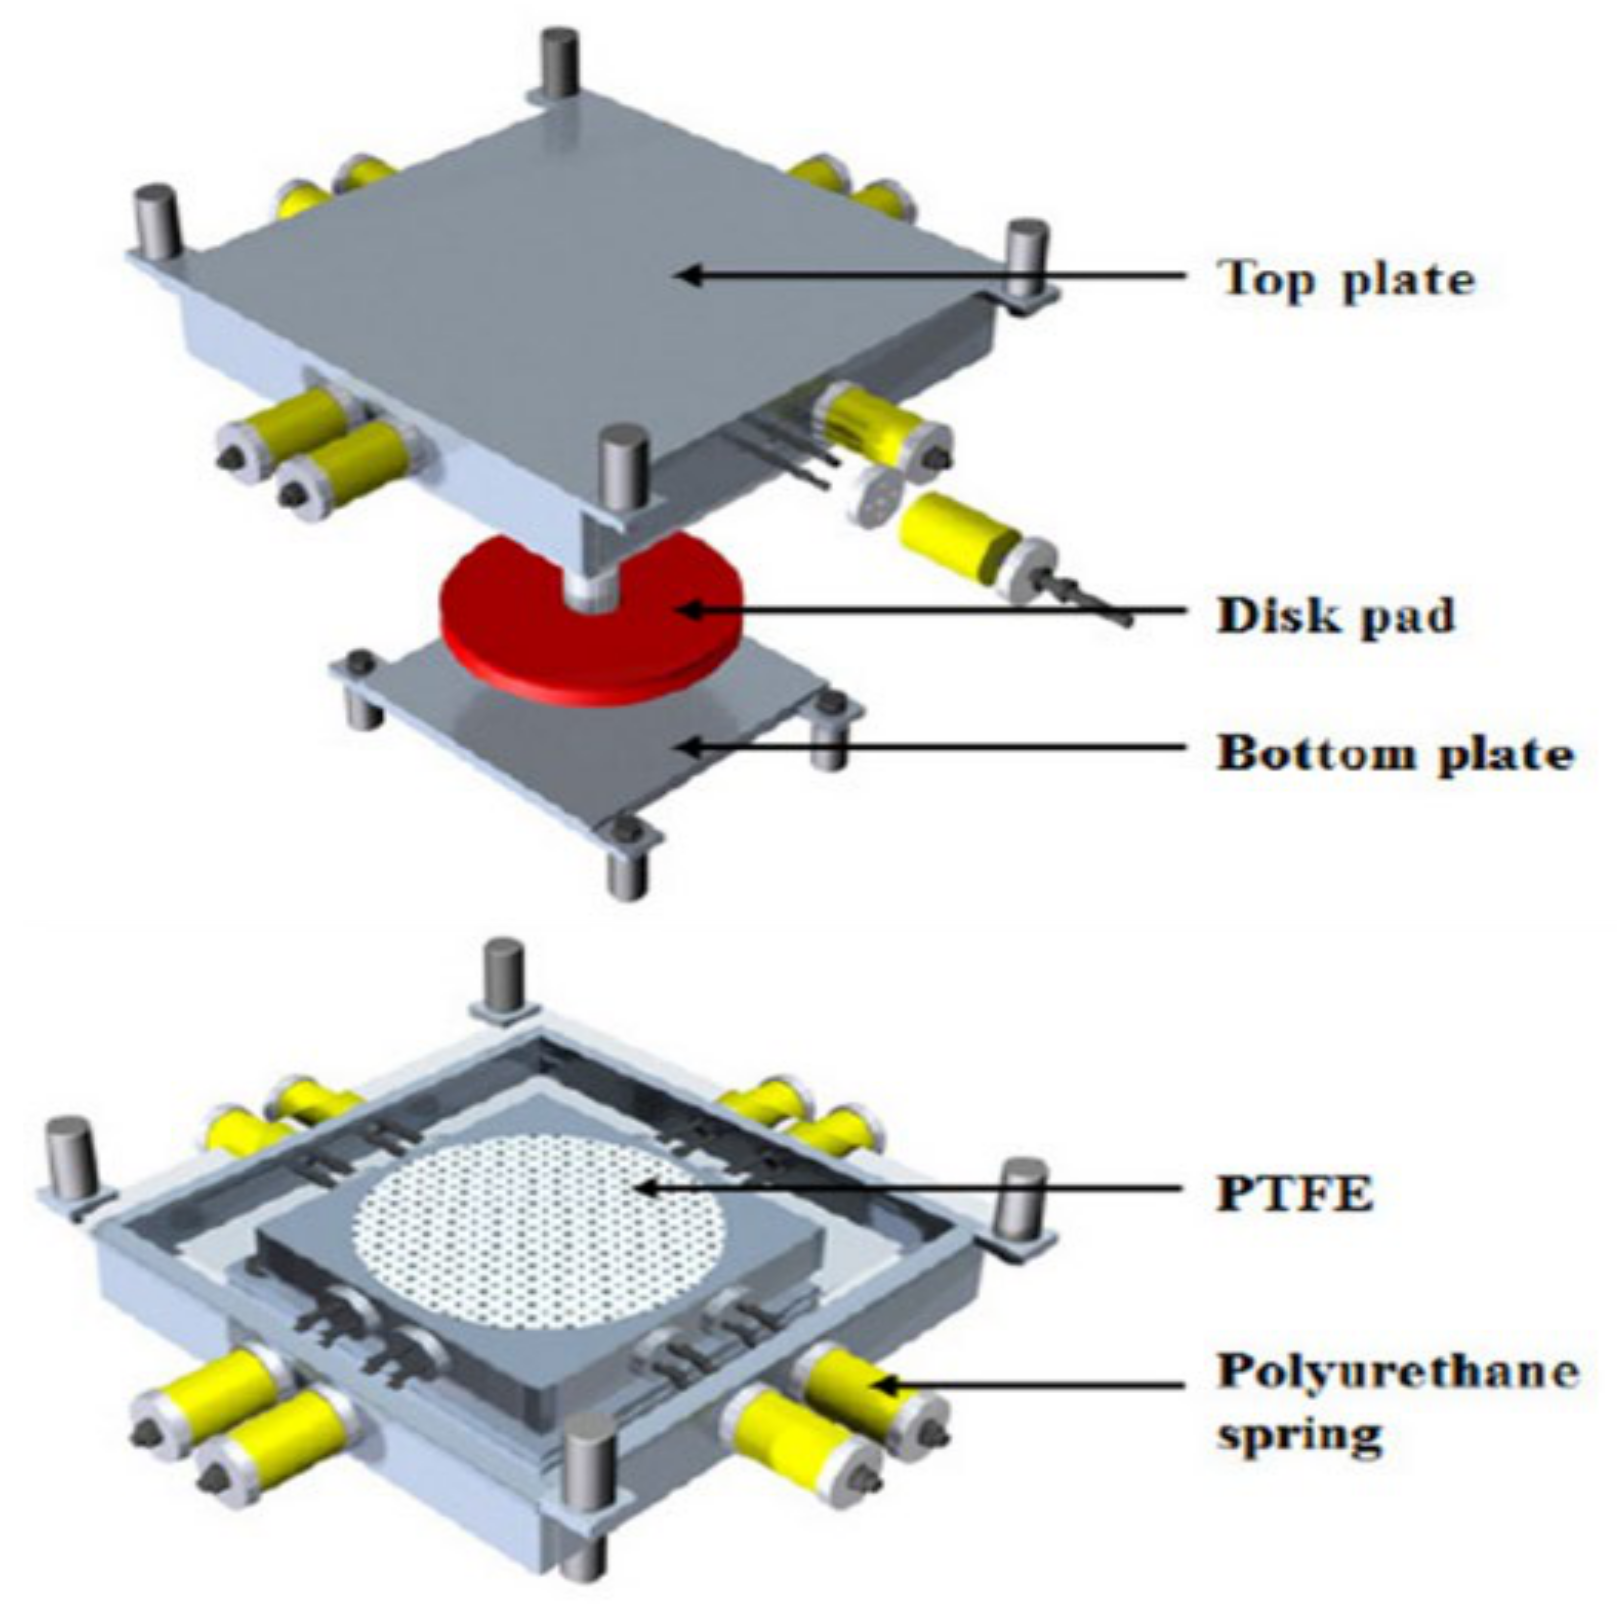
As shown in
Figure 1, an R-FBI system mainly consists of top and bottom plates which are fixed to superstructure and substructure of the bridge respectively. In the bottom plate, a PTFE friction plate, which has a primary stiffness (K
u) performs friction damping and dissipates seismic energy with resistant force caused by its sliding resilient friction. The lateral polyurethane springs that supply restoring forces primarily reposition the PTFE plate back to its original position after finishing displacement responses. The polyurethane disk pad between two plates is a high-strength hard-rubber disc that subjects vertical loading from the superstructure and allows for rotation [
13]. In the previous investigation, the sliding speed and friction coefficient of PTFE has a proportional relationship, but the friction coefficient remains as the sliding speed reaches 150 m/s.
The shear force (
) of R-FBI can be expressed as followed by Equation (1).
where
and
are stiffness and compressive displacement of lateral polyurethane springs, respectively.
is vertical loading from the superstructure of bridge and
is the friction coefficient of PTFE [
6,
7,
8]. In the stage of seismic design of bridges, the multimodal response spectrum analysis method is more likely used for precise analysis in practice rather than non-linear time-history analysis, which is complex and time-consuming. Additionally, the K
eff of the base isolator is generally applied to determine the characteristics of the structural behavior of base isolators.
3. Experimental Programme
3.1. Subject Bridge and Isolator Configuration
In this present study, The Nakdong River bridge (
Figure 2a) was selected as a subject bridge for collecting its dynamic characteristics. The testing bridge, which is located in Yangsan-si, Gyungsangnam-do, Korea (35°17′24.8″ N 129°00′05.5″ E) is a concrete cable-stayed bridge with an asymmetrically curved single-pylon (
Figure 2a). The subject bridge was designed by mitigating the conservative seismic design code in 2011 and has been operating since 2018. As tabulated in
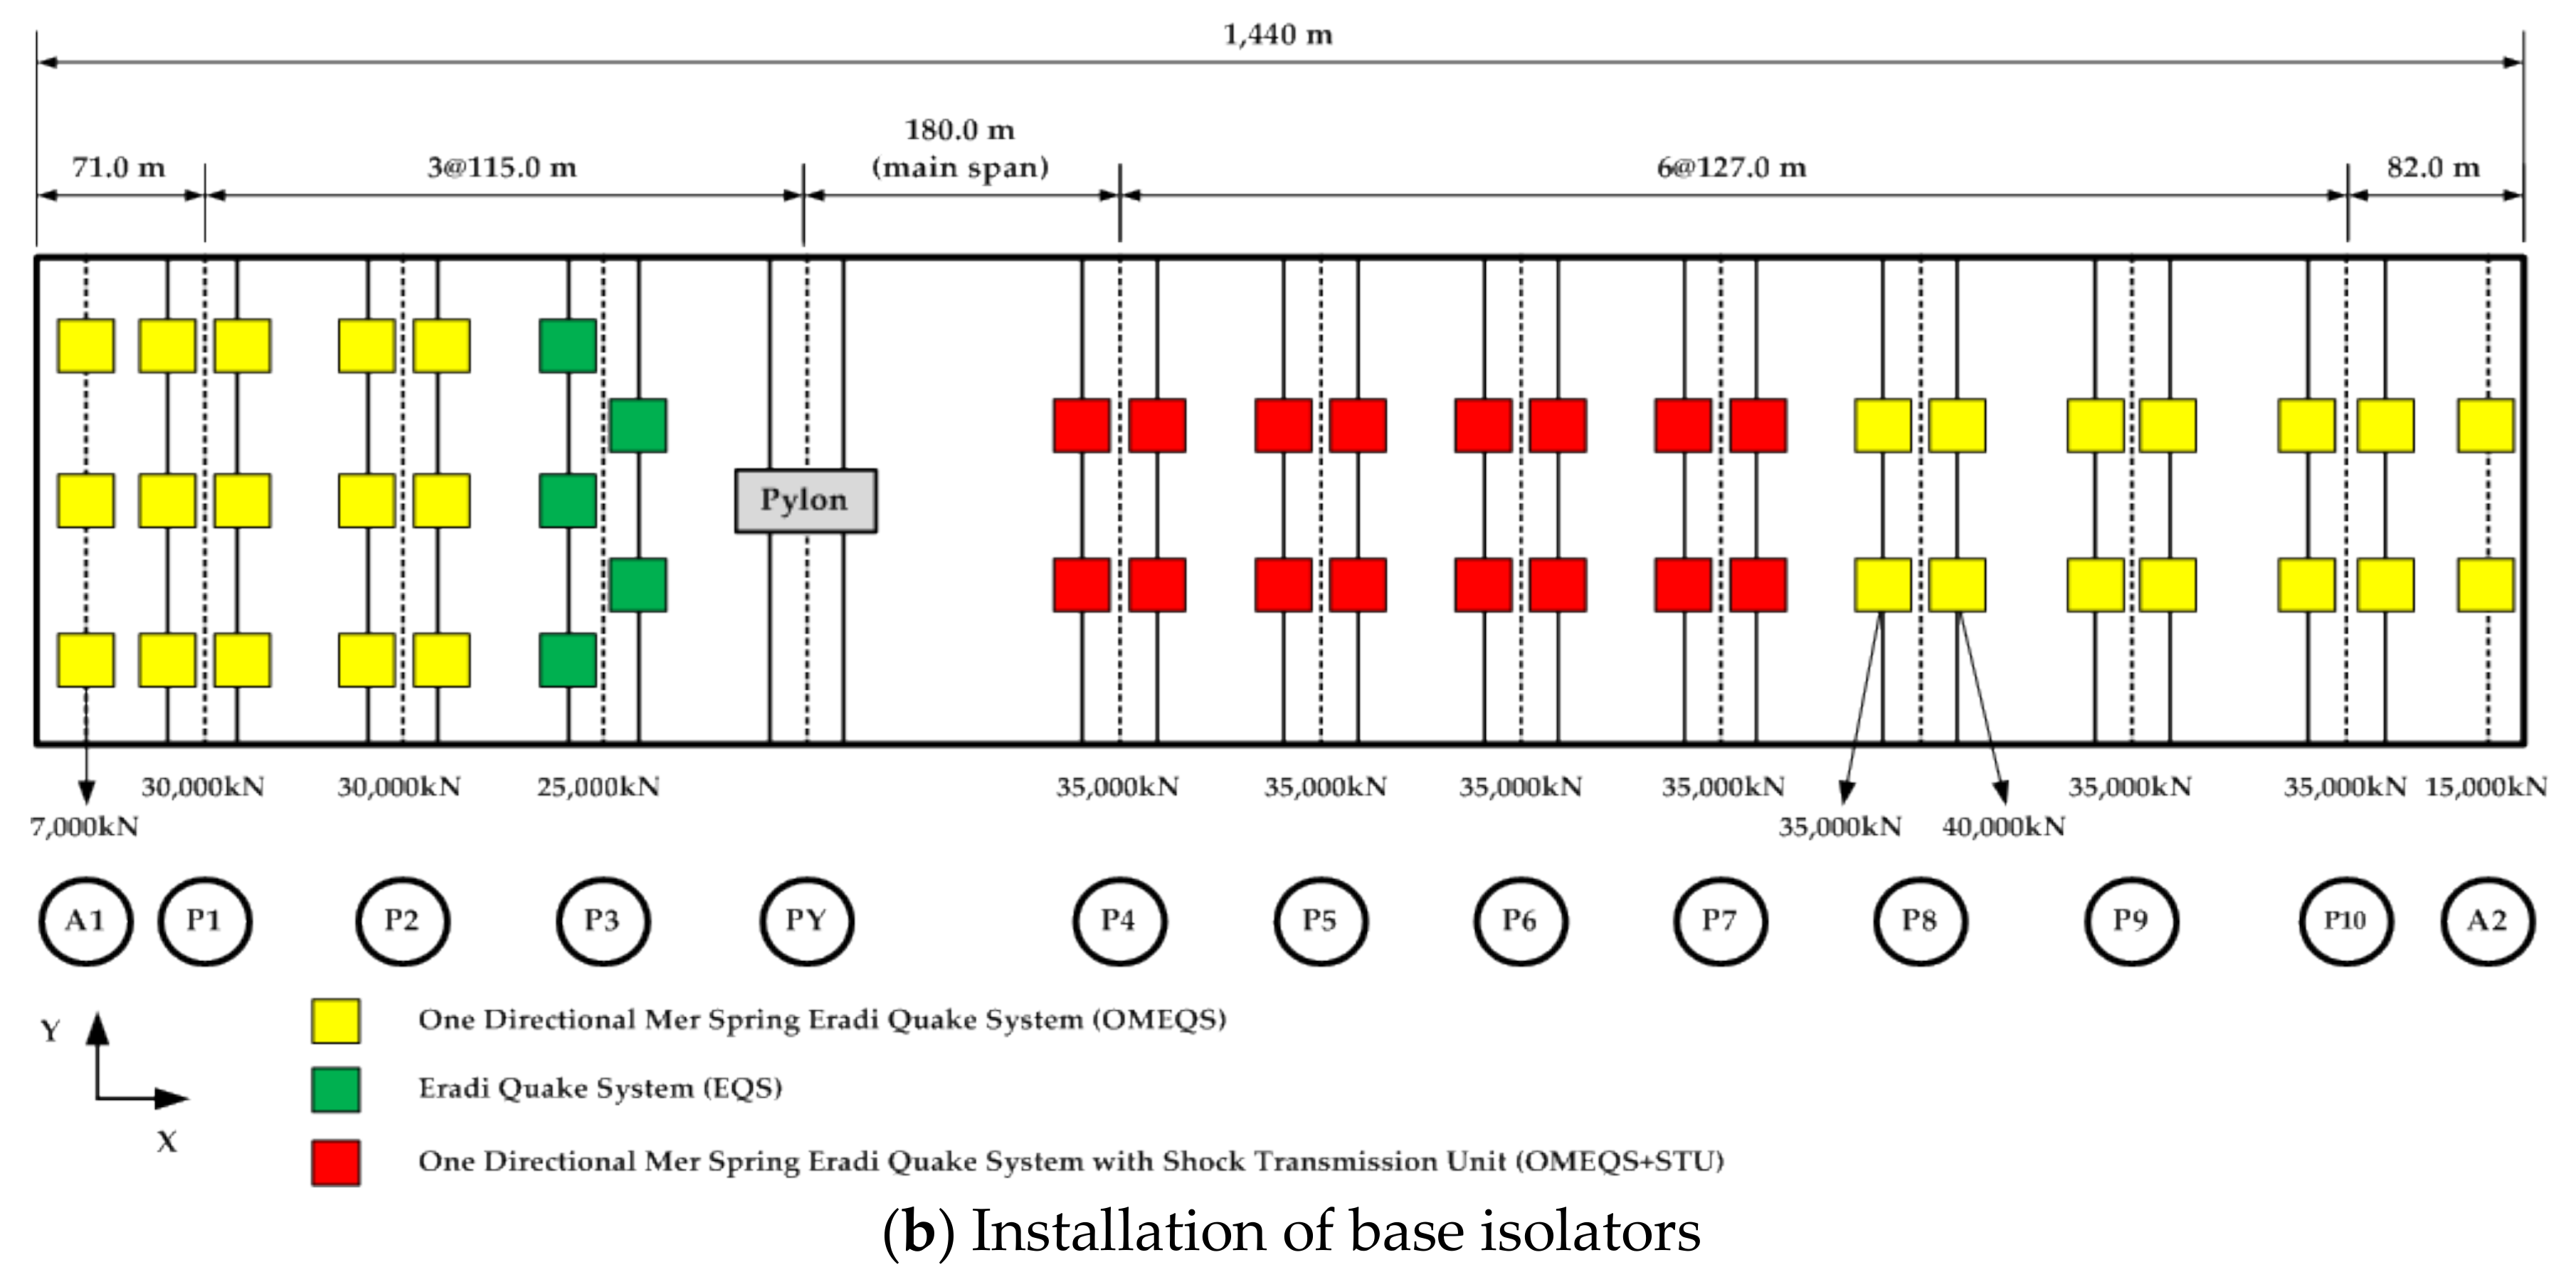
Table 1, the bridge is a twelve-span free cantilever method (FCM) bridge with a total span length of 1440 m.
Figure 2b indicates the location of the 50 base isolator elements (OMEQS, ESCO RTS Co., Ltd., Seoul, Korea) that were installed in the abutments and 10 piers of the subject bridge. Their design parameters are listed in
Table 2.
3.2. Dynamic Load Tests
Acceleration data of bridges under free vibration induced by vehicle impact loading and driving trucks and ambient vibration excited by traffic and wind loads is generally collected to identify dynamic characteristics of the subject bridge in various studies. Natural frequency, modal shapes, and damping ratio of a bridge can be analyzed by using the determined dynamic characteristics [
14].
In this study, free vibration tests with driving trucks and vehicle impact loading were initially conducted in January 2018, which was before the operation of the testing bridge. Additionally, ambient vibration data under traffic and wind load and cable impact vibration data were gathered in April 2019, which was one year after the operation. For collecting acceleration data, the free vibration tests under driving trucks and vehicle impact forces were brought from the evaluation methods conducted to the 3rd Bosphorus bridge in Istanbul, Turkey [
15]. As followed by the reference methods, the testing trucks transited driving force along the longitudinal direction (X-axis) and impact loading which was generated by the inclined wooden bumpers, along with both longitudinal and transverse directions (X-axis and Y-axis) to the bridge deck after the installation of sensors. Fast Fourier transform (FFT) was performed for an effective transformation of the acquired acceleration data.
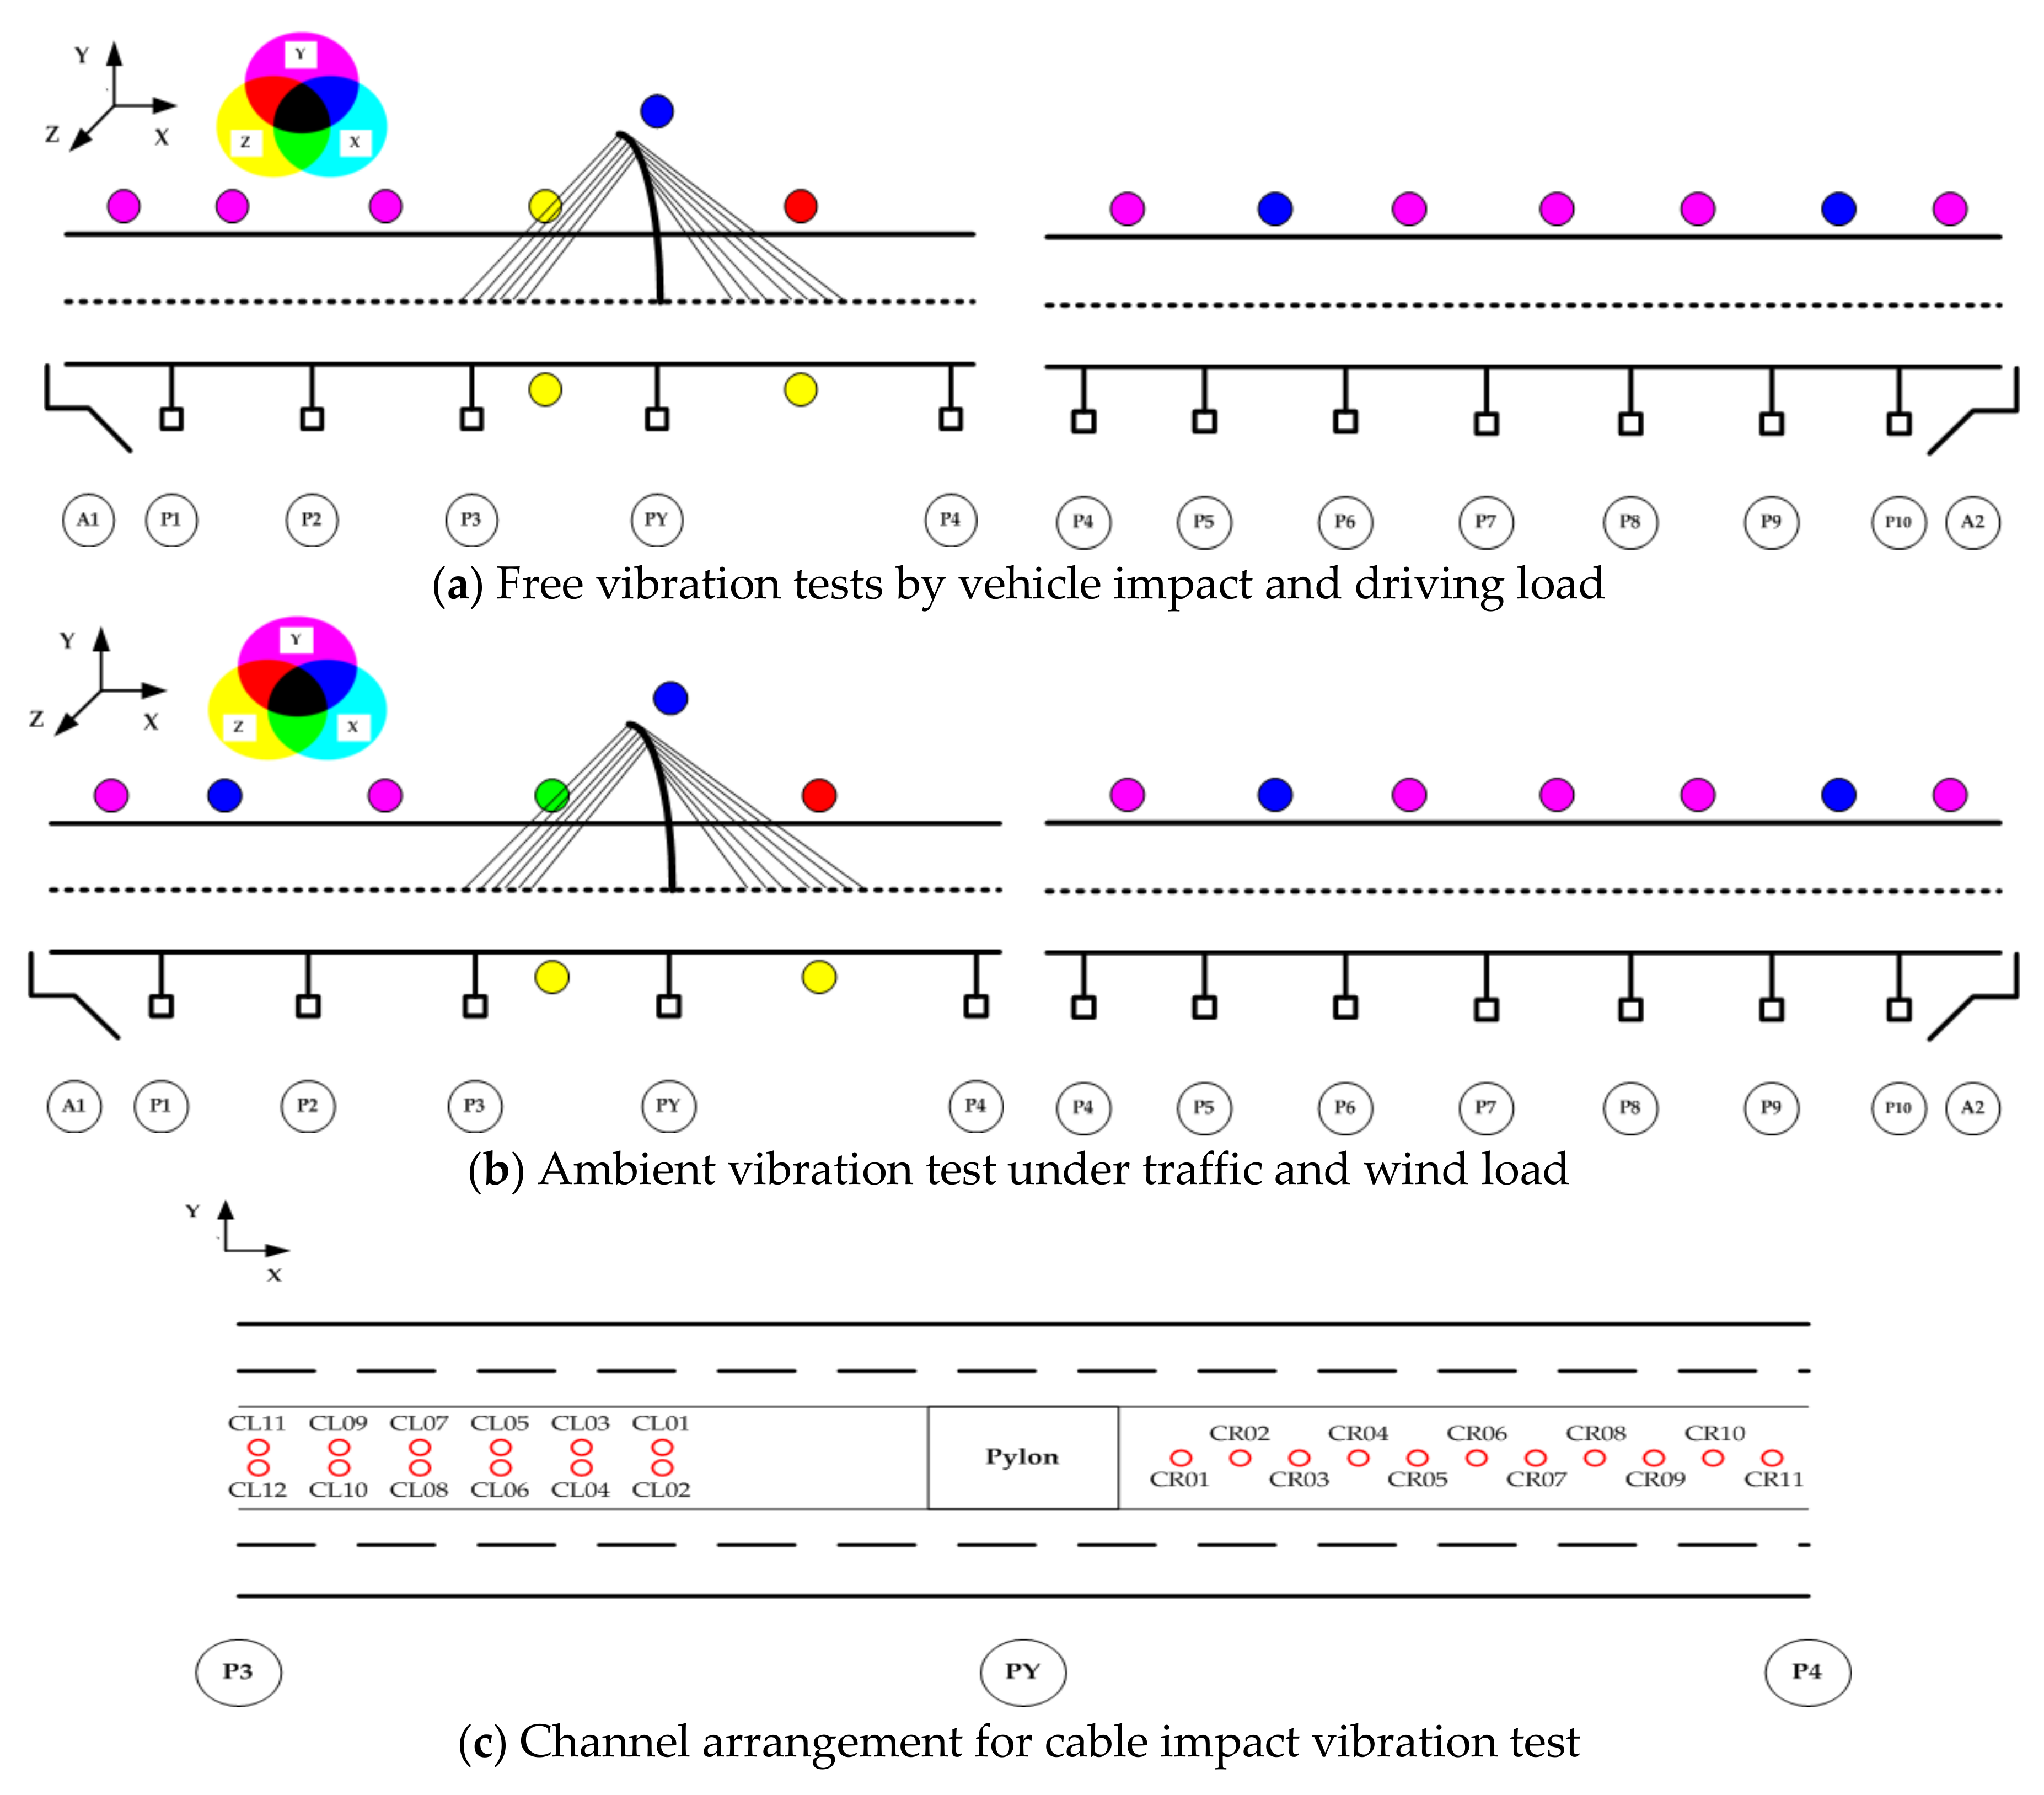
As illustrated in
Figure 3, accelerometer sensors (ES-U2, Kinemetrics, Inc., Pasadena, CA, USA) were set on two separate groups of box girders, which were divided by A1–P4 (first section) and P4–A2 (second section) for the free and ambient vibration tests. Cyan, magenta, and yellow circles represent the orientations of accelerometer sensors in X-axis, Y-axis, and Z-axis (in orthogonal) and red, blue, and green circles indicate where two sensors were installed in the corresponding axes. The time-frequency data were collected at a sampling rate of 100 Hz for one hour.
As indicated in the left and right-hand side of
Figure 3a, 10 channels in the first section and 9 channels in the second section were installed respectively for collecting free vibration data. Two 15-ton trucks and inclined wooden bumpers were prepared to generate truck driving load at travelling speeds of 30 and 50 km/h and truck impact load imposed by crossing over a bumper along with both X and Y directions.
Additionally, ambient and cable impact vibration tests under traffic and wind load were carried out to compare the difference of dynamic behavior of the subject collected both before and after the operation. For the ambient vibration test, 12 and 9 channels were placed at the same locations (
Figure 3b) of the first and second section, respectively. The cable accelerations excited by a hammer striking were acquired by cable accelerometers channels (
Figure 3c) to measure tensional forces of cables with a sampling rate of 100 Hz for 3 min. The tensional force of cables was estimated by the vibration method [
16,
17,
18]. The tension force (
) can be estimated by Equation (2) where
,
, and
are the unit weight, effective length and flexural rigidity of cables.
is the frequency of cable in corresponding
th mode. Equation (2) can be rearranged by
where
and
are the slope and intercept of regression analysis using a Least-square method.
3.3. Experimental Results
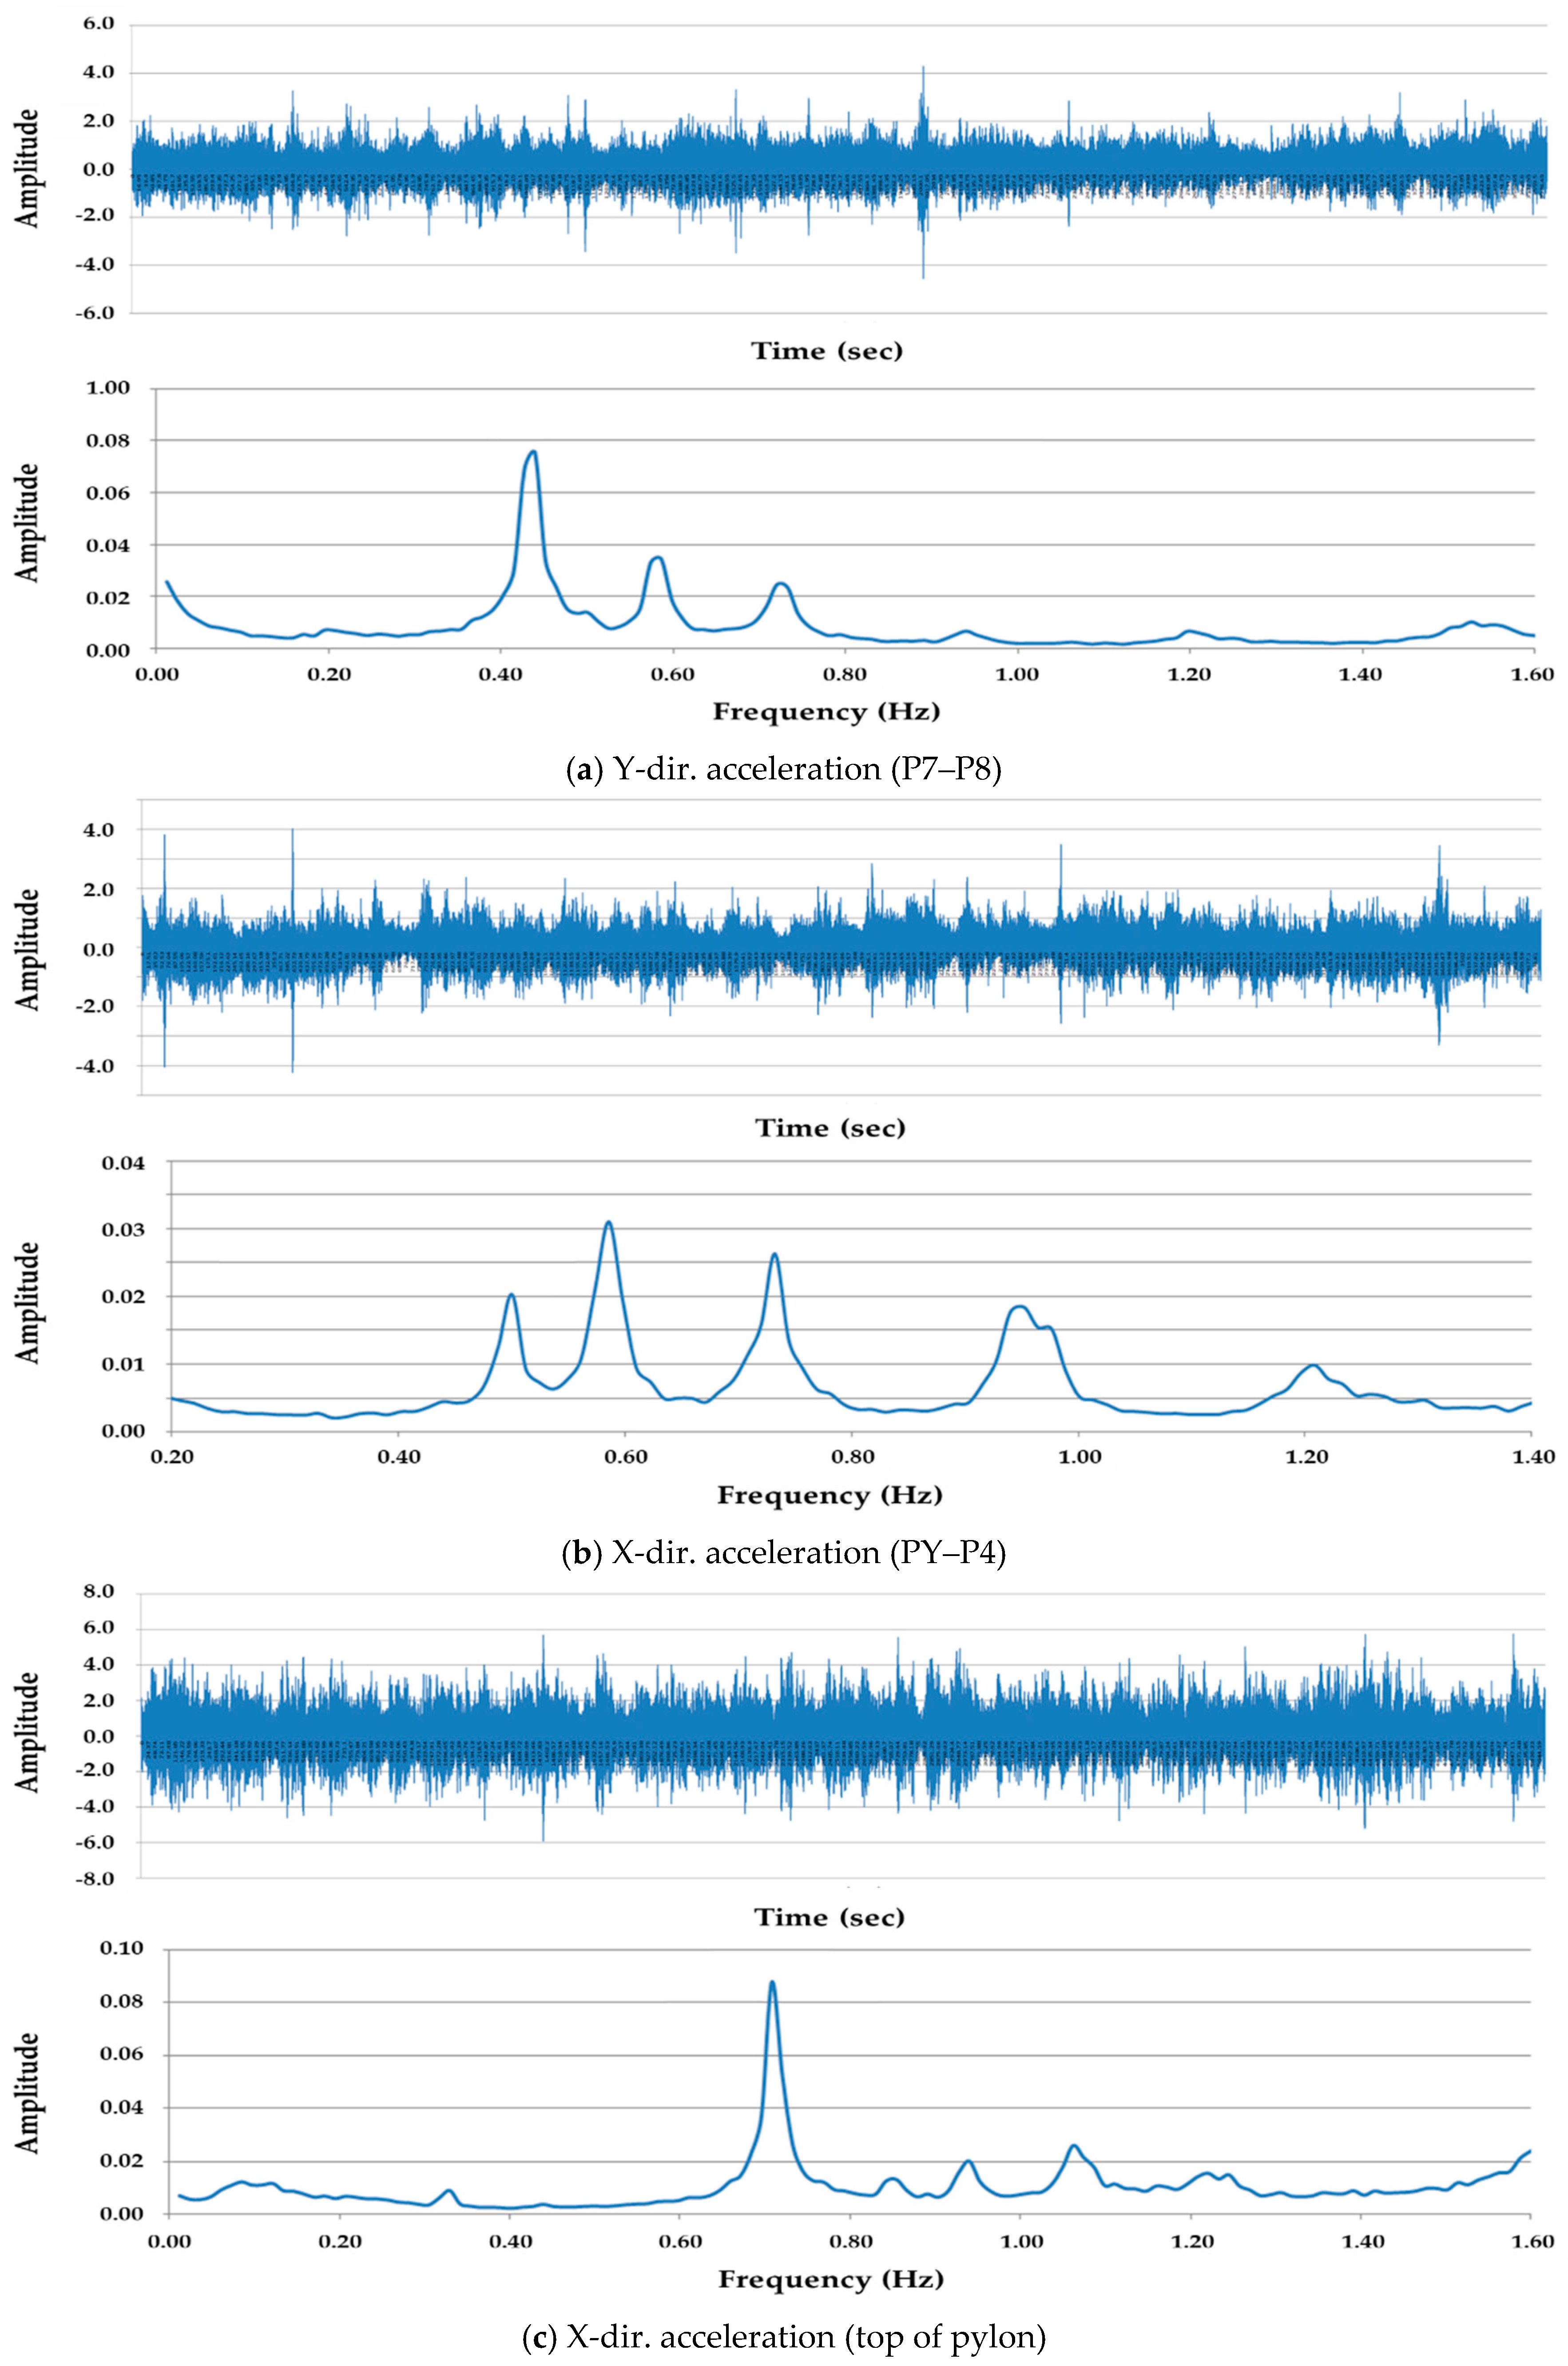
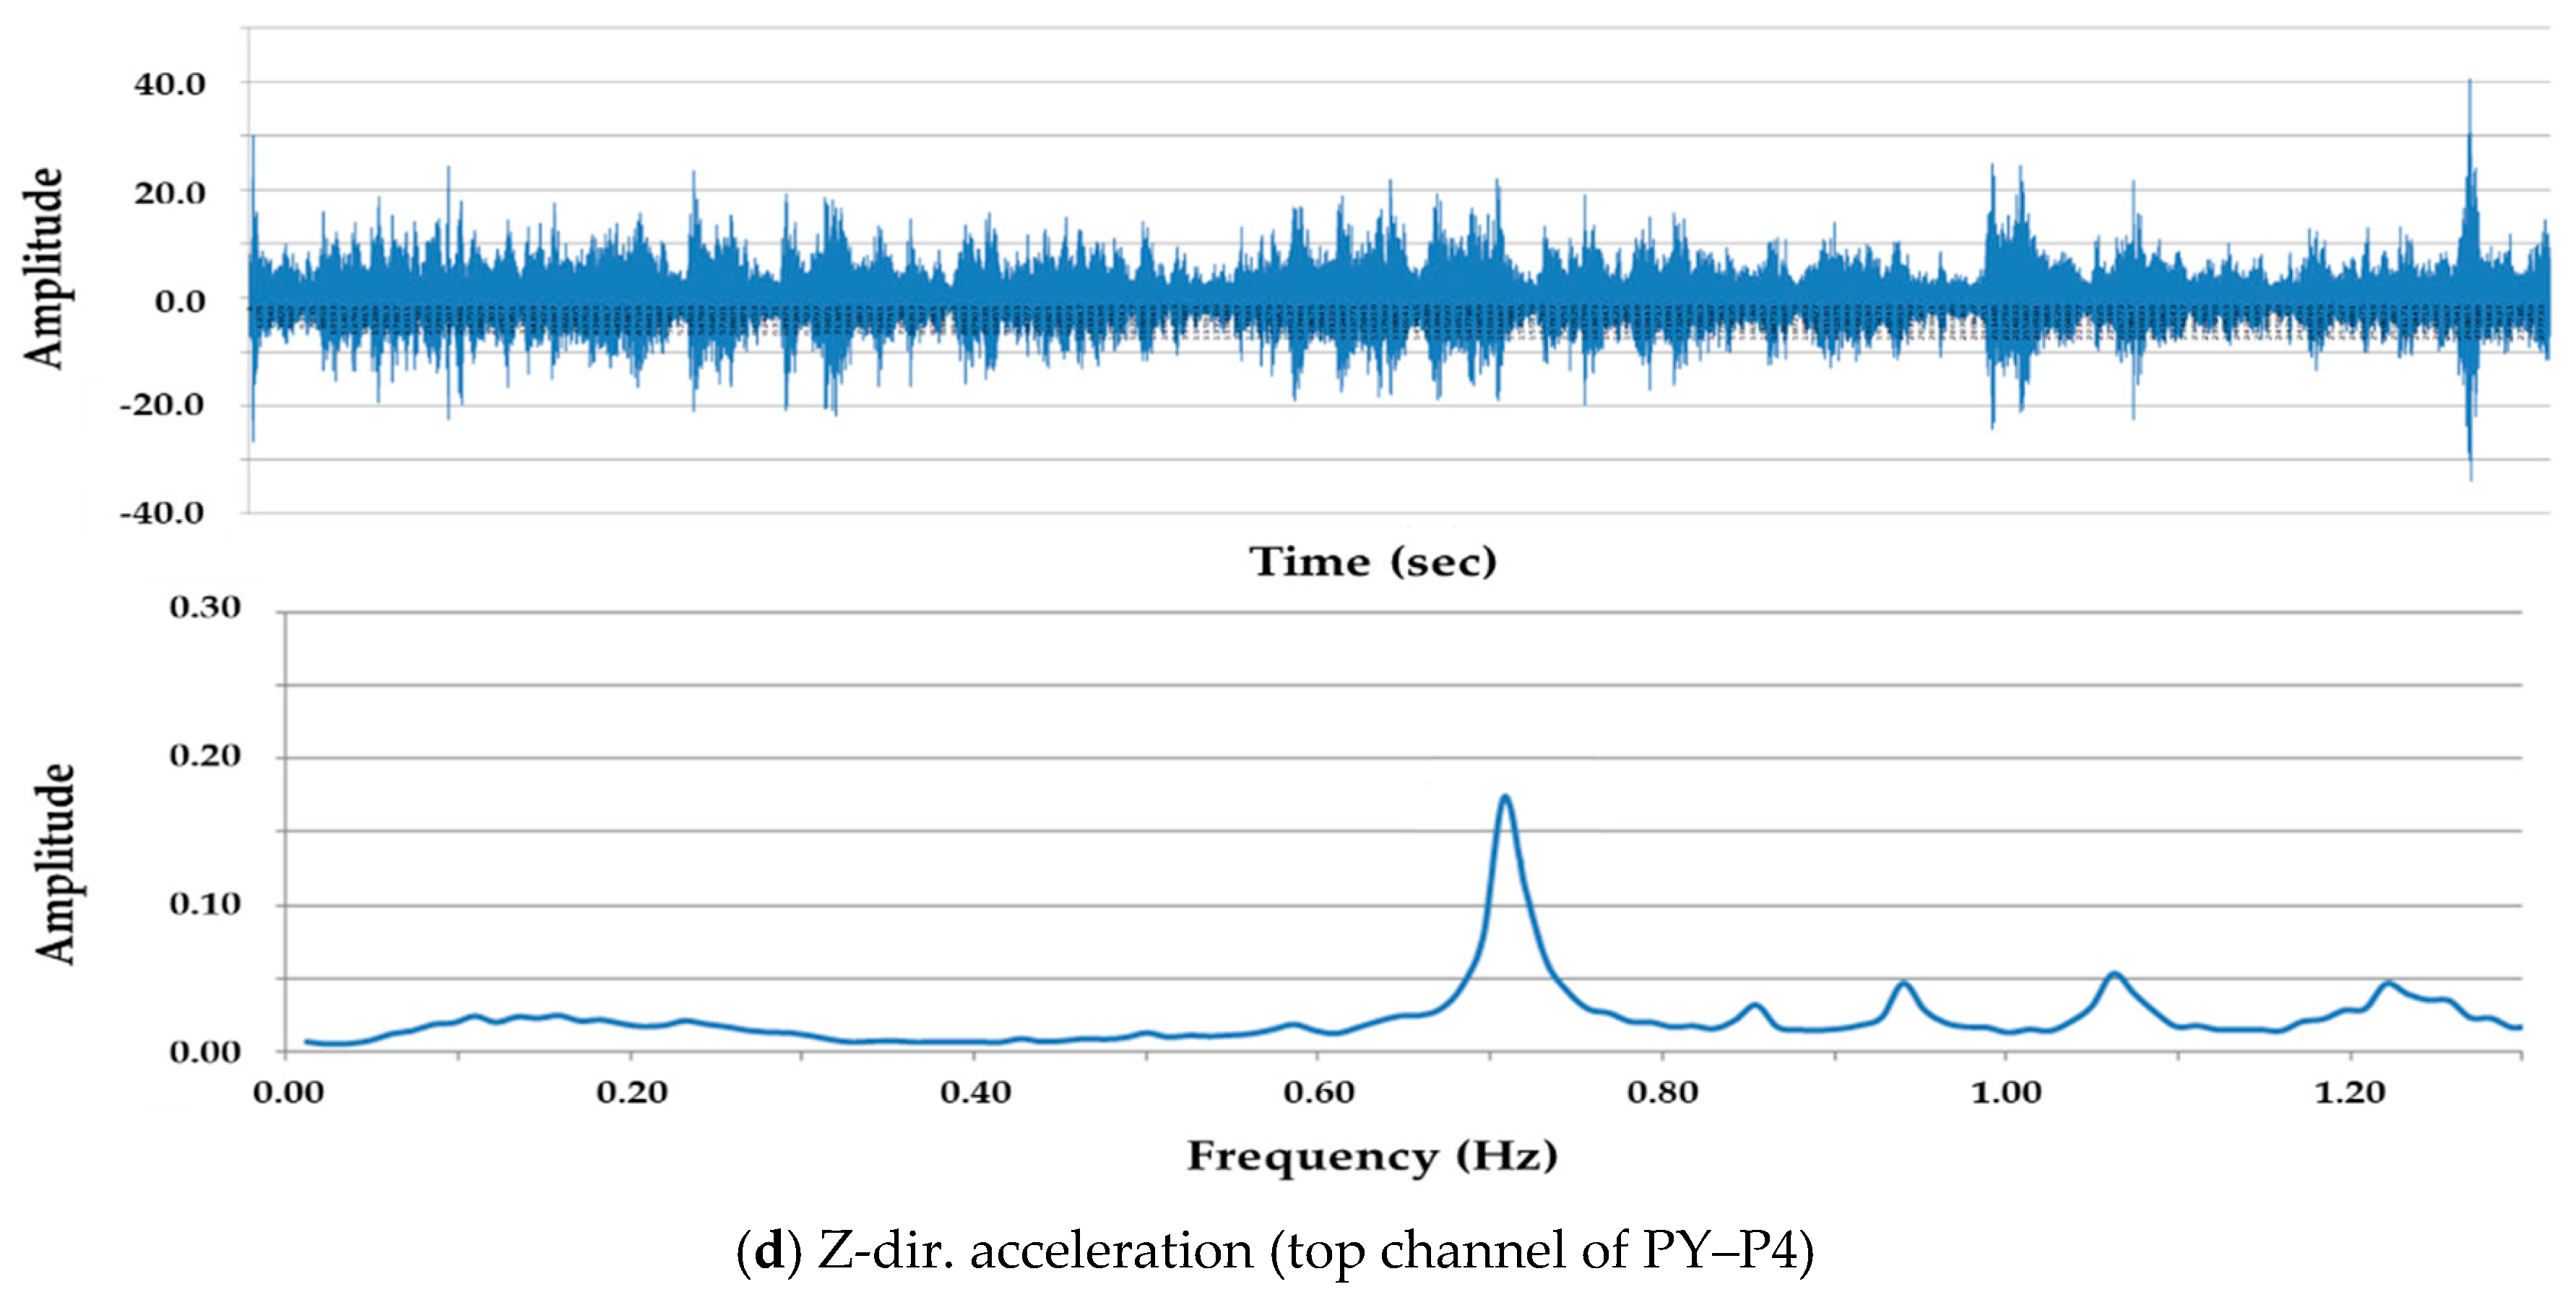
A series of vibration tests were conducted to investigate the dynamic behavior of the subject bridge before and after the operation. As shown in
Figure 4 and
Figure 5, top graphs and bottom graphs indicate a couple of acceleration data and their FFT transformations logged both free and ambient vibration tests respectively.
The fundamental natural periods of the testing bridge can be investigated throughout the FFT transformations. As shown in
Table 3, the natural periods showed a good agreement between two vibration tests. However, the natural periods in the X direction of the bridge could not be determined because of the noise of acceleration data that occurred in the ambient vibration test. This noise was found that the bridge response by ambient vibration induced by transport and wind loads, were relatively smaller than the others.
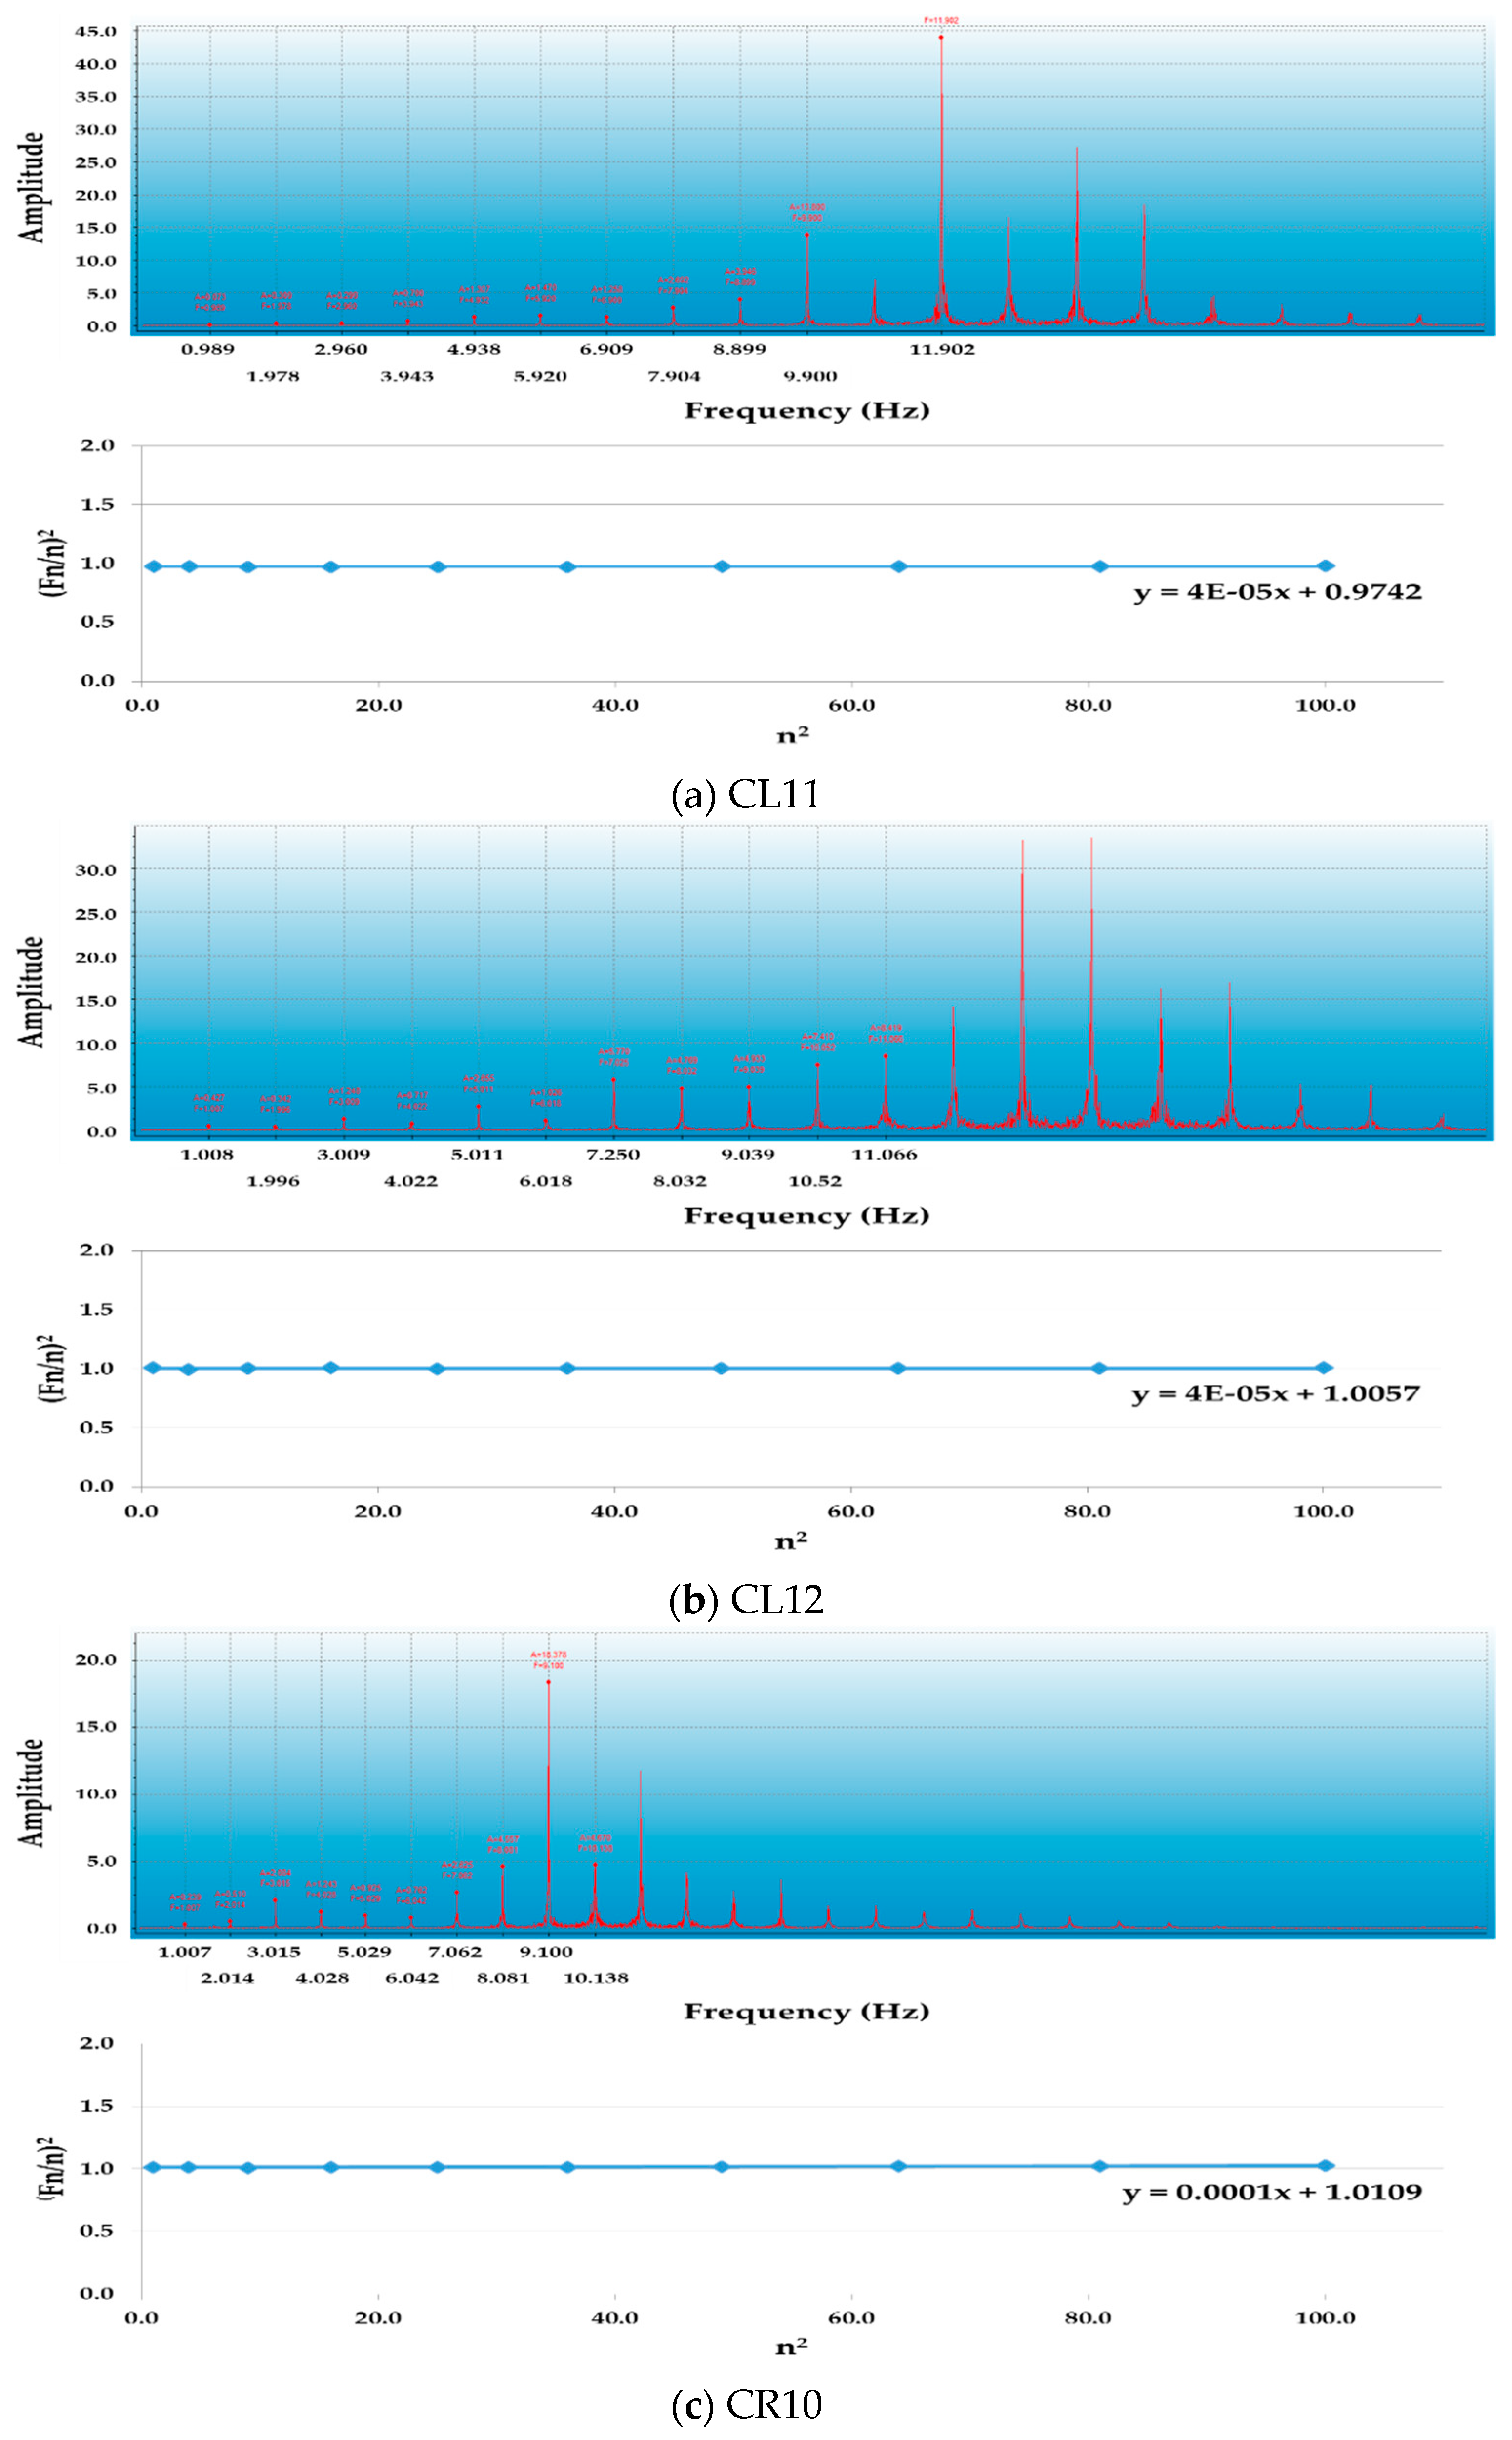
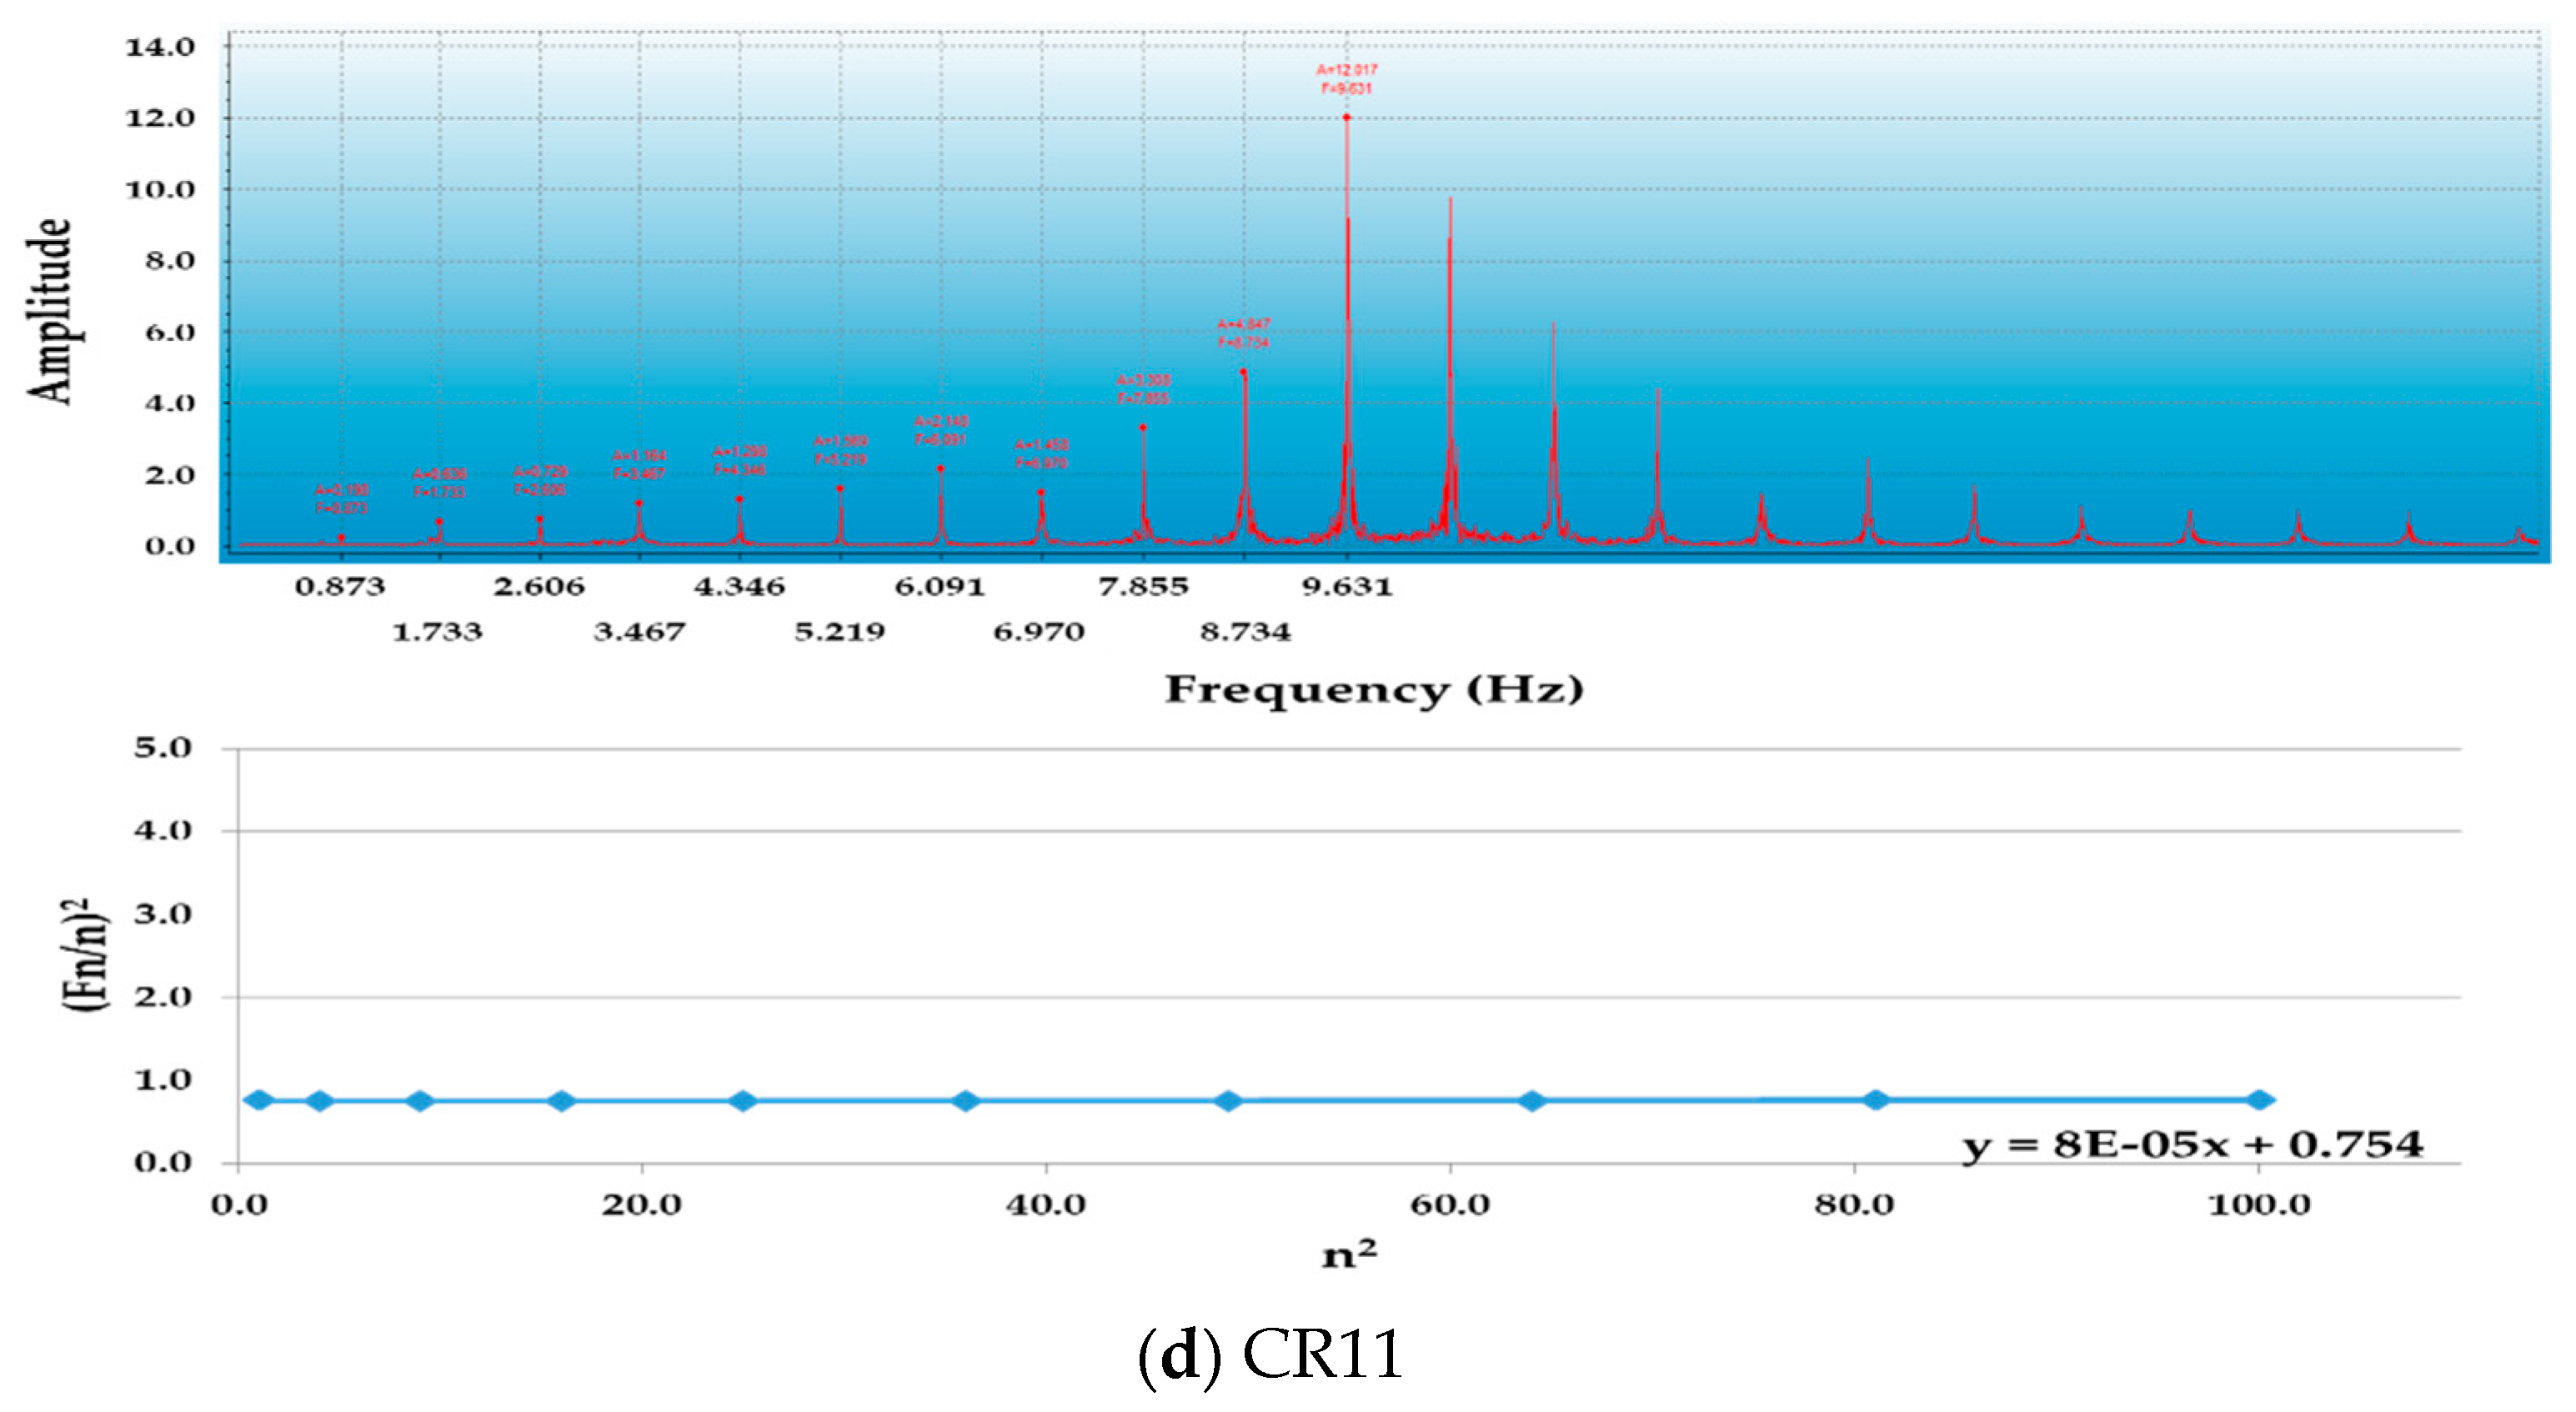
The cable impact vibration data were recorded for the evaluation of cable tension forces. As shown in
Figure 6, the FFT analysis (top) was performed by the cable vibration data and the cable tension forces were estimated by the regression analysis (bottom). From the estimation of cable tension, there were 0.04–9.4% increases in the estimated results compared with the introduced cable tension at the construction of the bridge decks. Those increases were generally generated by the service and pavement load.
3.4. Modal Shape Analyses
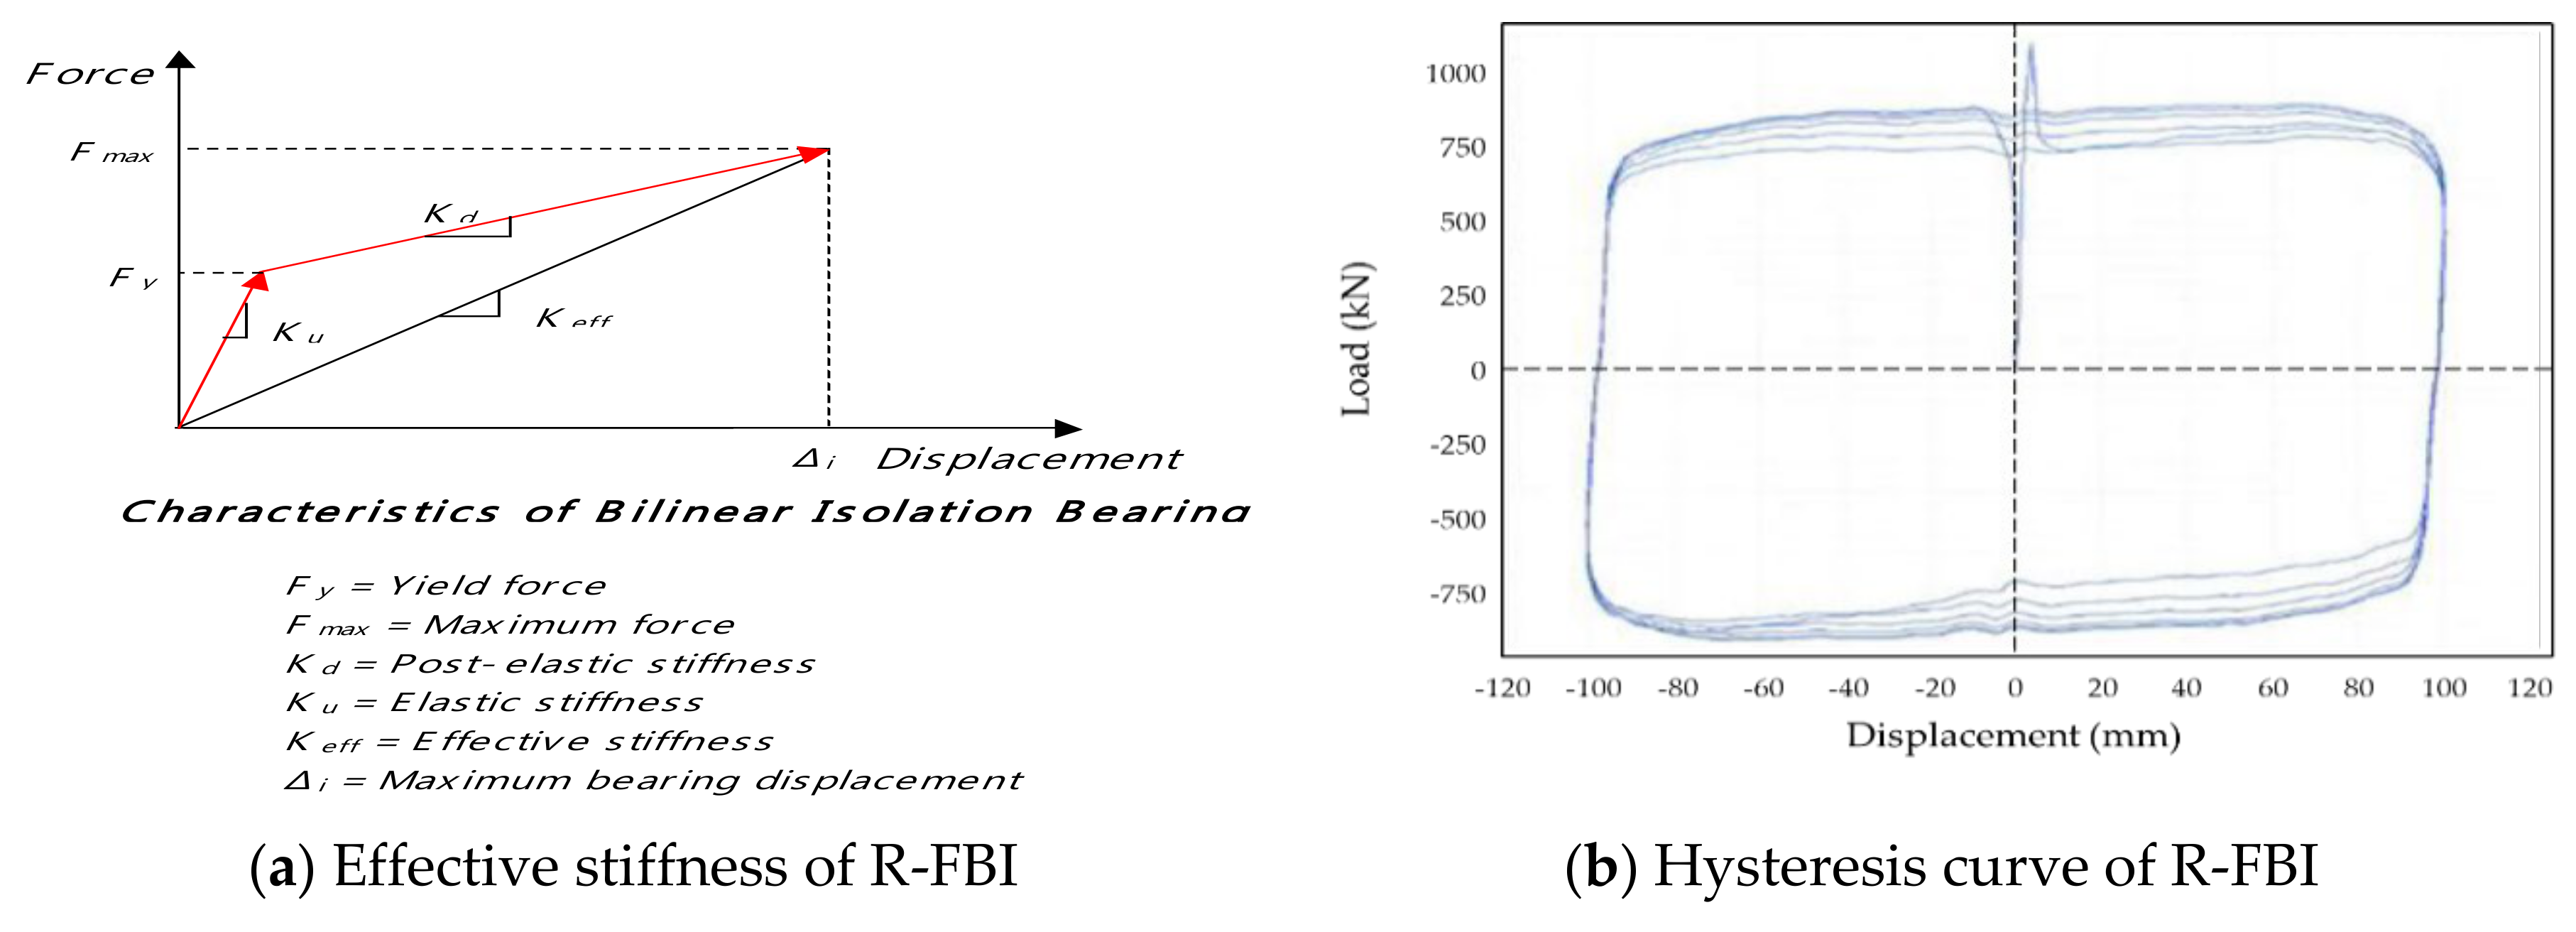
The mode shape analyses of the testing bridge using the K
eff (
Figure 7a) as a lateral stiffness base isolator system, were performed to compare the experimental result with modal shape analysis. The natural period of bridge and pylon were analyzed by using Midas Civil 2018, which is a commercial analysis software released by MIDAS Information Technology Co., Seongnam-si, Gyeonggi-do, Korea. In general, it can be found that the lateral stiffness of R-FBI is significantly smaller than it is when the PTFE friction plate slides [
19].
Figure 7b shows the result of a quality test of the R-FBI (capacity 25,000 kN) under cyclic load and the rest of R-FBI have a similar pattern of hysteresis curves.
Both
Table 4 and 5 and
Figure 8 and 9 show the computational analysis results depending on the stiffness factors of R-FBI. The frequencies, natural periods, and accumulative sum of mass participated in vibration mode of the testing bridge are listed in the tables in
Table 4 and
Table 5. As summarised in
Table 6, the natural periods of the testing bridge using the K
eff increase by a maximum of 70% compared to the experimental results. In the case of the fundamental and secondary mode shapes using the K
eff, the primary stiffness of R-FBI which is the PTFE friction plate before sliding is considerably huge enough acting like the infinite stiffness (K
∞, fixed end). As illustrated in
Figure 9, the mode shapes analyses using K
u and the K
∞ of the R-FBI were continuously conducted for improved mode shapes analysis. Comparing the mode shapes analysis with the field test results (
Table 6), the mode shapes analyses using K
u and K
∞ show 10–65% of similarity of the field test results.
4. Seismic Response Analysis
4.1. Modeling for Non-Linear Analysis
Seismic analyses of the testing bridge using both non-linear time history and multimodal response spectrum method analyses were performed using the Midas Civil 2018 to compare seismic responses applying those methods [
20]. The seismic response should be confirmed using the time history method analysis at a no-collapse performance level. The pylon and piers of bridge transmit the seismic excitation to other elements of the bridge and the connection joints between decks can experience plastic deformation. Thus, inelastic modeling of the plastic hinge areas should be demanded to implement the nonlinear behavior of the entire structure system. However, because the non-linear analysis method using materials’ nonlinearity in three-dimensions requires a large amount of computational work and time, modeling bridge elements as bundles of fibers should be recommended to deal with the drawbacks [
20].
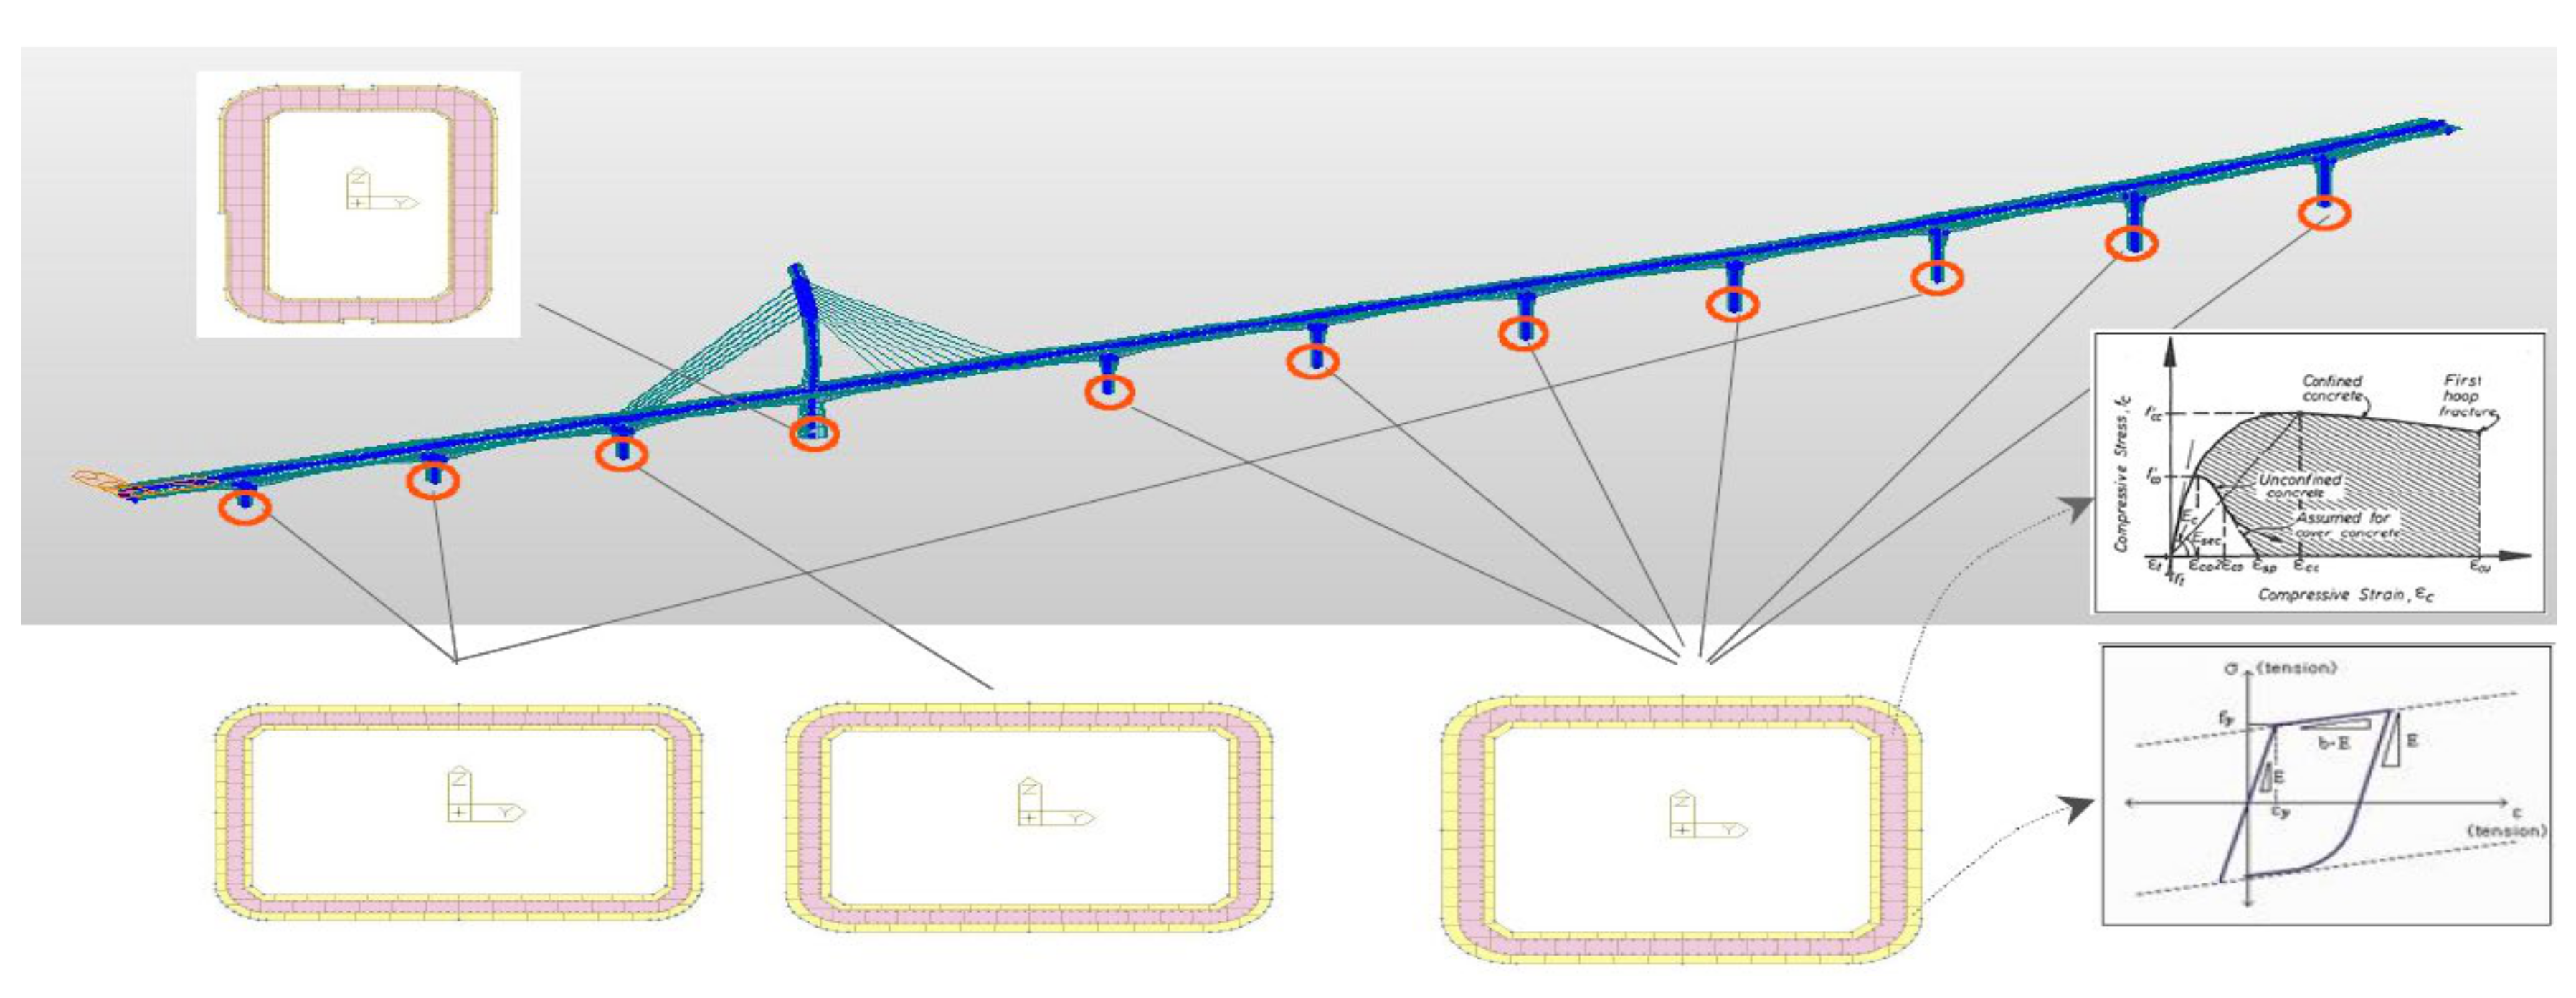
As indicated in
Figure 10 and
Table 7, the fiber model was applied to the pylon and piers of the testing bridge that expect a nonlinear response by assuming that the bridge elements consist of bundles of fibers and each fiber takes only axial stress. Hence, the entire bridge structure that had a material property of fiber introduced by the inelastic stress-strain curve, could be analyzed by the non-linear methods. To consider the inelasticity of material of pylon and piers, the inelastic models of concrete and steel were used by referring Mander et al. [
21] and Menegotto-Pintto [
22] respectively as listed in
Table 7.
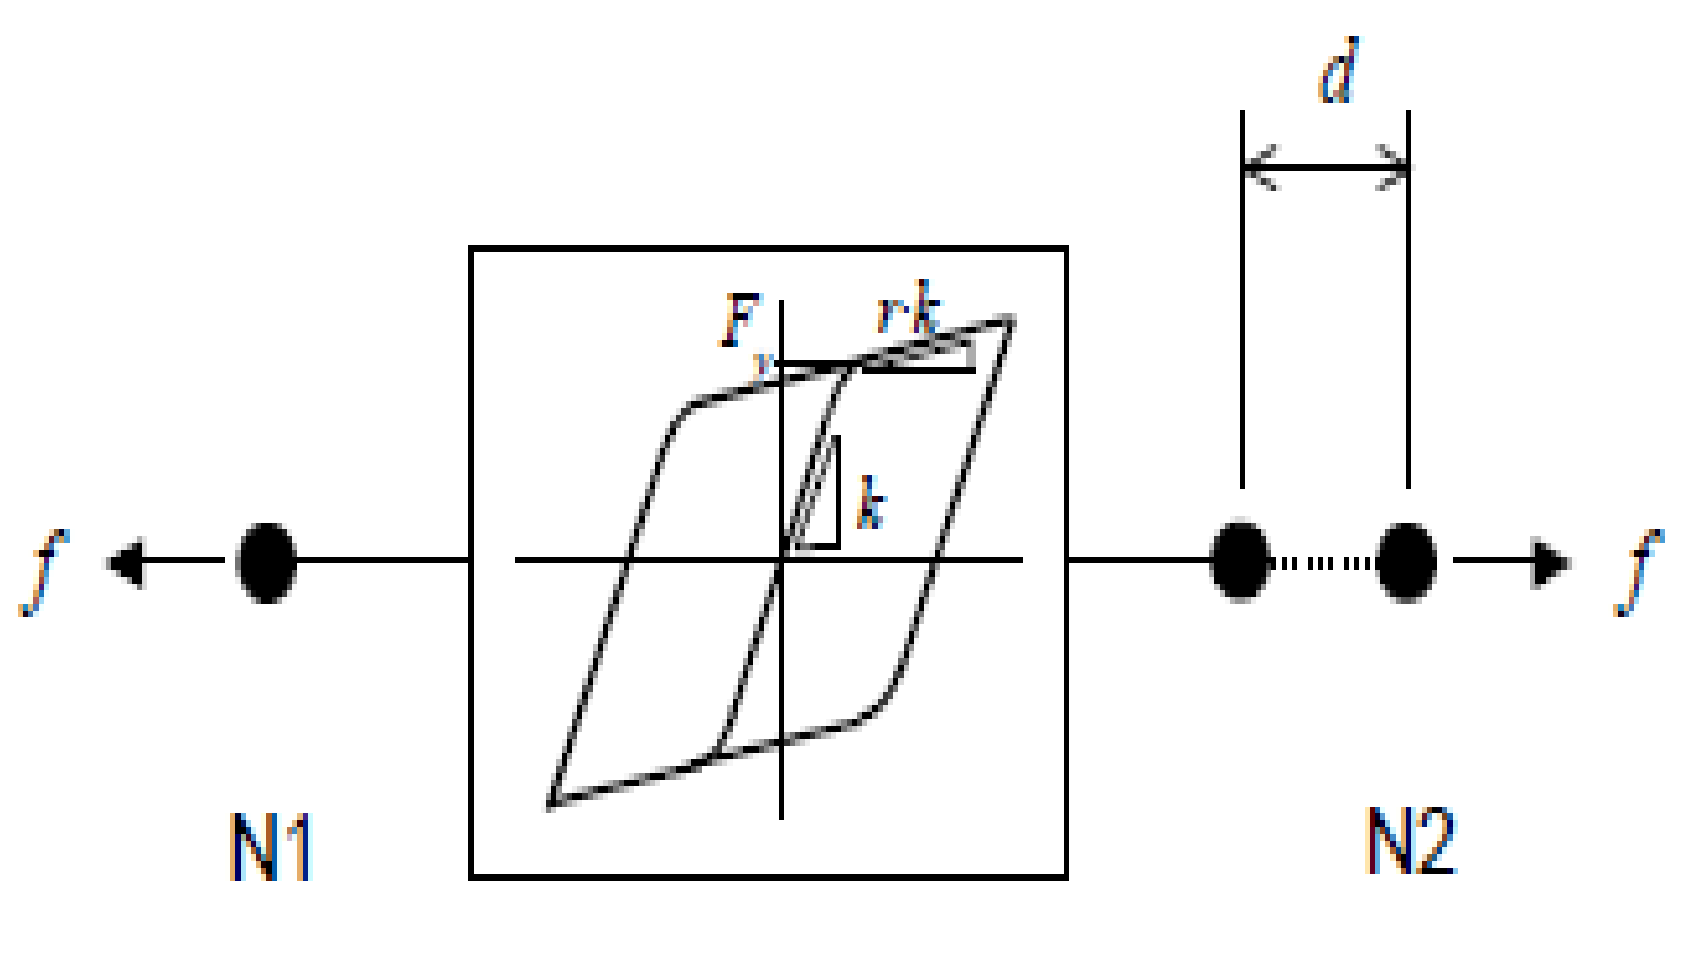
The R-FBI system in the testing bridge was modeled to introduce inelasticity of the base isolation system by considering the hysteretic system (
Figure 11). The hysteretic system applies to the modeling energy dissipation equipment and contributes a constant frictional force without changes in amplitude and frequency of seismic excitation [
20]. The force-deformation of the hysteretic system can be expressed by Equation (3) where
,
and
are reduction ratio of stiffness after yield strength, primary stiffness and deformation caused between two nodes (N1 and N2 in
Figure 11.) respectively.
and
are the yield strength and internal parameters for the hysteretic behavior respectively [
20,
23]. The mechanical properties of the R-FBI system in the testing bridge were used for modeling by referring to
Table 2.
In the Korean Highway Bridge Design Code (Limit State Design) for Cable Supported Bridges [
24] published by Ministry of Land, Infrastructure and Transport in Korea, the time history analysis method uses a simultaneous actuation of statistically estimated seismic excitation in three independent directions (X, Y and Z directions). As surface ground and ground change in a longitudinal direction or spatial change of input ground motion by supports are considered due to span length of bridges, the time history of the ground motion shall be prepared depending upon considerations such as magnitude and epicenter of earthquakes, ground conditions, a transfer mechanism of seismic wave, and phase difference [
24].
Furthermore, the minimum time history of the input ground motion sets for the analyses shall be three and the maximum seismic response result from each analysis corresponds to the maximum response. The recorded or artificially generated ground motion sets can be applied for the analyses and three sets of orthogonal ground motion should be independent. The requirements of the created ground motion are as follows: Firstly, the response spectrum average value for the time history of ground motion shall be greater than the 5% damping ratio of the designed response spectrum at zero seconds. Secondly, the mean value of the response spectrum for the time history of the ground motion shall be greater than the 5% damping ratio of the designed response spectrum between the period from 0.2 to 2.0 times of the natural frequency of the structure. Finally, the difference between the response spectrum mean value and the 5% damping ratio of the designed response spectrum for the ground motion time history shall not be less than 10% within the entire frequency [
24].
Three sets of artificially composited seismic waves were created in X, Y, and Z directions by applying the ratio of 0.77 which was vertical ground acceleration against horizontal ground accelerating direction as shown in
Figure 12a by using SIMQKE (NISEE/PEER library, University of California, Berkeley, Richmond, CA, USA). The PGAs were 0.08 g, 0.22 g, and 0.154 g that the recurrence periods were 200 years, 2400 years, and 1000 years, respectively, and the magnitude of waves was 6.5–7.0.
Figure 12b shows a spectral acceleration-period relationship of the generated seismic waves and the target seismic design spectrum of the subject bridge.
Generally, the member forces of cable-stayed bridges are significantly influenced by the cables’ tensional forces. The initial equilibrium force of the seismic analysis should be set by the cable tensions as similar to the actual ones as possible for accurate simulations [
25]. Because the non-linear time history analysis method does not implement superposition for estimating cross-sectional force according to load combinations, the analysis was performed with the initial equilibrium of 700 beam elements (girders, piers, and a pylon) and 23 truss elements of cables as the member strengths. As summarised in
Table 8, the initial equilibrium forces and experimentally measured tension forces of cables were obtained from computational analyses and field tests, respectively. Comparing the corresponding cables’ tension, the average difference between them was 3.15%. Throughout the gap of tension, the modeling of nonlinear seismic analyses was found that the changes of structure members’ forces of the subject at the construction stage were properly applied to the modeling.
4.2. Response Analysis Regarding Seismic Analysis Methods
The seismic response analyses depending upon nonlinear time history (TH) and multimodal response spectrum (RS) method analyses were performed and compared in order to validate compatibility of application of the RS analysis method at the seismic design of cable-stayed bridges in both serviceability performance level (PGA 0.08 g) and long-term recovery performance level (PGA 0.154 g).
Figure 13 and
Figure 14 and
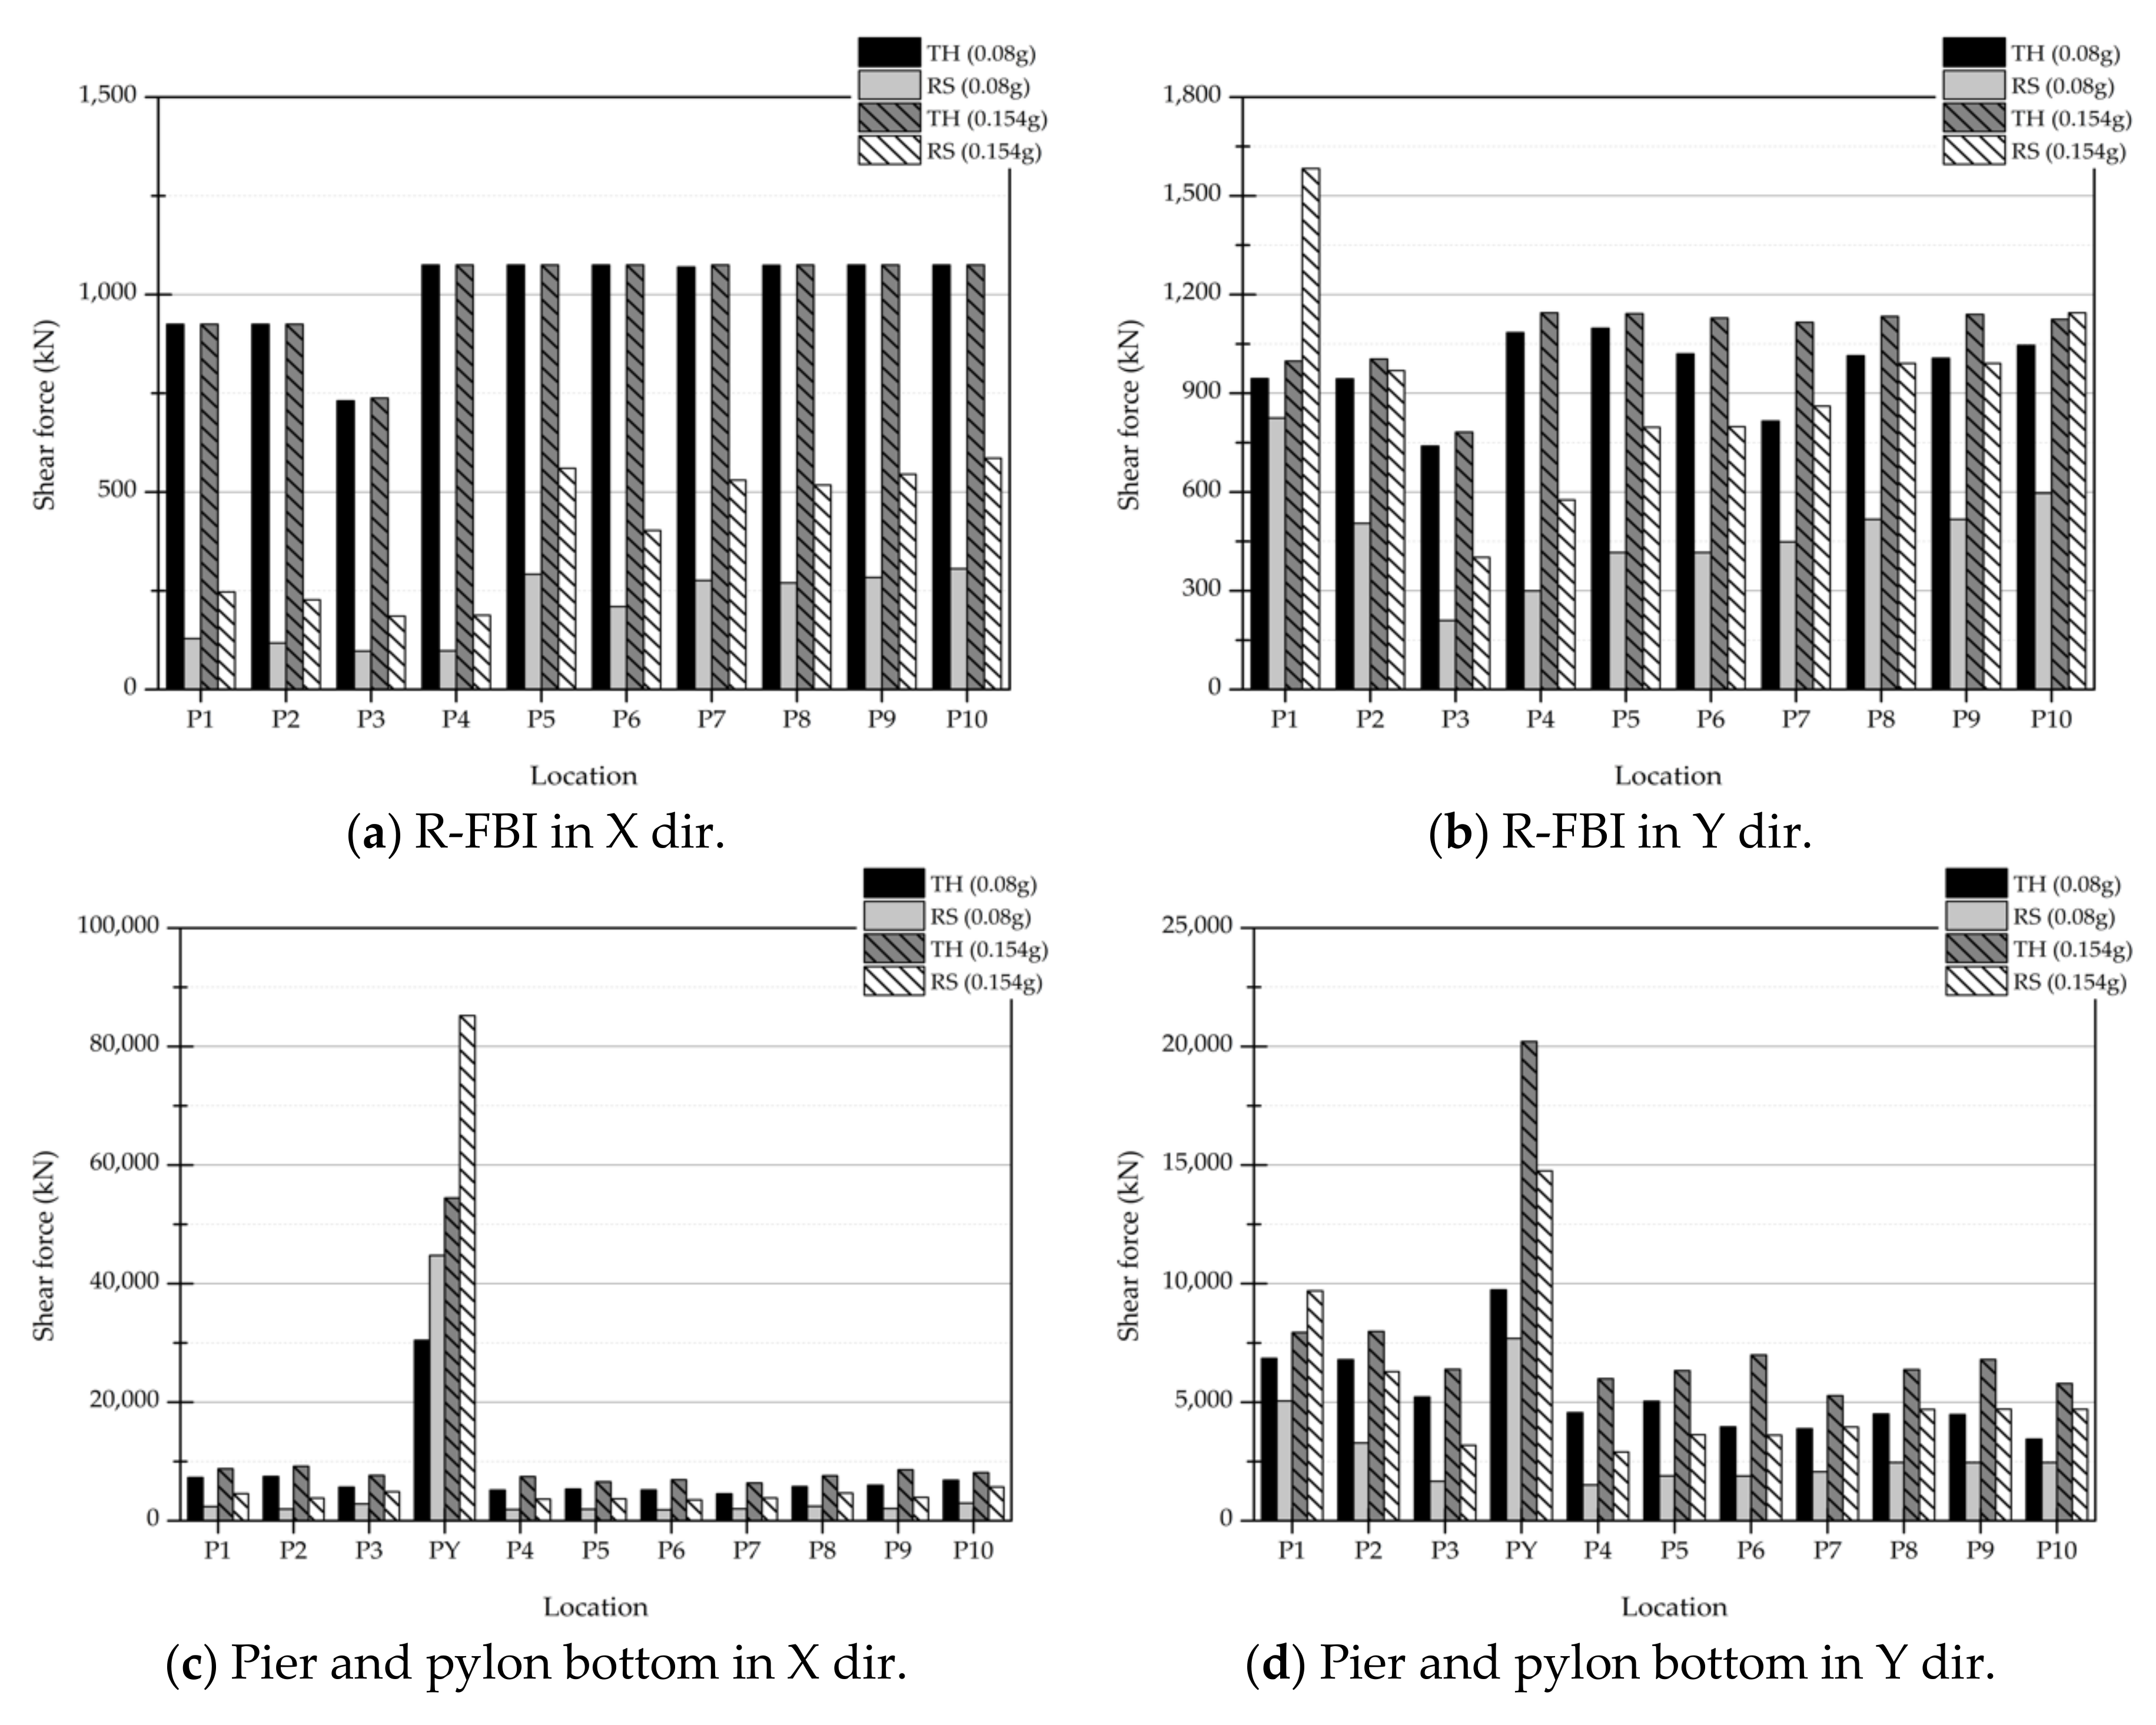
Table 9 indicate the results of maximum shear force and maximum displacement of the R-FBI system in the testing bridge depending on the bridge performance levels respectively. As shown in both
Figure 13a and
Figure 14a, there is no significant change in the shear forces of the R-FBI system in X direction using the TH analysis method but its displacements increase as the magnitude of PGA increases. As summarised in
Table 9, the maximum increase of shear force from PGA 0.154 g to 0.22 g is 2% at P3 (fixed end) in the X-direction. In a case of Y direction, 36.8% and 7.8% of increases from PGA 0.08 g to 0.154 g and from PGA 0.154 g to 0.22 g occur at P7 and P6, respectively.
As indicated in
Figure 14, there are considerable differences in seismic responses regarding analysis methods. The shear force of the R-FBI of TH was respectively increased by 10.97 times at PGA 0.08 g and 5.72 times at PGA 0.154 g compared to its of RS. In the case of the pier and pylon bottom, 3.95 times and 3.47 times of increases are obtained at PGA 0.08 g and 0.154 g respectively. Additionally, the shear force of bridge elements is under-estimated throughout the RS results.
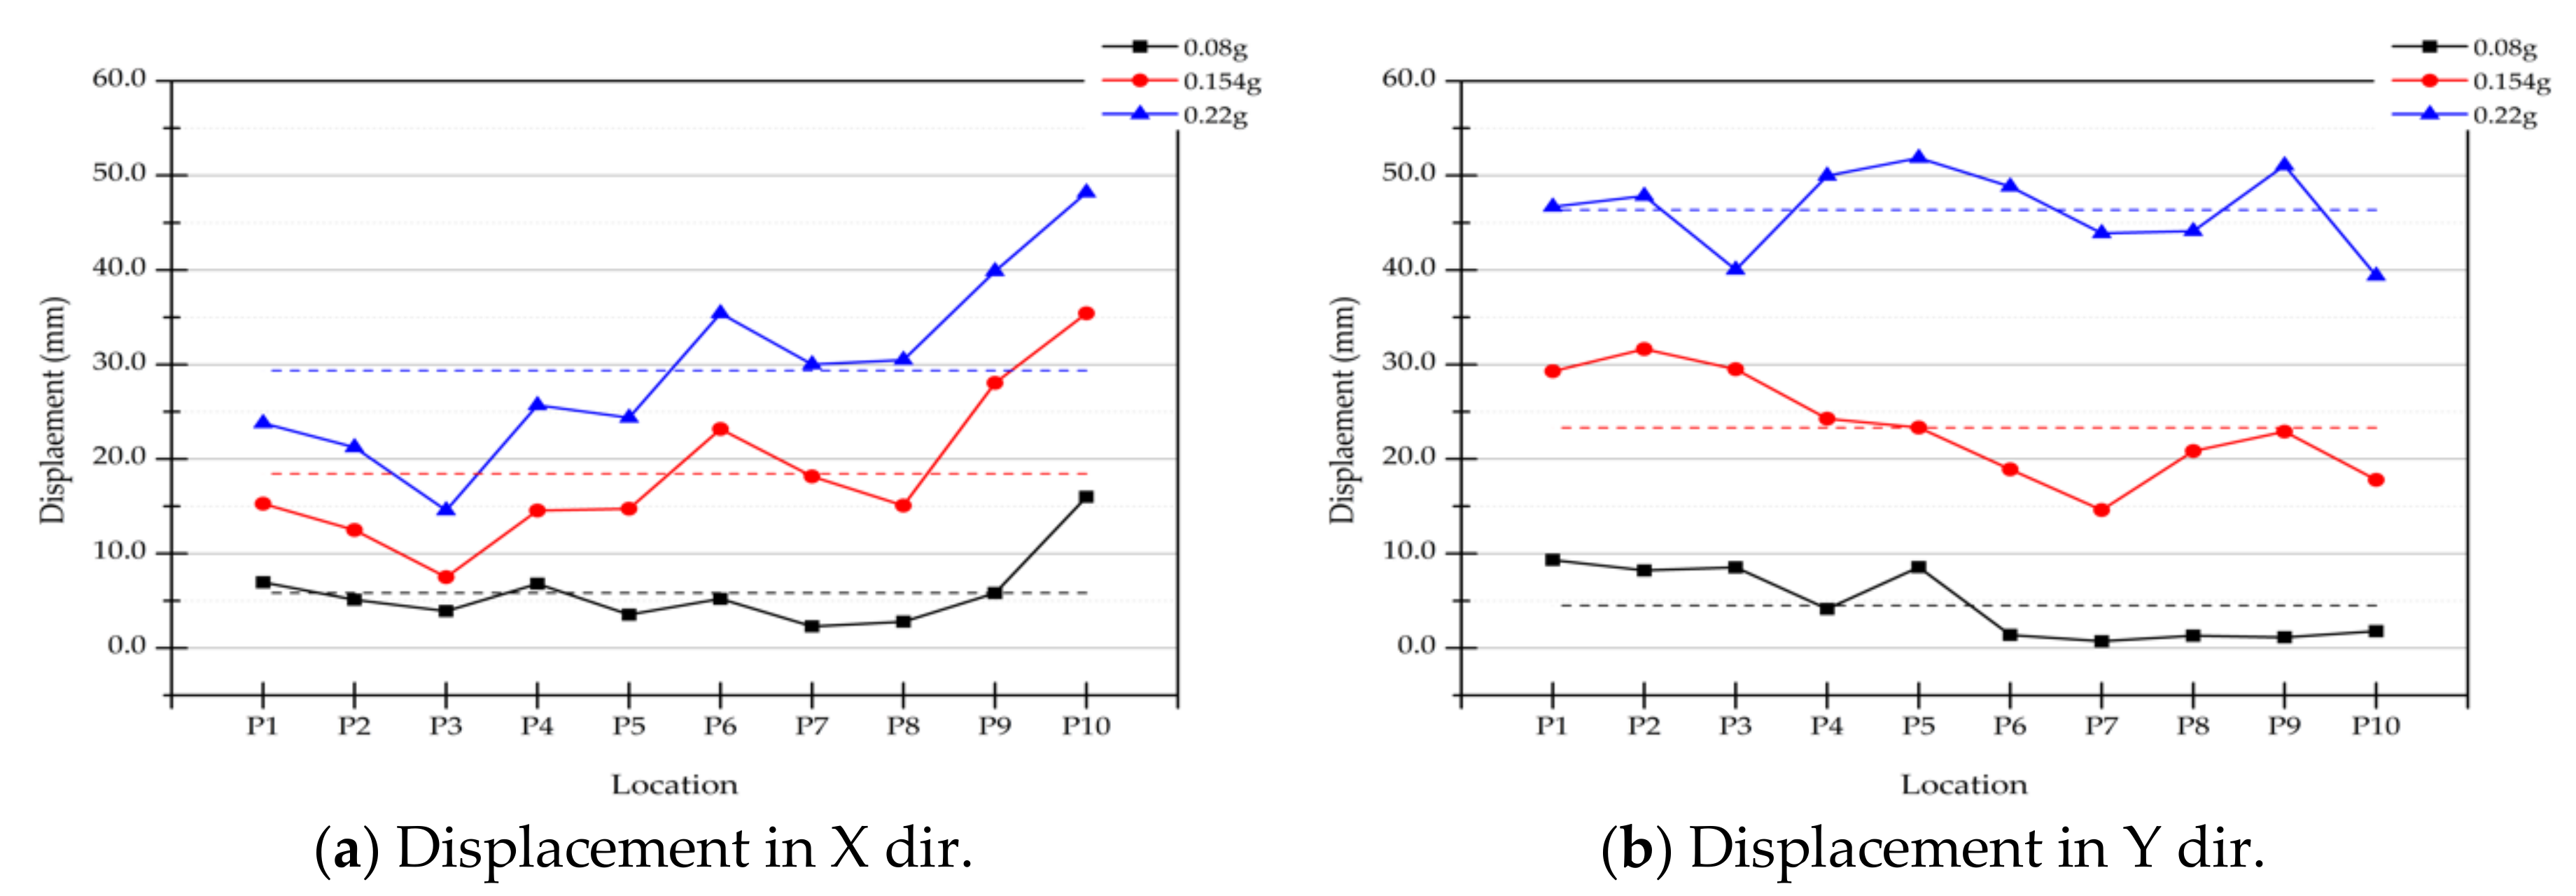
As illustrated in
Figure 14, the average displacements of R-FBI in both X and Y directions regarding intensities of PGA are 5.84 mm, 48.44 mm and 29.37 mm and 4.51 mm, 23.31 mm and 46.36 mm, respectively. The average displacement of R-FBI shows an ascending trend as the intensities of the PGA increase.
Those investigations are resultant that the lateral stiffness of R-FBI, Ku, which is relatively more intense than the effective stiffness, is primarily dominant to resist a lateral seismic force rather than sliding the PTFE friction plate as the seismic excitation is not enough to slide the R-FBI. Furthermore, the sliding of R-FBI occurs with the effective stiffness, Keff, as the yield strength of R-FBI or beyond the limit induced and the energy dissipation of seismic excitation takes place by increasing displacement of R-FBI. From both shear force and displacement results, it can be found that if the seismic design of a cable-supported bridge was performed by the RS method, it would not lead to the successful evaluation of seismic design depending upon performance levels, the safety of the bridge and the reasonable design of bridge in terms of construction cost.
For the performance-based seismic design, it should be desirable to consider the seismic response analysis according to the performance levels separately or to check and review the occurrence of friction of the R-FBI by the performance levels through the nonlinear friction analysis with TH method. Thus, it would be necessary to apply different seismic analysis methods depending on the bridge performance levels for the plausible and efficient seismic design by dealing with the behavior characteristics of the base isolation systems, which operates as a fixed end before the yield friction slip and performs nonlinear hysteresis behavior after yield point.
5. Proposed Seismic Design Procedure for Cable-Supported Bridges
5.1. Implementation of Behavior Characteristics of R-FBI
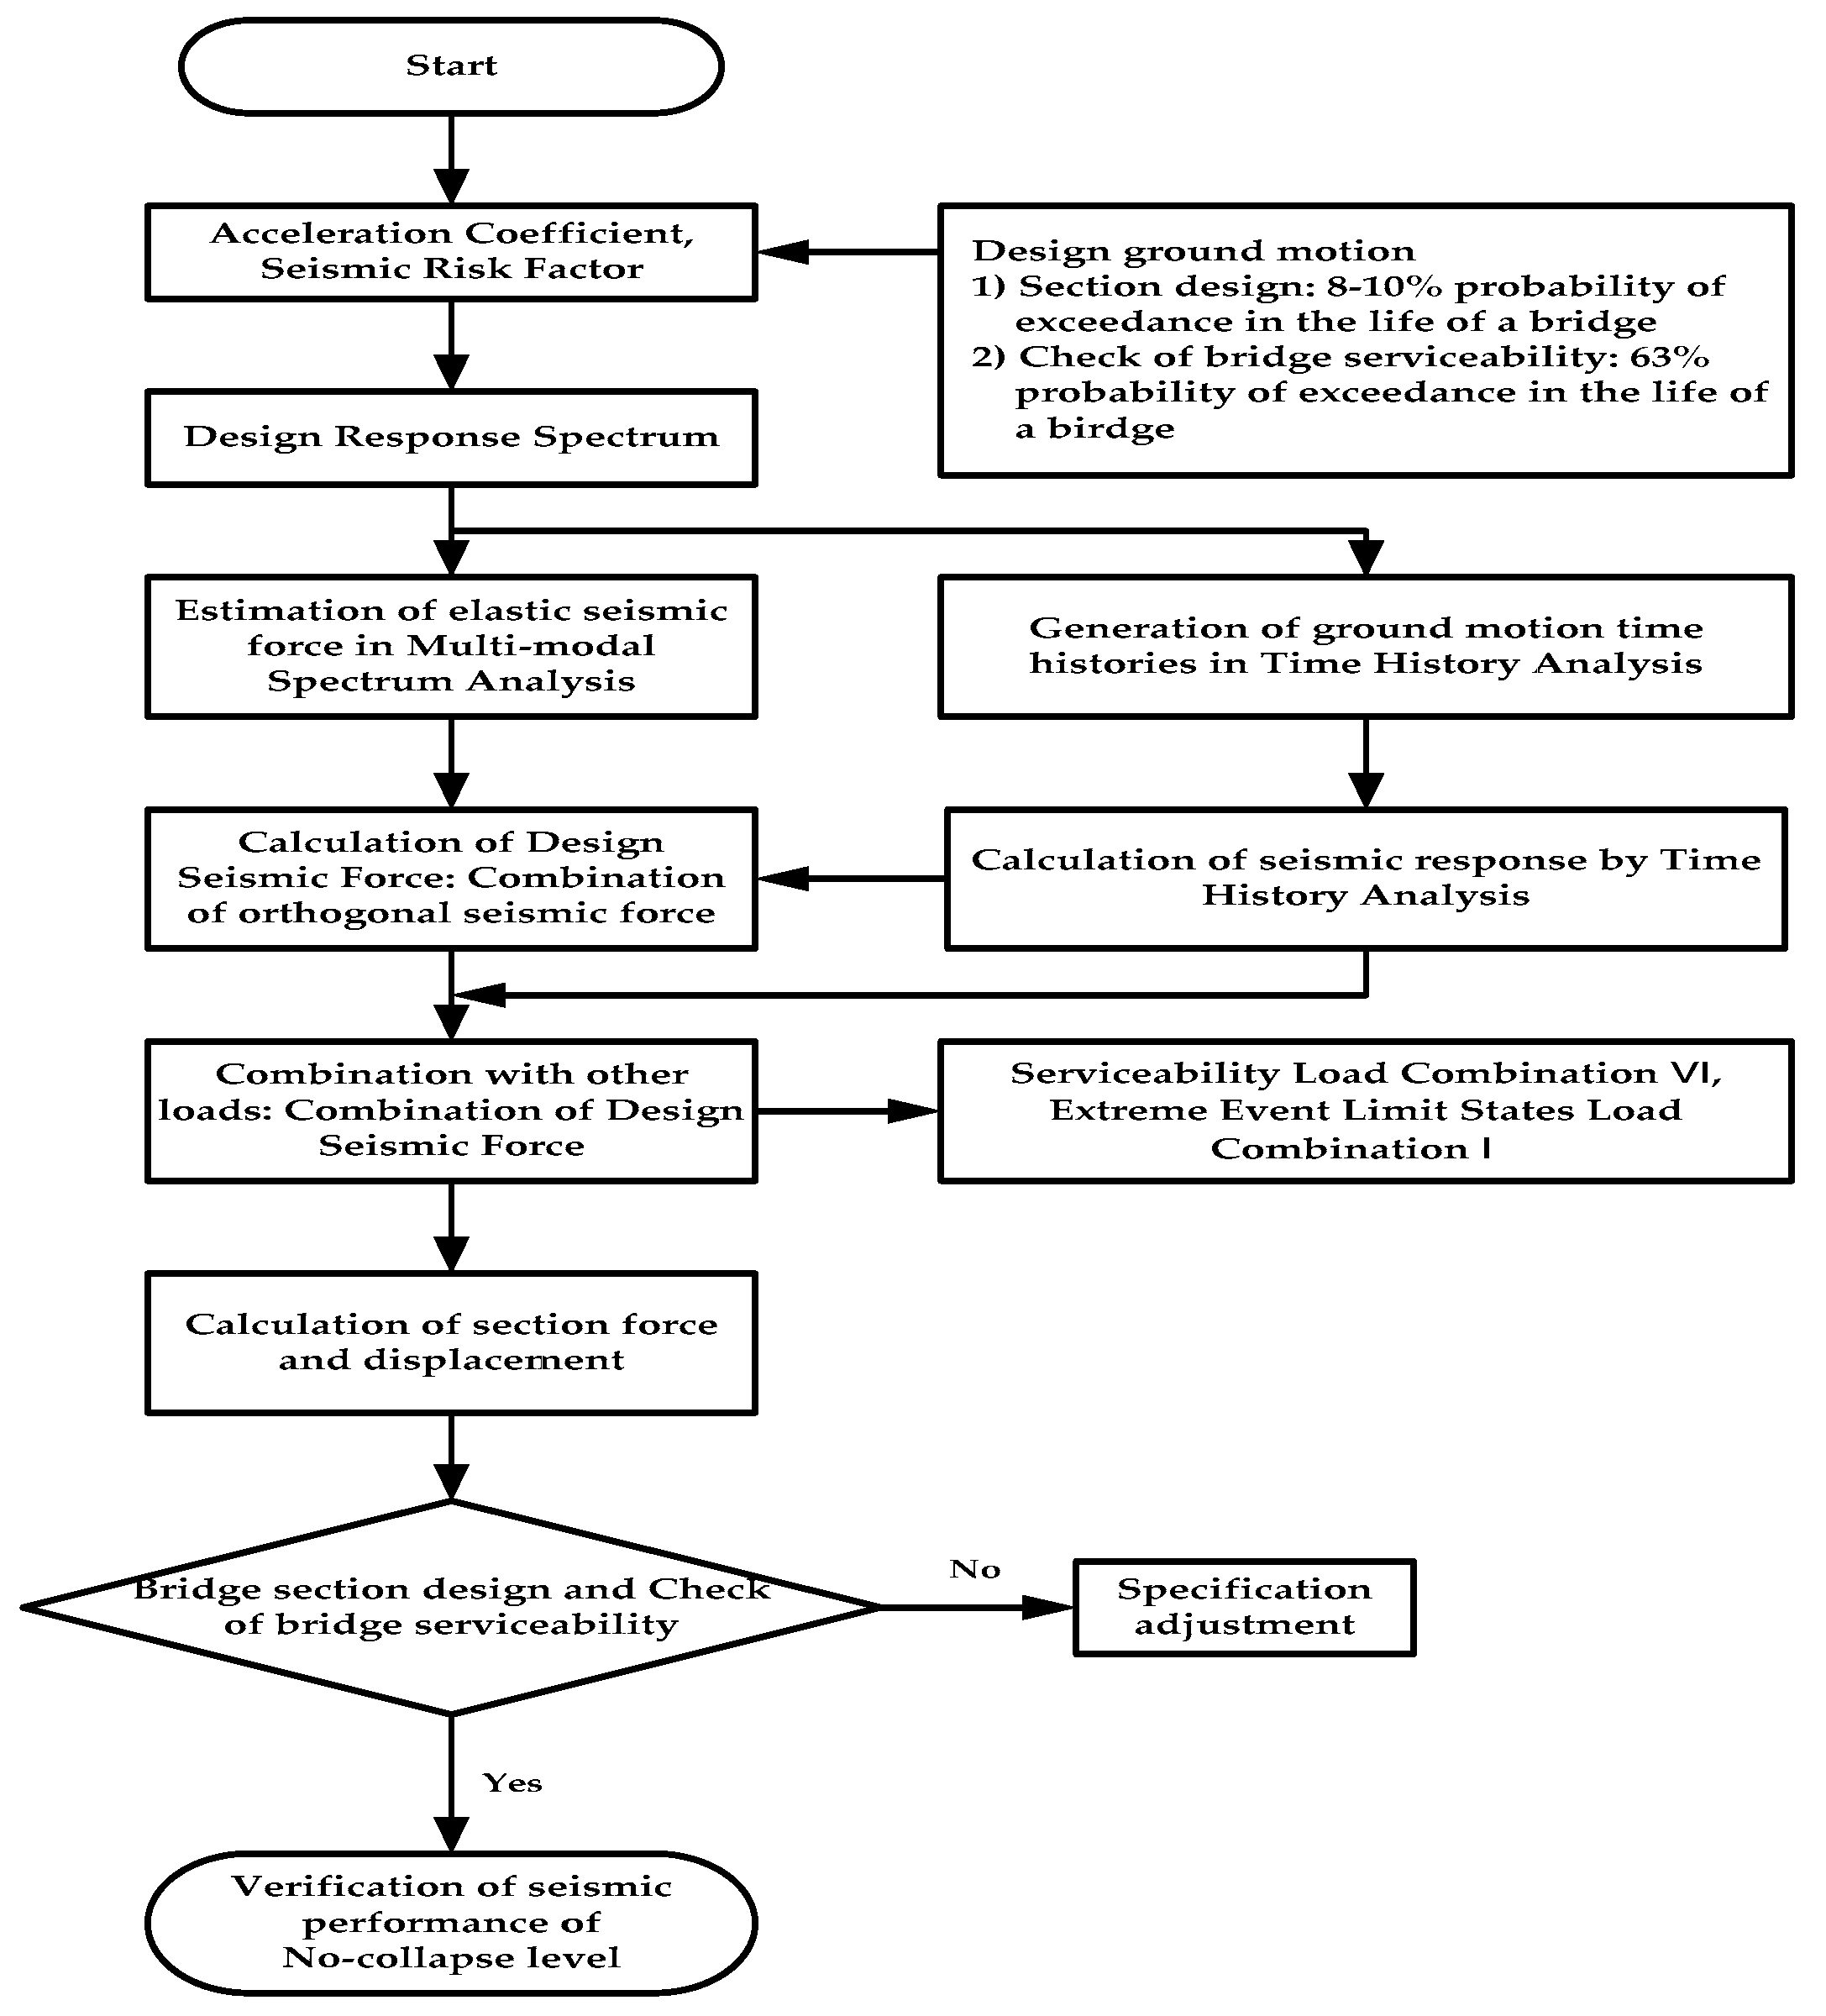
The behavior characteristics of R-FBI have not been properly introduced to the conservative seismic design of the cable-supported bridges as illustrated in
Figure 15. It is the seismic design procedure at the serviceability performance level and long-term recovery performance level referred by the Korean Highway Bridge Design Code (Limit State Design) for Cable Supported Bridges [
24].
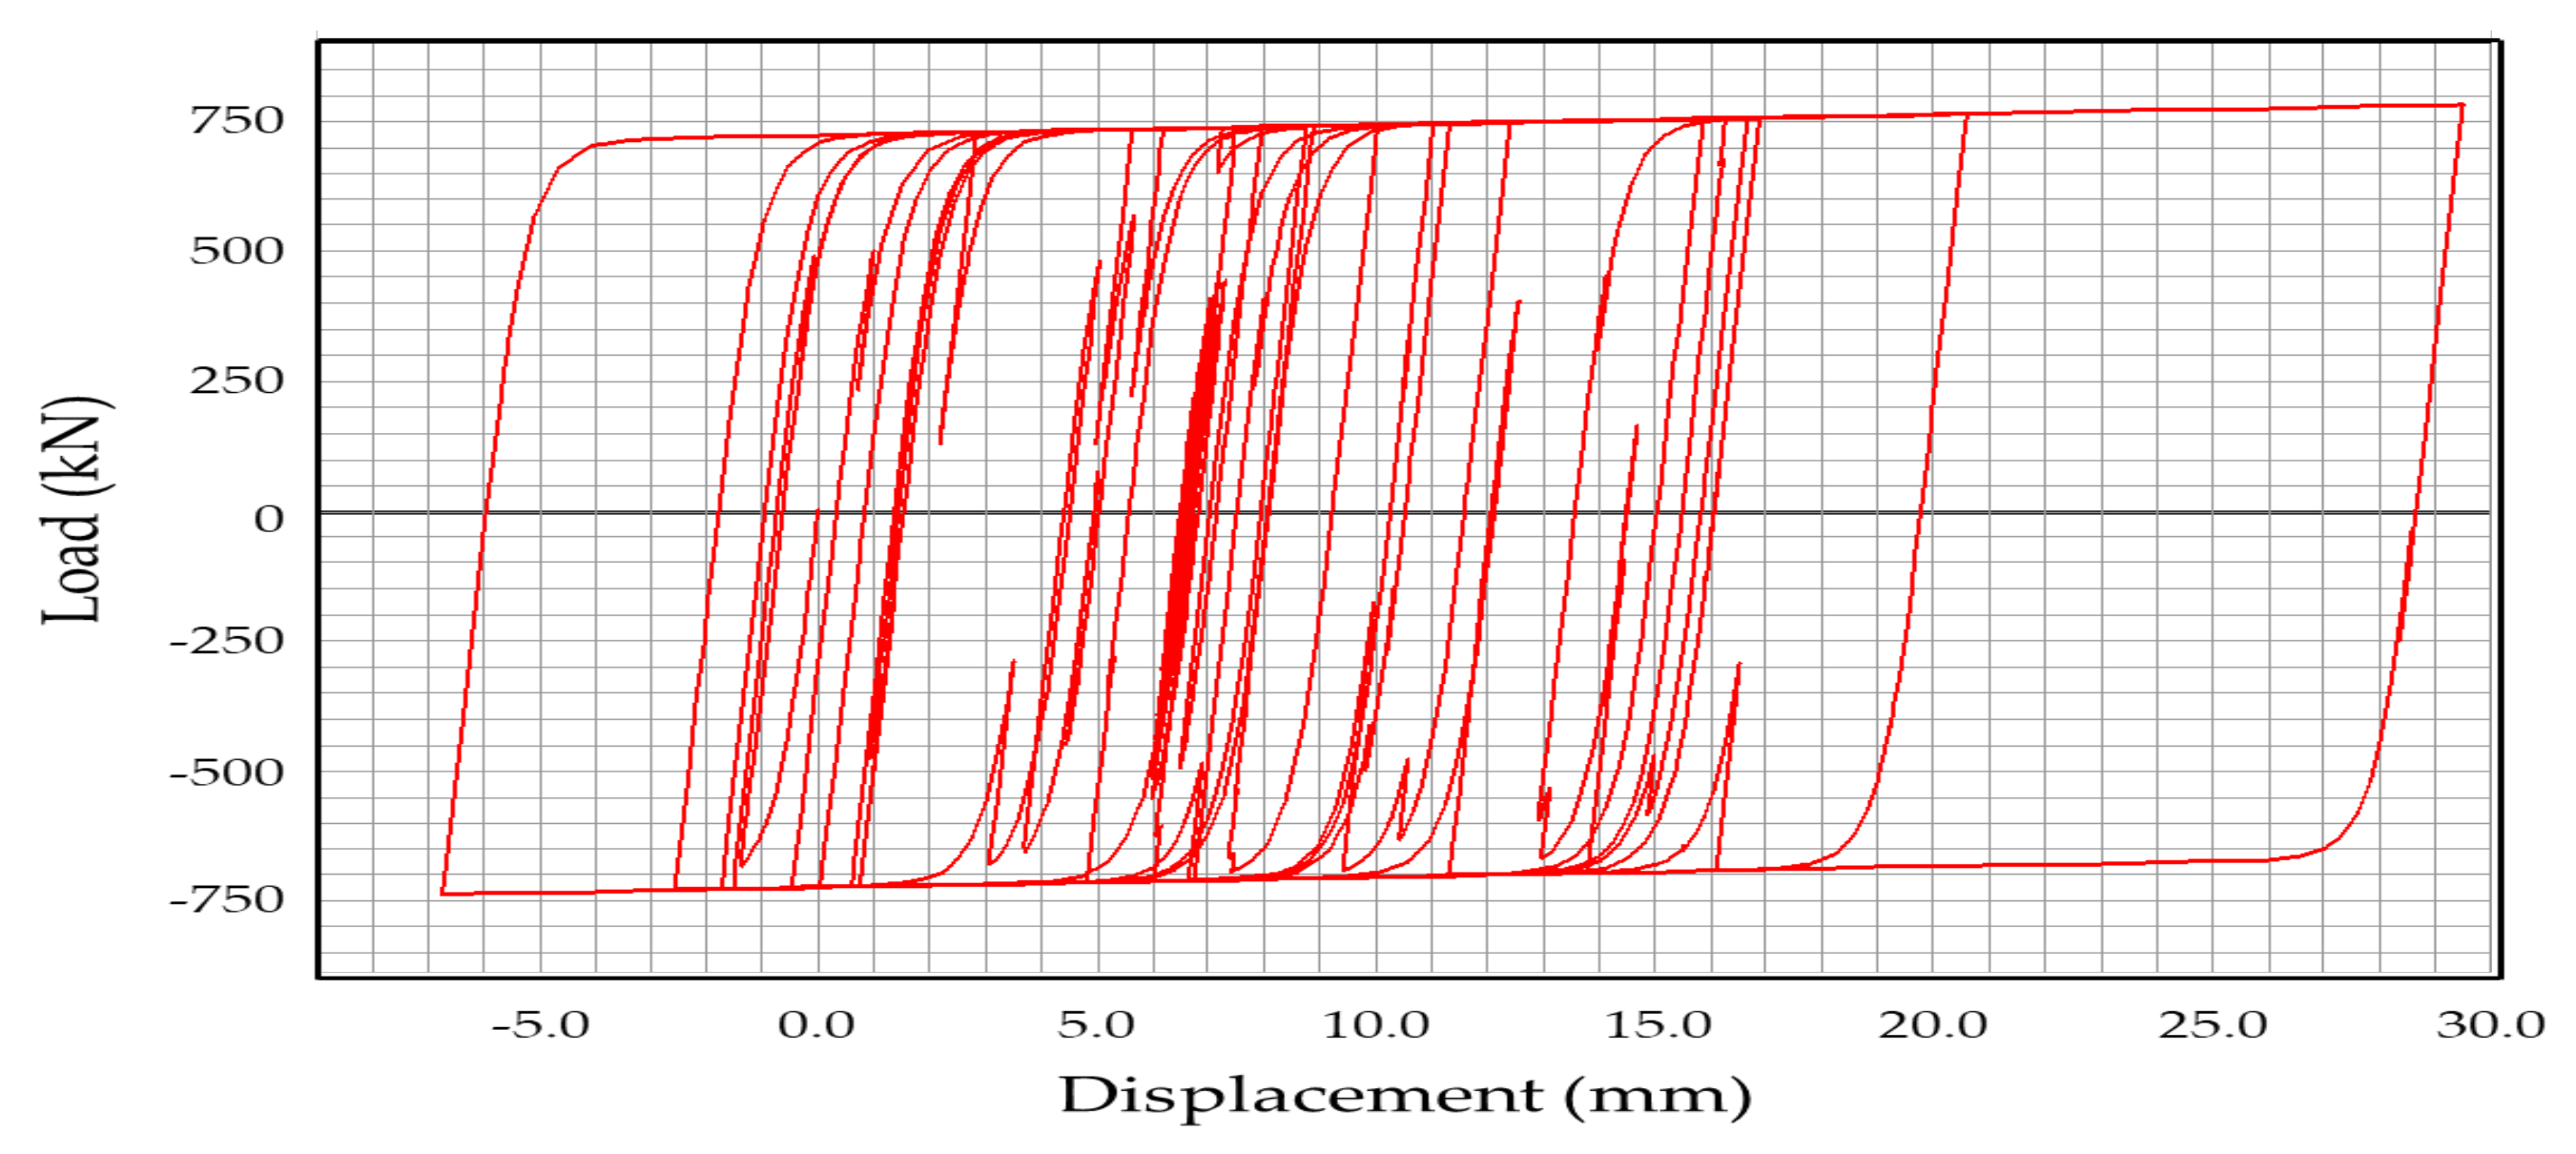
Throughout both field test results and nonlinear time history analysis results, it was found that the R-FBI primarily acts as a fixed-end support under yield strength and continuously operates to dissipate seismic energy with a hysteretic behavior as shown in
Figure 16. Hence, the R-FBI design with the implementation of its hysteric behavior should be necessary for the anti-seismic performance evaluation according to the performance levels rather than applying the RS method that consistently uses the effective stiffness (K
eff).
5.2. Proposed Performance-Based Seismic Design Method of Cable-Supported Bridge with R-FBI
The structural behavior of the cable-supported bridge with the R-FBI can be determined by implementing the design parameters of the isolators according to the anti-seismic performance levels. In other words, appropriate modeling of the R-FBI and seismic analysis methods by the base isolation performance can cause enhancement of efficiency and rationality of seismic design.
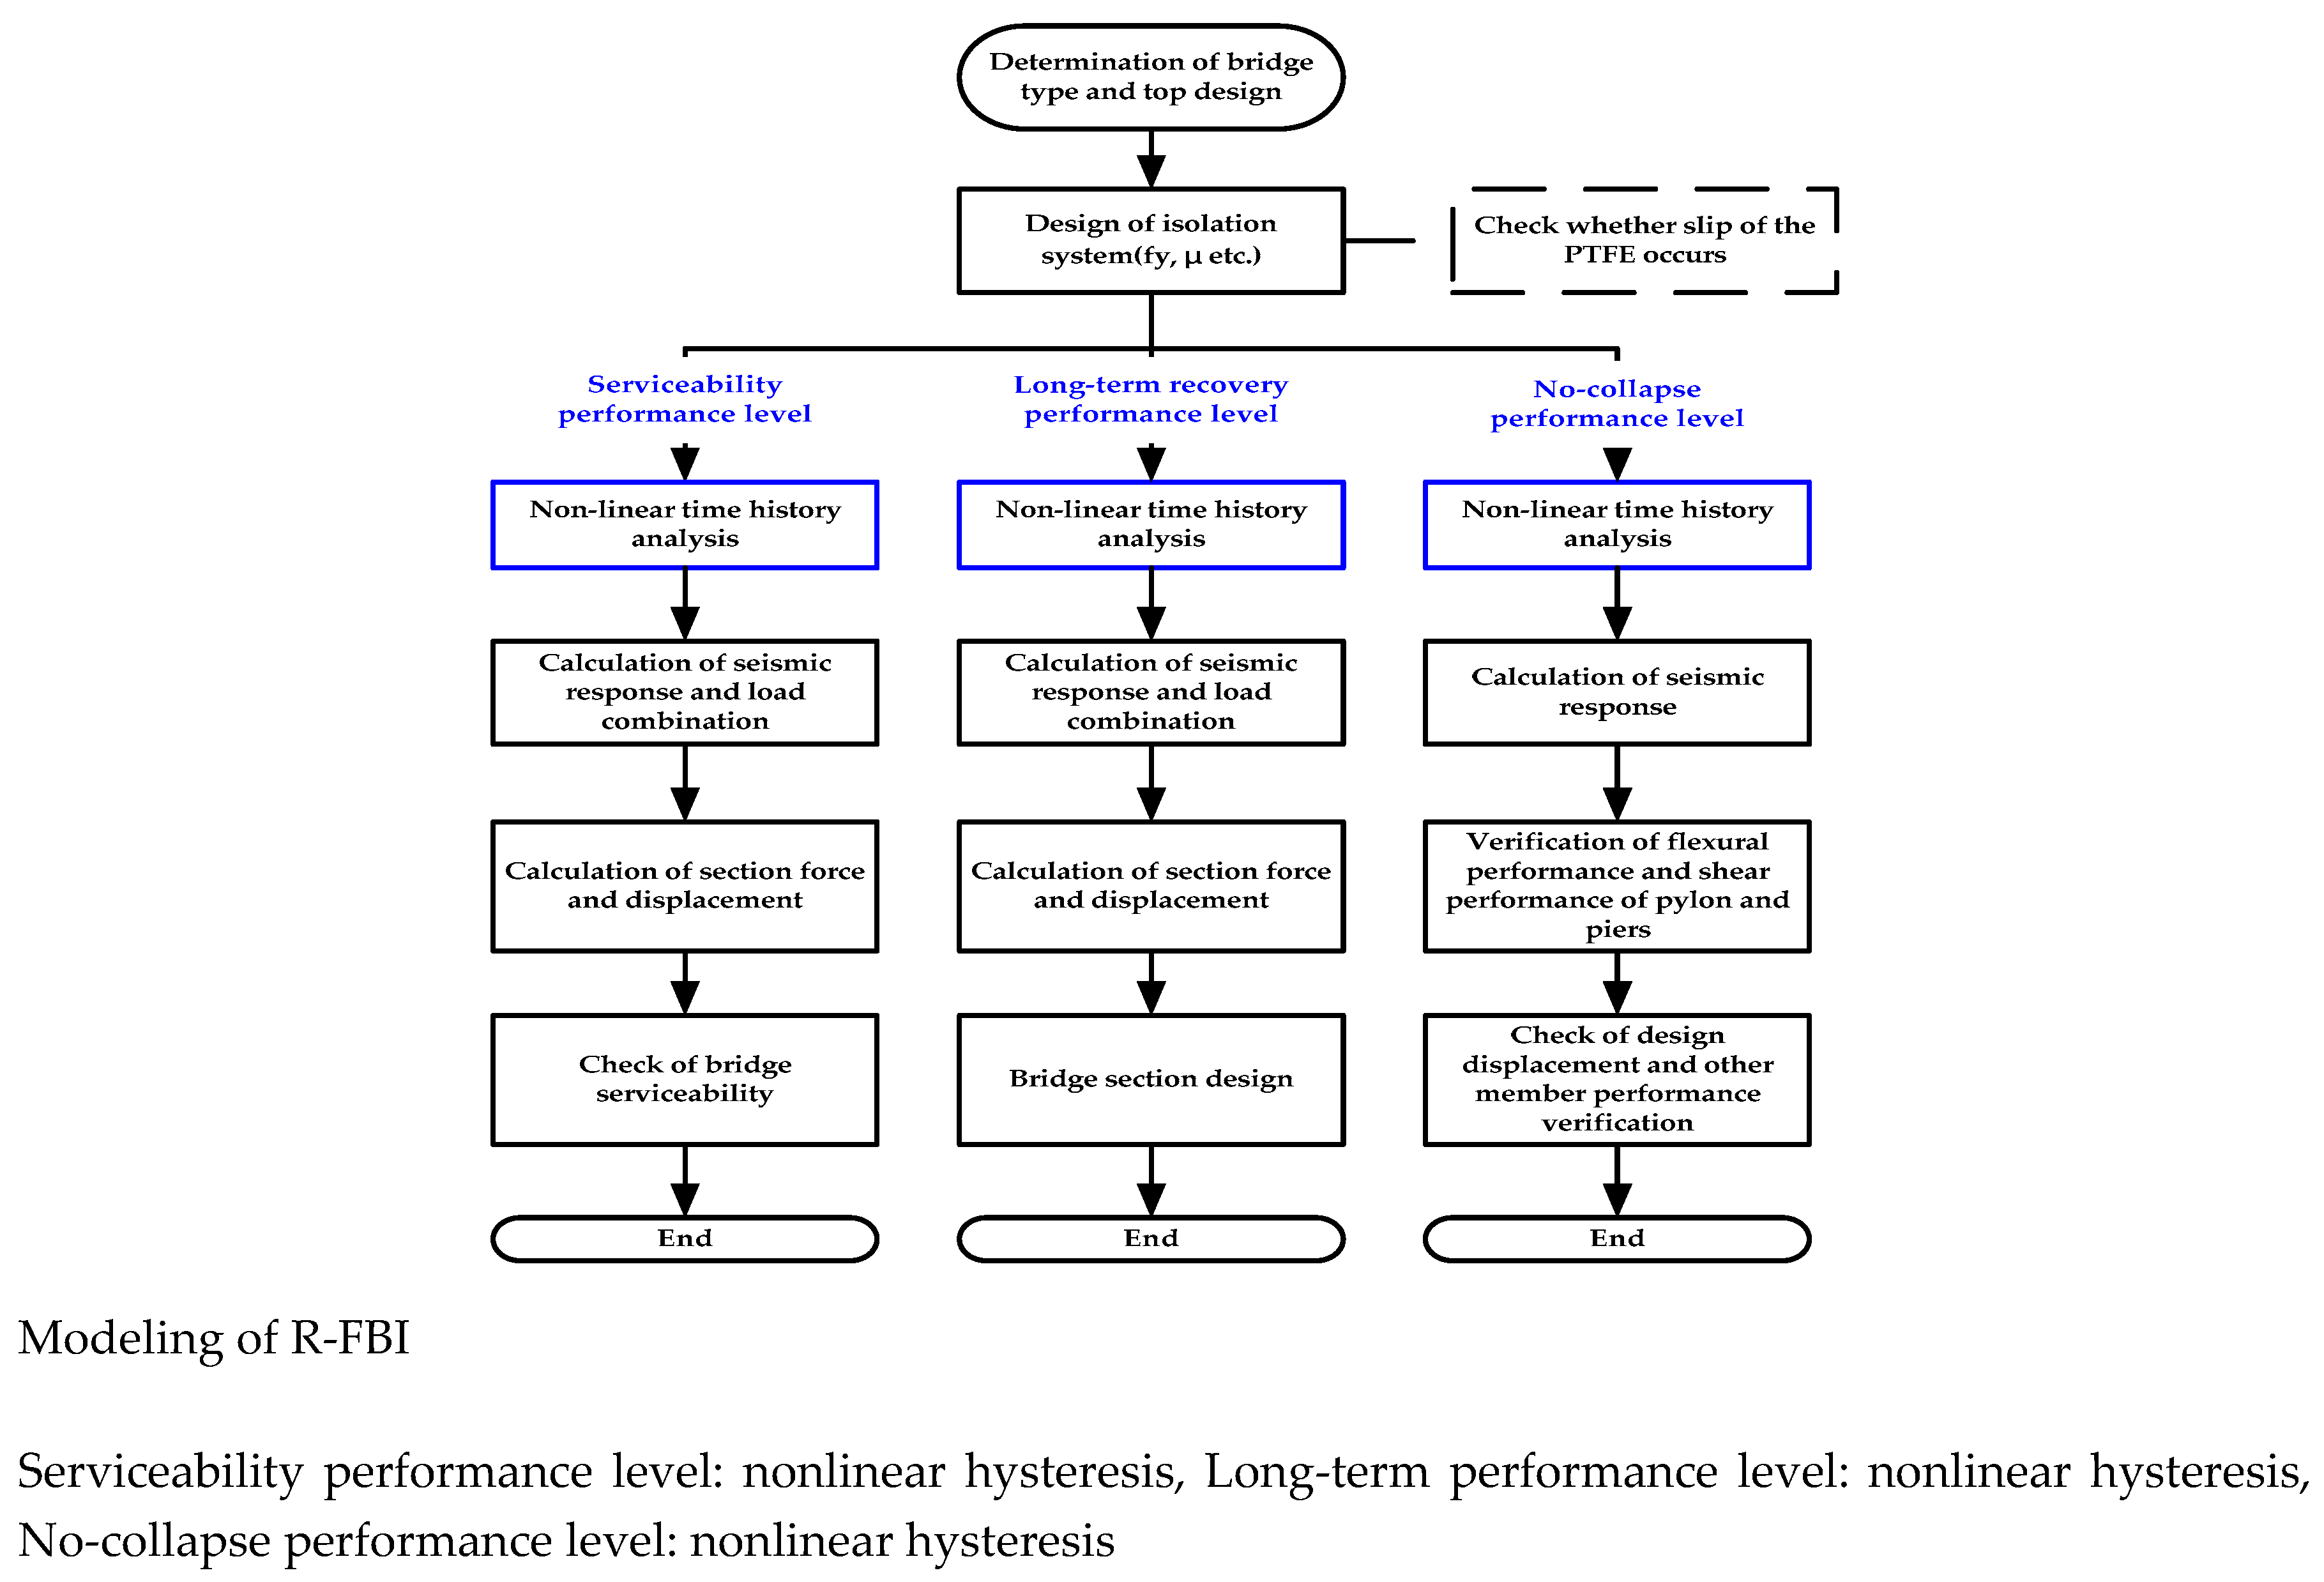
Three different design cases of flow charts for bridges with the R-FBI are proposed by applying the characteristics of the isolator system as illustrated in
Figure A1,
Figure A2 and
Figure A3 based on the cases of anti-seismic performance levels. Case I is that the PTFE friction plate slips and dissipates the seismic energy with nonlinear hysteretic behavior from PGA 0.08 g. In this case, the R-FBI should be modeled to the hysteretic system and seismic response analysis should be performed with the TH analysis. This design case should be effective for short span bridges by changing the natural frequency in order to reduce seismic excitation.
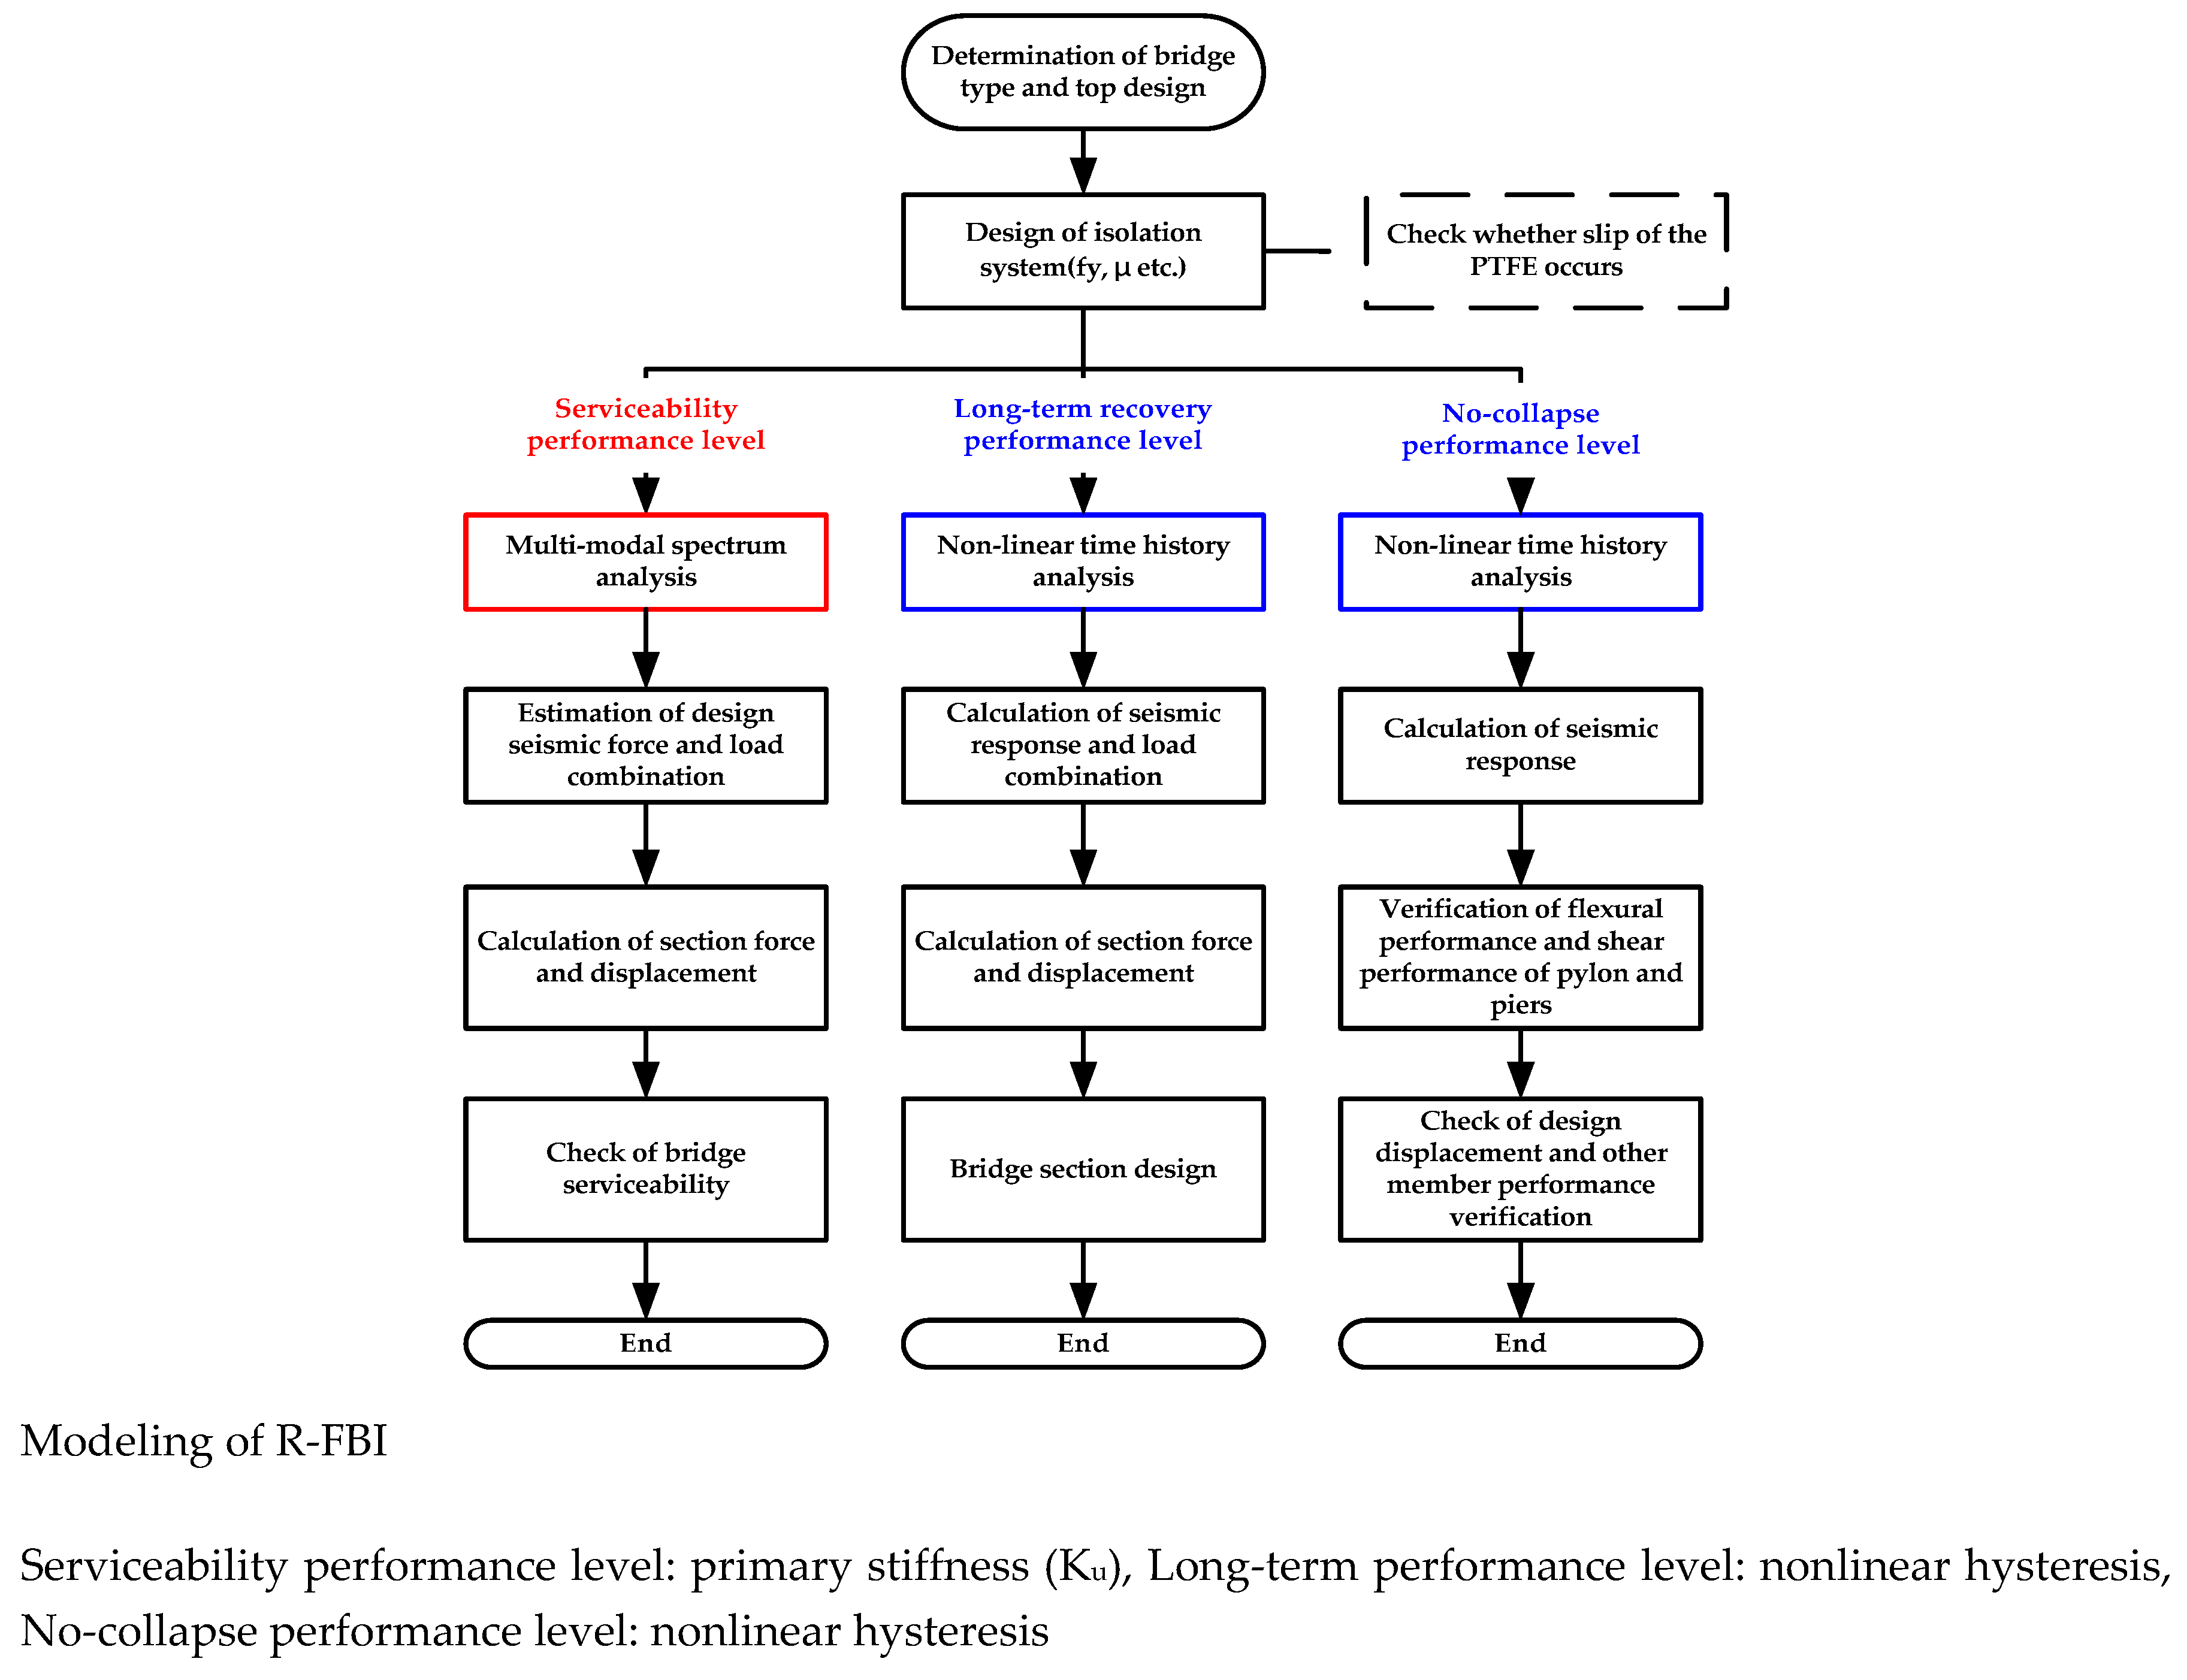
The second design case is that the friction plate operates and disperses the seismic energy with nonlinear hysteretic behavior from PGA 0.154 g. The R-FBI should be modeled to the nonlinear hysteretic system with the TH analysis method in both long-term recovery performance and no collapse performance levels. Because the base isolation effect should not be considered in serviceability performance level, the R-FBI should be designed by regarding fixed ends or introducing the Ku with the RS analysis method.
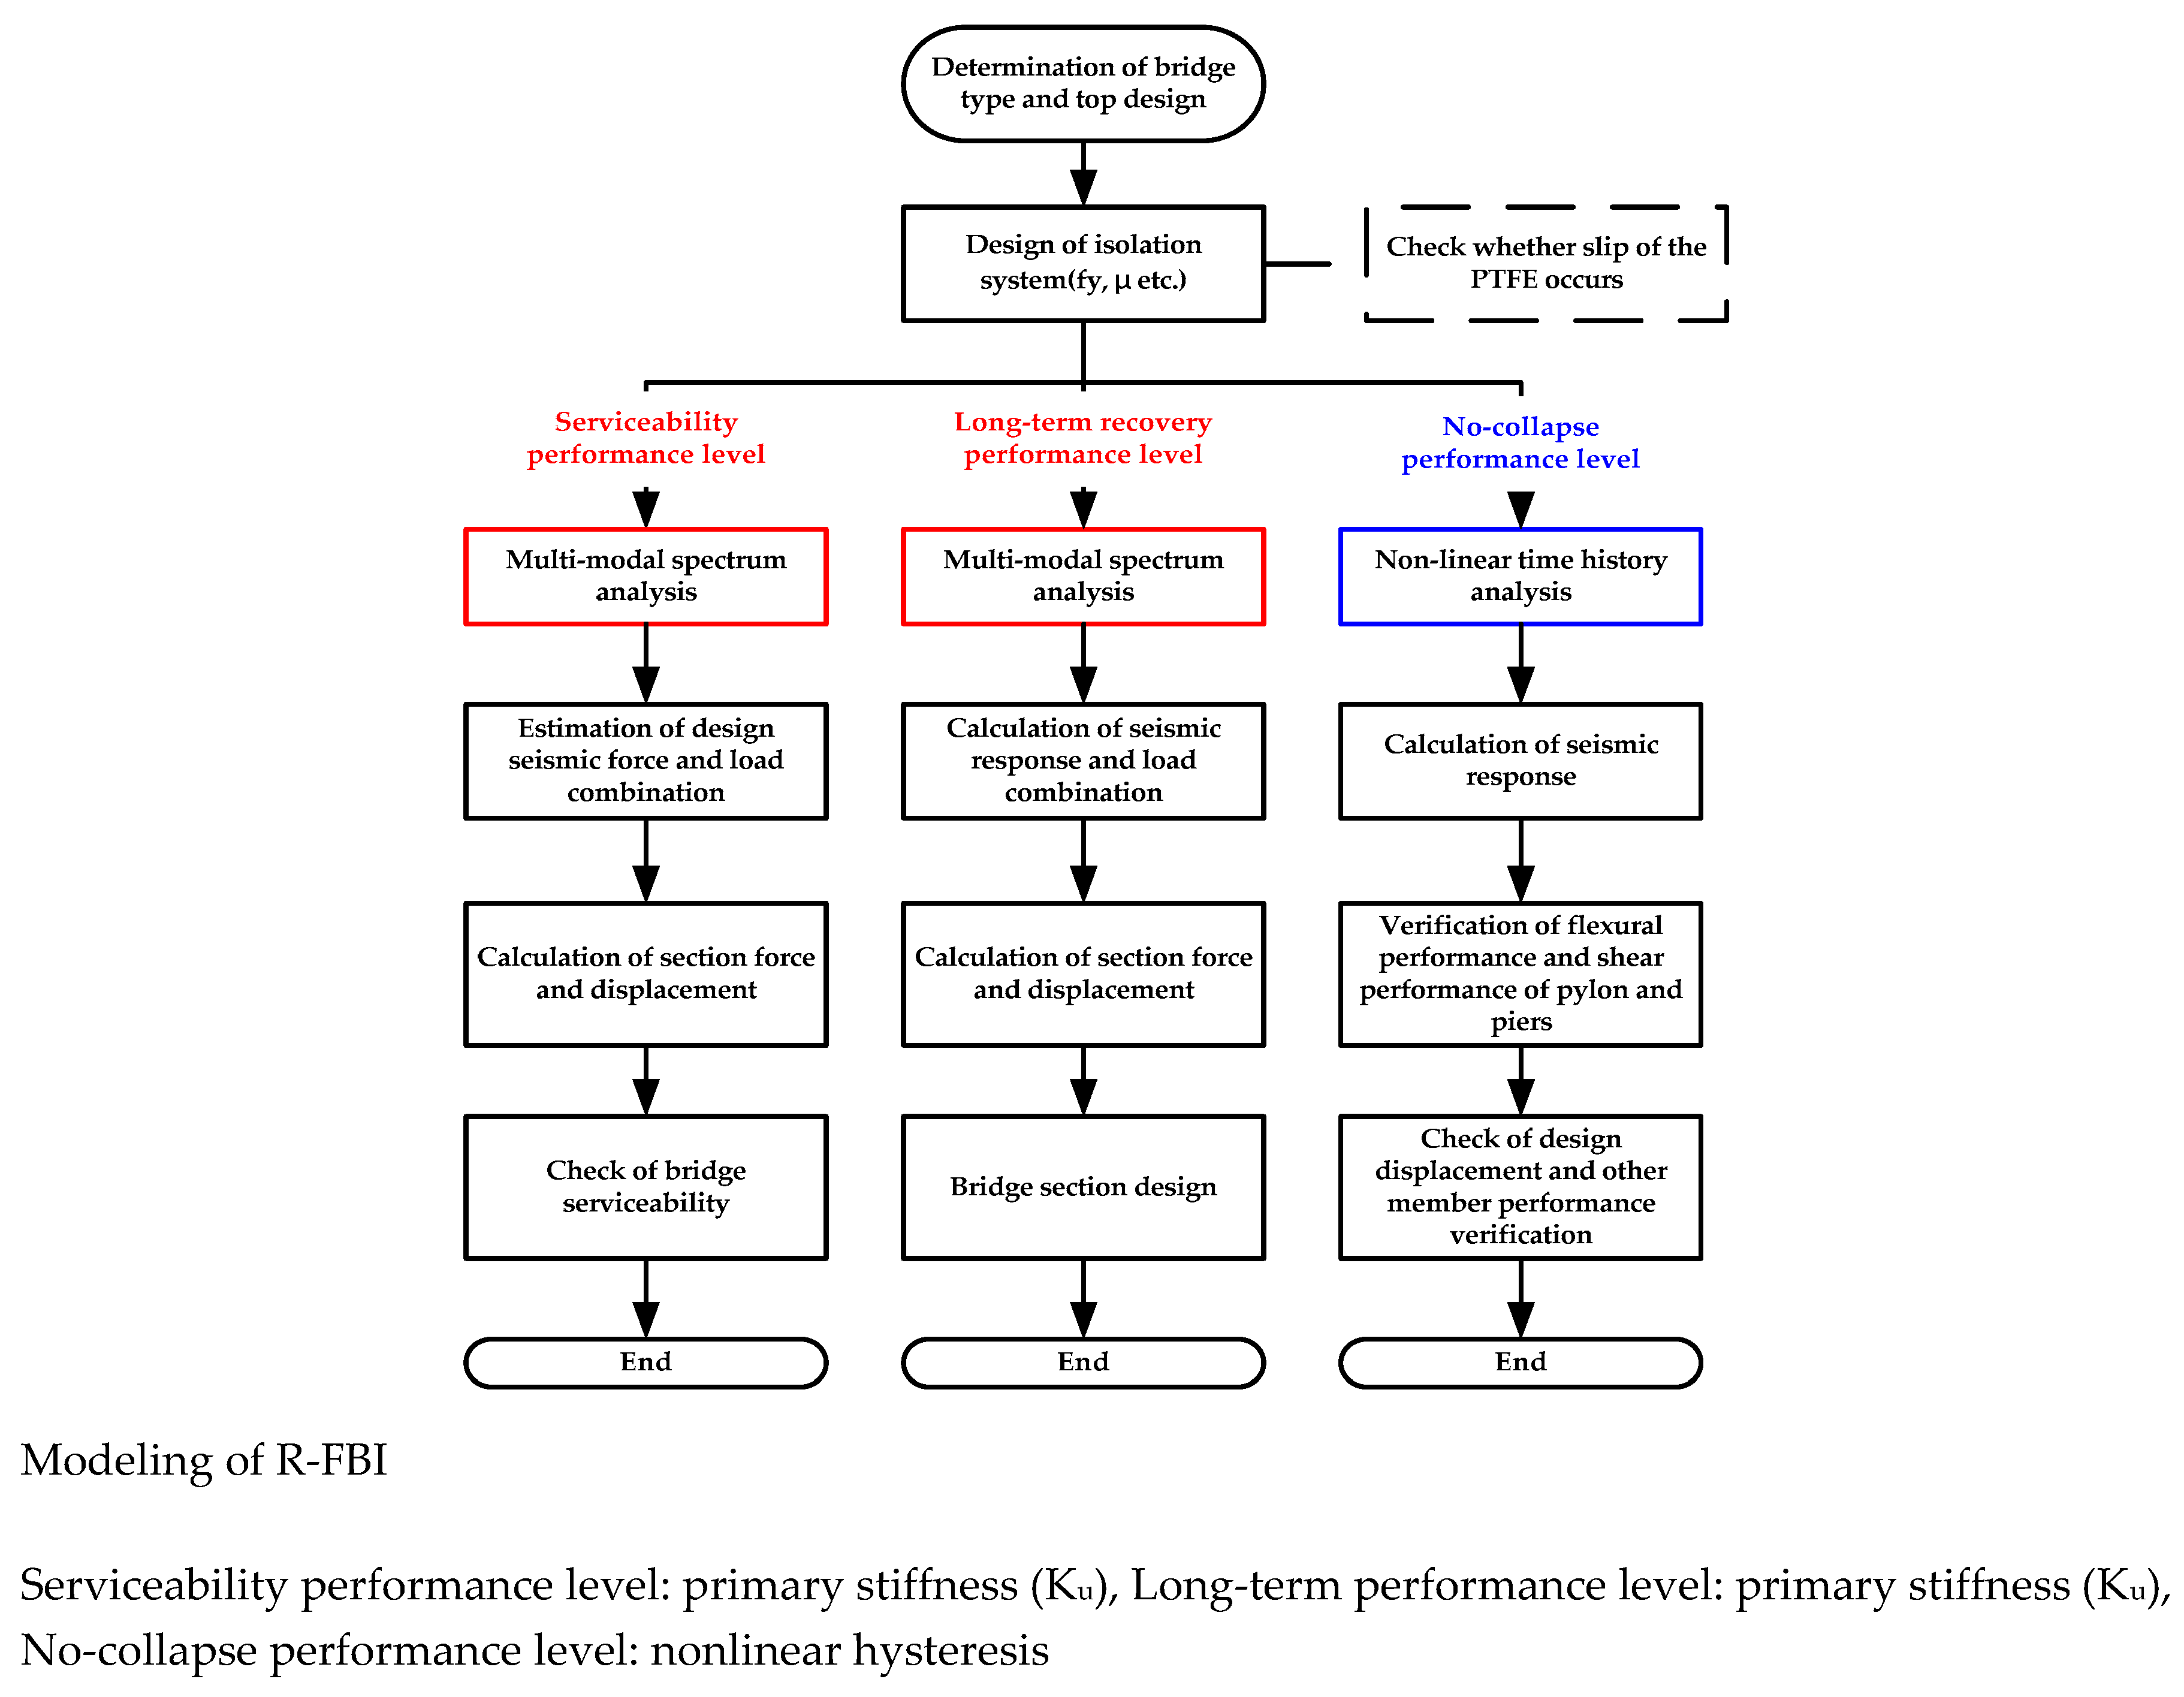
Finally, Case III is that the seismic energy is dissipated by nonlinear hysteretic behavior or the R-FBI from PGA 0.22 g. The isolation systems should be designed with the Ku or considered as the fixed ends and should be analyzed using the RS analysis method. The R-FBI should be modeled to the nonlinear hysteric system with TH analysis method due to its inelasticity at the no collapse performance level. Thus, the last case would be effective to the bridges that have long-term frequency because of the relatively low impact of energy dissipation by changing periods.
In the present study, the integrated seismic design procedures and application based on the field test and the seismic response analyses are suggested for the seismic design of cable-supported bridges with the R-FBI as shown in
Figure 17. Furthermore, various types of friction resilient isolators and cable-supported bridge structures should be studied further in order to improve both versatility and compatibility of such design procedures.
6. Conclusions
In the present study, the field tests were conducted to evaluate the dynamics of a cable-supported bridge with the R-FBI. The free vibration tests with driving and impact truck loads were performed to obtain the vibration data before the testing bridge under operation. Additionally, the ambient and cable vibration data were collected at one year after the bridge operation. The bridge dynamics from the experimental data were also compared with the modal shape analyses. The analysis results reveal that the stiffness of R-FBI from the analyses has a sensitive effect on the dynamics of the entire bridge.
The natural frequencies measured by the field tests were different from the modal shape analyses using the effective stiffness, Keff, but had a great agreement of the modified analysis models applying the primary stiffness, Ku, or the fixed end, K∞. It was experimentally found that the implementation of the Keff in the seismic design of cable-supported bridges would not properly reflect the bridge dynamics and that the R-FBI operates like the fixed end if the slip of PTFE fiction plate did not occur.
Generally, the performance-based seismic design can be categorized in three different levels such as serviceability performance level (PGA 0.08 g), long-term recovery performance level (PGA 0.154 g), and no collapse performance level (PGA 0.22 g). They stipulate not only the seismic design and target performance for each level of performance but also applicable seismic analysis methods. The multimodal response spectrum (RS) method or nonlinear time history (TH) method should be used in the PGA 0.08 g and 0.22 g respectively, and TH method should be applied to the PGA 0.22 g. The seismic response analyses were established with the fiber model of the subject bridge using TH analysis method. Carrying out the seismic analyses for each performance level, it was found that there was a big difference in seismic responses between both RS and TH methods, and an underestimation of the seismic response made by the RS method.
The experimental results and seismic analyses of the actual cable-supported bridge showed that the application of RS method that uniformly uses Keff as the lateral stiffness in seismic design without considering inelasticity of the R-FBI may lead to an insufficient determination of the target seismic performance of each performance level or irrational seismic design in terms of the safety and economic aspect of the bridge. For the reasonable and efficient seismic design of the cable-supported bridges using the R-FBI, corresponding seismic analysis method by target seismic isolation effect shall be applied by reflecting dynamic characteristics of the R-FBI, which operate like the fixed end or nonlinear hysteresis depending on the yield of the PTFE friction plate.
Finally, the seismic design procedures and application analysis methods based on the performance of cable-supported bridges with the R-FBI were proposed, and implementations of various types of base isolators and the bridges’ structures should be carried out for the further studies in order to enhance both practical application and generalization of the suggested design procedures.
Author Contributions
Conceptualization, H.G. and K.H.; Methodology, H.G., K.H., J.G., and D.C.; Experiment, K.H. and J.G.; Validation, D.C.; Formal Analysis, H.G. and K.H.; Investigation, K.H., J.G., and D.C.; Data Curation, H.G. and K.H.; Writing-Original Draft Preparation, K.H. and J.G.; Writing-Review & Editing, J.G. and D.C.; Visualization, J.G.; Supervision, D.C.; Project Administration, H.G. All authors have read and agreed to the published version of the manuscript.
Funding
This research was funded by the Research Fund of Korea Expressway Corporation [PJT_0000000000009128]. The authors gratefully acknowledge this support.
Conflicts of Interest
The authors declare no conflict of interest.
Appendix A
Figure A1.
Proposed design procedure for R-FBI (Case I).
Figure A1.
Proposed design procedure for R-FBI (Case I).
Figure A2.
Proposed design procedure for R-FBI (Case II).
Figure A2.
Proposed design procedure for R-FBI (Case II).
Figure A3.
Proposed design procedure for R-FBI (Case III).
Figure A3.
Proposed design procedure for R-FBI (Case III).
References
- Ali, H.M.; Abdel-Ghaffar, A.M. Seismic energy dissipation for cable-stayed bridges using passive devices. Earthq. Eng. Struct. Dyn. 1994, 23, 877–893. [Google Scholar] [CrossRef]
- AASHTO. Design Procedures for Seismically Isolated Bridge; Dynamic Isolation System, Inc.: Berkeley, CA, USA, 1994. [Google Scholar]
- Shin, Y.; Park, J.; Choi, K.; Hong, S. Seismic Behavior and Economic efficiency Analysis of Bridge for PSC I-Shaped Girder of isolated device. J. Comput. Struct. Eng. Inst. Korea 2008, 21, 145–151. [Google Scholar]
- Yu, S.; Lee, Y.; Ji, Y.; Choi, D.; Kim, D. A study on the application of EQS bearings for seismic isolation of building structures by ICT case study. J. Earthq. Eng. Soc. Korea 2013, 17, 61–70. [Google Scholar] [CrossRef] [Green Version]
- Han, K.; Kim, M.; Park, S. Improvement of seismic performance of existing bridges using isolation. J. Earthq. Eng. Soc. Korea 2004, 8, 9–17. [Google Scholar]
- Lee, Y.; Lee, Y.; Lee, H.; Cho, M.; Jee, Y.; Beak, J. Study on the performance improvement of an EQS device applied nuclear power plant. J. Earthq. Eng. Soc. Korea 2015, 19, 13–19. [Google Scholar] [CrossRef] [Green Version]
- Ha, D.; Koh, H. Earthquake response characteristics of seismically isolated bridges with frictional bearings. J. Korean Soc. Civ. Eng 2000, 20, 937–944. [Google Scholar]
- Kim, B.; Song, J. Seismic responses of seismically isolated nuclear power plant structure considering post-yield stiffness of EQS bearing. J. Earthq. Eng. Soc. Korea 2016, 20, 319–329. [Google Scholar] [CrossRef]
- Park, H.; Lee, Y.; Jung, D. Experimental and Analytical Study of the Dynamic Behavior of a Polyurethane Spring Restoring Disk Bearing. J. Earthq. Eng. Soc. Korea 2011, 15, 61–69. [Google Scholar] [CrossRef] [Green Version]
- Asgari, B.; Osman, S.A. Application of isolation systems in the seismic control of cable-stayed bridges: A state-of-the-art review. In Proceedings of the 3rd WSEAS International Conference on Engineering Mechanics, Structures, Engineering Geology, Stevens Point, WI, USA, 22–24 July 2010; pp. 354–362. [Google Scholar]
- Biswas, S.K.; Vijayan, K. Friction and wear of PTFE—A review. Wear 1992, 158, 193–211. [Google Scholar] [CrossRef]
- Han, K.; Cho, D.; Park, S. Structural Identification of Dynamic Systems Using Parameter Updating Reanalysis Method: Experimental Investigation Using the Measures Data. Trans. Can. Soc. Mech. Eng. 2016, 40, 847–857. [Google Scholar] [CrossRef]
- Bang, I. Experiences of sliding disk bearing in Korea. In Proceedings of the 7th World Congress on Joints Bearings and Seismic Systems for Concrete Structures, Las Vegas, NV, USA, 2–6 October 2011. [Google Scholar]
- Chang, C.C.; Chang, T.Y.P.; Zhang, Q.W. Ambient Vibration of Long-Span Cable-Stayed Bridge. J. Bridge Eng. 2001, 6, 46–53. [Google Scholar] [CrossRef]
- Safety & Quality Engineering Co., Ltd.; Genel Müdürlüğü, K. Final Report of Acceptance test for 3rd Bosphorus Bridge; Safety & Quality Engineerng Co., Ltd.: Seoul, Korea, 2016. [Google Scholar]
- Shimada, T. Estimating method of cable tension from natural frequency of high mode. Doboku Gakkai Ronbunshu 1994, 1994, 163–171. [Google Scholar] [CrossRef] [Green Version]
- Cho, S.; Yun, C.; Sim, S. Evaluation of Cable Tension Forces Using Vibration Method for a Cable-stayed Bridge under Construction. J. Korean Soc. Saf. 2014, 29, 38–44. [Google Scholar] [CrossRef] [Green Version]
- Kim, N.; Jeong, W. Evaluation of Tension Force of Stay Cables Using Vibration Method. Trans. Korean Soc. Noise Vib. Eng. 2002, 12, 956–963. [Google Scholar]
- Tsopelas, P.; Constantinou, M.C.; Okamoto, S.; Fujii, S.; Ozaki, D. Experimental study of bridge seismic sliding isolation systems. Eng. Struct. 1996, 18, 301–310. [Google Scholar] [CrossRef]
- MidasIT Co. midas Civil On-line Manual. Available online: http://manual.midasuser.com/EN_TW/Civil/830/index.htm (accessed on 25 July 2018).
- Mander, J.B.; Priestley, M.J.N.; Park, R. Theoretical Stress-Strain Model for Confined Concrete. J. Struct. Eng. 1988, 114, 1804–1826. [Google Scholar] [CrossRef] [Green Version]
- Menegotto, M.; Pinto, P.E. Method of Analysis for Cyclically Loaded Reinforced Concrete Plane Frames Including Changes in Geometry and Non-elastic Behavior of Elements Under Combined Normal Force and Bending. In Proceedings of the IABSE Symposium on the Resistance and Ultimate Deformability of Structures Acted on by Well-Defined Repeated Loads, Lisbon, Portugal, 15–22 January 1973. [Google Scholar]
- Park, Y.J.; Wen, Y.K.; Ang, H.S. Random vibration of hysteretic systems under bi-directional ground motions. J. Int. Assoc. Earthq. Eng. 1986, 14, 543–557. [Google Scholar] [CrossRef]
- Ministry of Land, Infrastructure and Transport. Korean Highway Bridge Design Code for Cable Supported Bridges (Limit State Design); Ministry of Land, Infrastructure and Transport: Sejong, Korea, 2016.
- Cho, Y.; Kim, S.; Son, Y.; Yoo, D. A Systematic Approach to the Geometric Control (Construction Engineering) for Long Span Cable-Stayed Bridges; Technical Report; Korean Society of Steel Construction: Seoul, Korea, 2011; Volume 23, pp. 68–76. [Google Scholar]
Figure 1.
Configuration of resilient-friction base isolator system.
Figure 1.
Configuration of resilient-friction base isolator system.
Figure 2.
Subject bridge plan and installation configuration of base isolators. (a) The Nakdong river bridge plan; (b) Installation configuration of isolation systems.
Figure 2.
Subject bridge plan and installation configuration of base isolators. (a) The Nakdong river bridge plan; (b) Installation configuration of isolation systems.
Figure 3.
Installation configuration of accelerometer channels (X-axis in longitudinal, Y-axis in transverse, Z-axis in orthogonal). (a–c) Acceleration seonsors’ installations for vibration tests.
Figure 3.
Installation configuration of accelerometer channels (X-axis in longitudinal, Y-axis in transverse, Z-axis in orthogonal). (a–c) Acceleration seonsors’ installations for vibration tests.
Figure 4.
Time history and Fast Fourier Transform of free vibration test. (a–d) Acceleration data in corresponding positions.
Figure 4.
Time history and Fast Fourier Transform of free vibration test. (a–d) Acceleration data in corresponding positions.
Figure 5.
Time history and Fast Fourier Transform of ambient vibration test. (a–d) Acceleration data in corresponding positions.
Figure 5.
Time history and Fast Fourier Transform of ambient vibration test. (a–d) Acceleration data in corresponding positions.
Figure 6.
Cable tension force estimation result. (a–d) Cable tensile force in corresponding positions.
Figure 6.
Cable tension force estimation result. (a–d) Cable tensile force in corresponding positions.
Figure 7.
Effective stiffness and hysteresis curve of resilient friction base isolation system. (a) Characteristics of bilinear isoaltions bearing; (b) Quality test result of the R-FBI.
Figure 7.
Effective stiffness and hysteresis curve of resilient friction base isolation system. (a) Characteristics of bilinear isoaltions bearing; (b) Quality test result of the R-FBI.
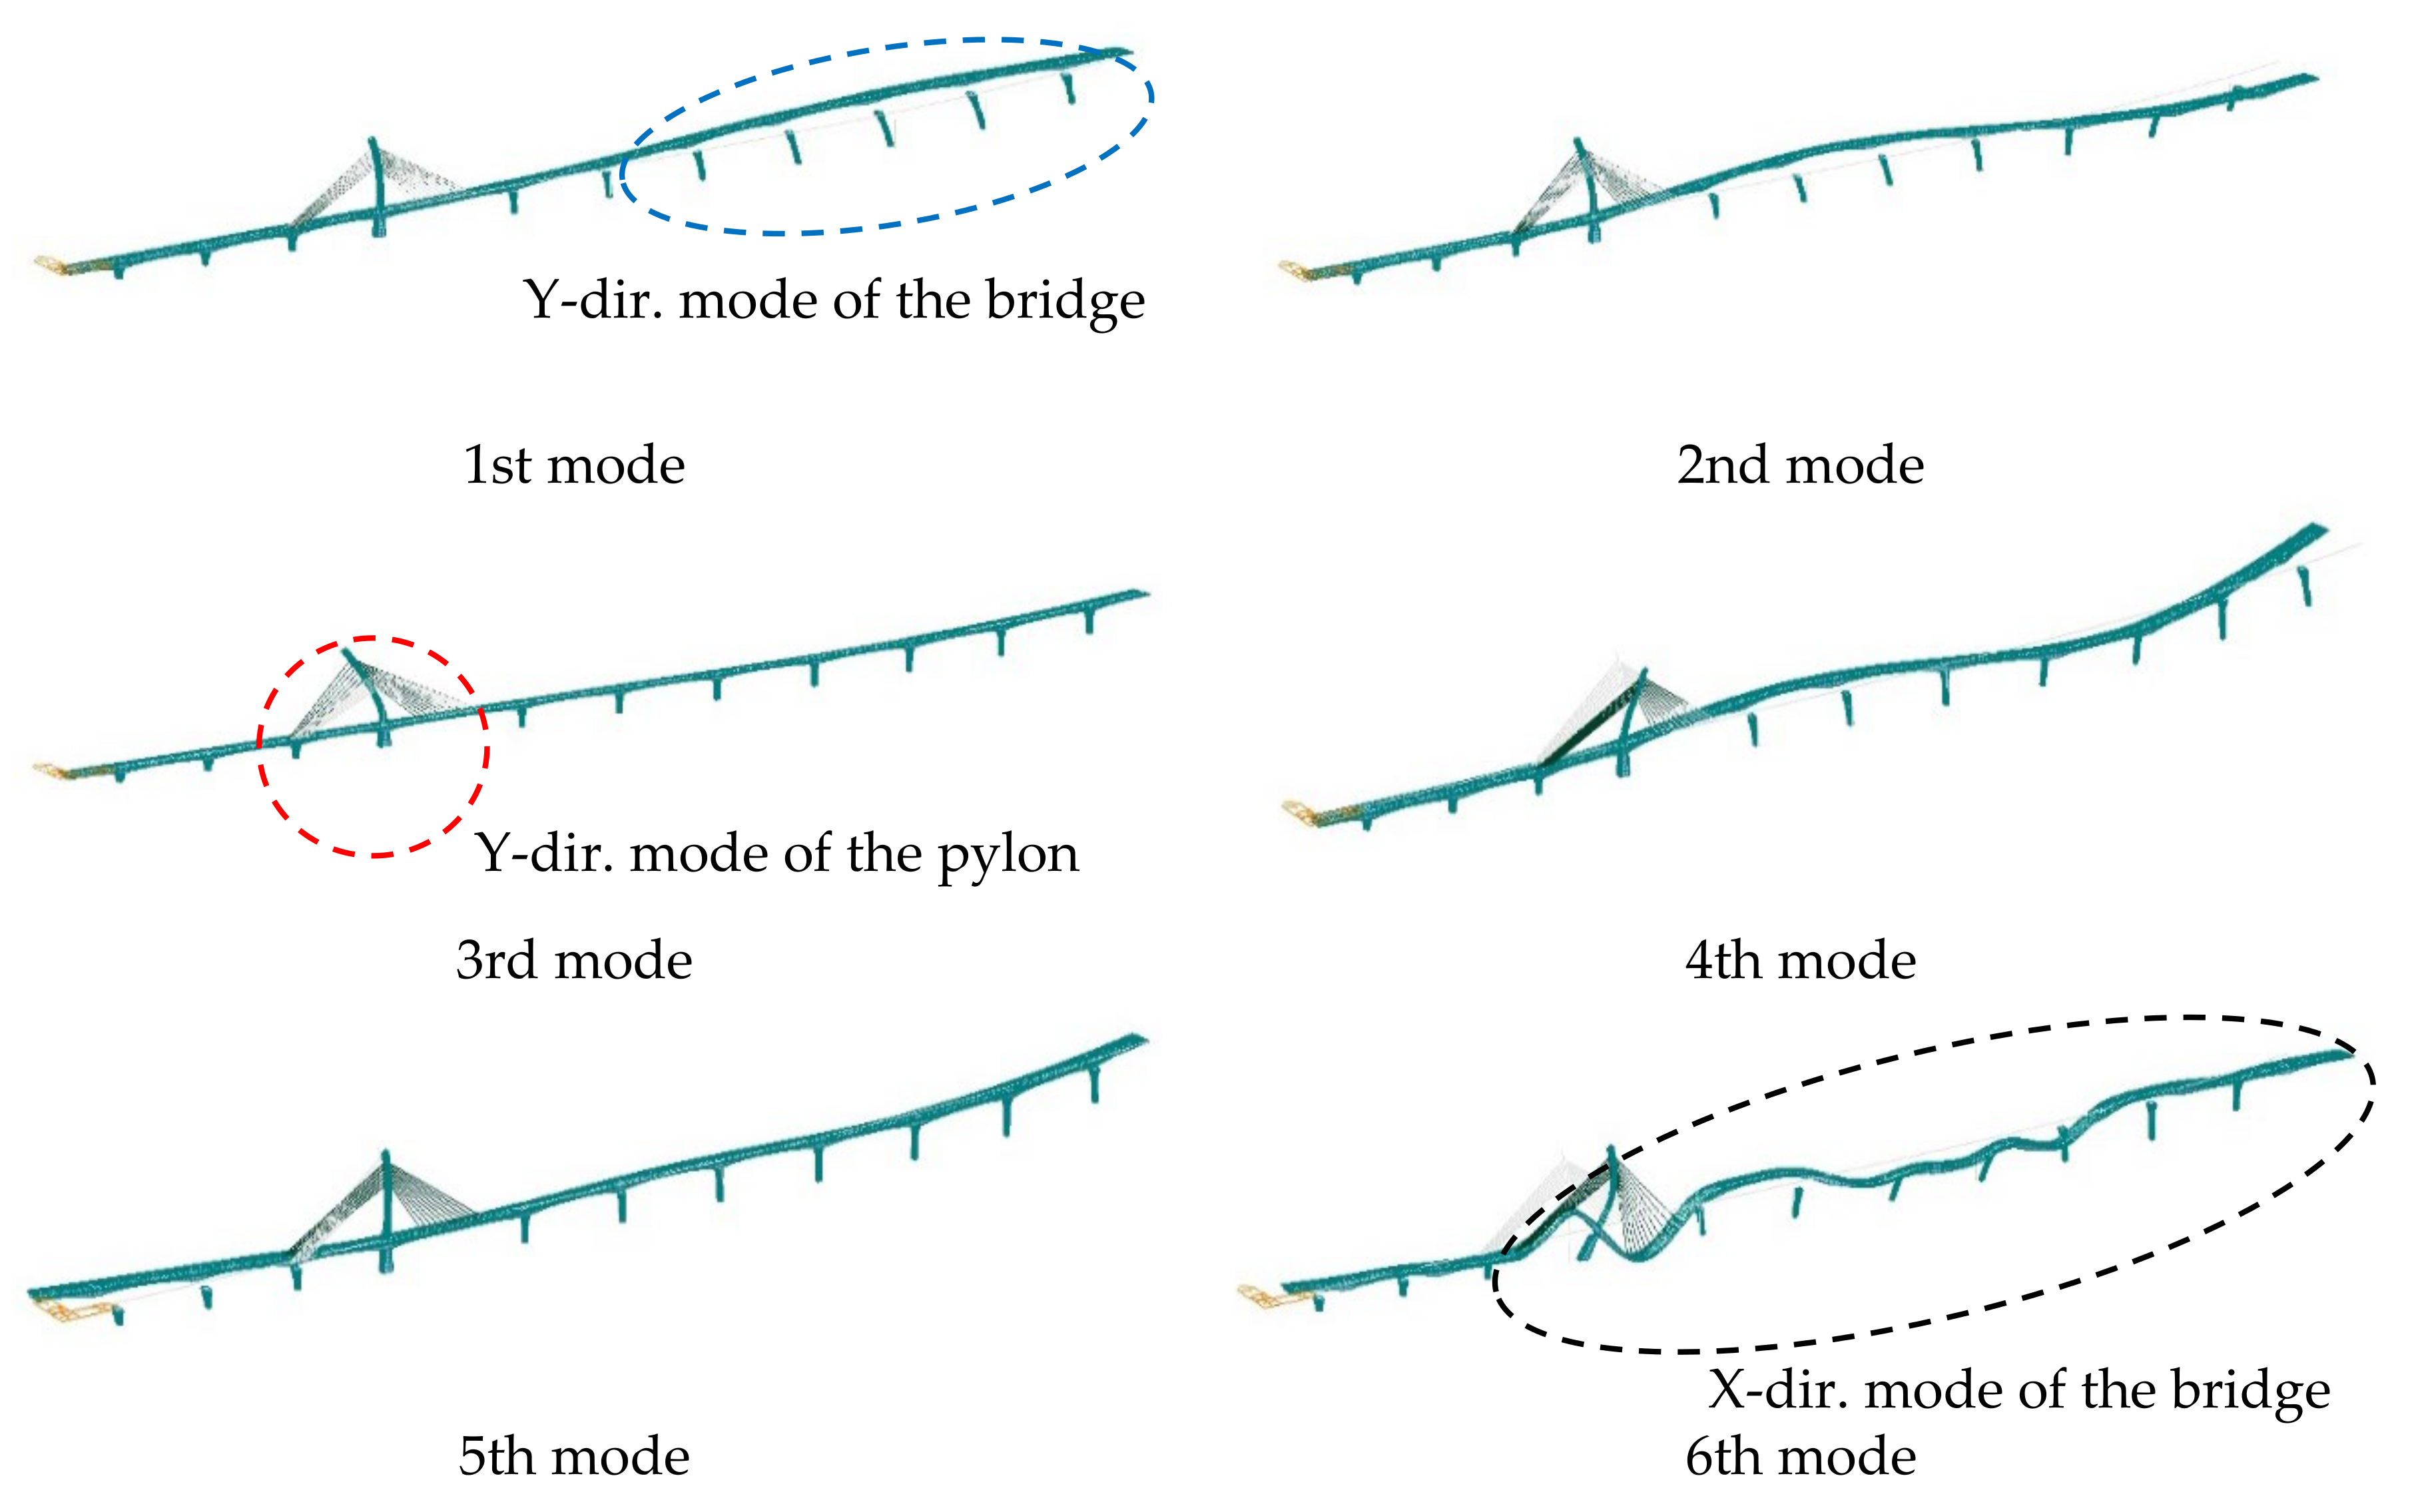
Figure 8.
Mode shape configurations using effective stiffness (Keff).
Figure 8.
Mode shape configurations using effective stiffness (Keff).
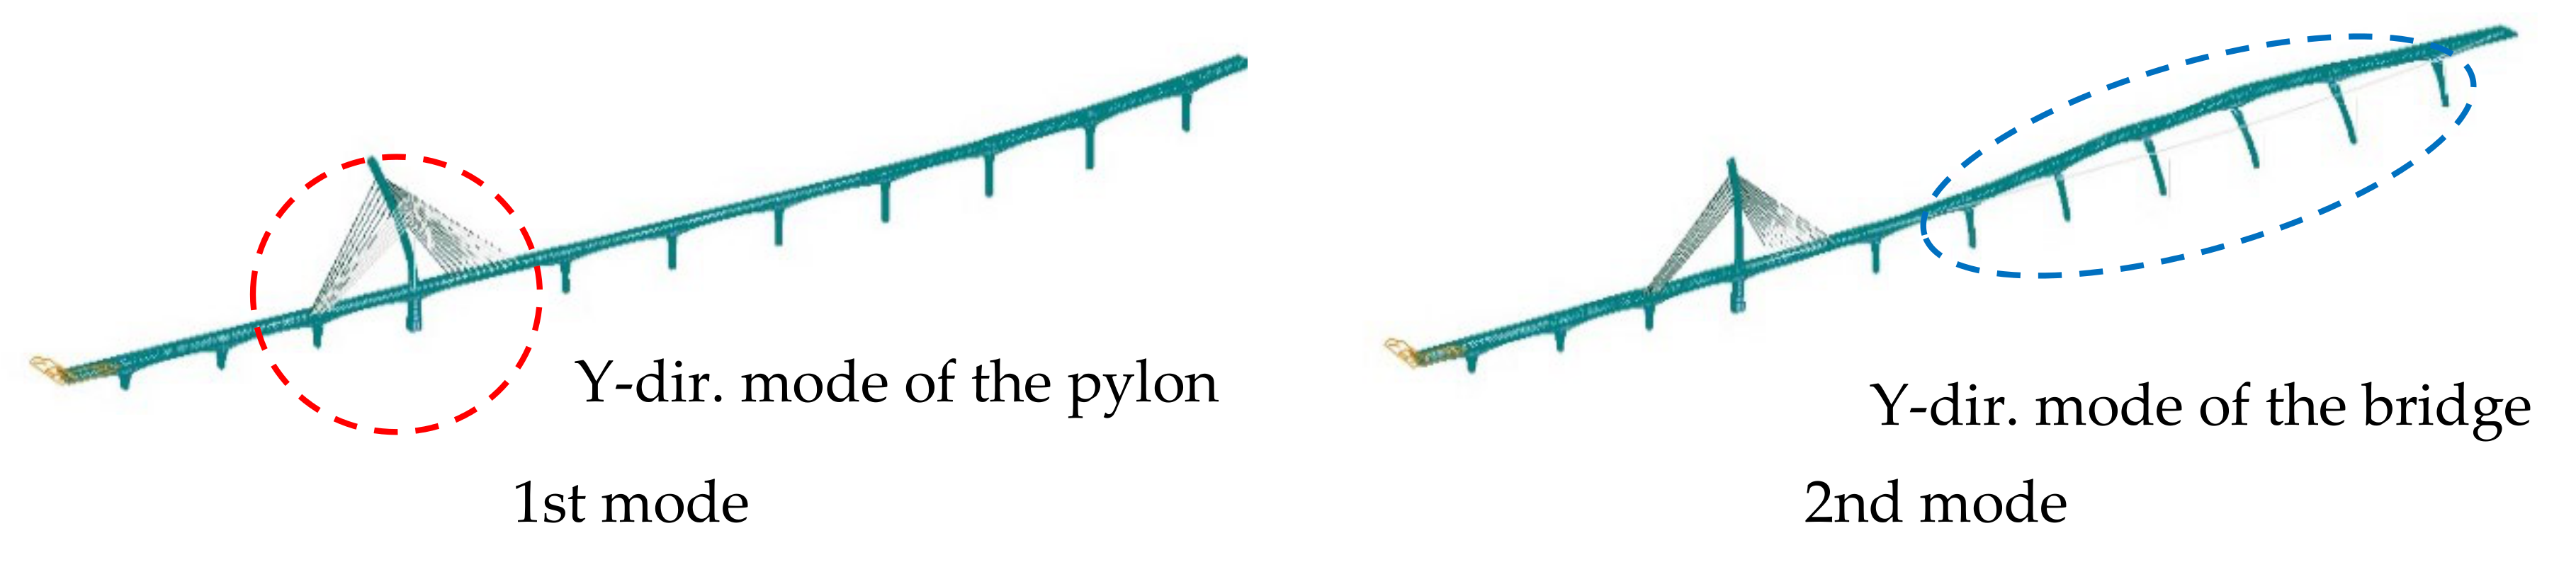
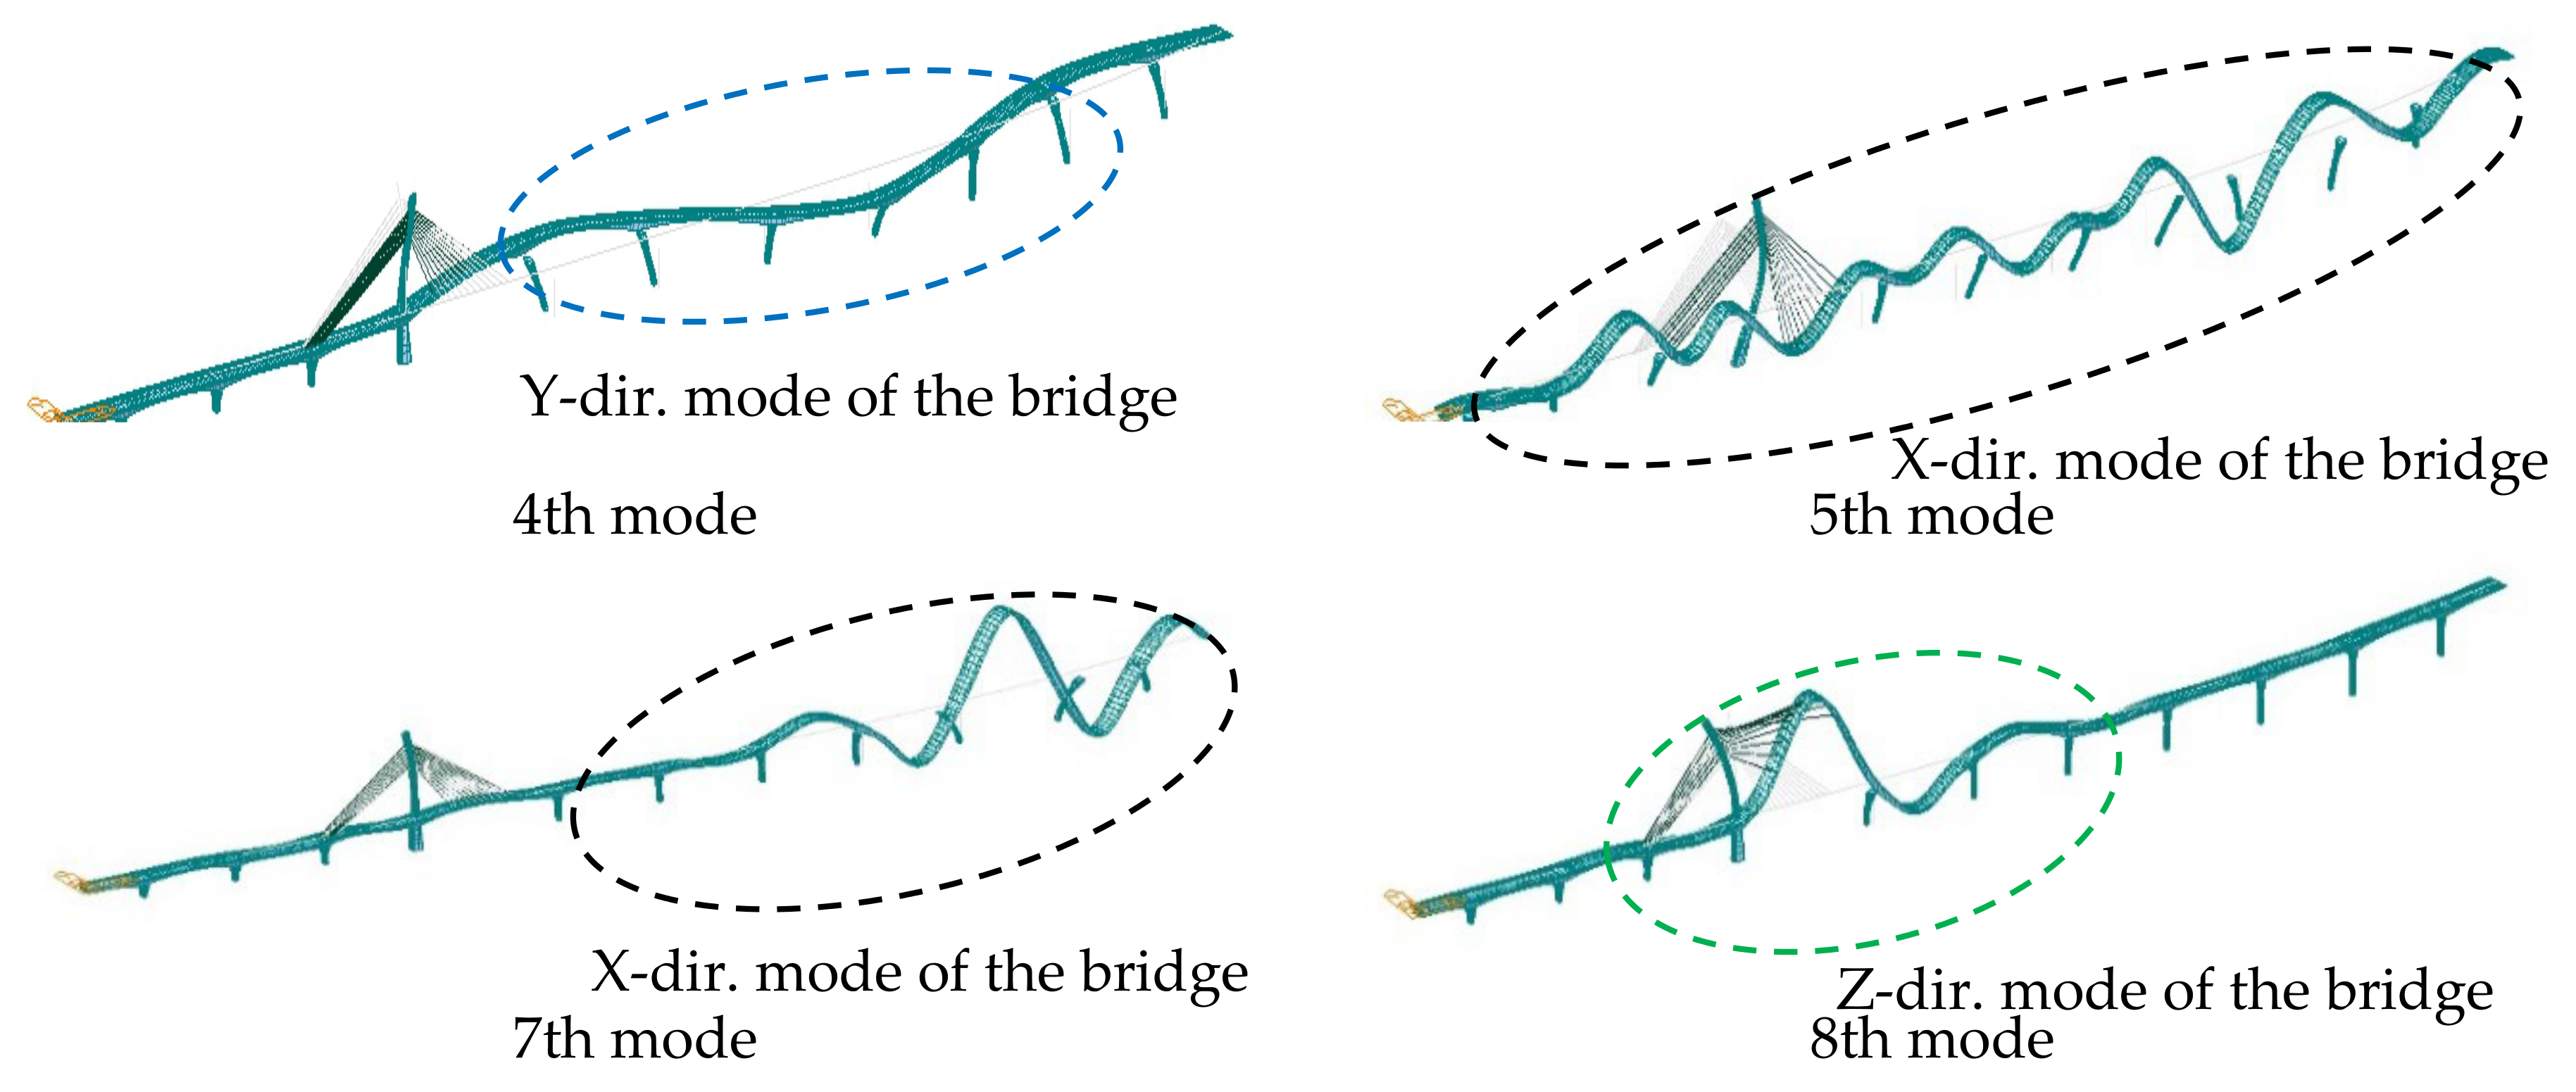
Figure 9.
Mode shape configurations using primary stiffness (Ku).
Figure 9.
Mode shape configurations using primary stiffness (Ku).
Figure 10.
Fibre model for a pylon and piers.
Figure 10.
Fibre model for a pylon and piers.
Figure 11.
Hysteric system of resilient friction isolator.
Figure 11.
Hysteric system of resilient friction isolator.
Figure 12.
Artificial earthquake generation. (a) Artificial earthquake in X-, Y- and Z-directions; (b) Earthquake spectrum generation.
Figure 12.
Artificial earthquake generation. (a) Artificial earthquake in X-, Y- and Z-directions; (b) Earthquake spectrum generation.
Figure 13.
Shear force results regarding analysis methods and performance levels. (a–d) Shear force results at corresponding pier positons.
Figure 13.
Shear force results regarding analysis methods and performance levels. (a–d) Shear force results at corresponding pier positons.
Figure 14.
R-FBI displacement results using a nonlinear time history analysis method regarding performance levels. (a,b) Displacement at corresponding piers’ positions.
Figure 14.
R-FBI displacement results using a nonlinear time history analysis method regarding performance levels. (a,b) Displacement at corresponding piers’ positions.
Figure 15.
Present seismic design procedure using a performance-based design method in Korean Highway Bridge Design Code (Limit State Design) for Cable Supported Bridges.
Figure 15.
Present seismic design procedure using a performance-based design method in Korean Highway Bridge Design Code (Limit State Design) for Cable Supported Bridges.
Figure 16.
Force-displacement hysteresis curve of R-FBI in P3 at PGA 0.154 g.
Figure 16.
Force-displacement hysteresis curve of R-FBI in P3 at PGA 0.154 g.
Figure 17.
Proposed performance-based seismic design method for cable-supported bridges using resilient friction base isolation systems.
Figure 17.
Proposed performance-based seismic design method for cable-supported bridges using resilient friction base isolation systems.
Table 1.
Testing bridge specifications.
Table 1.
Testing bridge specifications.
| Item | Description |
|---|
| Bridge type | Asymmetrically curved single-pylon concrete cable-stayed bridge |
Upper
girder | Type | Pre-stressed concrete box girder |
| Width | 24.3–31.5 m |
| Height | 3.5–7.0 m |
| Pylon | Total height | 106.5 m |
| Girder to top height | 78.0 m |
| Girder to bottom height | 28.5 m |
| Cable | Type | Parallel-wire-stand cables |
| Pylon settlement interval | 3.0–4.0 m |
| Girder settlement interval | 8.0 m (main span), 3.5 m (side span) |
Table 2.
Design parameters of resilient friction base isolators in testing bridge.
Table 2.
Design parameters of resilient friction base isolators in testing bridge.
| Type | Capacity
(kN) | Ku (kN/m) | Kd (kN/m) | Keff (kN/m) | Ratio
(Kd/Ku) |
|---|
| X dir. | Y dir. | X dir. | Y dir. | X dir. | Y dir. |
|---|
| OMEQS 1 | 7000 | 233,071 | 233,071 | 0 | 510 | 1850 | 2360 | 0.0022 |
| 15,000 | 459,846 | 459,846 | 0 | 1006 | 3650 | 4656 | 0.0022 |
| 30,000 | 1,165,357 | 1,165,357 | 0 | 2549 | 9250 | 11,799 | 0.0022 |
| 35,000 | 1,354,330 | 1,354,330 | 0 | 2963 | 10,750 | 13,713 | 0.0022 |
| 40,000 | 1,700,788 | 1,700,788 | 0 | 3720 | 13,500 | 17,220 | 0.0022 |
| EQS 2 | 25,000 | 913,388 | 913,388 | 1998 | 1998 | 9248 | 9248 | 0.0022 |
Table 3.
Natural periods of testing bridge.
Table 3.
Natural periods of testing bridge.
| Analysis Model | Natural Period (sec) |
|---|
| Pylon | Bridge |
|---|
| Y-dir. Mode | Y-dir. Mode | X-dir. Mode | Z-dir. Mode |
|---|
| 1st | 1st | 2nd | 1st | 2nd | 1st |
|---|
| Free vibration | 3.07 | 2.31 | 2.01 | 1.99 | 1.41 | 1.39 |
| Ambient vibration | 3.07 | 2.31 | 2.01 | - | - | 1.41 |
Table 4.
Mode shape result using effective stiffness (Keff).
Table 4.
Mode shape result using effective stiffness (Keff).
| Mode No. | Frequency | Natural Period | Accum. sum of Modal Participation Mass (%) |
|---|
| (cycles/sec) | (sec) | X-dir. | Y-dir. | Z-dir. | X-rot. |
|---|
| 1 | 0.258 | 3.876 | 0.23 | 42.91 | - | 7.80 |
| 2 | 0.288 | 3.470 | 0.30 | 43.97 | - | 8.81 |
| 3 | 0.314 | 3.180 | 0.33 | 49.70 | - | 22.12 |
| 4 | 0.329 | 3.042 | 0.94 | 52.50 | - | 22.23 |
| 5 | 0.360 | 2.781 | 0.98 | 77.41 | - | 27.35 |
| 6 | 0.414 | 2.415 | 74.68 | 77.45 | 0.14 | 27.54 |
Table 5.
Mode shape result using primary stiffness (Ku).
Table 5.
Mode shape result using primary stiffness (Ku).
Modal
Shape | Frequency | Natural Period | Accum. sum of Modal Participation Mass (%) |
|---|
| (cycles/sec) | (sec) | X-dir. | Y-dir. | Z-dir. | X-rot. |
|---|
| 1 | 0.315 | 3.176 | 0.00 | 3.63 | - | 12.64 |
| 2 | 0.339 | 2.948 | 0.28 | 42.72 | - | 19.35 |
| 3 | 0.395 | 2.534 | 0.28 | 46.62 | - | 20.23 |
| 4 | 0.471 | 2.123 | 0.59 | 55.70 | - | 20.43 |
| 5 | 0.537 | 1.863 | 81.66 | 55.72 | 0.14 | 20.46 |
| 6 | 0.591 | 1.692 | 81.95 | 55.72 | 0.14 | 21.55 |
| 7 | 0.639 | 1.565 | 85.36 | 55.72 | 0.15 | 21.59 |
| 8 | 0.683 | 1.464 | 86.04 | 55.72 | 3.24 | 21.98 |
Table 6.
Comparison of natural periods of computational and experimental results.
Table 6.
Comparison of natural periods of computational and experimental results.
| Analysis Model | Natural Period (sec) |
|---|
| Pylon | Bridge |
|---|
| Y-dir. Mode | Y-dir. Mode | X-dir. Mode | Z-dir. Mode |
|---|
| 1st | 1st | 2nd | 1st | 2nd | 1st |
|---|
| Computational analysis | Keff (effective stiffness) | 3.18 | 3.88 | 3.47 | 2.42 | 2.40 | 1.61 |
| Ku (primary stiffness) | 3.17 | 2.95 | 2.12 | 1.87 | 1.57 | 1.46 |
| K∞ (fixed end) | 3.17 | 2.95 | 2.11 | 1.84 | 1.55 | 1.46 |
| Experimental Result | Free vibration | 3.07 | 2.31 | 2.01 | 1.99 | 1.41 | 1.40 |
| Ambient vibration | 3.07 | 2.31 | 2.01 | - | - | 1.39 |
Table 7.
Non-linear analysis model of fibre members.
Table 7.
Non-linear analysis model of fibre members.
| Category | Pylon | Pier |
|---|
| Material type | Concrete | Steel | Concrete | Steel |
| Strength | 45 MPa | 400 MPa | 40 MPa | 400 MPa |
| Inelastic Model | Mander | Menegotto-Pintto | Mander | Menegotto-Pintto |
Table 8.
Comparison of cable tensional force for analysis.
Table 8.
Comparison of cable tensional force for analysis.
Cable
No. | Initial Equilibrium Force | Measured Tension Force | Difference of Force | Cable
No. | Initial Equilibrium Force | Measured Tension Force | Difference of Force |
|---|
| [kN] | [kN] | [%] | [kN] | [kN] | [%] |
|---|
| CL1 | 6855 | 6483 | 5.43 | CR1 | 5800 | 5210 | 10.17 |
| CL2 | 6880 | 6518 | 5.26 | CR2 | 6600 | 6231 | 5.59 |
| CL3 | 7925 | 7738 | 2.36 | CR3 | 7640 | 7409 | 3.02 |
| CL4 | 7890 | 7742 | 1.88 | CR4 | 7275 | 7098 | 2.43 |
| CL5 | 7595 | 7494 | 1.33 | CR5 | 9070 | 8762 | 3.40 |
| CL6 | 7635 | 7547 | 1.15 | CR6 | 9000 | 8766 | 2.60 |
| CL7 | 6925 | 6814 | 1.60 | CR7 | 9545 | 9332 | 2.23 |
| CL8 | 6905 | 6811 | 1.36 | CR8 | 9575 | 9332 | 2.54 |
| CL9 | 4350 | 4183 | 3.84 | CR9 | 7860 | 7588 | 3.46 |
| CL10 | 4285 | 4264 | 0.49 | CR10 | 7880 | 7687 | 2.45 |
| CL11 | 4345 | 4124 | 5.09 | CR11 | 6650 | 6508 | 2.14 |
| CL12 | 4165 | 4273 | 2.59 | - | - | - | - |
Table 9.
R-FBI shear force results using a nonlinear time history response method.
Table 9.
R-FBI shear force results using a nonlinear time history response method.
| Dir. | Performance
Level | Shear Force of R-FBI [kN] |
|---|
| P1 | P2 | P3 | P4 | P5 | P6 | P7 | P8 | P9 | P10 |
|---|
| X | 0.08 g | 925 | 925 | 731 | 1075 | 1075 | 1075 | 1070 | 1074 | 1075 | 1075 |
| 0.154 g | 925 | 925 | 738 | 1075 | 1075 | 1075 | 1075 | 1075 | 1075 | 1075 |
| 0.22 g | 925 | 925 | 753 | 1075 | 1075 | 1075 | 1075 | 1075 | 1075 | 1075 |
| Y | 0.08 g | 945 | 944 | 740 | 1085 | 1098 | 1020 | 816 | 1014 | 1007 | 1046 |
| 0.154 g | 998 | 1004 | 782 | 1145 | 1142 | 1129 | 1116 | 1134 | 1140 | 1125 |
| 0.22 g | 1042 | 1042 | 803 | 1221 | 1226 | 1217 | 1202 | 1202 | 1223 | 1189 |
© 2020 by the authors. Licensee MDPI, Basel, Switzerland. This article is an open access article distributed under the terms and conditions of the Creative Commons Attribution (CC BY) license (http://creativecommons.org/licenses/by/4.0/).


