

Abstract
Comprised of 17 named tropical storms, 6 of which were major hurricanes, the 2017 Atlantic hurricane season ranked as one of the most damaging and costly hurricane seasons on record. In addition to socio-economic impacts, many previous studies have shown that important coastal ecosystems like mangroves are shaped by severe storms. However, little is known about how the cumulative effects of storms over entire hurricane seasons affect mangroves across large regions. We used satellite imagery from the entire Caribbean and Gulf of Mexico region to show that 2017 resulted in disproportionate mangrove damage compared to baseline responses over the previous 8 years. Specifically, we observed 30 times more mangrove damage, via a reduction in the normalized difference vegetation index (NDVI), during 2017 compared to any of the eight previous hurricane seasons, and most (72%) of this damage persisted throughout the 7 month post-hurricane season period as indicated by no NDVI recovery. Furthermore, wind speed, rainfall, and canopy height data showed that mangrove damage primarily resulted from high maximum wind speeds, but flooding (cumulative rainfall), previous storm history, and mangrove structure (canopy height) were also important predictors of damage. While mangroves are known to be resilient to hurricane impacts, our results suggest that increasingly frequent mega-hurricane seasons in the Caribbean region will dramatically alter mangrove disturbance dynamics.
Export citation and abstract BibTeX RIS

Original content from this work may be used under the terms of the Creative Commons Attribution 4.0 license. Any further distribution of this work must maintain attribution to the author(s) and the title of the work, journal citation and DOI.
1. Introduction
Tropical cyclones cause tremendous damage to both human and natural communities each year across the globe. The costs associated with these damages have increased dramatically as severe storms become more frequent and coastal populations increase, leading to added pressure on coastal resources and resiliency [1–5]. Most recently, the 2017 mega hurricane season in the Atlantic was one of the most destructive and costly tropical cyclone seasons on record, with costs exceeding $350 billion [6]. Such catastrophic tropical cyclone seasons are likely to become more frequent with increasing sea surface temperature, increased ocean heat content below the ocean surface, and slower summertime atmospheric circulation in the tropics, all of which are related to anthropogenic climate change [7–10]. Moreover, climate change has contributed to rising sea levels, which results in greater shoreline erosion rates, more severe coastal flooding, and higher inland reach of storm-surges [11].
In addition to causing economic and societal damage, cyclone-driven winds, storm surges, and heavy rain also have lasting impacts through altered ecosystem services [12, 13]. Most notably, mangrove forests are well-known for their protective role against coastal erosion through land stabilization, sediment accretion, and dissipation of storm surge, in addition to their role in carbon sequestration, maintenance of biodiversity, and water pollution reduction [12, 14–16]. Previous studies demonstrate the ability of mangroves to attenuate wave action, minimize the extent of storm-induced flooding, and even prevent loss of human lives [15, 17–19]. Despite these valuable ecosystem services, mangroves are suffering from higher rates of loss than other imperiled systems like rainforests and coral reefs [20]. As such, conserving mangroves as 'green infrastructure' has recently become an important strategy for coastal risk reduction and increasing resilience as the global climate continues to change.
While mangroves offer protection from storms, they also incur damage. Specifically, damage may result from several factors including strong winds, flooding, and sediment deposited by storm surge [21–25]. In addition to these storm characteristics, the extent and severity of damage has been shown to depend on mangrove type, canopy height, and landscape context [21, 26, 27]. These important relationships between tropical cyclones and mangroves were illustrated by a recent study that showed tropical cyclones were one of the most important global drivers of mangrove extent and canopy structure [28]. Though these effects of tropical cyclones on mangroves are well documented, the long-term implications of changing tropical cyclone frequency and severity are uncertain. For example, we are not aware of any studies that have investigated the cumulative impacts of all storms among several hurricane seasons across an entire affected region.
Given the intensifying trend of tropical cyclones in the Caribbean (hereafter: hurricanes; 7), we aimed to quantify the effects on mangroves from mega hurricane seasons, such as that observed in 2017. We analyzed satellite imagery to estimate hurricane induced mangrove damage annually from 2009 to 2017, as well as recovery during a 7 month post-hurricane period for each of these years. To better understand the causes of 2017 damage, we then examined the relative contributions of several factors known to be related to mangrove damage in 2017, including maximum wind speed, cumulative duration of strong winds, previous storm history, precipitation, and mangrove canopy height [21, 28–31]. Through these analyses we aimed to (1) determine the degree to which increased hurricane activity across an entire season translates to increased mangrove damage and (2) quantify how wind, rainfall, and mangrove structure drive mangrove damage and mortality across an entire region. Our results help to better understand the implications of increased storm activity for mangroves, and for hurricane vulnerability and resilience more broadly, as mega hurricane seasons become increasingly common.
2. Materials and methods
2.1. Study area
We aimed to investigate the effects of storms on mangroves across the North Atlantic Basin. As such, we included in our analyses the coast of the Gulf of Mexico, the islands of the Caribbean, as well as the Caribbean coasts of Central and South America and hereafter, we refer to this region as the Caribbean/Mesoamerican Region. To formally delineate this region, we limited the extent of our analyses to the rectangle defined by 6.11° to 31.86° latitude and −99.33° to −55.88° longitude.
2.2. Mangrove damage
We quantified annual mangrove damage and mortality (2009–2017) using the NDVI greenness index derived from two satellite instruments: Landsat 7 Enhanced Thematic Mapper+ and Landsat 8 Operational Land Imager using Google Earth Engine following a modified approach from Lagomasino et al [32]. We calculated the response of mangroves to a given hurricane season by first calculating a pre-hurricane season reference NDVI value for each pixel as a median from the end of the previous hurricane season (November 1) to the beginning of the given hurricane season (June 1). We then calculated the average departure from the reference value (hereafter referred to as ΔNDVI) from all cloud-free images during the 7 month post-hurricane period (November 1 of given year to June 1 of the next year; SI appendix (stacks.iop.org/ERL/15/064010/mmedia)). We used a high-resolution (1 ha) map of global mangrove extent in 2010 to extract the ΔNDVI within mangroves only [33]. According to this map, there were 2.26 million ha of mangroves within our study region. Based on a previous investigation of mangrove response to hurricanes [25], we considered pixels with a ΔNDVI < −0.2 to represent mangrove damage [34]. In 2017 only, we also calculated mangrove damage as described below from imaging instruments aboard two additional satellites, MODIS Terra and Sentinel 2, to investigate bias resulting from differences in spatial resolution and optical qualities of the instruments (SI appendix). We further confirmed these ΔNDVI responses reflected actual vegetation change in 2017 by comparing to changes in canopy height within a subset of the larger study area. The canopy height data were derived from high resolution LiDAR (∼1 m) measured with NASA Goddard's LiDAR, Hyperspectral and Thermal Imager (G-LiHT) both before and after the 2017 hurricane season in mangroves in South Florida (figure S2 and SI appendix). The linear relationship between ΔNDVI and canopy height was significant (p < 0.01) and the largest changes in canopy height (2–5 m decreases) occurred at sites with ΔNDVI < −0.2 (figure S2).
In order to distinguish between minor damage, such as defoliation, and more severe, persistent structural damage, we quantified recovery over the 7 month period between the end of the hurricane season and the beginning of the subsequent hurricane season, for each of 2009–2017. Specifically, we calculated the linear slope of NDVI values at a given pixel from all cloud-free images during the post-hurricane season and considered the pixel to represent persistent damage if this NDVI trend was close to or less than zero (slope < .000001, figure 1).

Figure 1. The NDVI calculated for each cloud-free image (black dots) at a pixel representative of undamaged mangroves (top), damaged but recovering within the 7 months post-hurricane (middle), and damaged without recovery (bottom) during the 2017 Atlantic hurricane season (gray bar) in the Caribbean/Mesoamerican region. The linear time-series trend is shown as orange and green for the pre-hurricane and post-hurricane periods, respectively, along with 95% confidence intervals.
Download figure:
Standard image High-resolution image2.3. Wind
To categorize mangrove damage in each year according to storm intensity, we combined the 'best track wind swath' for all storms in each year from 2009 to 2017 [35]. These data consist of three polygons for each storm delineating the area which experienced a storm intensity at or above each of three wind speed categories: (1) 63 km h−1, (2) 93 km h−1, and (3) 119 km h−1. Within a given year, we overlaid the polygons for all storms to delineate the total area within our study region to experience winds of at least 63 km h−1 (Tropical Depression on Saffir-Simpson Scale) and 119 km h−1 (Category 1 on Saffir-Simpson Scale).
For a more detailed analysis of the relationship between storm intensity and mangrove damage and loss in only the year 2017, we used a higher spatial resolution dataset developed by NASA's Global Modelling and Assimilation Office (see SI appendix for more detailed description of data). These data consisted of 10 m surface wind speeds calculated at every hour for the duration of the 2017 hurricane season at a spatial resolution of 7 km. From this dataset we calculated the maximum wind speed experienced at each cell and the duration, in hours, for which a cell experienced winds at or greater than 119 km h−1 (i.e. hurricane force or stronger according to Saffir-Simpson Scale).
2.4. Other predictors of mangrove damage and loss
We investigated several additional variables other than storm intensity that might explain the spatial variation in mangrove damage and loss that we observed in 2017. We incorporated canopy height using the global mangrove canopy height dataset developed by Simard et al [28]. Though some variation in canopy height is likely explained by previous storm activity, we also included the number of storms experienced since 2009 (hereafter: 'storm history') at a given pixel to potentially explain any additional variation in mangrove damage related to previous storms. To serve as a metric of storm-related flooding, we included the cumulative rainfall for the month of September, as this was the month during which the most severe storm activity occurred [36].
2.5. 2017 mangrove damage regression modelling
We used logistic regression to investigate which factors were most strongly related to mangrove damage associated with the 2017 hurricane season. Specifically, we extracted the values of NDVI change and the five predictors that we identified as having potential to influence the degree of mangrove damage (maximum wind speed, duration of hurricane force or stronger winds, rainfall, number of storms experience since 2009, and canopy height) at 8576 random pixels within extant mangroves, distributed evenly between damaged and undamaged mangroves (SI appendix). We used half of these data to fit or model and the other half to compare for validating our model. We used the area under the receiver operating characteristic curve (AUC) to evaluate the predictive performance of our model and compared the strength of covariate effects using the magnitude of the parameter estimates and 95% confidence intervals.
3. Results
After combining storm-specific wind swath data from the National Hurricane Center, we show that storm activity, defined as the number, severity, and affected land area, in the Caribbean region varied considerably between 2009 and 2017 (table 1). Though the greatest number of total storms during our study occurred during the 2011 and 2012 seasons (20 and 19, respectively), the greatest number of hurricanes (maximum sustained winds greater than 119 km h−1) occurred during 2010 and 2017 (9 and 10, respectively; table 1). The least active hurricane season was 2009 when there were five total storms, only two of which strengthened into hurricanes. This variation in storm activity corresponded to similar variation in the amount of land within our study area affected by storms. During each of 2010, 2011, 2012, 2016, and 2017, over 32 million ha of land in the region (>10%) was affected by either a tropical storm or hurricane, whereas in 2009, 2013, 2014, and 2015, less than 13.8 million ha (<5%) were affected (figure 2(A)). During the 2017 hurricane season, approximately 88 million ha (∼30%) of land were affected by tropical storms or hurricanes, over 1 million of which were mapped as mangrove forests (figure 2(B)). Considering a broader time frame, more mangroves were estimated to be affected by storms in 2017 than any other year since at least 1980 (figure S1).

Figure 2. The areal extent of land affected by hurricanes (red) and tropical storms (black) across the Caribbean/Mesoamerican region (A) and within extant mangroves (B), as well as the extent of mangrove damage (C) and persistent damage (D) according to Landsat-based NDVI annually between 2009 and 2017.
Download figure:
Standard image High-resolution imageTable 1. Annual number of tropical storms and hurricanes (maximum wind speed >119 km h−1) in the western Atlantic Ocean and the amount of land area affected in the Caribbean/Mesoamerican Basin.
| Year | Total storms | Hurricanes | Affected land area (ha) |
|---|---|---|---|
| 2009 | 5 | 2 | 7 909 676 |
| 2010 | 13 | 9 | 45 412 729 |
| 2011 | 20 | 5 | 32 654 849 |
| 2012 | 19 | 8 | 65 715 473 |
| 2013 | 15 | 2 | 13 873 143 |
| 2014 | 9 | 4 | 4 512 007 |
| 2015 | 8 | 4 | 5 813 535 |
| 2016 | 10 | 5 | 44 438 907 |
| 2017 | 17 | 10 | 88 406 089 |
This larger extent of land, and specifically mangroves, affected by hurricanes in 2017 resulted in widespread mangrove damage. The total extent of damaged mangroves varied from 86 439 ha according to Landsat imagery, to as much as 133 662 ha according to Sentinel II (table S2), and according to the coarser spatial resolution MODIS imagery, 111 558 ha of mangroves were damaged. Averaged across sensors, more than 4% of all Caribbean and Mesoamerican mangroves were damaged; however, some of this mangrove damage occurred outside areas affected by storms (table S2, figure 2(C)). Specifically, we observed approximately 20 000 ha of mangrove damage associated with non-storm related drivers, annually.
Considering only mangrove damage in areas affected by hurricanes, we observed over 30 times more damage in 2017 than any of the previous 8 years (figure 2(C)). Much of this damage occurred in the extensive mangroves of South Florida and Cuba (table S2, figure 3). Though Barbuda and Guadeloupe experienced severe hurricanes (Irma and Maria, respectively), the mangrove damage incurred was less extensive in these countries, particularly on Guadeloupe (figure 3). Similar trends were observed for persistent damage, defined as no recovery in the post-hurricane NDVI (see section 2) with a surprisingly high 72% of the hurricane-damaged mangroves in 2017 (79 000 ha) not recovering or in various stages of mortality (57 600 ha; figure 2(D)). This disproportionate amount of mangrove damage is reflected by a non-linear relationship with the area of mangroves affected by hurricanes (figure 2(C)).
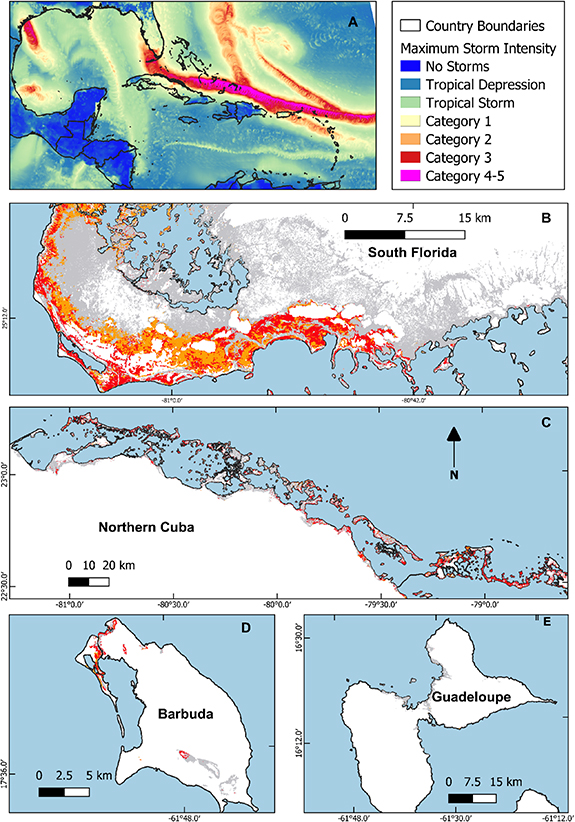
Figure 3. Mangrove damage (orange) and persistent damage (red) caused by the 2017 hurricane season at 4 regions that endured major hurricanes: South Florida (B), Northern Cuba (C), Barbuda (D), and Guadaloupe, with undamaged mangroves shown in gray. The maximum wind speed observed during the hurricane season (A) was the strongest predictor of whether or not a stand of mangroves incurred damage.
Download figure:
Standard image High-resolution imageA similar non-linear relationship was observed when we investigated the role of specific storm and mangrove characteristics in predicting mangrove damage during the 2017 hurricane season. Specifically, mangroves that experienced maximum winds under 100 km h−1 were unlikely to incur damage, regardless of canopy height, but the probability of mangrove damage increased dramatically between maximum wind speeds of 100 km h−1 to 150 km h−1 regardless of mangrove canopy height (figure 4). Maximum wind speed was the strongest predictor of mangrove damage with an effect magnitude several time greater than any of the other effects (table 2). The next most important predictor was storm history, where sites that had experienced one or two storms in the preceding 8 years were markedly less likely to incur damage (table 2). The effect of high storm history (three or more storms in previous 8 years) was not significant; however, there were few sites that experienced three or more storms previously, which was reflected by the large uncertainty around the effect of this variable (table 2). Mangrove canopy height and cumulative precipitation were also significant, and both were positively related to the probability of mangrove damage (table 2). We did not observe strong evidence for an important role of a given storm's residence time, measured as the duration of tropical storm force winds or stronger (table 2). Overall, the predictive ability of this logistic regression model of mangrove damage was high (mean AUC = 0.92, range = 0.91–0.93).

Figure 4. The probability of NDVI in Caribbean/Mesoamerican mangroves decreasing by at least 0.2 (metric of mangrove damage) as a function of maximum wind speed during the 2017 hurricane season and canopy height. Canopy height categories correspond to the observed mean (red), 1 standard deviation below the mean (green), and 1 standard deviation above the mean (blue).
Download figure:
Standard image High-resolution image
Table 2. The parameter estimates and 95% confidence intervals averaged across 1000 model runs for covariates related to mangrove damage using logistic regression.
| Estimate | 95% CI | |
|---|---|---|
| Intercept | −1.65 | −1.1, −2.22 |
| Max wind | 1.91 | 2.24, 1.59 |
| Max wind2 | 0.02 | 0.22, −0.18 |
| Rain | 0.39 | 0.48, 0.29 |
| StormHist1a | −0.88 | −0.25, −1.49 |
| StormHist2b | −0.35 | 0.29, −0.97 |
| Canopy height | 0.35 | 0.51, 0.19 |
| Wind duration | 0.12 | 0.33, −0.09 |
a Indicator variable for sites experiencing 1 or 2 tropical storms or hurricanes between 2009 and 2017 b Indicator variable for sites experiencing greater than 2 tropical storms or hurricanes between 2009 and 2017
4. Discussion
4.1. More hurricanes equal more mangrove damage
As increasingly severe storms become more frequent, our results show a disproportionate amount of mangrove damage will result soon after. Furthermore, considering simply the number and severity of storms in a season may poorly reflect the resulting mangrove damage. Instead, our results suggest that mangrove damage is at least partially stochastic and depends on the extent and spatial distribution of areas affected by severe storms. For example, mangrove damage in 2017 could have been much lower if Hurricane Irma did not track directly over the extensive mangroves of South Florida. Regardless, if severe storms become more frequent, the likelihood that extensive mangroves are impacted also increases.
The exponentially greater mangrove damage we observed in 2017 compared to other hurricane seasons also may result from the threshold response of mangrove damage to maximum wind speed. Our results confirm previous studies that show wind speed was the most important characteristic of hurricane to explaining mangrove damage. Imbert (2018) showed that decreases in mangrove basal area were greatest in tall basin mangrove stands that experienced storms of Category 1 (110–150 km h−1) severity or greater, whereas the threshold of basal area loss for shorter fringe and scrub mangroves was Category 3 (178–209 km h−1). Though we did observe an effect of canopy height, the variation in the threshold of mangrove damage was not as pronounced as that observed by Imbert [21]. This less pronounced effect could result from the difference in how damage was defined (basal area vs. NDVI), or from the consideration of variation by mangrove species. Nonetheless, our results provide further evidence for nonlinear increases in mangrove damage as Category 1 and stronger storms become more frequent.
4.2. Predictors of mangrove damage other than wind
The significant effect of cumulative rainfall is of particular importance as storms characterized by moderate wind speed but extreme rainfall become more common [8, 37]. Extreme precipitation rates may lead to more extensive flooding and deposition of water-transported sediments, which can limit soil oxygen availability, induce stomatal closure, and limit photosynthesis in mangroves, ultimately leading to mortality [38, 39]. These prolonged inundation events resulting from extreme precipitation may be further exacerbated as global sea level rises. In addition, storm surge can physically damage trees and exacerbate sediment deposition, causing delayed mortality [40]. However, the hydrological characteristics of tropical storms, including precipitation, storm surge, and changes in salinity, are challenging to quantify on large regional scales. Further study is needed to better understand how these hydrological drivers contribute to the effects on mangroves from tropical storms. Regardless, our results support redefining storm intensity to include characteristics other than just maximum wind speed, namely cumulative precipitation and storm surge.
4.3. Implications for ecological resilience
Building on previous studies that have documented the effects of hurricanes on mangroves, our results reveal scale of these effects during a mega hurricane season; an example of what can be expected in the future as the global climate warms. Previous studies have shown many mangroves have been experiencing severe storms for centuries and are resilient to these disturbances, sometimes recovering in as few as 5 years [41]. However, recovery rates may depend on several factors including the nature and severity of the disturbance, mangrove stand characteristics, as well as interaction with other environmental factors [15, 42]. Given the vast majority of the mangrove damage we observed in 2017 was severe structural damage that persisted through the start of the 2018 hurricane season, recovery may be slow. The increased frequency of mega hurricane seasons has potential to compromise mangrove resilience and the associated ecosystem services mangroves provide. Specifically, an increasing number of mangrove stands will be in recovery stage, and although our results suggest these younger, shorter mangroves are more resistant to future damage, they may also provide different ecosystem services than mature mangroves [15, 29]. Furthermore, these changing disturbance dynamics could then interact with other global change processes, such as rising sea level, increased erosion, and altered nutrient cycling, to further degrade mangroves across large spatial scales [31, 43]. Future research should aim to quantify how ecosystems services are altered in mangrove stands regenerating in the wake of damaging hurricanes and to better understand factors affecting mangrove recovery trajectory. Decreased coastal protection and increased vulnerability of coastal communities in this tourism-dependent region will have yet unforeseen consequences [44].
4.4. Importance of high-resolution data across large extents
Our analysis of satellite imagery using cloud-based computing proved essential to investigating temporal trends in hurricane-mangrove dynamics where large-scale field study is often precluded by remote and challenging field conditions [45]. The spatial distribution of mangroves are such that coarse resolution imagery may fail to capture vegetation dynamics in these systems [39] and multi-temporal analyses at fine scales (10 and 30 m) would have been computationally impractical without cloud computing resources, such as Google Earth Engine. Granted, spectral metrics such as NDVI may be biased by environmental changes independent of vegetation, such as surface water; however, our ex-ante and ex-post calculations of NDVI help to address these issues by incorporating 7 months of imagery in each composite image (SI appendix). Alternatively, decreases in NDVI may simply reflect defoliation and thus may not truly reflect changes in vegetation structure [46, 47], but our observation that 73% of damaged mangroves did not recover in the post-hurricane period illustrates that most of this damage was lasting. Moreover, the strong relationship we observed between NDVI and mangrove canopy height change provide further evidence that much of the damaged we observed was indeed structural (figure S2). These results are consistent with another recent study showed that structural damage from Hurricane Maria (2017) in Puerto Rican forests was greater than that observed following previous severe hurricanes [13]. Thus, leveraging contemporary remote sensing data and analysis tools can provide accurate measures of vegetation dynamics at fine scales and across large extents.
Similarly, the spatially explicit GMAO wind data allowed us to rigorously relate mangrove responses to wind across a large region. Though local analyses may incorporate measured wind speeds [48], such data are not available on a regional scale. Instead, regional analyses typically involve modelled wind speeds, for example by assuming wind speed varies as a function of overall storm intensity and the distance from the storm center [21, 49]. Alternatively, wind swaths such as those archived at the National Hurricane Center, provide wind speeds categorized according to coarse intervals, e.g. >119 km h−1. In contrast to these data, the GMAO wind data provided accurate wind speeds that varied across space and time, allowing us to quantify the role of wind speed in predicting mangrove damage across a large region.
4.5. Future hurricane seasons as climate changes
Though future projections of tropical cyclone activity are uncertain, studies consistently indicate that anthropogenic climate change will result in a global intensification of storms [4, 50]. Widespread hurricane-induced mangrove damage, such as that observed during the 2017 hurricane season, will likely result from this increased frequency of severe storms. These results are particularly important for the Caribbean/Mesoamerica region which is forecast to incur more damage than any other region from future hurricanes when considered as a proportion of gross domestic product [1]. Thus, the value of mangroves as buffers against future storms will become increasingly important to this region and across the tropics, and our results will aid in prioritizing conservation and restoration efforts.
Acknowledgments
This research was conducted under the Caribbean SWAMP project at the Center of International Forestry Research, generously funded by the USAID. BP, DL, and LF were supported by NASA's Terrestrial Ecology Program through the NASA Carbon Monitoring System Program (16-CMS16-0073), NASA's Rapid Response and Novel Ecosystem Studies Program (17-RRNES-0008), NASA's New Investigator Program (15-NIP15-0068) and the Interagency Climate Change NASA program 2017-67003-26482/project accession no. 1012260 from the USDA National Institute of Food and Agriculture. We thank Dr. Kevin Trenberth for suggestions on precipitation data and providing feedback on earlier versions of the manuscript.
Data availability
All satellite imagery is publicly available and code has been included in the supplemental material to described how to access and process these data via Google Earth Engine. Storm tracks from the National Hurricane Center, precipitation data, G-LiHT LiDAR data are all publicly available with specific links included in the supplemental material. Our results for mangrove damage across the study area will be archived at the Pangea data repository (doi:10.1594/PANGAEA.911864), along with GMAO wind data.