Electromagnetic and Thermal Phenomena Modeling of Electrical Discharges in Liquids

1
Faculty of Electrical Engineering, Warsaw University of Technology, 00-661 Warsaw, Poland
2
Faculty of Production and Energy Engineering, Cracow, University of Agriculture in Krakow, 30-149 Krakow, Poland
*
Author to whom correspondence should be addressed.
Appl. Sci. 2020, 10(11), 3900; https://doi.org/10.3390/app10113900
Submission received: 4 May 2020
/
Revised: 26 May 2020
/
Accepted: 2 June 2020
/
Published: 4 June 2020
Abstract
:Electrical discharges in liquids have received lots of attention with respect to their potential applications in various techniques and technical processes. Exemplary, they are useful for water treatment, chemical and thermal processes acceleration, or nanoparticles production. In this paper the special utility of discharges for cold pasteurization of fruit juices is presented. Development of devices for its implementation is a significant engineering problem and should be performed using modeling and simulation techniques to determine the real parameters of discharges. Unfortunately, there is a lack of clear and uniform description of breakdown phenomena in liquids. To overcome this limitation, new methods and algorithms for streamers propagation and breakdown phase analysis are presented in the paper. All solutions were tested in “active area” in the form of liquid material model, placed between two flat electrodes. Electromagnetic and thermal-coupled field analysis were performed to determine all the factors that affect the discharge propagation. Additionally, some circuit models were used to include the power source cooperation with discharge region. In general, presented solutions can be defined as universal and one can use them for numerical simulation of other types of discharges.
1. Introduction
Electrical discharges generated in liquids have many potential advantages and can be used in some low-temperature plasma techniques. Most popular utilities of such a devices are connected with water treatment [1,2], sterilization, and pasteurization of liquid foods [1,3,4] and surface treatment [1,5]. Basic benefits of HVED (high voltage electrical discharges) technique are reduced process time and temperature, minimal degradation of thermosensitive compounds, and minimization of energy consumption in comparison to classic treatment methods [4,6]. A very promising utility of HVED in agri-food industry is microbial inactivation as a result of discharges in liquid media [7,8]. The exact mechanism of the influence of the electric discharges on the inactivation of microorganisms has not yet been fully described [4,9]. Nevertheless, it can be concluded, that there are some important factors leading to a reduction in the number of microbials. These factors include production of ozone, hydrogen peroxide, hydroxyl and superoxide free radicals [4,9]. Additionally, UV radiation generated in the discharge, mechanical stresses, and waves can help reducing some microbials [9,10]. Electric breakdown process results from liquid sample ionization under high voltage applied between electrodes. Generation of the discharge process can be divided into three phases: the pulse initiation, pre-breakdown phase (streamers), and breakdown stage (arc formation) [11,12].
The characteristics of the shape of the electric discharge and the discharge propagation of processed liquid are not recognized in a satisfactory manner. Because of the varied physical parameters of liquids (juices in cases analyzed by authors), it is not possible to use universal devices and programs to implement this technology. Additionally, discharge duration, shape, and other parameters depend on electrodes system geometry and electrical parameters of power source [10]. The development of HVED technique is possible through the usage of modeling methods, facilitating the selection of discharge parameters to a specific demand. There are currently no models that allow precise description of the development of the discharge in liquid environments [13]. Main aim of the work is developing numerical models and procedures to compute pulse discharges in liquids. Mentioned task requires to account models of streamers propagation, electrical breakdown (arc) stage, and models for thermal energy propagation in the time between next discharges. Authors’ calculation procedures that use field and circuit models are described in the paper. Despite of some simplifications, presented models and procedures enable to effective modeling of electrical discharges distributions in liquids.
2. Discharge Models in Liquids
When a high voltage of appropriate value is applied to an electrode system filled with dielectric material, filamentary discharges called “streamers” appear at the first stage of breakdown in gases, liquids, and solids. Environmental conditions of the discharges determine the streamers structures including their shape, speed of propagation, current values, electric field intensity at the streamer’s head, plasma channel radius, and degree of ionization [14]. According to the large number of factors that have influence on electric breakdown process, uniform theory for the development of discharges in liquids cannot be presented. The discharge process depends on the type and purity of the liquid material, electrostatic pressure, viscosity, conductivity, thermal conductivity, and dielectric permittivity [14,15,16]. Therefore, a large number of theories have been proposed [12,14,16]. Discharges in liquids are similar, under certain conditions, to discharge process in gas [16]. In gaseous environments most important factor for discharge process is impact ionization that depend on kinetic energy of electrons in the discharge area [17,18]. In most cases it has been assumed that the discharges can be initiated by the absorption of radiation quantum [19]. These assumptions are generally acceptable for gaseous environments [14,19]. In liquids, however, such correlations cannot be found so far, because of the difficult performance of studies of the mentioned effects [20]. Therefore, the proposed descriptions are burdened with greater uncertainty. The most popular descriptions of discharges development, important from their applicability point of view, are presented below.
2.1. Direct Impact Ionization
Description of the pre-breakdown (streamer) phenomenon in liquids, resulting from direct impact ionization, is similar to the electrical breakdown process in gases [13,14]. Nevertheless, because of the higher liquid densities, electrons free paths are significantly shorter, which also affects the increased electron beam scattering [16]. Acceleration of free electrons to reach required ionization energy in a short time and free paths is difficult in such conditions and few requirements must be fulfilled. The most important is to provide appropriate voltage rise rate on the electrodes. It allows rapid acceleration of free electrons. As shown, among others, in [14,16], this process requires extremely high intensities of the electric field at the level of 220 MV/cm. Pulse rise time should be maintained at picoseconds level [20,21]. The second possibility of impact ionization is to create areas characterized by reduced mass density. In such areas (gas bubbles), electrons free paths between next collisions are longer. In addition, in the areas of lower density, the electrical breakdown voltages are reduced [6,14,16].
2.1.1. Theory of Gas Bubbles
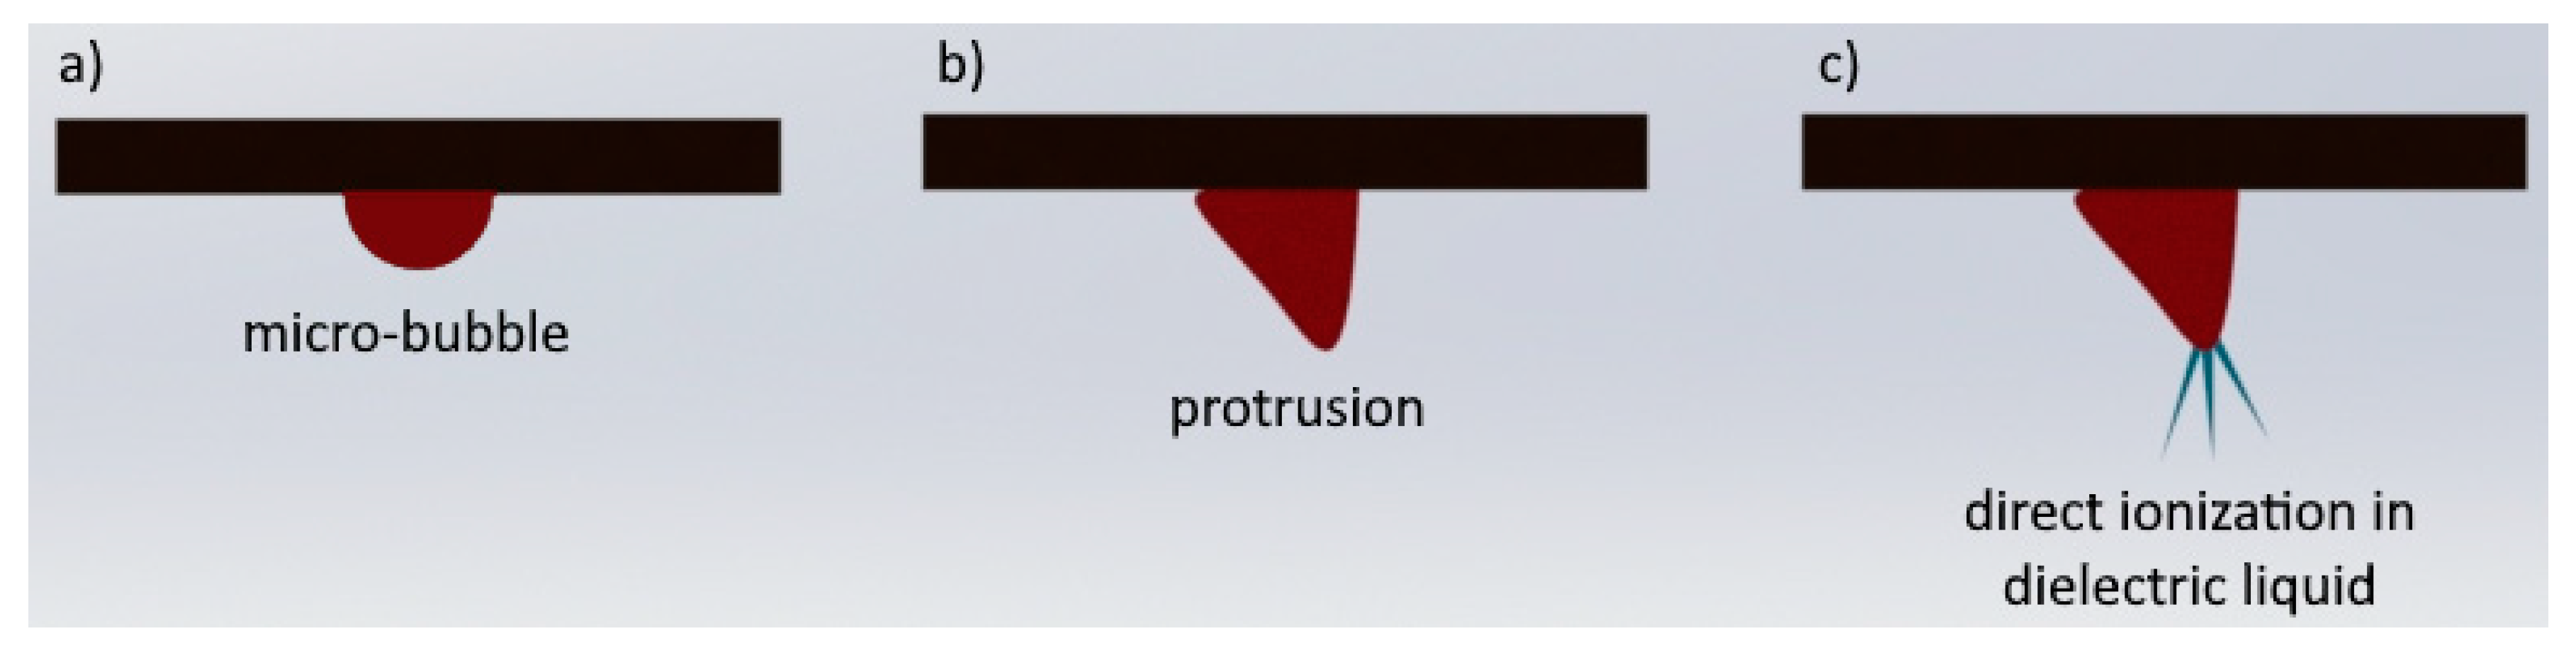
Numerous studies [22,23,24,25] have shown that the liquid phase may be unstable during the impulse discharges. Plasma channels are formed along the electric field gradients [6,16]. Such channels, because of their lower density and different dielectric permittivity, allow easier development of discharges (especially local discharges) leading to the electrical breakdown inside the liquid [16,26]. Models that use gas bubbles theory usually assume the presence of micro-bubbles in non-gaseous media or the self-ignition of gas bubbles. The generation of gas bubbles in liquids may result from local overheating of the medium because of Joule effect in areas characterized by high intensity of electric field (near electrodes), electrostatic expansion of micro-bubbles occurring in liquid or chemical processes [20,27,28]. The process of gas bubble development has been schematically shown in Figure 1. However, in fast discharges (aprox.10 ns), characterized by fast pulses rise times (approx. 150 ps), gas bubbles are not observed. As it was mentioned in [26], gas bubbles can exist in such conditions, but their dimensions are lower than the visible size. It has been generally accepted that the theory of gas bubbles can be used to describe discharges with significant durations, larger than microseconds [16].
2.2.2. Electric Field Dependent Molecular Ionization
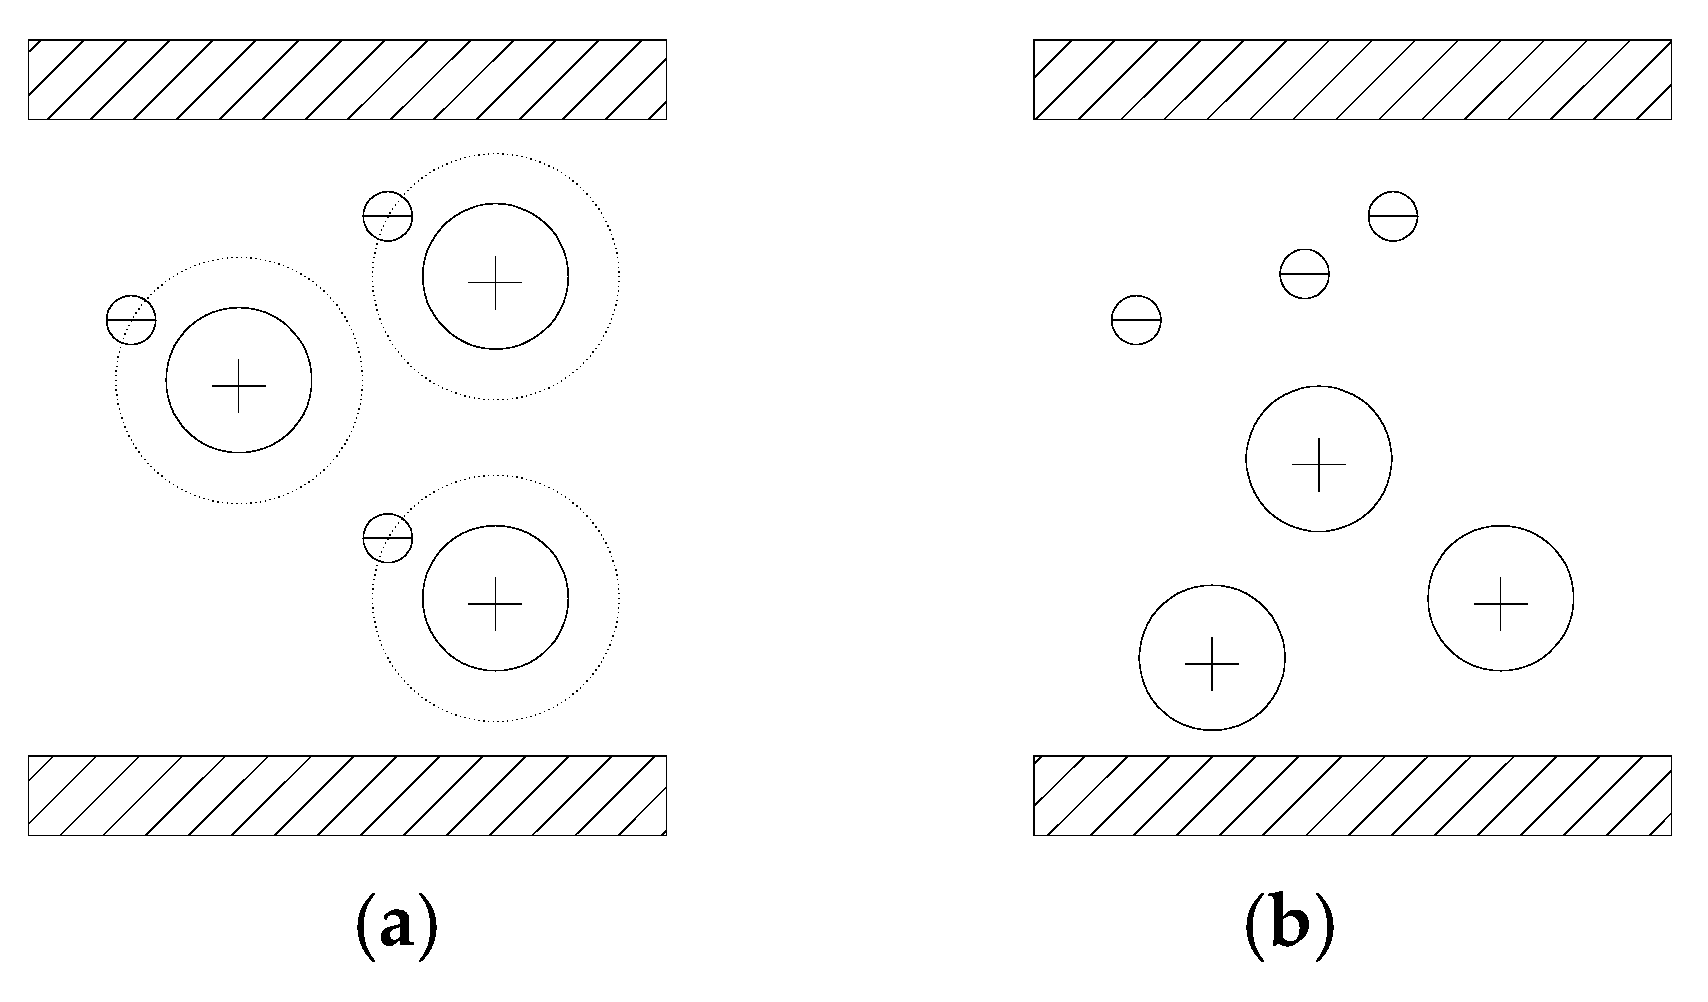
Electric field-dependent molecular ionization (field ionization) does not require, in general, the assumption of free electrons and ions occurrence in the space before discharge propagation. In the environment characterized by high values of the electric field intensity, it is possible to separate electrons from inert particles [16,29]. As a result of this process, free electrons and positive ions appear in the inter-electrode space (right panel of Figure 2). Because of the different mobility of electrons and ions, local variations in density of mentioned particles may occur, leading to the generation and propagation of streamers. Such models are commonly used to describe ionization in transformer oils [30,31] and water [32]. The basic disadvantage in the practical utility of this theory is the lack of analytical description of the ionization process in liquids. In practice, Zener models are in use, but they are originally used to describe the tunneling process in semiconductor materials [33].
The ionization process under the influence of the field depends on many factors, such as ionization potential, liquid density, or electric field intensity gradients [16,29]. This mechanism is characterized by many advantages, such as the lack of necessity to take into account the free energy carriers or pollutants (with lower ionization energy) during the initiation of the discharge. However, it should be mentioned that this type of ionization dominates in areas with very high electric field strengths, such as in the vicinity of blades or leader’s head [16,34]. Because of the lack of theoretical description of this process for liquid environments, utility of the proposed model is significantly limited.
2.2.3. Electric Field Dependent Ionic Dissociation
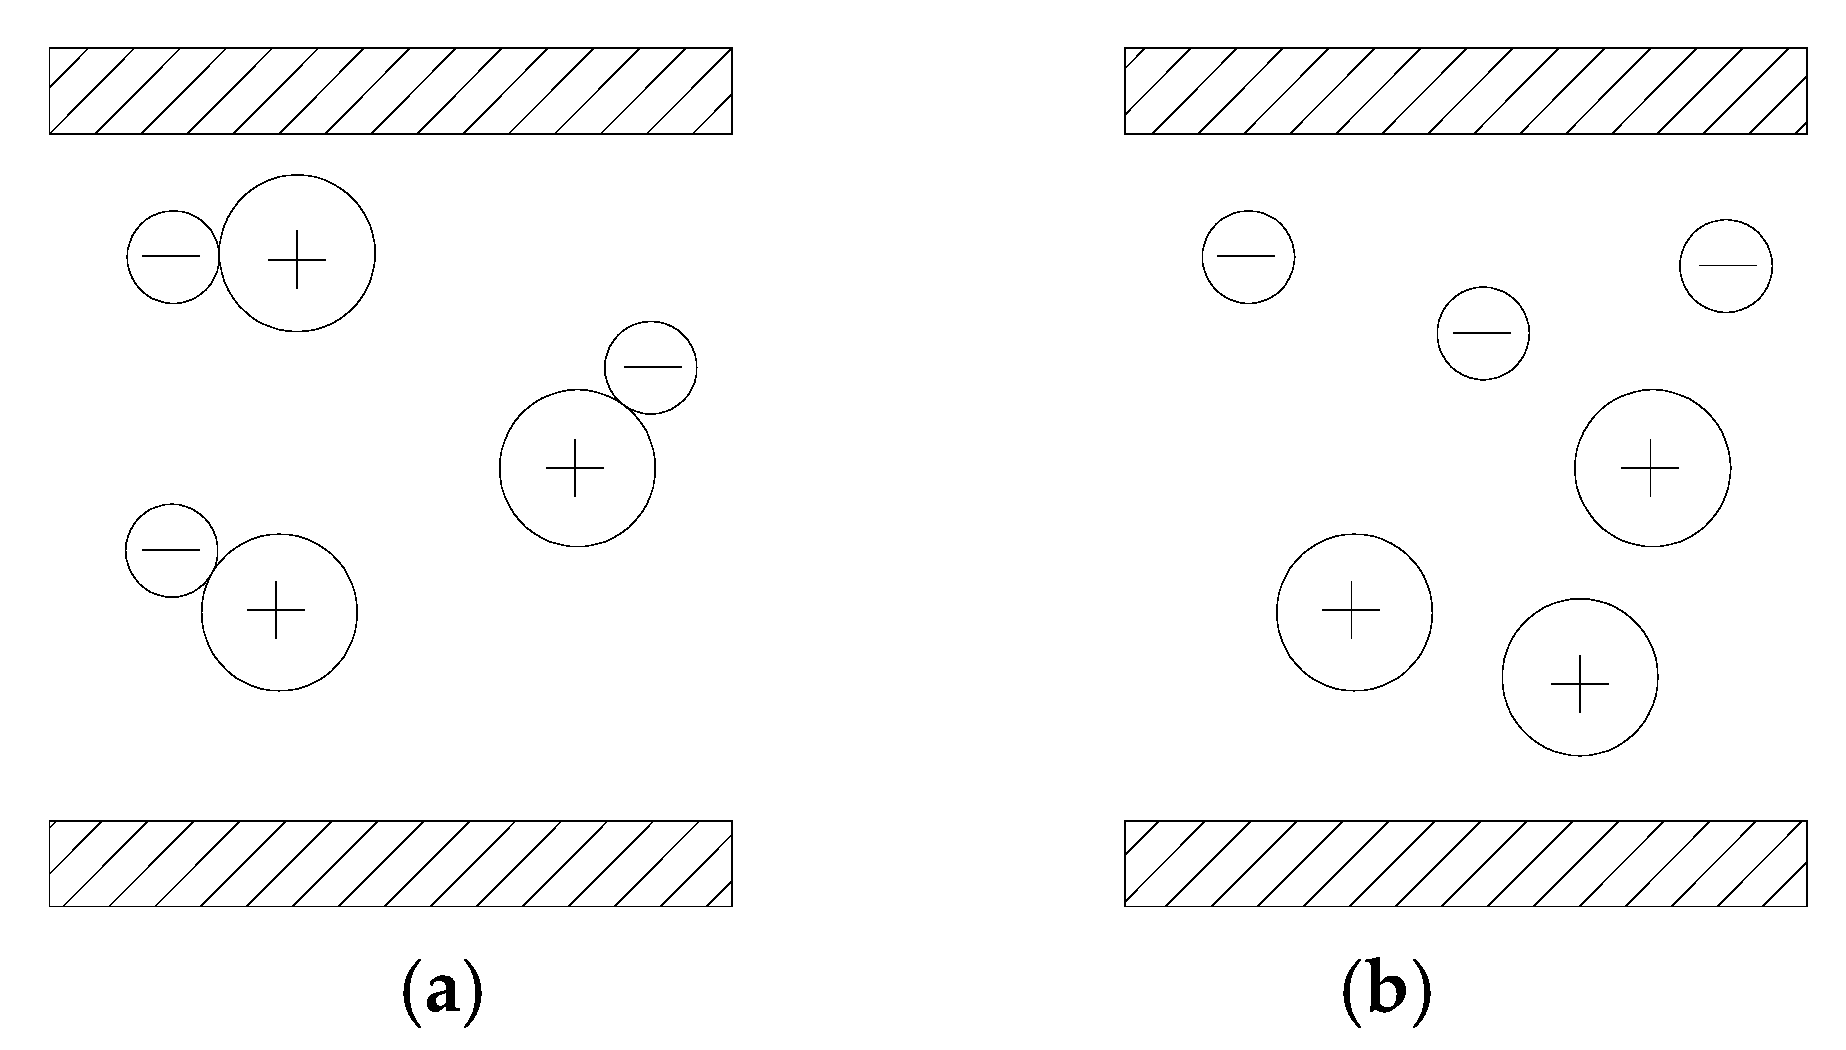
Formally, the ionic dissociation process is similar, in terms of the description, to the above mentioned ionization under the influence of the electric field [16]. To describe this process, one has to assume “active area” filled with a mixture of neutral particles, positive and negative ions. Under the influence of the external electric field, the neutral particles are dissociated, which leads to an increase in the number of ions (Figure 3) [35,36]. This fact reduces the breakdown voltage and provides the development of the discharge. It should be mentioned, however, that the mobility of positive and negative ions is negligible compared to the rate of electrical discharge development. For this reason, utility of this process to describe the development of the discharge is limited [16,35].
2.2.4. Electrostriction Mechanism
The electrostriction mechanism is used to describe discharges characterized by short duration. In the vicinity of electrodes, an inhomogeneous distribution of the high intensity electric field is created. Under conditions of significant gradients of the electric field intensity, in poorly conducting liquids, there are stresses causing deformations and discontinuities of the liquid [37,38]. In these areas, micropores filled with gas are formed, featured by a characteristic extension toward the electric fields force lines. In these structures, the free electrons can obtain energy values that enable the initiation of the collision ionization process [16,38,39]. The forces affecting the liquid as a result of the electrostriction phenomenon are described by the formula (1) for non-polar and (2) for polar liquids [16,38].
where: ε0—vacuum dielectric permittivity; ε—dielectric permittivity of the medium in which the discharge occurs; α—a coefficient determined empirically for polar liquids
The analysis of the given equations shows that the electrostriction mechanism is intensified in the conditions of fast-changing electromagnetic fields with significant gradients. Therefore, this process can be used to describe discharges of nanosecond duration, in the vicinity of pierce electrodes [39,40]. For longer discharges, the hydrostatic pressure reduces the formation of micropores [40].
2.2. Material and Method
In the previous part of the paper, most popular models of electrical discharges formation and propagation in liquids are detailed. Presented models cannot be, in general, used interchangeably, and utility of specific description depends on electrical parameters of the discharge and material parameters of the region, where breakdown process occurs.
Main topic of the paper is developing universal models and calculating procedure for the complex analysis of high voltage electric discharges. Models consider the pre-breakdown and breakdown stage of the discharge. Additionally, calculations of thermal phenomena in the time between the discharges are realized.
Before development of numerical models, some tests were performed using physical model of discharge system. Based on measurements of electrical parameters of discharges, it was possible to select appropriate model of ionization. These tasks are detailed in Section 3 of the paper.
In Section 4, general concept of HVED modeling is presented. It is assumed, that the mentioned issue can be solved using coupled electromagnetic and thermal fields. Both field and circuit models are in use.
Electrostatic calculations, described in Section 5, are used to analyze the streamers propagation in models of liquids by using FEM (ANSYS) system. Electric field distribution and gas bubble models are used to determine streamers geometry in the pre-breakdown stage. Utility of additional analytical equations enables to determine speed of streamers propagations.
In the Section 6, procedure for analysis of breakdown (arc) stage of discharge is detailed. FEM (ANSYS) numerical model with plasma channel is used. Plasma conductivity and cross section of the channel are determined by analytical equations. Momentary values of voltage drop and current in plasma channel are computed using coupled circuit model (composed of resistor and capacitor) of power supply. Such solution enables to determine transient characteristics of discharge, including power supply capacitor discharge.
Section 7 presents the analysis of temperature distribution in the time between the discharges. The computational fluid dynamics procedures are used to guarantee the precise analysis of convection heat transfer in liquid environment. Based on the calculations results obtained in this stage, it is possible to determine the minimal break time between discharges.
3. Preliminary Research of Discharge Parameters in Juices
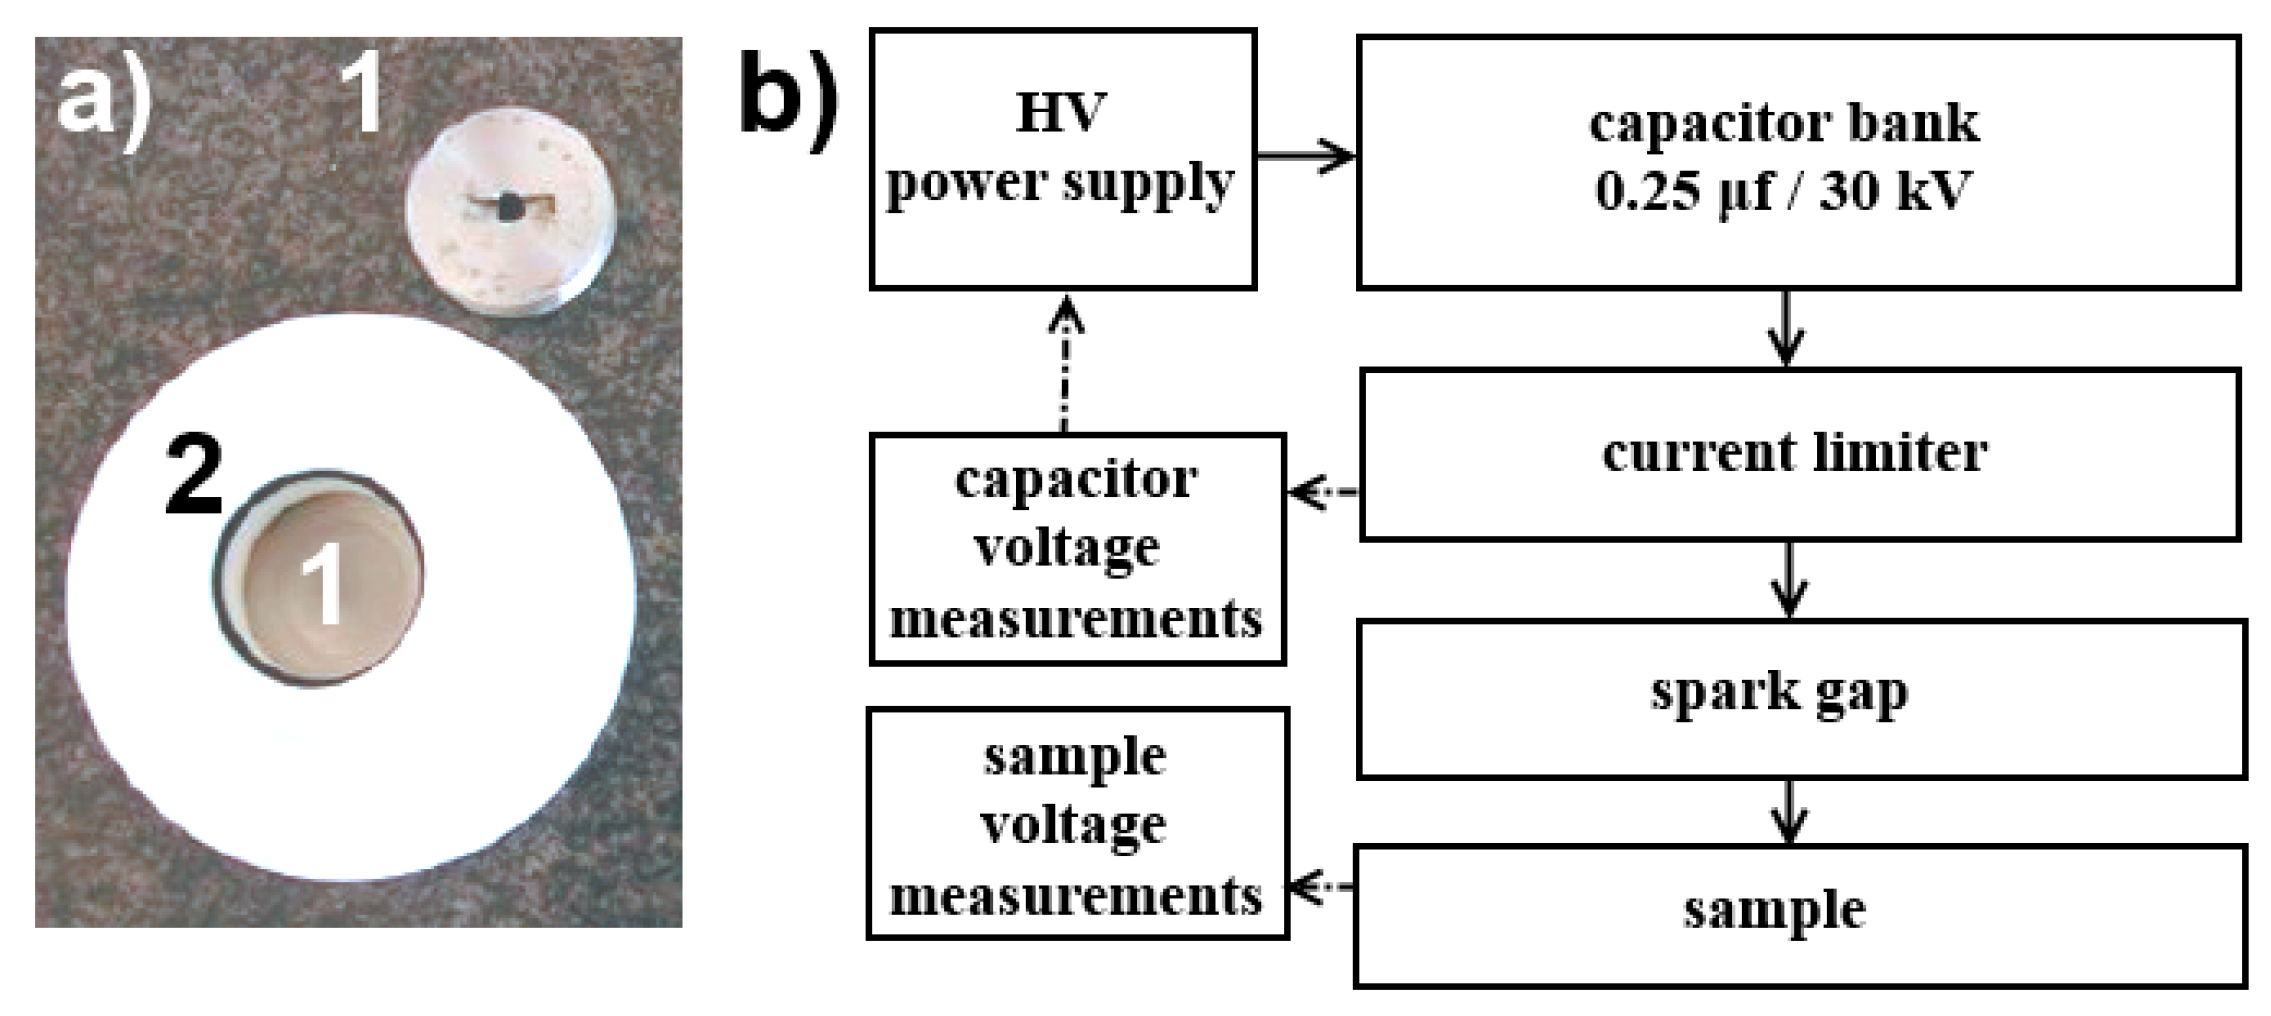
In the previous section of the paper, most popular mechanisms describing the nature of the high voltage electrical discharges in liquids are detailed. These mechanisms usually describe specific electrical discharges, classified primarily, because of the speed of their propagation (fast and slow discharges) [27,39]. In order to select the model for further analysis of electrical breakdown process in juices, basic parameters of physical model are measured. All presented measurements are performed to determine the energy values of pulsed discharges and specific discharge periods. The test stand, consisting of a high voltage pulse generator, working chamber, and a control system, is used. Sample of juice is placed between the two flat electrodes. Figure 4 shows the design of working chamber (Figure 4a) and block diagram of the test stand (Figure 4b).
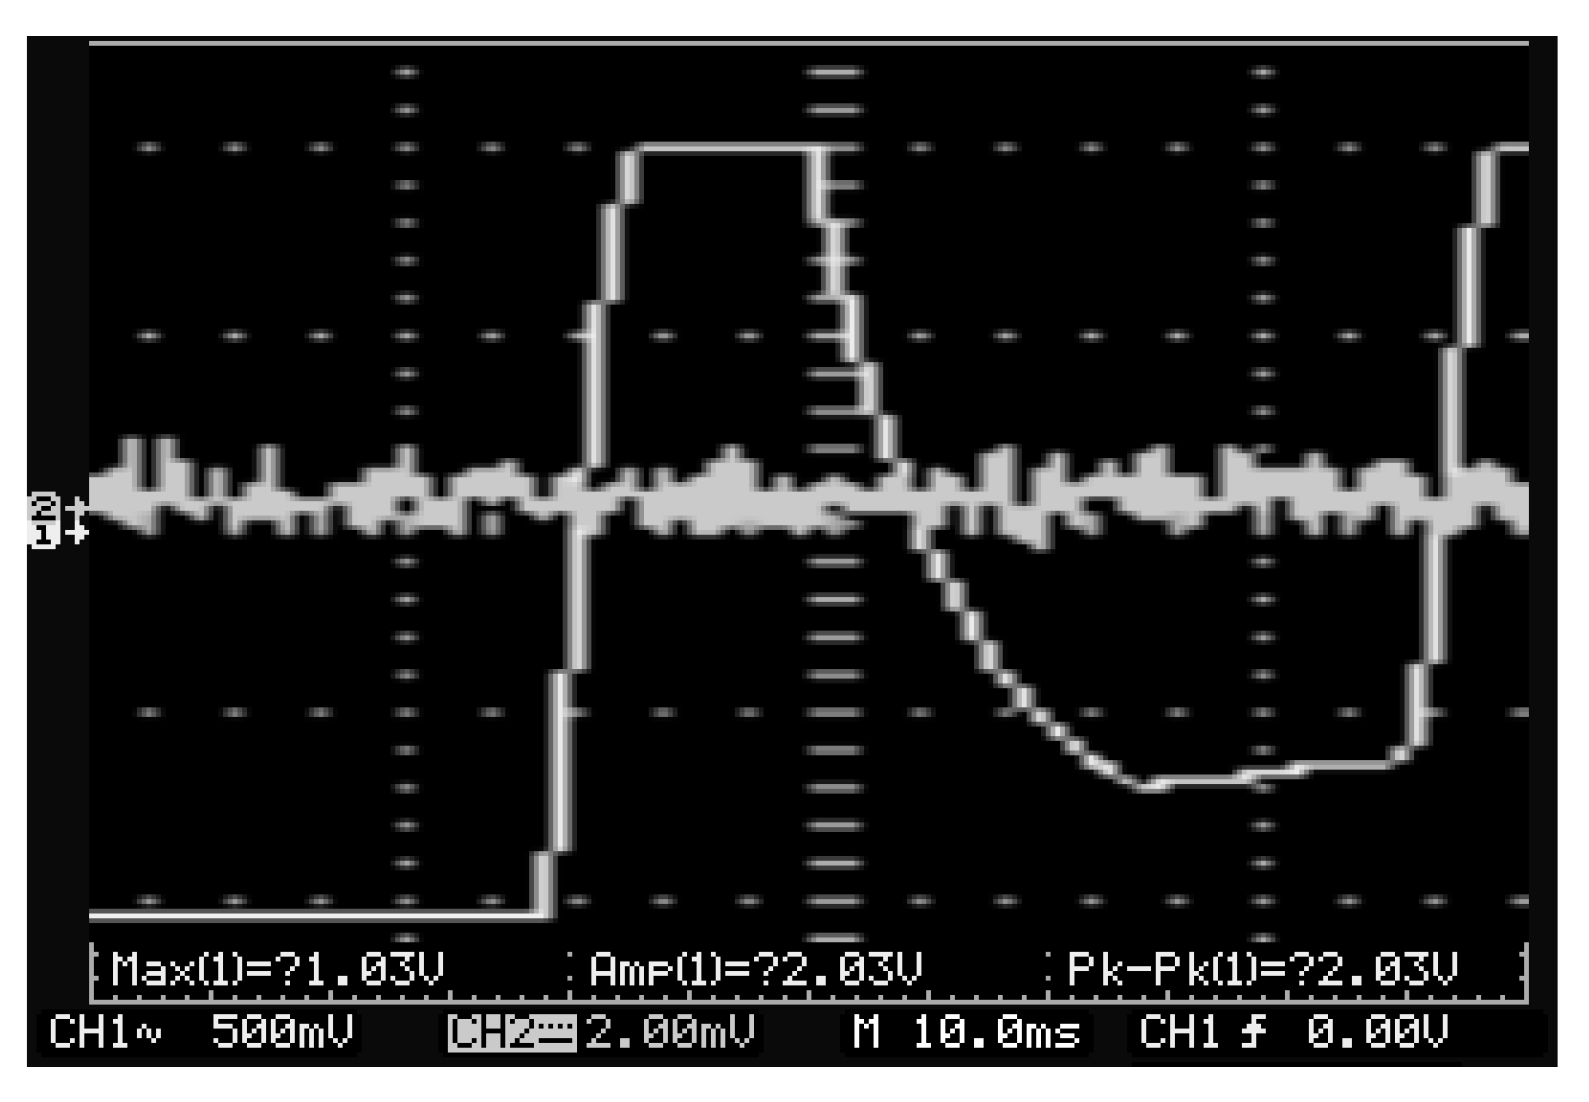
The AS3-mini analyzer equipped with an oscilloscope to record voltage and current waveforms is used. During the measurements of high voltage pulses parameters, the initial voltage was kept at 20 kV. Recorded waveforms are presented in the Figure 5. Results show the oscillatory character of the voltage values of the generated pulses. Its initial amplitude depends on the applied voltage triggering the pulse.
Tests results were used to determine the shape of the generated pulses, together with all the specific quantities (amplitudes, rise and fall times). They were used to model the electrical discharge process. According to the measurements results, it was assumed, that the theory of gas bubbles can be used to describe the discharge phenomena in the analyzed juice model [14,16,39]. In pursuance of the description of this process, the initiation of the discharge occurs as a result of the gas bubble generation because of the Joule heat effect or large field intensity gradient in vicinity of electrodes. Depending on the initial voltage and energy value, it is possible to develop “slow” (propagation speed within several km/s) or fast (propagation velocity from several to several tens km/s) discharges [27,39]. Based on the measurements of current and voltage values in the tested device, the approximate propagation velocity (Figure 5) of the discharge was determined based on the current value of the rise time.
Estimated propagation speed was at 3470 m/s, which allowed us to classify the discharge as “slow.” Under these conditions, it has been assumed that the electrical discharge is a result of ionization process in the gas phase filling the plasma channel [19,41]. This fact is important in the discharge numerical modeling point of view. As it was mentioned above, the discharge parameters in liquids are determined by the value of the electric strength, the distance between the electrodes, their shape, temperature, and material parameters of the liquid (juice in analyzed case). When appropriate number of free electrons and positive ions occur in the discharge area, one or more plasma channels (streamers) can be created. Almost all electrons will flow through the channel characterized by minimal resistance value [40,41]. Streamers starts at the cathode toward the anode. When the anode area is reached by plasma channel, the impedance of the discharge area decreases dramatically, which leads to a significant increment of the current. This stage, called the breakdown, is characterized by the occurrence of a plasma channel with almost cylindrical cross-section and duration depending on the capacity in the system [28,42]. The discharge energy can be simply defined as:
where: Ui—voltage before breakdown, Uf—voltage after breakdown, C—capacitance
The formula was used during determination of energy balance of the discharge presented in the next section of the paper.
4. The Concept of Discharges Modeling in Liquids
Discharge model, designed to analyze the phenomena occurring in devices using HVED for the preservation of liquid food products, should enable analysis of coupled electromagnetic and thermal fields. Primarily, the model was used during the design of the laboratory discharges generator and planning future tests to implement this technique in industry. In particular, the model should allow:
- -
- Selection of the electrodes system in terms of their dimensions and distance;
- -
- Determination of the voltage values to initiate the discharge;
- -
- Determination of discharges energy;
- -
- Determination of the duration of discharges;
- -
- Determination of the temperature distribution after discharge in order to analyze the time required to initiate next discharge. This task was aimed to eliminate the possibility of subsequent electrical discharges in the same channel;
- -
- Determination of the power supply circuit parameters based on the required voltage and energy of discharges.
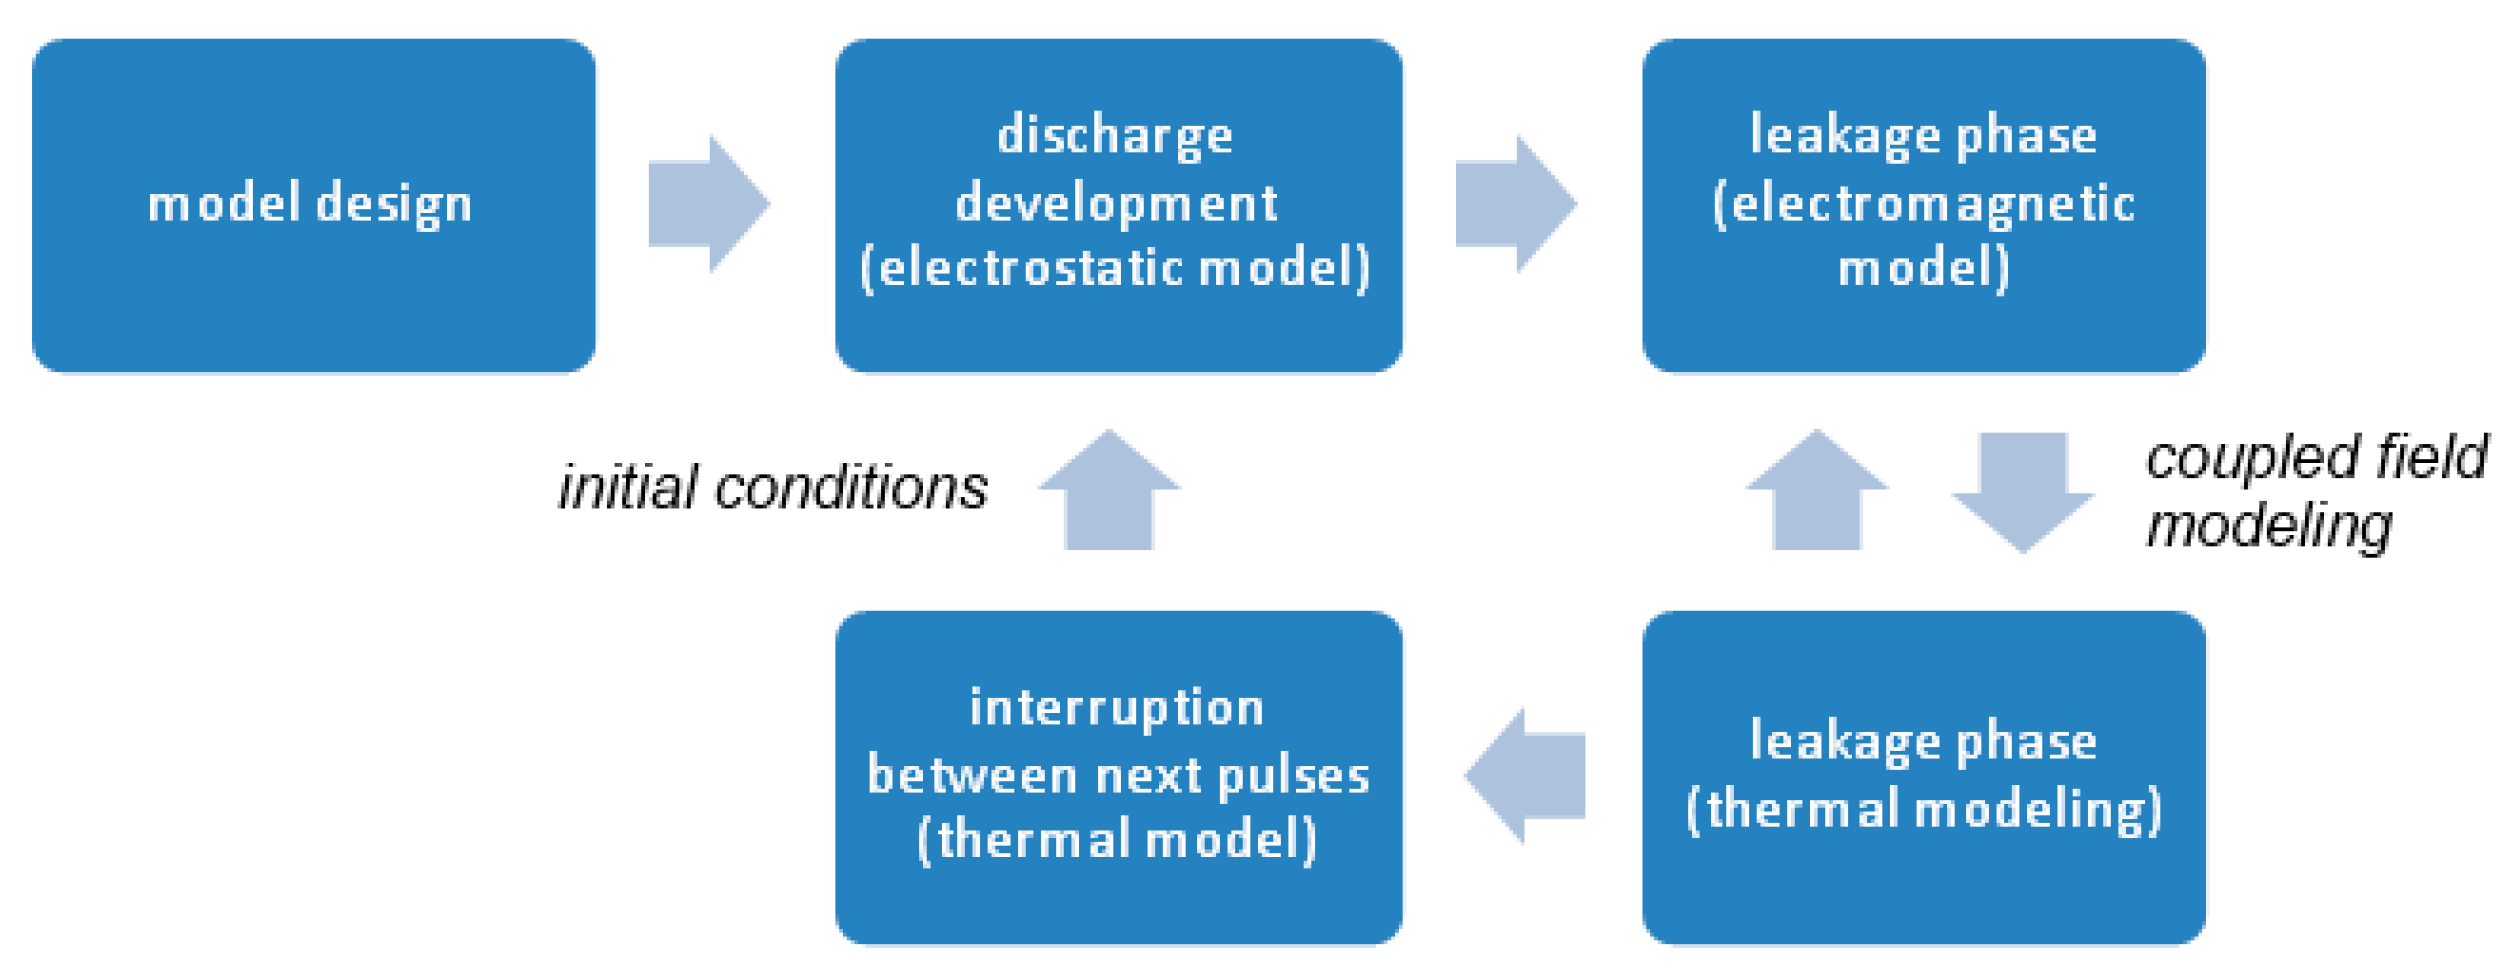
Characterization of all above mentioned parameters requires advanced models and calculating procedures using both field and circuit models. Field computations, carried out in the commercial FEM system, were used to compute the electrodes system variables, streamers propagation scheme, and temperature distributions. Power source parameters have been determined using circuit models. The calculation algorithm is shown in Figure 6. Both field and circuit models have been extended with Author’s procedures and algorithms, characterized in subsequent section of this paper.
5. Modeling of the Discharge Development
Numerical calculations of discharges in liquids are divided into three basic stages, allowing for the implementation of the modeling objectives described in the previous section:
- -
- Determination of the streamers propagation (pre-breakdown);
- -
- Determination of discharge breakdown (arc) stage parameters (voltage, current and energy values);
- -
- Modeling of the discharge system including the power source to select appropriate capacitor used during discharge process.
The analysis presented in this paper uses a model consisting of two flat electrodes of 50 mm diameter. Active area (model of liquid juice), wherein the discharge occurs, was placed between the electrodes. Distance between the electrodes was 60 mm. The geometry of the model is shown in Figure 7a.
The gas bubble theory was used to determine streamers propagation in the active area. This assumption was introduced, because of the results of preliminary analysis presented in previous section of the paper. According to the obtained results, one can classify the discharge as “slow” [39] and theoretical description of gas bubble theory is applicable in such conditions [14]. The static models implemented in ANSYS program were used to determine electric field distributions. According to the proposed procedure, streamers development was computed using a special “virtual” surfaces arranged in parallel to electrodes (Figure 7b). Adopted “virtual” surfaces form a kind of differential division of the active area. All streamers heads can be located only on these surfaces and streamers spread are computed using a “frame by frame” method. So that, resolution of calculation results depends directly on the number of surfaces. The calculation procedure has been detailed further in the paper. Computations of streamers development could not be performed using only commercial FEM system (ANSYS). Some additional procedures were implemented in Authors’ subprograms. Mentioned procedures were used to compute electric field gradients, voltage values at streamers heads, and to generate geometry of streamers paths and gas bubbles.
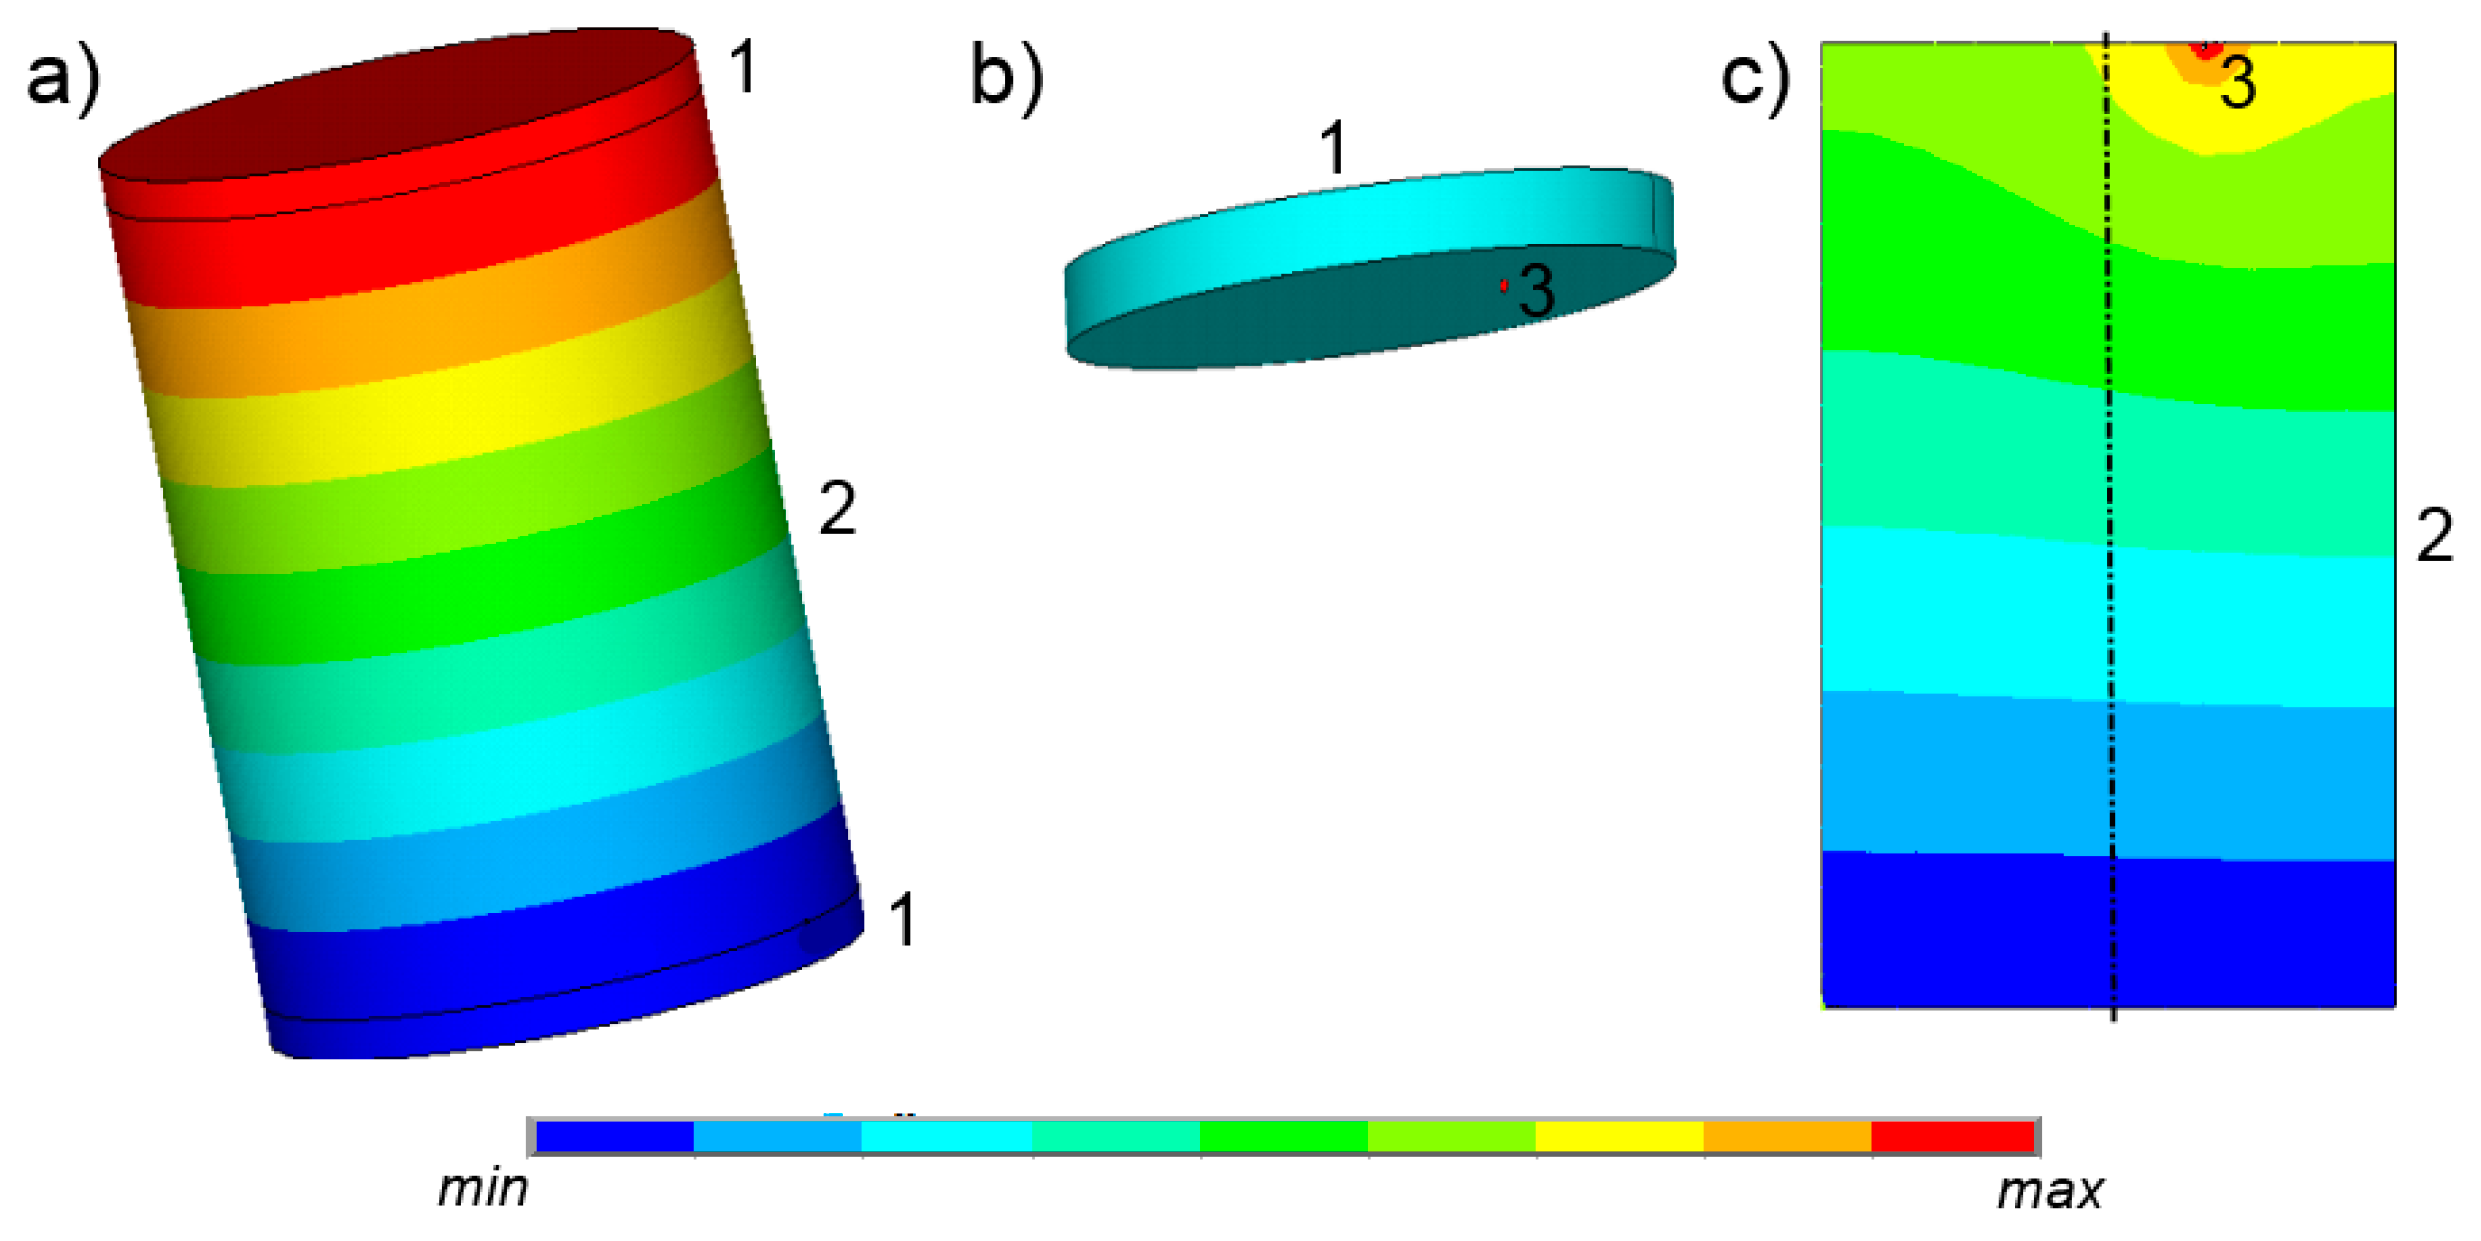
According to the description of the HVED technique, a series of several tens to several hundred discharges is used [4,9]. Therefore, the procedure for determining the streamers propagation have to be performed many times, regarding the number of analyzed impulses. The initial conditions for each impulse, in the form of variable physical parameters of the liquid environment, have been introduced based on the temperature distribution that occurs after the previous pulse was generated (Figure 6). During the modeling of the first discharge, it was assumed that the active area is characterized by homogeneous temperature, conductivity, and concentration of charges. The solution of the electric field intensity equation and the electric potential (4) for the electrostatic problem in such a system always leads to results, where the electric field intensity is homogeneous throughout the analyzed area and the electric potential distribution is characterized by iso-surfaces parallel to the electrodes (Figure 8a).
where: E—electric field intensity; ε—dielectric permittivity; ρ—charge density
Because of homogeneous electric field distribution, discharge initiation point cannot be clearly determined. In order to initiate first discharge, the random number generator was used, implemented in a MathCAD [43] program. Node numbers (of the finite element mesh) lying on the cathode surface were exported to this software. Random node number was generated and re-entered into the ANSYS program to initiate the discharge. The gas bubble model with spherical geometry of 10 μm diameter was created around the selected node (Figure 8b). According to the Equation (5), the intensity of the electric field in the bubble is higher than in its direct vicinity [39]. The phenomenon was considered during calculations by introducing the value resulting from the formula (5) as an additional source of electric field in the numerical model (Figure 8c) [17].
where: Eia—the intensity of the electric field in the vicinity of the gas bubble; εr—electrical dielectric permittivity
The plasma channel can be developed only if the local electric field intensity on the streamer’s head exceeds the critical value specified for breakdown of the dielectric material (juice model in the analyzed case) (E *) [17]. This condition was used to determine the streamer’s propagation path, by determination of electric field intensity gradients (Figure 9a). However, in many cases, the main discharge streamer can be branched. The condition for creation of new streamers may be presented basing on the field fluctuation criterion, leading to formula (6) [17].
where: Ei—the gradient of the electric field intensity in the direction in which a new streamer can propagate; δi—random variable, taking into account the fluctuations associated with the local heterogeneity of the critical values of the breakdown voltage (randomness of the discharge).
Computations of streamers propagation scheme were performed by the analysis of electric field intensity gradients distributions between individual nodes located on the successive “virtual” surfaces of the discharge area (Figure 7). In cases, where gradients were characterized by similar values (differences lower than 10%) (Figure 9b), the condition (6) was analyzed and a new streamer was introduced (Figure 9c,d).
The proposed procedure uses static calculations. Considerable disadvantage of this solution is the inability to use it to transient analysis of the pre-breakdown stage. In order to enable such calculations, the Equation (7) [17,44] was used to determine the average speed of streamers propagation, based on the analysis of local values of the electric field intensity.
where: τ—time step; h—distance (between subsequent surfaces of the differential division of the discharge space); g—width of the streamer; E—electric strength, E*—breakdown field strength
Equation (7) was used to determine the time, after which, the streamer head reaches subsequent “virtual” surfaces dividing the area of the discharge propagation (Figure 7b). Such computations can be performed for all calculation steps to determine the temporal characteristics of the discharge propagation path.
Procedure shown in Figure 9 was used to determine the locations of all nodes, where streamers heads occur. Around these nodes, models of the gas bubbles were created, similarly to the above described modeling of the first node located on the surface of the electrode (Figure 8b). The occurrence of the plasma channel between the gas bubble models is taken into account. The channel was simulated in the form of a cylinder with a diameter of 10 μm (Figure 9c,d). Inside the channel, the model of the plasma of conductivity determined by Equation (8) was assumed [45,46,47]. This formula is useful for poorly ionized plasma. During calculations movements of plasma particles was neglected [46].
where: T—temperature, k-Boltzmann constant, me—electron mass, ne—concentration of electrons, no—concentration of electrically neutral particles, e—atomic unit of charge, sa—active cross-section in which collisions occur
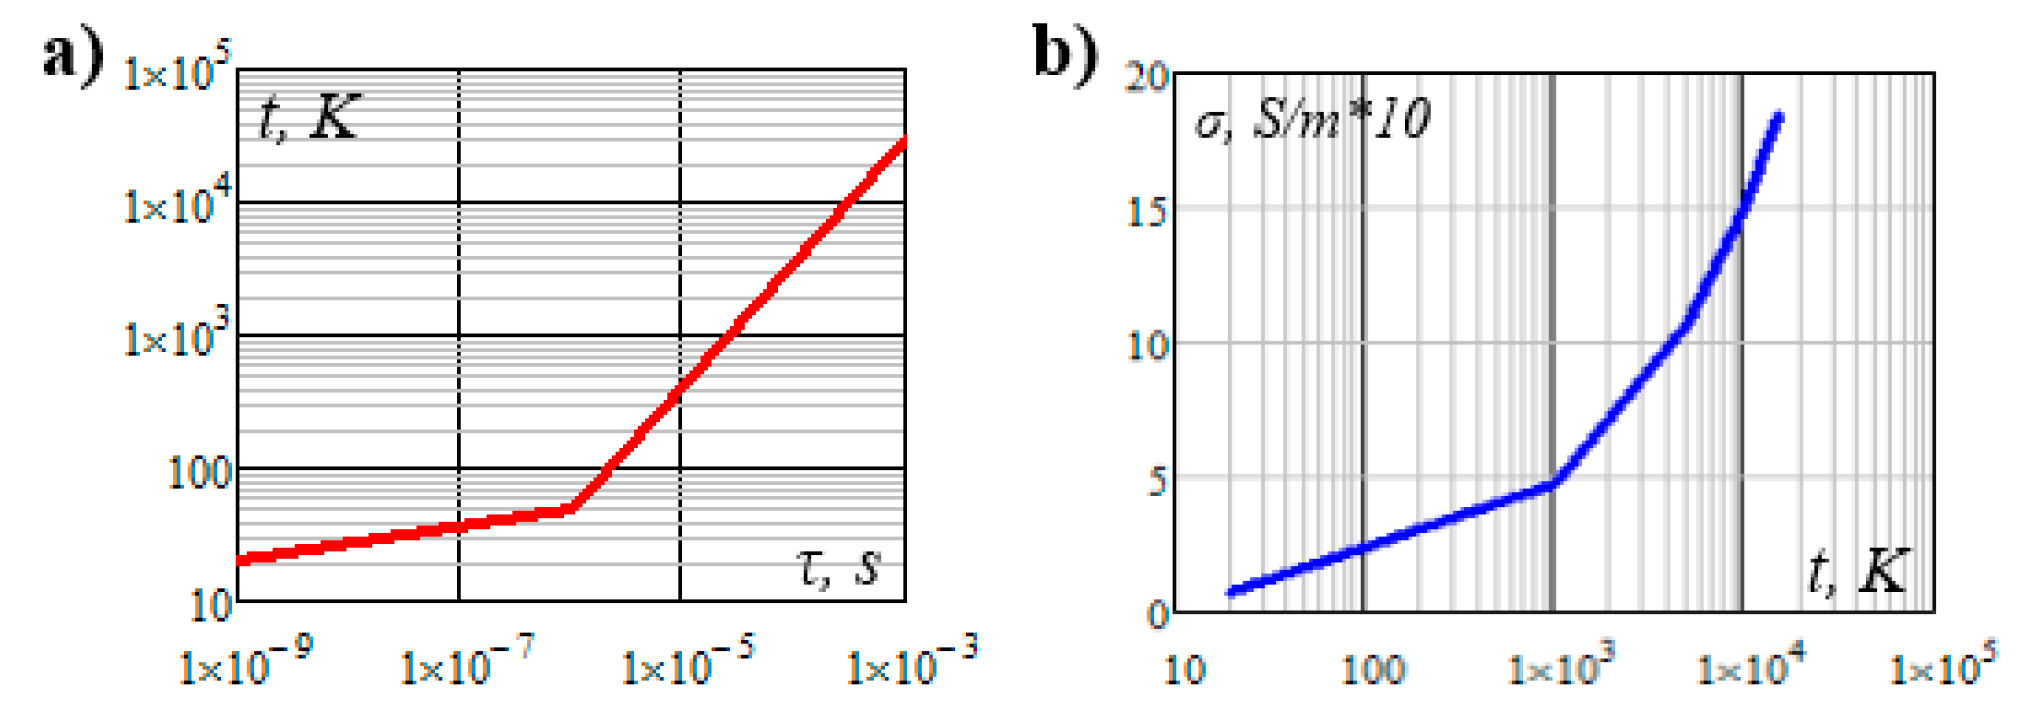
Relating to Equation (8), it is necessary to know the plasma temperature to determine its conductivity. In general, the presented algorithm for streamers development stage, does not require to perform thermal calculations. This fact results directly from the analysis of bibliography [39,44,47], where it has been proved that in pre-breakdown stage (before electrical breakdown), the value of dissipated energy is relatively small in comparison to the energy released during the breakdown (arc) stages of discharge. Using the equations for isothermally heated body (9), it was possible to develop an approximate dynamic temperature characteristic (Figure 10a) for the discharge propagation. The obtained temperatures were used to compute the non-linear value of plasma conductivity (Figure 10b) [48]. The proposed solution is simplified because of the assumed constant power value during the streamer conductivity computations. To consider mentioned effects it is necessary to perform iterative calculations.
where: Pp—power dissipated in plasma; cpl—specific heat of the plasma; mpl—plasma mass; tp—initial temperature
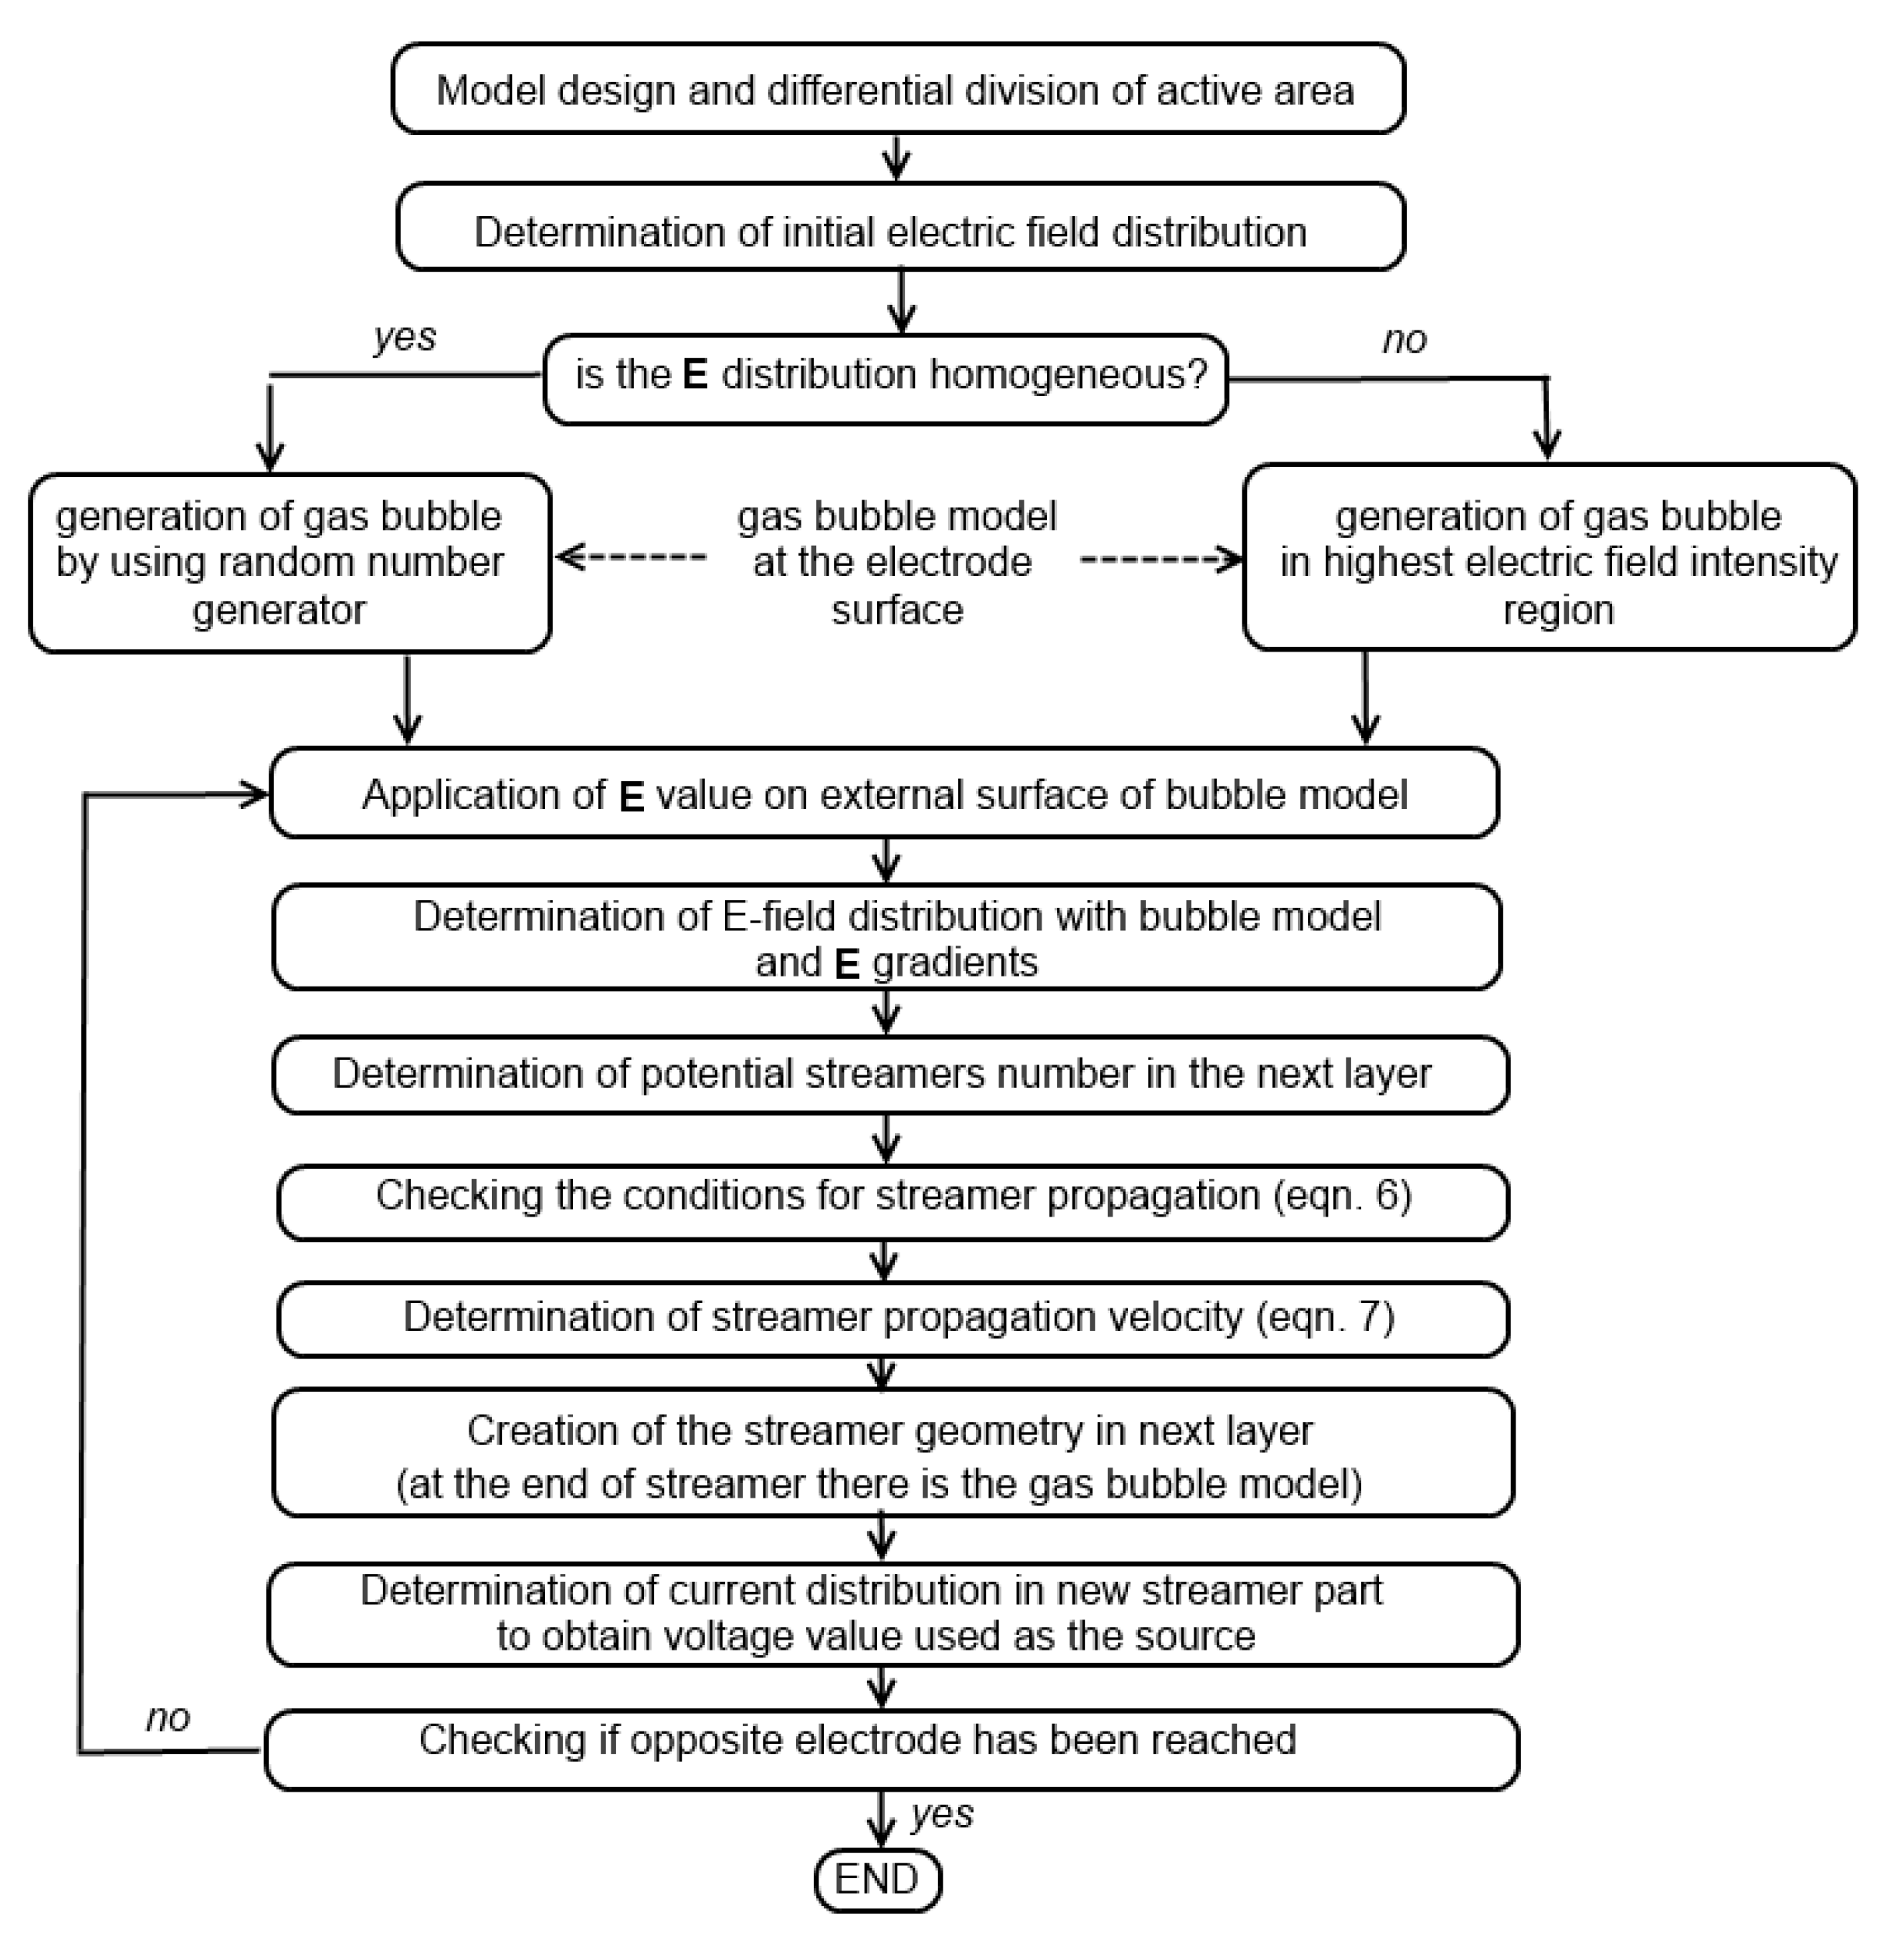
Plasma conductivity values were used to determine the charge distribution (10). All steps described above were used to create the computational algorithm for the propagation of electrical discharges in liquids, as shown in Figure 11.
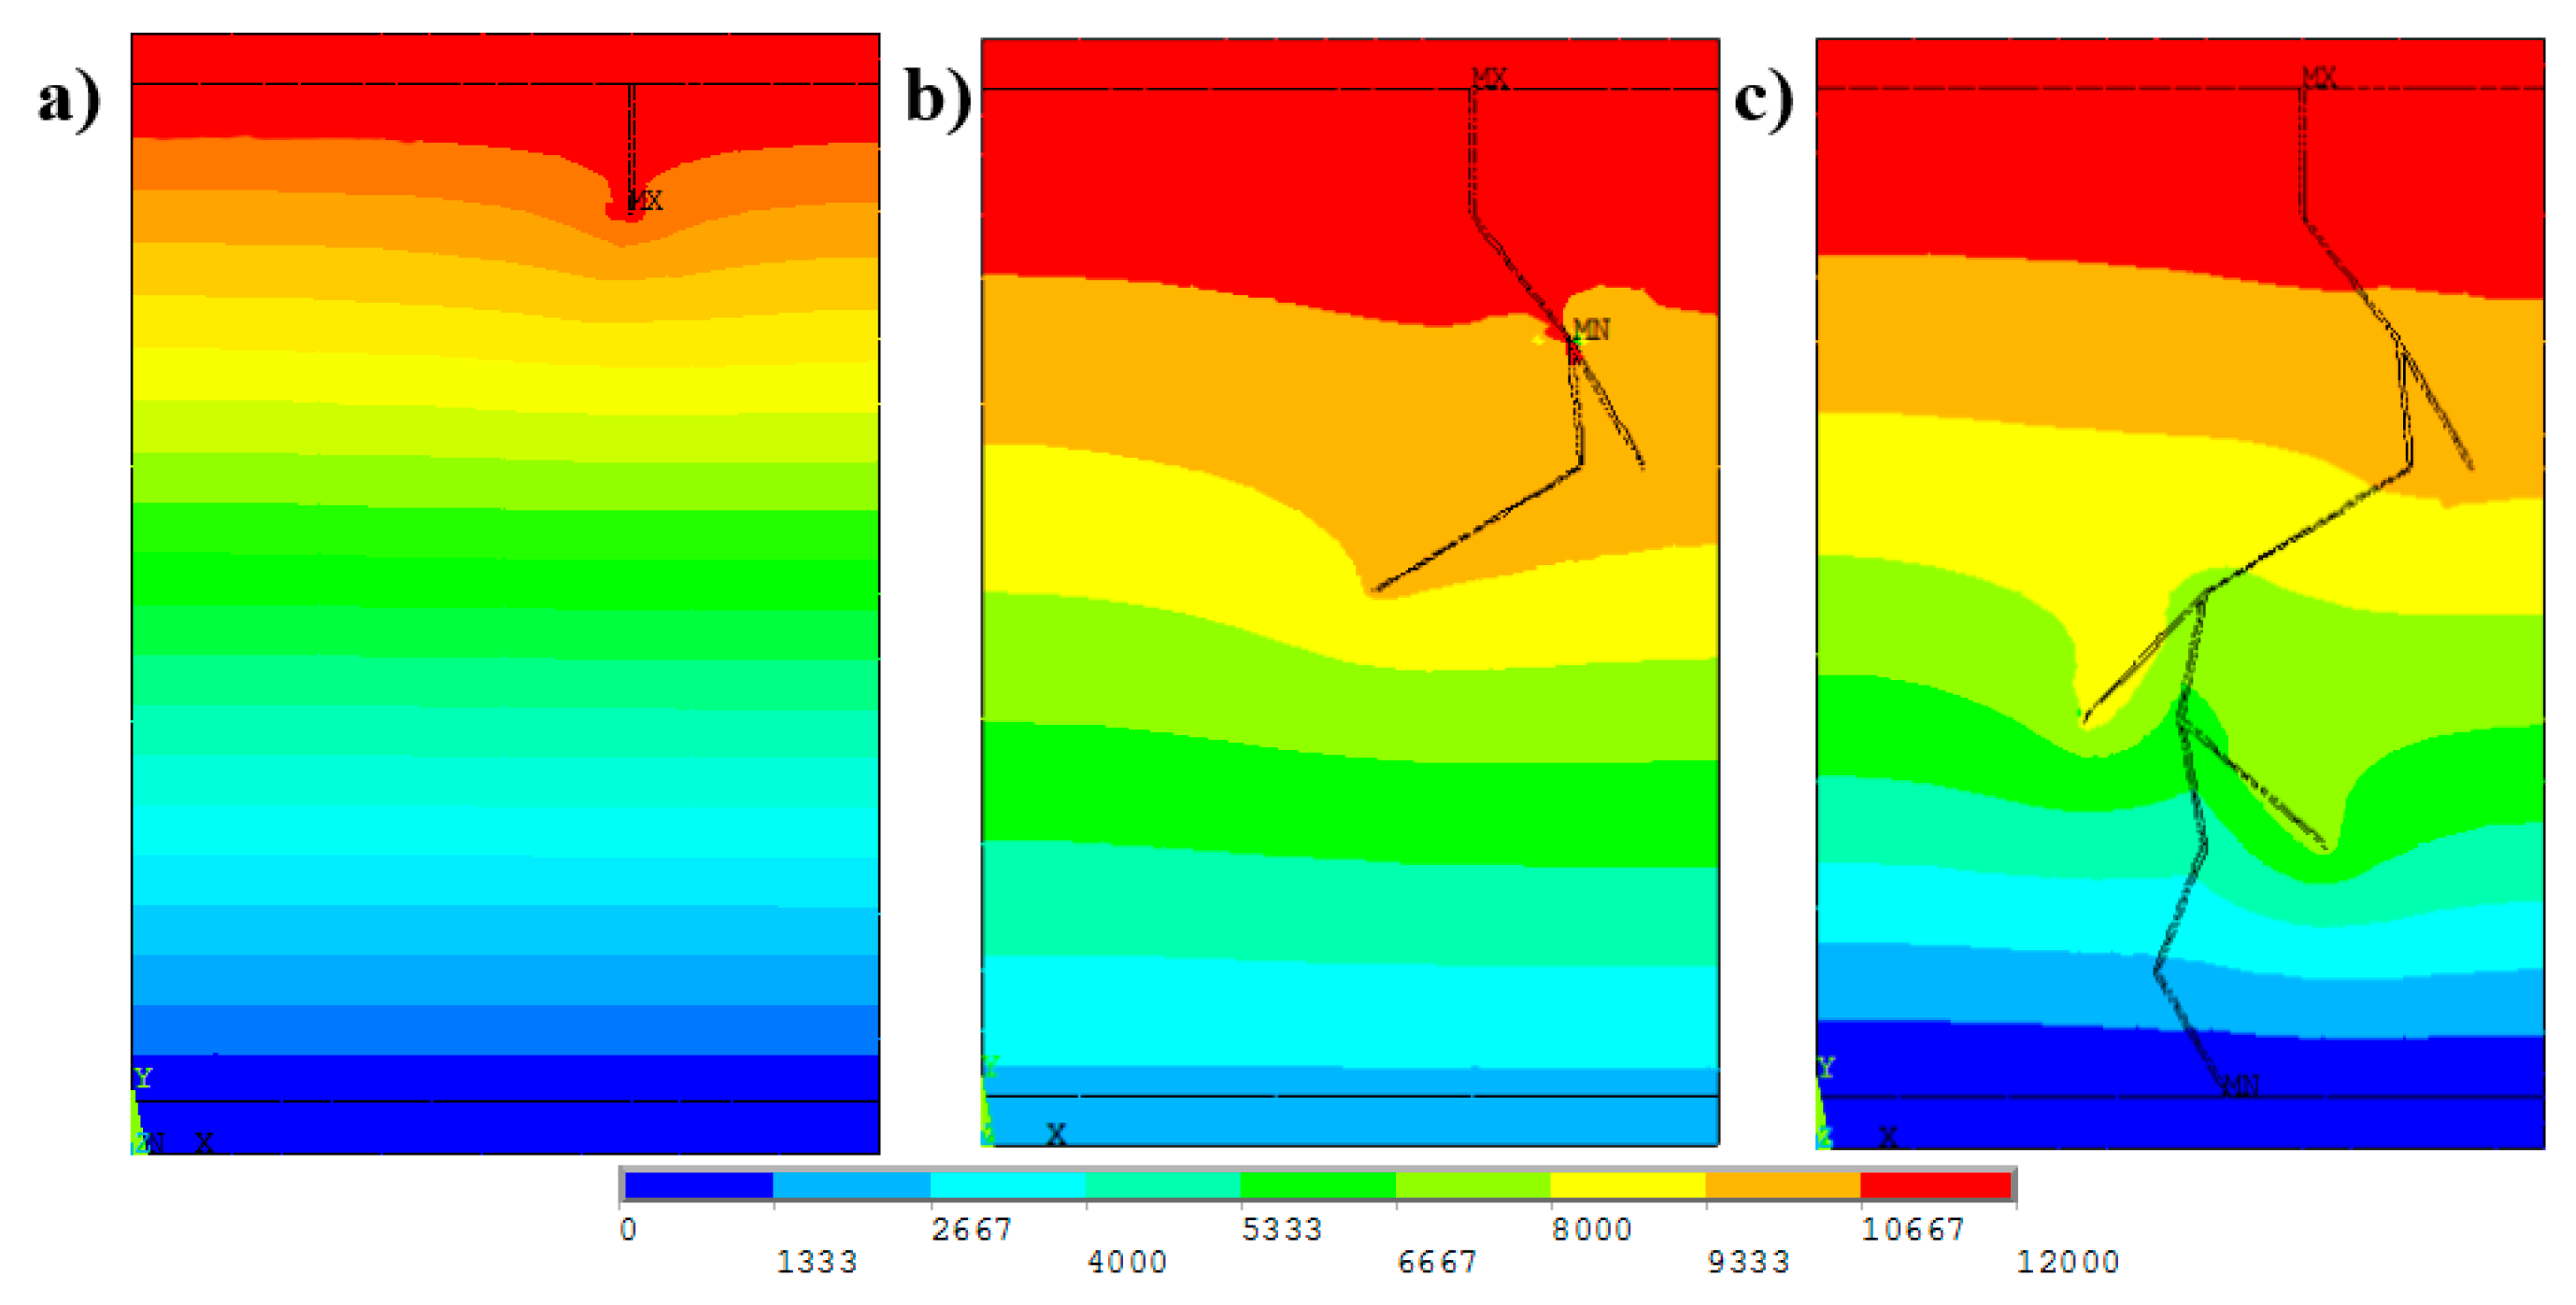
The electric potential distributions in the model for the first discharge have been shown in Figure 12. In terms of quality, the results confirm the proper operation of the algorithm.
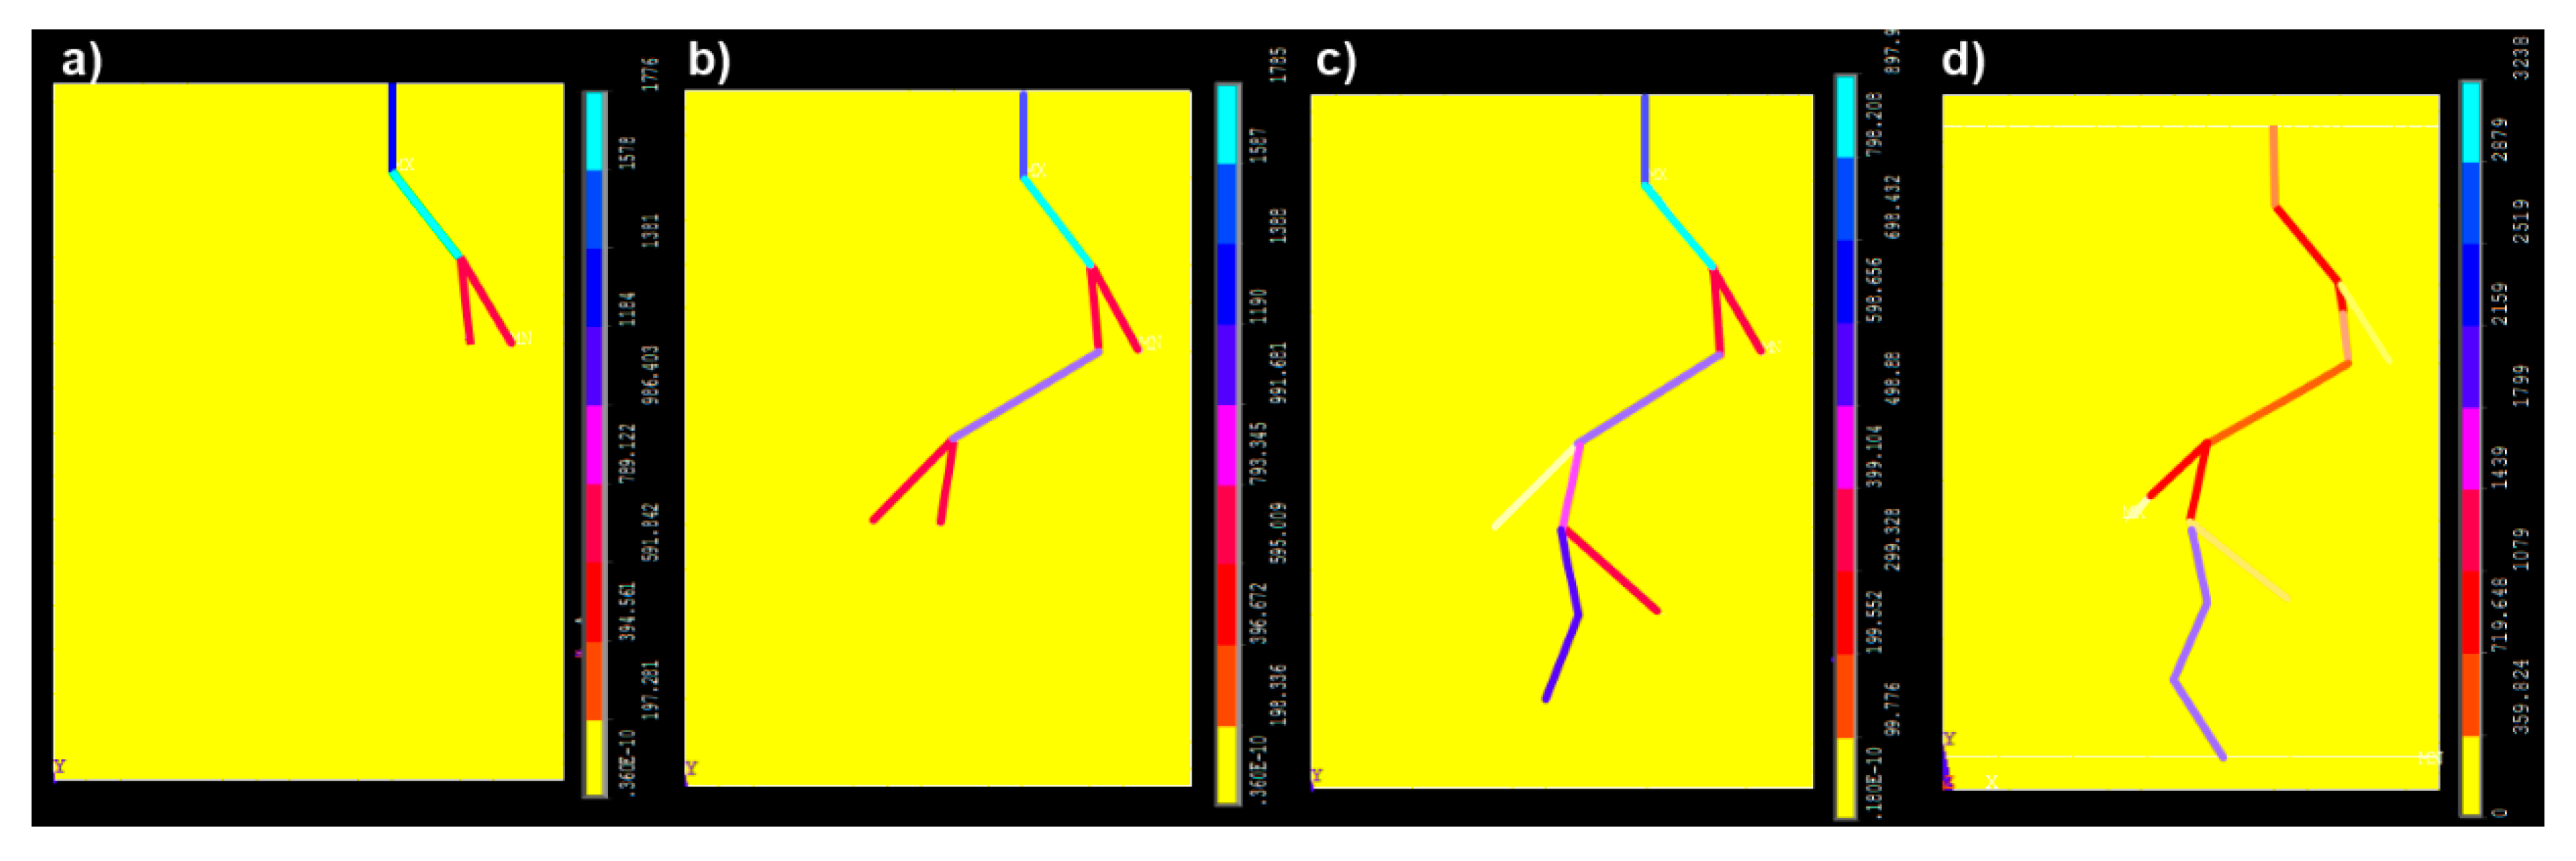
The algorithm allows to calculate the density of currents in streamers and the power loses during the initiation stage of the discharge. Current densities in different time steps are presented in Figure 13.
One can use the algorithm, to perform full calculations of the pre-breakdown, both in geometrical and energy point of view.
6. Modeling of the Breakdown (Arc) Stage
Further analyses were carried out for the breakdown stage, where the plasma channel occurs between the electrodes (channel “connects” the electrodes). It was assumed, during this stage, that all “secondary” streamers (streamers that not reach the electrode surface) were neglected (Figure 14). To compute the current and voltage values in the time domain, it was necessary to determine the electrical conductivity of the plasma, where charge carriers are in the form of electrons and ionized particles. It was required to establish the influence of thermodynamic parameters (mainly temperature and pressure) on the conductivity value. For highly ionized plasma, the conductivity value can be computed using formulas (11), and (8) for weakly ionized plasma [39,46].
where: T—temperature, k—Boltzmann constant, m—mass of the particle, θ—electron concentration, e—elementary energy
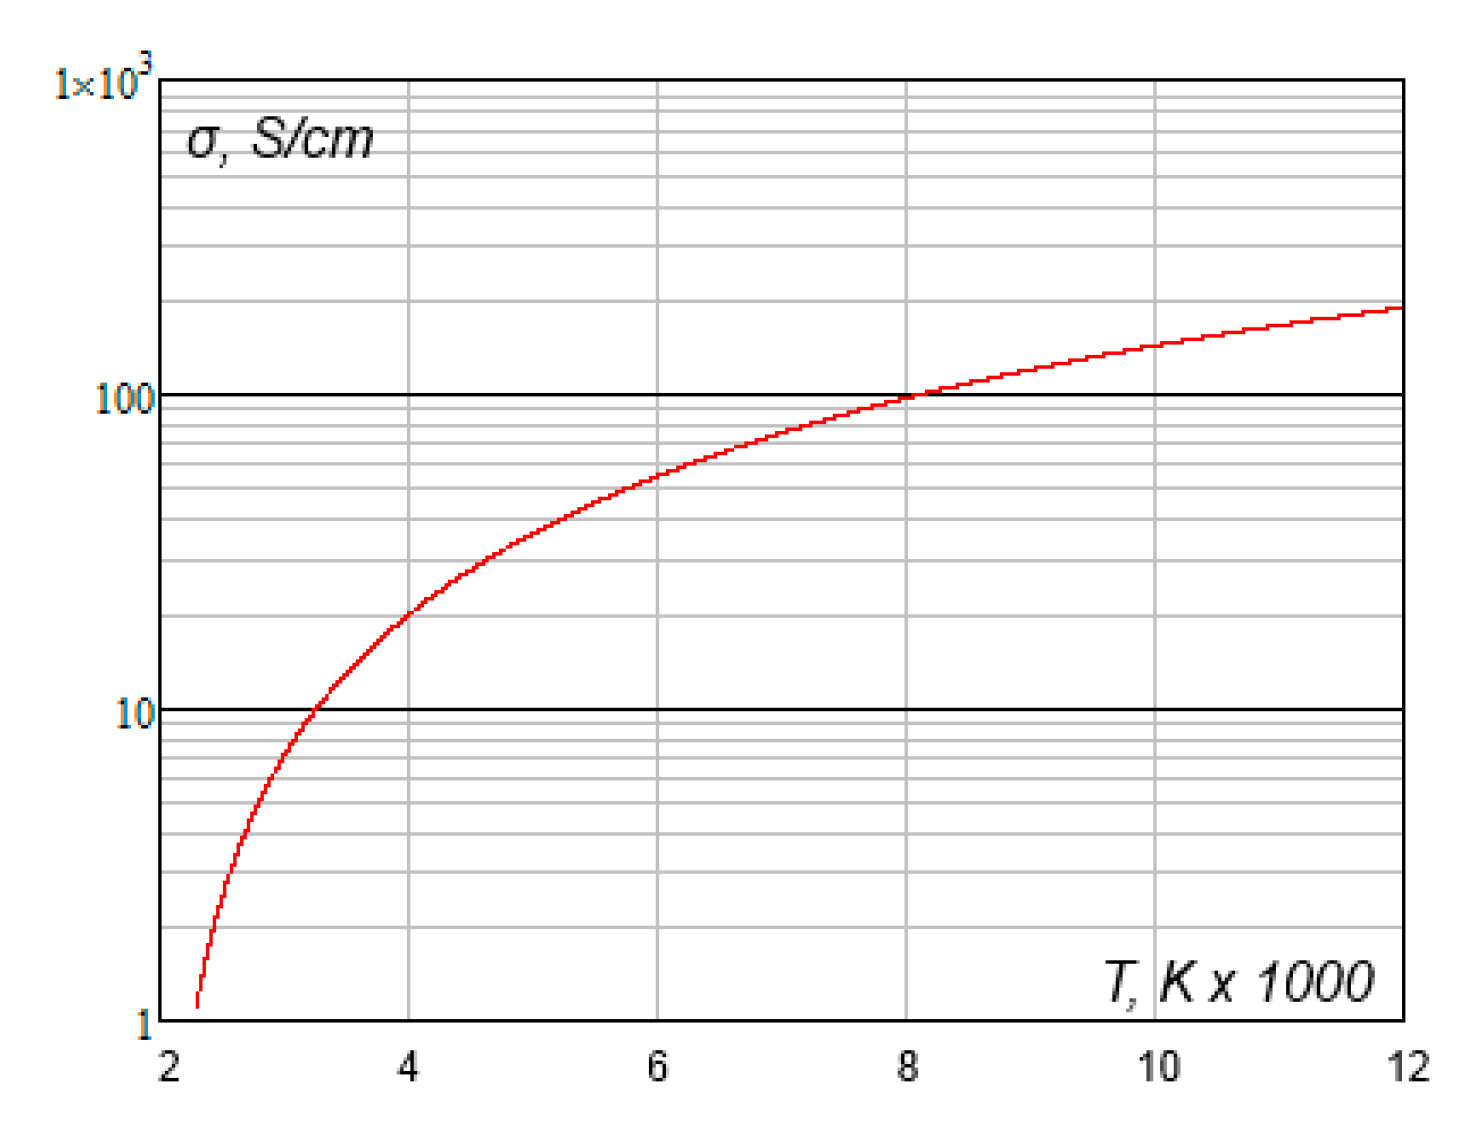
It was assumed that in the presented system there is a plasma characterized by medium ionization degree. Electrical conductivity of the plasma was estimated as the average value from formulas (8) and (11) [39,47]. Figure 15 presents the conductivity values as a function of the plasma temperature. Because of the mentioned relation, arc stage analysis requires coupled electromagnetic and thermal calculations.
Dimensions of the plasma channel were determined automatically. In the case of a circular arc, the equation for radius of the plasma channel can be specified as [47]:
where: I—current, z—arc length, g—gravity, h—specific enthalpy of the arc plasma, ρ—arc plasma density
According to formula (12), to determine the plasma channel radius, it is necessary to input discharge current value and iterative calculations must be performed to use it. The values of discharge currents were introduced on the basis of the results obtained in previous iteration steps of the conducted analyzes. In the first step, the discharge diameter was assumed as 10 μm (the value was the same as in the pre-breakdown modeling). The arc plasma of the given conductivity was introduced to the numerical model in the form of a solid body (Figure 14b). The physical phenomena occurring in the plasma have been omitted. Nevertheless, this simplification is acceptable in relation to determination of active power of plasma channel. Static calculations of the electromagnetic problem were carried out to compute the discharge conduction current (Figure 16a,b) and the heat sources distribution (Figure 16c). These computations were performed iteratively, with the iteration frequency depending on the thermal analysis results discussed further in the paper.
Based on the conduction currents density (J) and the distribution of heat sources (pV), it was possible to compute the resistance of the arc (13). The proposed method uses the total active power (P) and current (I) values, obtained by adding its elementary values in individual finite elements in the discharge model (i = 1 … N). The computed resistance values were necessary to design circuit models that allow to determine operational characteristics of discharge model equipped with power source.
where: P—active power value, pVi—Joule heat of i-th finite element, Vi—volume of i-th finite element, Ji—current density in i-th finite element, Fi—external area if i-th finite element
Thermal calculations were performed as transient, using previously computed heat sources and boundary conditions characteristic for conduction and convection heat transfer. In the example, the temperature distributions in time 0–0.001 s are shown in Figure 17.
After thermal calculations in any time step, it is necessary to change the material parameters (primarily the plasma conductivity) and the supply voltage in the breakdown stage. In current algorithm, voltage source was modeled as the RC circuit. Resistance values determined based on the field modeling (13) and the capacitance (the value assumed as equal to the power source capacitor—Figure 4) were used to compute the time constant of RC circuit and source voltage values in any time step of the analysis (14). Figure 18 shows the voltage over time characteristic, obtained by the conducted analysis.
where: V0—initial voltage, τ—time
The voltage value on the electrodes, after thermal calculations, was introduced as the initial condition in the next cycle of static electromagnetic calculations. Presented algorithm can be realized iteratively until whole energy stored in the capacitor before discharge initiation is dissipated. From the moment of capacitor discharge, no current will flow in the arc channel. During the break time between next discharges, temperature distribution problem was analyzed.
7. Modeling of Temperature Distribution in the Time between Discharges
The temperature distribution after the discharge extinction, can be used to re-analyze the generation of the next discharge, carried out by using the principles given in Section 5 of this paper. For example, time required for the proposed solutions, despite the significant time consumption, enables a full analysis of discharges in liquid environments.
It is worth to point out that for simplifications of numerical analysis, two different heat transfer models were used during discharge phase and break between the next discharges analysis:
- -
- The “static” approach without fluid movements modeling (15) was used to compute heat transfer process during breakdown (in the pre-breakdown (streamer) stage, thermal analysis was not performed). The special criterion value of thermal conductivity (16) was used to include thermal convection heat transfer in the fluid [49];
- -
- The CFD model was used for heat and mass transfer analysis in the time between next discharges. Coupled equations for continuity of flow (18), momentum (19) (here presented in one dimension of Cartesians system), and energy (20) balances were computed in Ansys program. A typical turbulent k-ε model was in use. Temperature field distribution in the last step of discharge analysis was used as initial condition for CFD modeling.where: t—temperature, τ—time, c—specific heat, ρ—mass density, λ—thermal conductivity, λe—equivalent thermal conductivity (including fluid velocity), Ras—the Rayleigh number, C1, C2, n—factors depended on fluid flow type (laminar, turbulent).where: ρ—fluid mass density; p—hydrostatic pressure; ρg—mass forces; μ—dynamic viscosity; h—enthalpy; λ—thermal conductivity; λt—thermal conductivity for turbulent flow; T—temperature; pV—volumetric density of heat sources and loses.
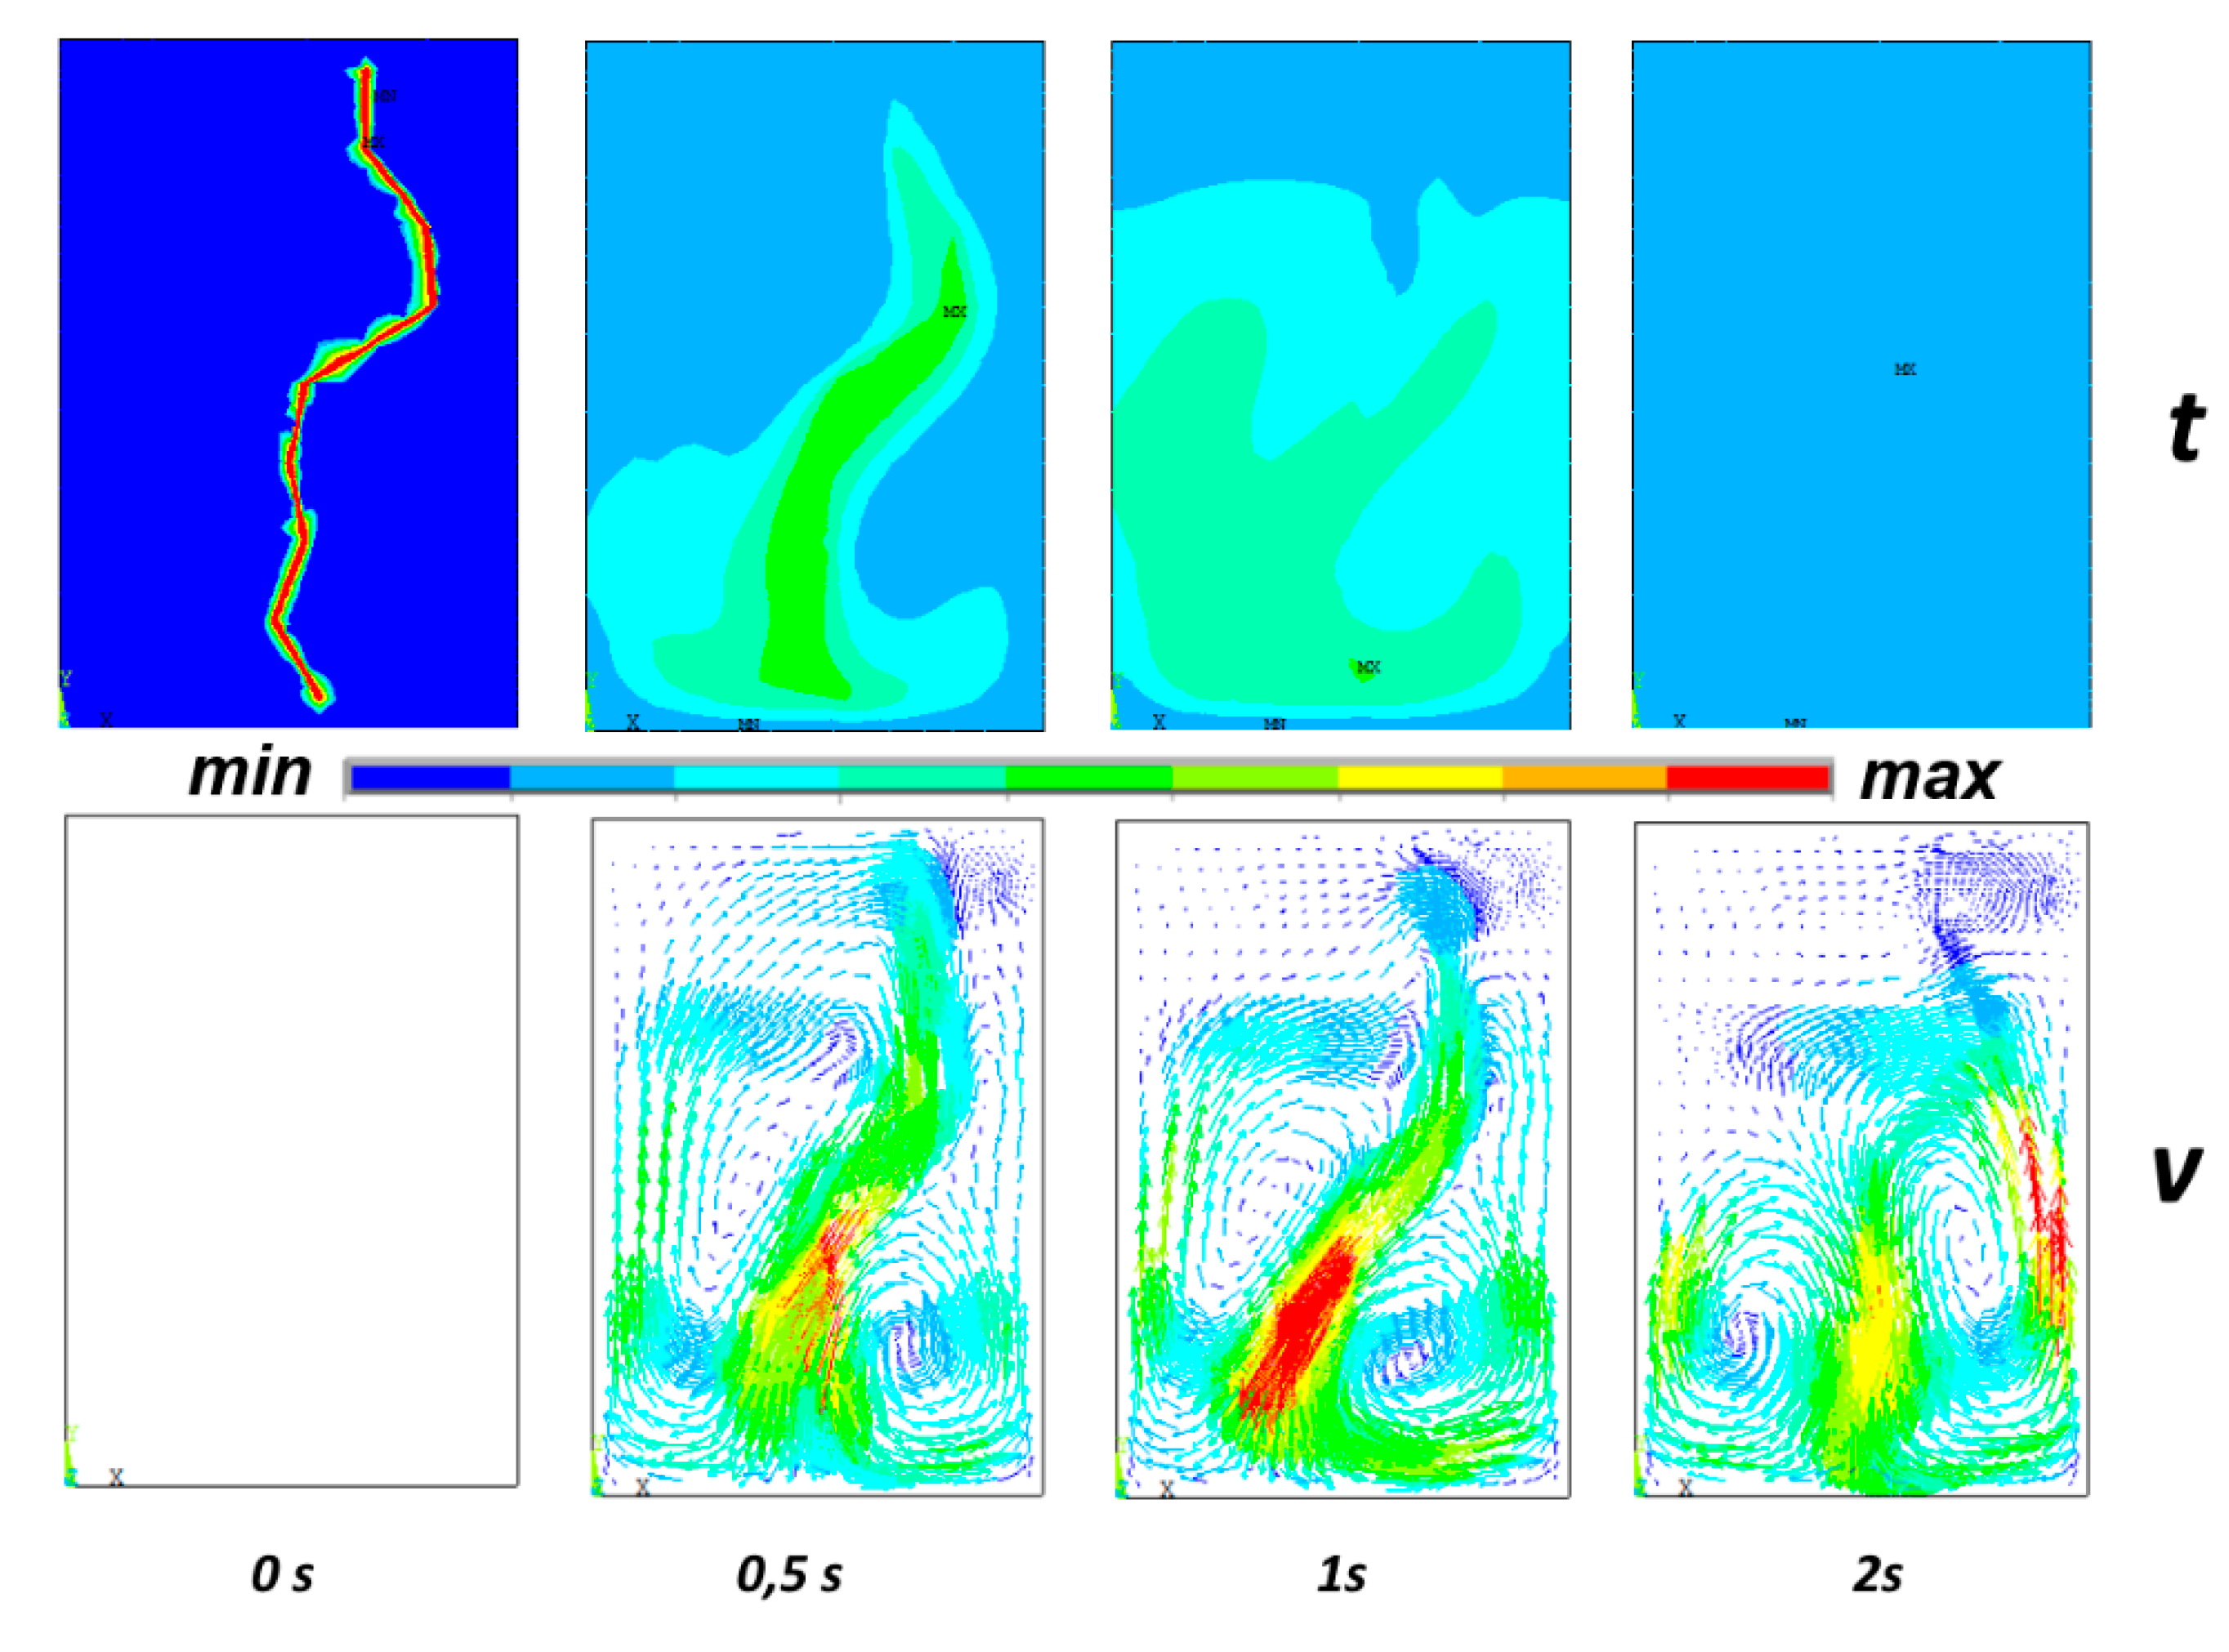
Because of the fact that the electrical permittivity and resistivity values of analyzed liquid depend on the temperature value (both parameters decrease in temperature function), calculations of thermal energy propagation in the time between the discharges seems to be a very important factor [50]. If the break time between initiation of the next discharge is too short, a large heterogeneity of temperature distribution is observed in the liquid sample. In such conditions (Equations (4) and (5)), streamers will probably propagate in the channel of the previous discharge or its vicinity. Transient thermal analysis between discharges enables to determine minimal time interval, after which, next discharge will propagate randomly, independently from the pattern of previous breakdown process. Exemplary temperature and fluid velocity distributions computed after first discharge (presented in Figure 16 and Figure 17) are presented in Figure 19.
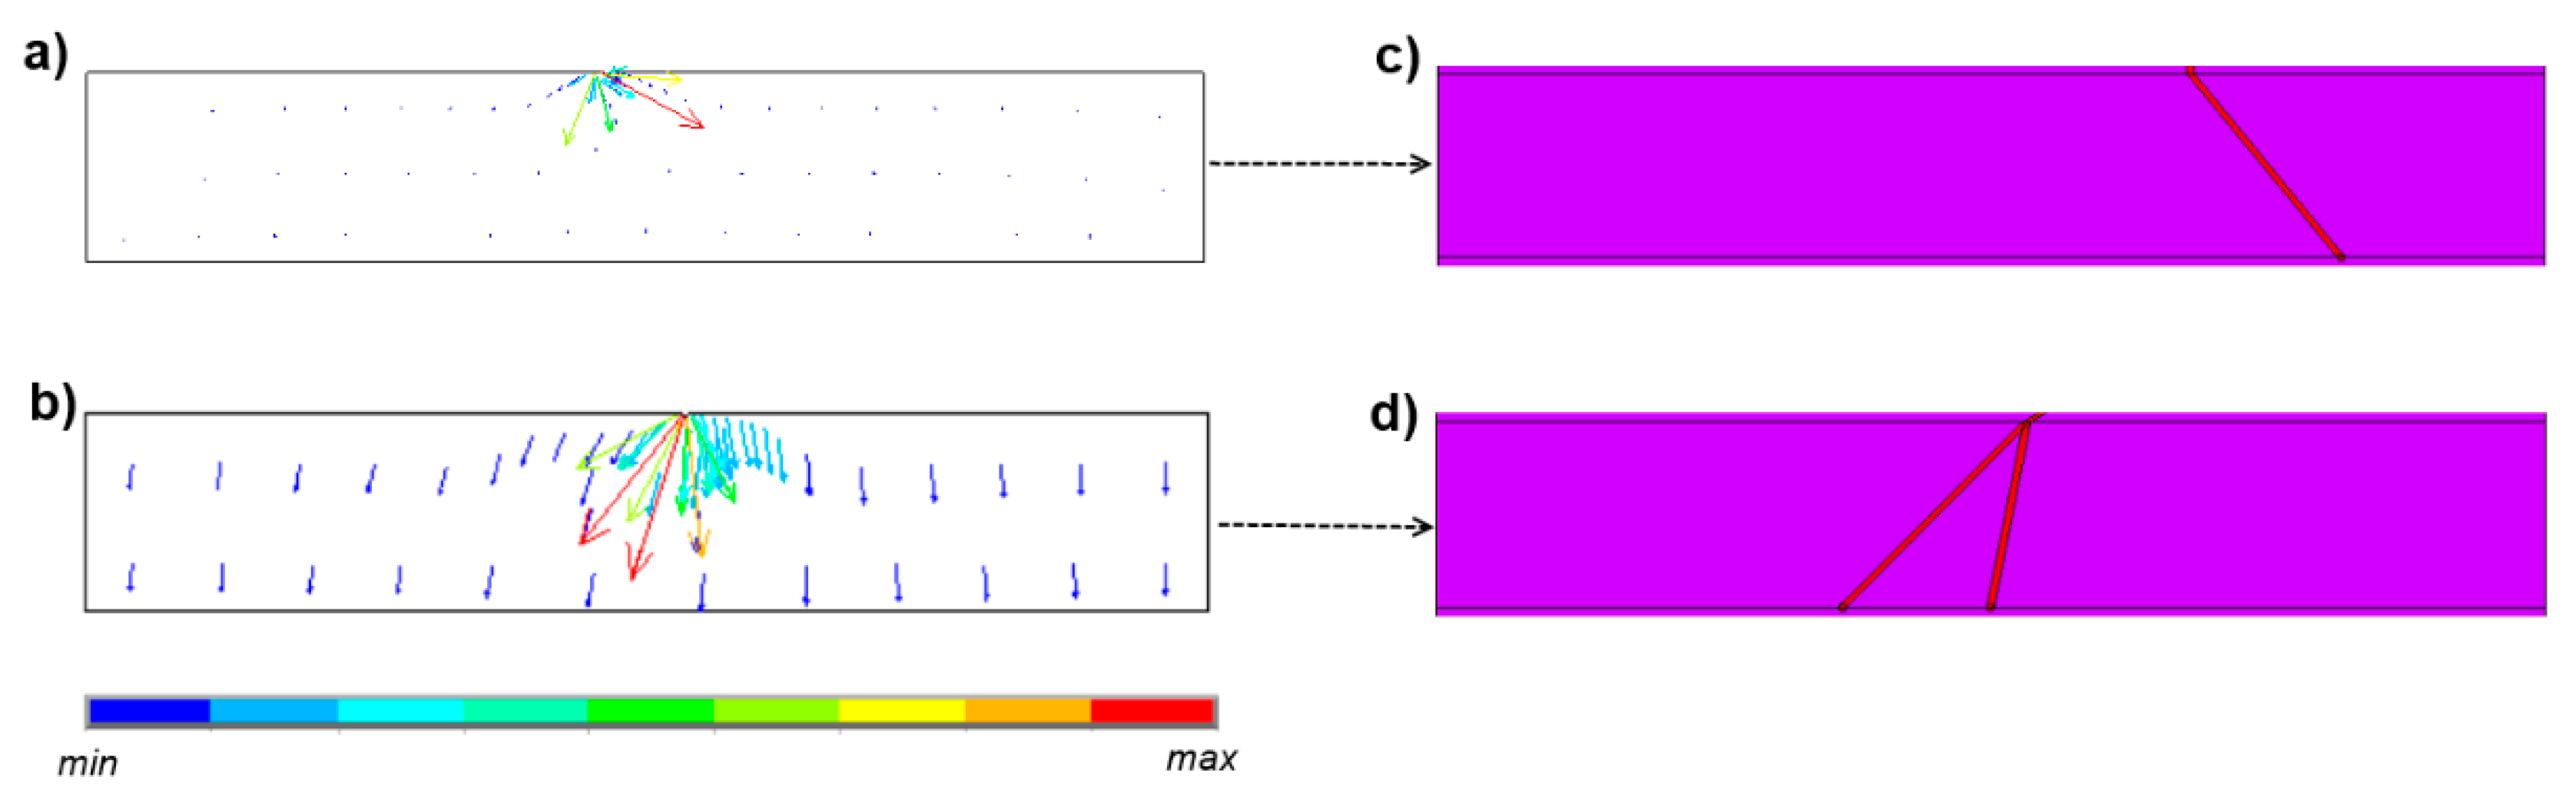
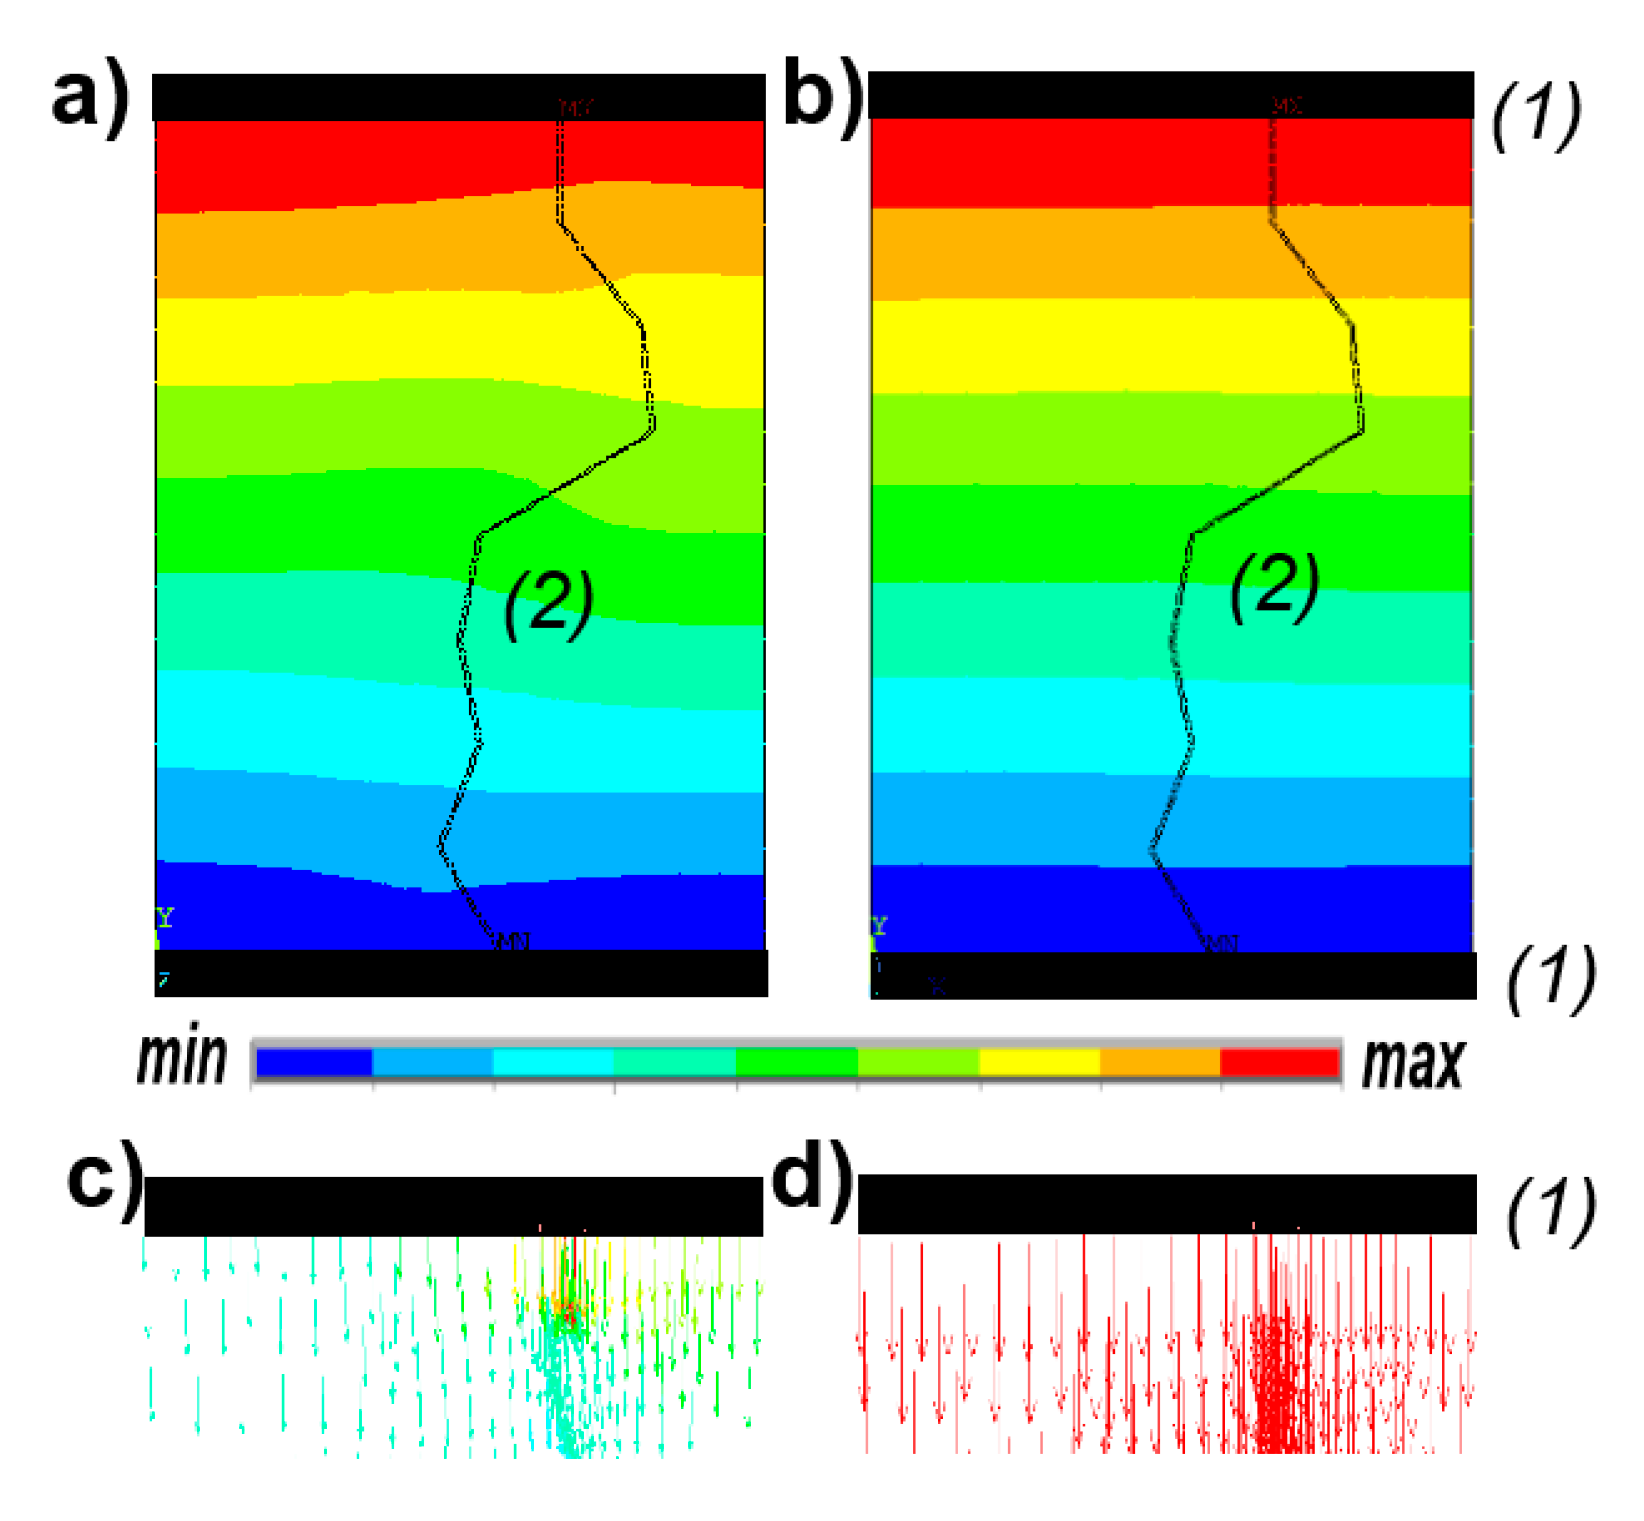
Performed CFD analysis were used to determine the electric field intensity distributions in the analyzed workload (sample of liquid juice). Temperature distributions were introduced as initial conditions of the electrostatic problem. Such approach enables to consider the temperature dependence of material parameters that are particularly important for electromagnetic simulations (ε, ρ). Based on the presented approach, it was possible to compute break time between the discharges, to guarantee random propagations of streamers and new discharge channel. In Figure 20 electric field intensities (a, b) and the gradients of electric field intensity (c, d) in vicinity of electrodes (1) are shown for the break time value of 0.5 s (a, c) and 1 s (b, d) from previous discharge. In the figure geometry of previous discharge channel is shown (2).
Simulations results, presented above, show that break time of 0.5 s is too short for initiation of next discharge. In this case, heterogeneous distribution of temperature in the analyzed fluid leads to the conclusion that the next discharge will propagate in the channel of previous one (Figure 20c). After 1 s, temperature distribution and electric field intensity distribution are more homogeneous, and random distribution of the discharge channel is probable in this case.
8. Conclusions
The article deals with modelling and simulation issues of pulse discharges occurring in liquid environments, used in many techniques. As it was mentioned in the introduction, there is a lack of universal and accurate models to simulate all stages of discharges (initiation, pre-breakdown, and arc). Most popular models of discharges in liquids (especially dielectric) were shortly described. Because of the lack of information about the parameters of discharges in juices, preliminary tests were performed. Based on the authors’ laboratory tests, most important electrical parameters of discharges were performed. Additionally, specific transient characteristic of discharge propagations were determined. Considering the obtained results, discharge was classified as “slow.” In such type of discharge, gas bubble theory model was used to describe the phenomena of streamers propagation paths. In the paper, the numerical method and algorithm for pre-breakdown were characterized. Subsequently, analysis of electric potential gradients in vicinity of the streamer’s heads were used to determine the streamer position. The proposed method, based on gradients determination and probability distribution, was used to establish total discharge path and time characteristic of discharge growth. The mentioned phase of discharge is described in Section 5 of the paper. It is worth to highlight that the proposed method enables to determine energy values based on momentary values of current and voltage.
In the Section 6, authors’ solutions in the scope of modelling of breakdown (arc) stage of discharge were detailed. For the given geometry of discharge path (determined in previous steps of the analysis), the total energy generated in the arc plasma was established using iterative calculations. Plasma conductivity and the cross section of plasma channel were computed using analytical formulas described in Section 6. Coupled analysis of electromagnetic and thermal fields (in FEM system) were performed to determine the total power of the arc and transient temperature characteristics. Circuit models were used to simulate the power source in the form of RC system. Different capacity values of series capacitor enable to form different arc current characteristics. The CFD models were used in the last stage, where temperature distribution in the time between next discharges was computed. Based on the results, it was possible to consider nonlinear material parameters for the next discharge distribution modelling.
Results presented in the paper concern discharges in juices and other liquids. All algorithms can be classified as original Authors’ solutions. It has to be highlighted, that similar solutions are rarely presented in scientific papers. Obviously, discussed models and algorithms, can be extended to obtain results characterized by higher accuracy. However, obtained results are promising and are characterized by high versatility.
Author Contributions
Conceptualization, methodology, software, writing—original draft preparation, visualization: M.W.; methodology, validation, P.K.; formal analysis, resources: S.K., writing—review and editing, supervision: S.T. All authors have read and agreed to the published version of the manuscript.
Funding
This research received no external funding.
Conflicts of Interest
The authors declare no conflict of interest.
References
- Krčma, F.; Kozáková, Z.; Vašíček, M. Generation of High Frequency Pin-hole Discharge in Water Solutions. Open Chem. 2015, 13, 620–628. [Google Scholar] [CrossRef] [Green Version]
- Vanraes, P.; Nikiforov, A.Y.; Leys, C. Electrical Discharge in Water Treatment Technology for Micropollutant Decomposition. In Plasma Science and Technology—Progress in Physical States and Chemical Reactions; BoD: Norderstedt, Germany, 2016. [Google Scholar] [CrossRef] [Green Version]
- Marsilia, L.; Espieb, S.; Andersona, J.; MacGregor, S. Plasma inactivation of food-related microorganisms in liquids. Radiat. Phys. Chem. 2002, 65, 507–513. [Google Scholar] [CrossRef]
- Charis, M.G. (Ed.) Sustainable Food Systems from Agriculture to Industry. In Improving Production and Processing; Academic Press: Cambridge, MA, USA, 2018; ISBN 978-0-12-811935-8. [Google Scholar]
- Klíma, M.; Slavíček, P.; Šíra, M.; Čižmár, T.; Vaněk, P. HF plasma pencil and DC diaphragm discharge in liquids—Diagnostics and applications. Czechoslov. J. Phys. 2006, 56, B1051–B1056. [Google Scholar] [CrossRef]
- Bousetta, N.; Vorobiev, E. Extraction of valuable biocompounds assisted by high voltage electrical discharges: A review. C. R. Chim. 2014, 17, 197–203. [Google Scholar] [CrossRef]
- Barba, F.J.; Parniakov, O.; Pereira, S.A.; Wiktor, A.; Grimi, N.; Boussetta, N.; Saraiva, J.A.; Raso, J.; Martin-Belloso, O.; DorotaWitrowa-Rajchert; et al. Current applications and new opportunities for the use of pulsed electric fields in food science and industry. Food Res. Int. 2015, 77, 773–798. [Google Scholar] [CrossRef]
- Boussetta, N.; Lesaint, O.; Vorobiev, E. A study of mechanisms involved during the extraction of polyphenols from grape seeds by pulsed electrical discharges. Innov. Food Sci. Emerg. Technol. 2013, 19, 124–132. [Google Scholar] [CrossRef]
- Anpilov, A.M.; Barkhudarov, E.M.; Christofi, N.; Kop’ev, V.A.; Kossyi, I.A.; Taktakishvili, M.I.; Zadiraka, Y. Pulsed high voltage electric discharge disinfection of microbially contaminated liquids. Appl. Microbiol. 2002, 35, 90–94. [Google Scholar] [CrossRef] [Green Version]
- Abida, J.; Rayees, B.; Masoodi, F.A. Pulsed light technology: A novel method for food preservation. Int. Food Res. J. 2014, 21, 839–848. [Google Scholar]
- Boussetta, N.; Reess, T.; Vorobiev, E.; Lanoisellé, J.L. Pulsed electrical discharges: Principles and application to extraction of biocompounds. In Enhancing Extraction Processes in the Food Industry; Taylor & Francis: Oxfordshire, UK; CRC Press: Boca Raton, FL, USA, 2012; pp. 145–172. [Google Scholar]
- Stará, Z.; Krčma, F.; Procházková, J. Physical Aspects of Diaphragm Discharge Creation Using Constant Dc High Voltage in Electrolyte Solution. Acta Tech. CSAV 2008, 53, 277–286. [Google Scholar]
- Sun, A.B.; Teunissen, J.; Ebert, U. 3d particle simulation of positive streamer inception froma needle electrode in supercritical nitrogen. IEEE Trans. Plasma Sci. 2014, 42, 2416–2417. [Google Scholar] [CrossRef] [Green Version]
- Ushakov, V.Y.; Klimkin, V.F.; Korobeynikov, S.M. Impulse Breakdown of Liquids; Springer Science & Business Media: Berlin, Germany, 2007; ISBN 978-3-540-72759-0. [Google Scholar]
- Gournay, P.; Lesaint, O. On the gaseousnature of positive filamentary streamers inhydrocarbon liquids. II: Propagation, growth andcollapse of gaseous filaments in pentane. J. Phys. D Appl. Phys. 1994, 27, 2117–2127. [Google Scholar] [CrossRef]
- Sun, A.; Huo, C.; Zhuang, J. Formation mechanism of streamer dischargesin liquids: A review. High Volt. 2016, 1, 74–80. [Google Scholar] [CrossRef]
- Kupershtokh, A.L.; Karpov, D.I. Simulation of the development of branching streamer structures in dielectric liquids with pulsed conductivity of channels. Tech. Phys. Lett. 2006, 32, 406–409. [Google Scholar] [CrossRef]
- Madshaven, I.; Hestad, O.L.; Unge, M.; Hjortstam, O.; Åstrand, P.O. Photoionization model for streamer propagation mode change in simulation model for streamers in dielectric liquids. Plasma Res. Express 2020, 2. [Google Scholar] [CrossRef]
- Qin, J.; Pasko, V.P. On the propagation of streamers in electrical discharges. J. Phys. D Appl. Phys. 2014, 47, 435202. [Google Scholar] [CrossRef]
- Joshi, R.; Kolb, J.F.; Xiao, S.; Schoenbach, K.H. Aspects of plasma in water: Streamer physics and applications. Plasma Process. Polym. 2009, 6, 763–777. [Google Scholar] [CrossRef]
- Shaw, S.J.; Spelt, P.D.M. Critical strength of an electric field whereby a bubble can adopt a steady shape. Proc. R. Soc. A 2009, 465, 3127–3143. [Google Scholar] [CrossRef]
- Lisitsyn, I.V.; Nomiyama, H.; Katsuki, S.; Akiyama, H. Streamer discharge reactor for water treatment by pulsed power. Rev. Sci. Instrum. 1999, 70, 3457–3462. [Google Scholar] [CrossRef]
- Malik, M.A.; Ghaffar, A.; Malik, S.A. Water purification by electrical discharges. Plasma Sources Sci. Technol. 2001, 10, 82–91. [Google Scholar] [CrossRef]
- Sunka, P. Pulse electrical discharges in water and their applications. Phys. Plasmas 2001, 8, 2587–2594. [Google Scholar] [CrossRef]
- Schoenbach, K.H.; Joshi, R.; Stark, R.; Dobbs, F.; Beebe, S. Bacterial decontamination of liquids with pulsed electric fields. IEEE Trans. Plasma Sci. 2000, 7, 637–645. [Google Scholar] [CrossRef]
- Starikovskiy, A.Y.; Yang, Y.; I Cho, Y.; Fridman, A. Non-equilibrium plasma in liquid water: Dynamics of generation and quenching. Plasma Sources Sci. Technol. 2011, 20, 024003. [Google Scholar] [CrossRef]
- Kolb, J.F.; Joshi, R.P.; Xiao, S.; Schoenbach, K.H. Streamers in water and other dielectric liquids. J. Phys. D Appl. Phys. 2008, 41, 234007. [Google Scholar] [CrossRef]
- Atrazhev, V.M.; Vorob’ev, V.S.; Timoshkin, I.V.; MacGregor, S. Mechanisms of Impulse Breakdown in Liquid: The Role of Joule Heating and Formation of Gas Cavities. IEEE Trans. Plasma Sci. 2010, 38, 2644–2651. [Google Scholar] [CrossRef]
- Nuter, R.; Gremillet, L.; Lefebvre, E.; Lévy, A.; Ceccotti, T.; Martin, P. Field ionization model implemented in Particle in Cell code and applied to laser-accelerated carbon ions. Phys. Plasmas 2011, 18, 033107. [Google Scholar] [CrossRef]
- Jadidian, J.; Zahn, M.; Lavesson, N.; Widlund, O.; Borg, K. Impulse breakdown delay in liquid dielectrics. Appl. Phys. Lett. 2012, 100, 192910. [Google Scholar] [CrossRef] [Green Version]
- Jadidian, J.; Zahn, M.; Lavesson, N.; Widlund, O.; Borg, K. Stochastic and deterministic causes of streamer branching in liquid dielectrics. J. Appl. Phys. 2013, 116, 063301. [Google Scholar] [CrossRef] [Green Version]
- Qian, J.; Joshi, R.P.; Schamiloglu, E.; Gaudet, J.; Woodworth, J.R.; Lehr, J. Analysis of polarity effects in the electrical breakdown of liquids. J. Phys. D Appl. Phys. 2006, 39, 359–369. [Google Scholar] [CrossRef]
- Zener, C. A theory of the electrical breakdown of solid dielectrics. Proc. R. Soc. Lond. Ser. AContain. Pap. A Math. Phys. Character 1934, 145, 523–529. [Google Scholar]
- Ivanov, I.; Nam, C.; Kim, K. Exit point in the strong field ionization process. Sci. Rep. 2017, 7, 39919. [Google Scholar] [CrossRef] [Green Version]
- Martinez, R.J.; Farrell, J. Quantifying Electric Field Enhancement of Water Dissociation Rates in Bipolar Membranes. Ind. Eng. Chem. Res. 2019, 58, 782–789. [Google Scholar] [CrossRef]
- Sullivan, F.O.; Lee, S.-H.; Zahn, M.; Pettersson, L.; Liu, R.; Hjortstam, O.; Auletta, T.; Gafvert, U. Modeling the Effect of Ionic Dissociation on Charge Transport in Transformer Oil. In Proceedings of the 2006 IEEE Conference on Electrical Insulation and Dielectric Phenomena, Kansas City, MO, USA, 15–18 October 2006; pp. 756–759. [Google Scholar] [CrossRef]
- Korobeinikov, S.M. Bubble deformation in an electric field. Inzh. Fiz. Zh. 1979, 36, 882–884. [Google Scholar] [CrossRef]
- Korobeynikov, S.M.; Melekhov, A.V.; Sinikh, Y.N.; Soloveichik, Y.G. Effect of Strong Electric Fields on the Behavior of Bubbles in Water. High Temp. 2001, 39, 368–372. [Google Scholar] [CrossRef]
- Rózga, P. Wyładowania elektryczne w układzie elektrod ostrze-izolowana płyta w wybranych cieczach dielektrycznych przy wysokim napięciu udarowym piorunowym. Prz. Elektrotechniczny 2016, 10, 151–154. [Google Scholar] [CrossRef]
- Shneider, M.N.; Pekker, M. Pre-breakdown processes in a dielectric fluid in inhomogeneous pulsed electric Fields. J. Appl. Phys. 2015, 117, 224902. [Google Scholar] [CrossRef] [Green Version]
- Walczak, J.; Pacholski, K.; Kowalczyk, R. Wybrane Modele Matematyczne Udaru Piorunowego. Zeszyty Naukowe Wydziału Elektrotechniki i Automatyki Politechniki Gdańskiej 2017, 55, 77–80. [Google Scholar]
- Oziembłowski, M.; Dróżdż, T.; Nawara, P.; Nęcka, K.; Lis, S.; Kiełbasa, P.; Tomasik, M.; Ostafin, M. Synergiczne oddziaływanie Pulsacyjnych Pól Elektrycznych (PEF) oraz innych metod na płynne produkty spożywcze. Prz. Elektrotechniczny 2016, 12, 121–124. [Google Scholar] [CrossRef]
- Mathcad User’s Guide; MathSoft: Cambridge, MA, USA, 2002.
- Wesołowski, M.; Nęcka, K.; Dróżdż, T.; Kiełbasa, P. Koncepcja modelowania wyładowania pulsacyjnego pola elektrycznego (PEF) w produktach przemysłu rolno—spożywczego. Prz. Elektrotechniczny 2018, 12, 119–123. [Google Scholar] [CrossRef]
- Wciślik, M. Analityczne modele łuku elektrycznego. Prz. Elektrotechniczny 2008, 84, 115–117. [Google Scholar]
- Klajn, A.; Bielówka, M. Parametry materiałowe plazmy łuku powietrznego w ujęciu mikroskopowym. Prz. Elektrotechniczny 2017, 93, 189–192. (In Polish) [Google Scholar] [CrossRef]
- Terzija, V.; Preston, G.; Popov, M.; Terzija, N. New static airarc EMTP model of long arc in free air. IEEE Trans. Power Deliv. 2011, 26, 1344–1353. [Google Scholar] [CrossRef]
- Wesołowski, M.; Niedbała, R.; Kucharski, D. Problems of Temperature Control of Nonlinear Electrothermal Devices. Prz. Elektrotechniczny 2011, 87, 1–5. [Google Scholar]
- Wesołowski, M.; Niedbała, R.; Czaplicki, A.; Hauser, J. Wybrane zagadnienia dokładności modelowania numerycznego indukcyjnych układów grzejnych. Prz. Elektrotechniczny 2011, 87, 168–172. [Google Scholar]
- Komarov, V.; Wang, S.; Tang, J. Permittivity and Measurements. In Encyclopedia of RF and Microwave Engineering; John Wiley & Sons: Hoboken, NJ, USA, 2005; pp. 3693–3711. ISBN 0-471-27053-9. [Google Scholar]
Figure 1.
Formation of the streamer near the electrode. (a) Bubble cluster; (b) protrusion; (c) gas channels.
Figure 1.
Formation of the streamer near the electrode. (a) Bubble cluster; (b) protrusion; (c) gas channels.

Figure 2.
Ionization of atoms under the influence of the field. (a) No ionization at low intensity fields; (b) ionization in the area of high intensity.
Figure 2.
Ionization of atoms under the influence of the field. (a) No ionization at low intensity fields; (b) ionization in the area of high intensity.

Figure 3.
Ion dissociation under the influence of the field: (a) no ionization at low intensity fields; (b) ionization in the area of high intensity.
Figure 3.
Ion dissociation under the influence of the field: (a) no ionization at low intensity fields; (b) ionization in the area of high intensity.

Figure 4.
View of working chamber (a) and block diagram for HVED test stand (b). 1—electrodes; 2—juice container.
Figure 4.
View of working chamber (a) and block diagram for HVED test stand (b). 1—electrodes; 2—juice container.

Figure 5.
Time course of high voltage impulse.

Figure 6.
Schematic diagram of the calculation algorithm.

Figure 7.
Geometry of the system (a) and division of the discharge space with “virtual” surfaces (b). 1—electrodes; 2—juice; 3—“virtual” surfaces dividing the discharge area.
Figure 7.
Geometry of the system (a) and division of the discharge space with “virtual” surfaces (b). 1—electrodes; 2—juice; 3—“virtual” surfaces dividing the discharge area.

Figure 8.
Distribution of the electric potential in the model not including (a) and including the gas bubble (c) and the bubble model on the surface of the upper electrode (b). 1—electrode; 2—discharge area; 3—gas bubble.
Figure 8.
Distribution of the electric potential in the model not including (a) and including the gas bubble (c) and the bubble model on the surface of the upper electrode (b). 1—electrode; 2—discharge area; 3—gas bubble.

Figure 9.
Vectors of the electric field intensity (a), (b) and streamer models (c), (d) in subsequent layers of the discharge space.
Figure 9.
Vectors of the electric field intensity (a), (b) and streamer models (c), (d) in subsequent layers of the discharge space.

Figure 10.
Plasma heating process (a) and characteristic of plasma conductivity vs. temperature (b).
Figure 10.
Plasma heating process (a) and characteristic of plasma conductivity vs. temperature (b).

Figure 11.
Algorithm for streamer propagation calculation.

Figure 12.
Distributions of potential values during prebreakdown stage (streamers) for different timesteps. (a): τ = 3.6 µs; (b): τ = 9.6 µs; (c): τ = 12 µs
Figure 12.
Distributions of potential values during prebreakdown stage (streamers) for different timesteps. (a): τ = 3.6 µs; (b): τ = 9.6 µs; (c): τ = 12 µs

Figure 13.
Densities of currents in streamers at various times (a–d) of the discharge development.

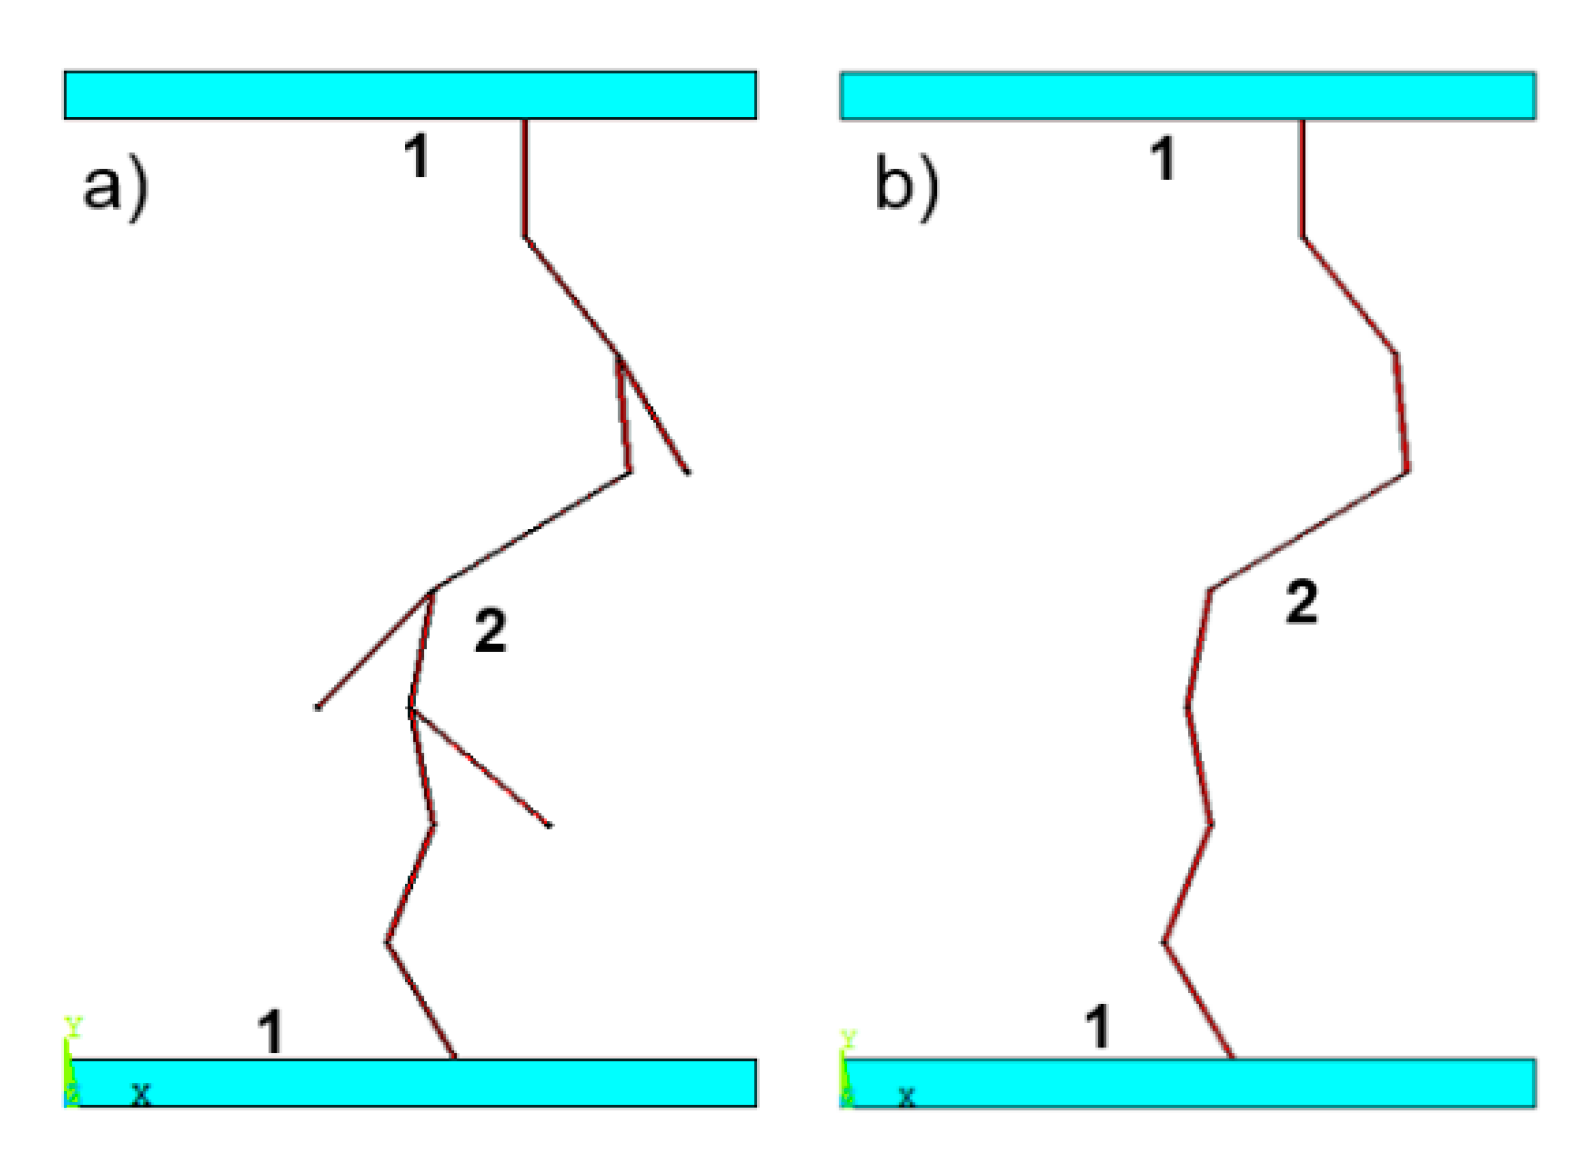
Figure 14.
The geometry of the discharge obtained on the basis of streamers propagation analysis (a) and adopted for the analysis of the breakdown stage (b). 1—electrodes; 2—discharge.
Figure 14.
The geometry of the discharge obtained on the basis of streamers propagation analysis (a) and adopted for the analysis of the breakdown stage (b). 1—electrodes; 2—discharge.

Figure 15.
Plasma conductivity as a function of temperature.

Figure 16.
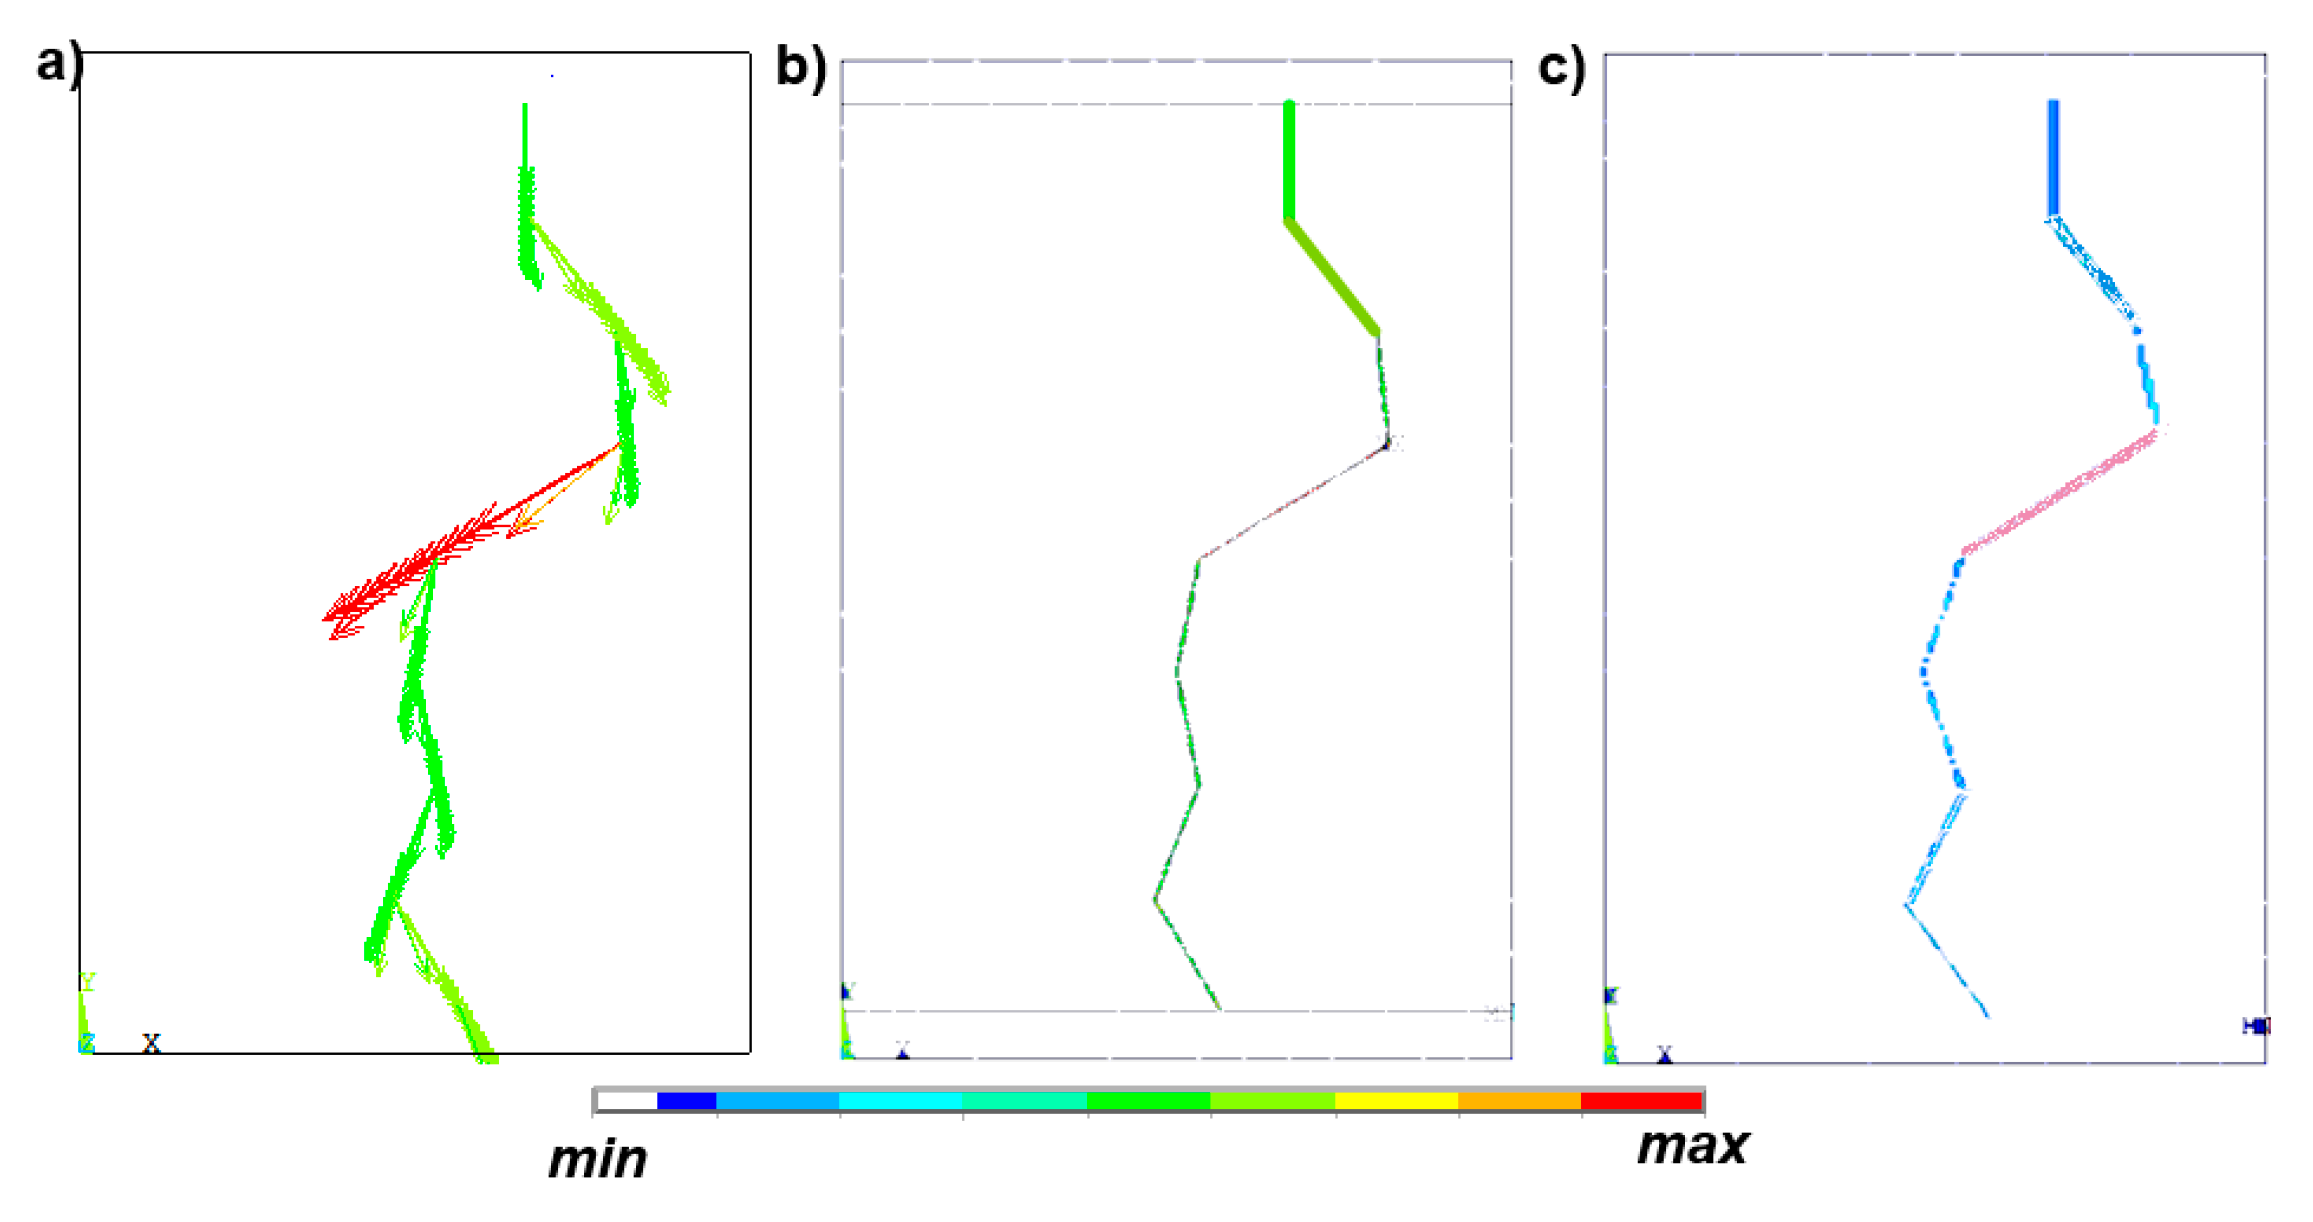
Current density vectors (a), current density distribution (b), and heat sources distribution (c) in the breakdown (arc) stage of discharge analysis.
Figure 16.
Current density vectors (a), current density distribution (b), and heat sources distribution (c) in the breakdown (arc) stage of discharge analysis.

Figure 17.
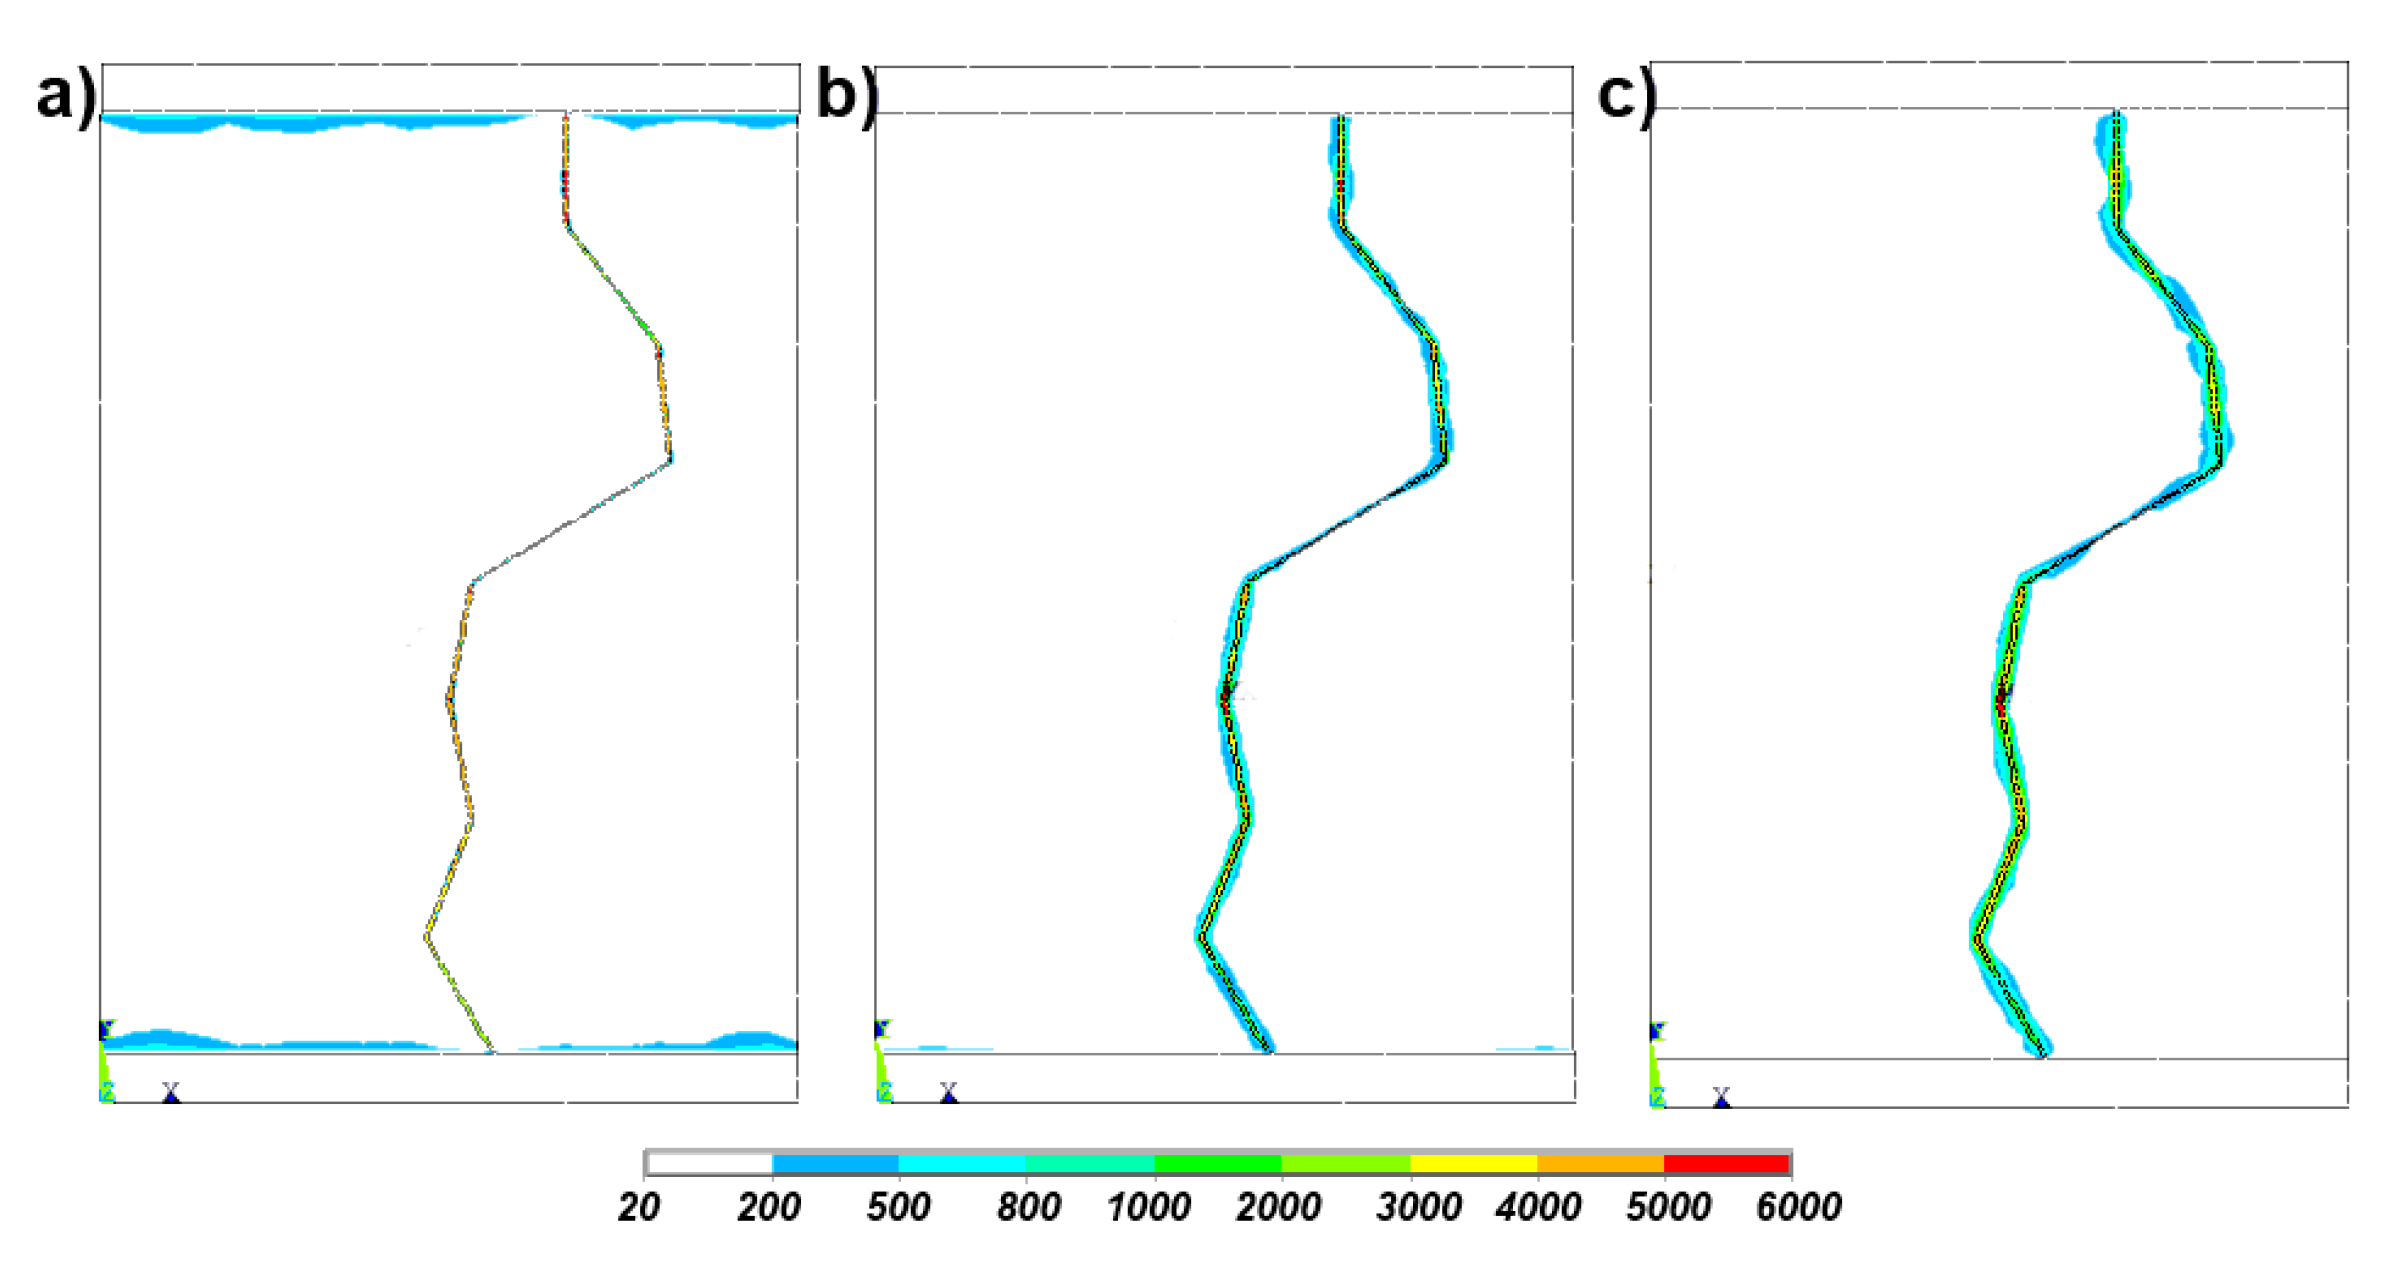
Temperature distribution in the sample in subsequent moments. (a) 0.0001 s; (b) 0.0005 s; (c) 0.001s.
Figure 17.
Temperature distribution in the sample in subsequent moments. (a) 0.0001 s; (b) 0.0005 s; (c) 0.001s.

Figure 18.
The voltage course during the simulated discharge.

Figure 19.
Temperature distribution (t) and fluid velocity vectors (v) in analyzed sample in different time steps.
Figure 19.
Temperature distribution (t) and fluid velocity vectors (v) in analyzed sample in different time steps.

Figure 20.
Electromagnetic field distribution (a,b) and electromagnetic field gradients (c,d) distribution for nonlinear parameters (ε, ρ) after 0.5 s (a,c) and 1 s (b,d) from previous discharge. 1—electrode; 2—geometry of previous discharge channel.
Figure 20.
Electromagnetic field distribution (a,b) and electromagnetic field gradients (c,d) distribution for nonlinear parameters (ε, ρ) after 0.5 s (a,c) and 1 s (b,d) from previous discharge. 1—electrode; 2—geometry of previous discharge channel.

© 2020 by the authors. Licensee MDPI, Basel, Switzerland. This article is an open access article distributed under the terms and conditions of the Creative Commons Attribution (CC BY) license (http://creativecommons.org/licenses/by/4.0/).
Share and Cite
MDPI and ACS Style
Wesołowski, M.; Tabor, S.; Kiełbasa, P.; Kurpaska, S. Electromagnetic and Thermal Phenomena Modeling of Electrical Discharges in Liquids. Appl. Sci. 2020, 10, 3900. https://doi.org/10.3390/app10113900
AMA Style
Wesołowski M, Tabor S, Kiełbasa P, Kurpaska S. Electromagnetic and Thermal Phenomena Modeling of Electrical Discharges in Liquids. Applied Sciences. 2020; 10(11):3900. https://doi.org/10.3390/app10113900
Chicago/Turabian StyleWesołowski, Marcin, Sylwester Tabor, Paweł Kiełbasa, and Sławomir Kurpaska. 2020. "Electromagnetic and Thermal Phenomena Modeling of Electrical Discharges in Liquids" Applied Sciences 10, no. 11: 3900. https://doi.org/10.3390/app10113900
Note that from the first issue of 2016, this journal uses article numbers instead of page numbers. See further details here.