Water Use and Soil Moisture Relationships on Western Juniper Trees at Different Growth Stages
by
 , and
, and
Mohamed A. B. Abdallah
1,*, 
Nicole Durfee
2,
Ricardo Mata-Gonzalez
1,
Carlos G. Ochoa
1 and
Jay S. Noller
3 1
Department of Animal and Rangeland Sciences, Oregon State University, Corvallis, OR 97331, USA
2
Water Resources Graduate Program, Ecohydrology Lab, Oregon State University, Corvallis, OR 97331, USA
3
Department of Crop and Soil Sciences, Oregon State University, Corvallis, OR 97331, USA
*
Author to whom correspondence should be addressed.
Water 2020, 12(6), 1596; https://doi.org/10.3390/w12061596
Submission received: 21 April 2020
/
Revised: 29 May 2020
/
Accepted: 31 May 2020
/
Published: 4 June 2020
(This article belongs to the Section Hydrology)
Abstract
:An enhanced understanding of plant water uptake is critical for making better-informed management decisions involving vegetative manipulation practices aimed to improve site productivity. This is particularly true in arid and semiarid locations where water is a scarce, yet precious commodity. In this project, we evaluated the interannual and seasonal variability of soil moisture and transpiration in sapling, juvenile, and mature western juniper (Juniperus occidentalis) trees in a semiarid rangeland ecosystem of central Oregon, USA. Transpiration levels were greatest in mature juniper trees in an untreated juniper watershed (Jensen WS), while the lowest transpiration levels were observed in juniper saplings in a treated watershed (Mays WS) where most mature juniper trees were removed in 2005. Significant differences (p ≤ 0.05) in leaf water potential levels observed between predawn and midday readings for all juniper growth stages indicated water is lost over the course of the day. Results showed seasonal precipitation was highly variable over the course of the study (2017 through 2019) and this was reflected in soil water available for tree uptake. This resulted in considerable intra- and inter-annual variation in transpiration. In years with greater winter precipitation amounts (2017 and 2019), juniper transpiration rates were highest during the summer, followed by spring, autumn, and winter. On average, transpiration rates during the summer in the wettest (329 mm) year 2017 were 115 and 2.76 L day−1 for mature and sapling trees, respectively. No data were collected for juvenile trees in 2017. In the drier (245 mm) year 2018, higher transpiration rates were observed in the spring. On average, spring transpiration rates were 72.7, 1.61, and 1.00 L day−1 for mature, juvenile, and sapling trees, respectively. Study results highlight the sensitivity of western juniper woodlands to variations in seasonal precipitation and soil moisture availability.
Keywords:
Great Basin; woodlands; sap flow; soil moisture; transpiration; leaf water potential; catchment; juniper1. Introduction
The replacement of grassland vegetation by encroaching woody species in rangelands is a global phenomenon occurring during the past century [1,2,3]. The progressive shift from grasses to woody species has altered ecosystem processes such as soil carbon sequestration [4], soil nutrient cycles [5], and hydrological processes [6]. Juniper (Juniperus spp.) encroachment is one of the most large-scale changes occurring in North American rangelands [7,8]. The spatial distribution of juniper has increased by one order of magnitude since the mid-19th century throughout the Great Basin [9]. Increases in areal extent have varied between 30% and 625% [9], and encroachment rates have varied between 0.4% and 4.5% per year [10]. The expansion of juniper is commonly attributed to a mix of biophysical and anthropogenic factors including overgrazing, increases in atmospheric carbon dioxide, and fire suppression [11,12]. Since the late 1890s, western juniper (Juniperus occidentalis spp. occidentalis Hook.) has been actively encroaching into grassland and sage steppe ecosystems of Oregon and has increased from 170,000 ha in 1936 [13] to more than 1.4 million ha [14].
Juniper woodlands provide ecosystem services such as biodiversity, aesthetic beauty, wildlife habitat [15,16,17], and products such as firewood, fencing posts, and commercial energy production [12]. Juniper plays an important role in carbon sequestration in aboveground biomass [18]. Western juniper dominance in sagebrush steppe has several negative consequences, including reductions in herbaceous production and diversity [19,20], deterioration of wildlife habitat [21], and higher erosion and runoff potential [12,22]. High levels of juniper encroachment into rangeland ecosystems can limit the growth of understory vegetation by outcompeting it for light, soil moisture, and soil nutrients [23]. High levels of juniper stands may significantly increase evapotranspiration losses or reduce recharge by canopy interception. Some studies attempting to quantify these effects have described the potential negative effects of juniper expansion [24,25,26,27,28,29,30] with others finding negligible effects of juniper on water yield [31,32,33]. Western juniper cutting has resulted in no net change in ecosystem carbon pools when comparing cut versus uncut areas [18]. Several studies indicate western juniper control could have positive results on hydrologic processes such as increased soil moisture and reduced evapotranspiration losses [29,30,34,35].
In arid and semiarid regions, water is the major ecological resource limiting plant growth [36]. Water potential is a critical driving force influencing water movement in vegetation [37]. Values of leaf water potential are translated in relation to the volume flux of water through plants and the pathway characteristics of water transfer from soil to leaf [38]. When leaf water potential is near zero, the driving force inducing water movement in the xylem is low; yet, at extremely negative water potentials, cavitation strongly reduces hydraulic conductance. In both cases, transpiration is limited [39]. Research shows that the daily average stand-level value of western juniper transpiration is 0.4 mm during the summer months, which is largely driven by available soil water [29] and 0.09–0.21 mm during the growing season (leaf level model, [40]). Ashe juniper (Juniperus ashei) was found to transpire approximately 150 L day−1 during the growing season, which is estimated to be equivalent to 400 mm year−1 [41].
When trees progress from juvenile to young mature stages, roots may access soil moisture at deeper layers [42]. The different rooting depths at different growth stages [43] can affect soil water and transpiration dynamics. According to Mollnau et al. [29] and West et al. [44], mature juniper trees draw soil water from deeper soil depths because of their deep root system. Juvenile junipers remaining on a site after adult juniper removal have the potential to rapidly take up residual water resources due to reduced competition with adult trees [45]. Transpiration is the larger component of evapotranspiration in semiarid systems and can even exceed rainfall amounts due to groundwater uptake by deep-rooted trees [46]. In arid regions, tree roots can extend beyond the soil profile into the underlying bedrock layers and take up substantial amounts of water from weathered bedrock after soil water has become unavailable [47]. According to Sternberg et al. [48], Rose et al. [49], McCole and Stern [43], and Schwinning [50], at least 70% of the plant-available water, which was maximized during the dry season, was contributed by the roots in the weathered bedrock, while the remaining ≤ 30% was provided by the shallow soil (≤0.75 m).
Examining the relationship between transpiration and soil moisture is important for an improved understanding of the effects of vegetation on water resources [51,52]. Considering the inherent variability of moisture availability [53], the accurate monitoring of plant water uptake in arid and semiarid environments requires long-term, continuous studies of plant transpiration [54]. Sap flow, typically measured in the xylem, is the movement of water in the roots, stems and branches of plants [55]. Sap flow (SF) techniques are robust in monitoring transpiration continuously from component species of an ecosystem over several years, with an adequate frequency to detect responses to environmental conditions [56]. A common argument for juniper control is the amount of potential water saving due to the reduction in the number of trees. Yet, a good understanding of water use by the combined effect of mature trees and sapling regrowth following mature juniper removal is not well documented. This information is critical to better inform management decisions related to juniper control.
This study aimed to better understand how juniper encroachment affects water availability in a semiarid rangeland ecosystem site in central Oregon in the USA. Study objectives were to (1) assess transpiration of mature and juvenile trees in a juniper-dominated watershed and in regrowth juniper saplings in an adjacent watershed where juniper was removed in 2005 and (2) characterize transpiration and soil moisture relationships in juniper trees at different growth stages (sapling, juvenile, and mature). We hypothesized that mature juniper trees are consuming considerable amounts of water in the untreated watershed and that the vast number of juniper saplings re-populating the treated watershed can also draw substantial water amounts. We theorized that soil moisture availability driven by winter precipitation could significantly affect western juniper transpiration rates in these water-scarce ecosystems.
2. Materials and Methods
2.1. Description of Study Site
This study took place at the Camp Creek Paired Watershed Study (CCPWS) site, 27 km northeast of Brothers, Oregon, USA. The CCPWS site is a long-term collaborative research project located (43.96° Latitude; −120.34° Longitude) in central Oregon [30,57]. The CCPWS site encompasses an area of approximately 400 ha and includes two adjacent watersheds, one treated (116 ha, Mays WS) and one untreated (96 ha, Jensen WS) (Figure 1). Elevation at the study site ranges from 1370 m to 1524 m. The dominant overstory vegetation in Jensen WS is western juniper. In autumn 2005, approximately 90% of the western juniper trees were cut in Mays WS using chainsaws, leaving big sagebrush (Artemisia tridentata) as the dominant overstory vegetation. Following western juniper removal in Mays WS, changes in vegetation composition have been reported, including western juniper regrowth (sapling juniper trees) and greater presence of shrubs and grasses [20]. The average slope for each watershed is around 25% with similar distribution of aspects [58]. The average annual precipitation (2009–2017) at the study site is 358 mm. Most precipitation in the area occurs as a mix of rain and snow between October and March, with sporadic rainfall events occurring during spring and summer.
Over the years, the CCPWS site has been instrumented to monitor multiple hydrologic (e.g., soil moisture, groundwater, streamflow) and weather (e.g., precipitation, air temperature, solar radiation) variables [30]. Data from this equipment are described in Ochoa et al. [30] and additional monitoring equipment, including sap flow probes and other soil moisture stations were used in this study.
Three soil series, Westbutte, Madeline, and Simas, are present in both watersheds. Westbutte very stony loam and Madeline loam, the two main soil types, comprise about 70% to 74% of the study area [58]. The Westbutte series is classified as loamy-skeletal, mixed, superactive, frigid Pachic Haploxerolls. The Madeline series is classified as clayey, smectitic, frigid Aridic Lithic Argixerolls. The Simas series is classified as fine, smectitic, mesic Vertic Palexerolls. The Westbutte and Madeline series consist of moderately shallow to deep, well-drained soils, formed of colluvium derived from basalt, tuff and andesite. The Simas series consists of very deep, well-drained soils, formed of loess and colluvium derived from tuffaceous sediments [59]. The Jensen WS mainly consists of 48% Madeline, 26% Westbutte, and 21% Simas series, while the Mays WS consists of 50% Westbutte, 20% Madeline, and 3% Simas series [58]. Average soil depth in both watersheds ranges from 0.6 m (Westbutte soil series) to 1.5 m (Simas soil series) [59].
2.2. Field Data Collection
2.2.1. Soil Physical Properties
In May 2019, soil samples for characterizing soil texture, water content, bulk density and porosity were collected from an area near (<1 m) the soil moisture sensor locations in both watersheds (Figure 2). Soil moisture at field capacity (θFC) and at permanent wilting point (θPWP) were determined to clarify the potential of soil water availability for plant growth. We determined available water content (AWC) from θFC–θPWP [61] (Appendix A, Table A1). Data obtained using the θ sensors were compared against θFC and θPWP estimated values.
2.2.2. Sap Flow Measurements and Transpiration Estimates
The two watersheds were instrumented to monitor western juniper sap flow. Sap flow was measured using two different techniques. For the saplings, which are located in the Mays WS (Mays-East and Mays-West), and the medium size (juvenile) trees in the Jensen-Upslope location, we used the stem heat balance (SHB) technique [62,63]. For large mature trees (Jensen-Valley), we used the thermal dissipation probe (TDP) technique [63,64,65].
Four sapling trees were equipped with sap flow gauges [66] in the Mays WS. For the Mays-East location, one SHB gauge model SGB16 and one SGB1 (Dynamax Inc., Houston, TX, USA) were attached to selected branches in saplings S1 and S2, respectively, to measure sap flow [67]. To scale sap flow from a branch to the whole sapling tree, we used the technique described by Kirmse and Norton [68]. The branches containing sap flow gauges were designated as reference units and their lengths were measured. For the whole sapling, we added the lengths of each individual branch including the main stem. We estimated the percentage of the reference branch to the whole sapling as 10.3% for S1 and 16.6% for S2. The other two saplings (S3 and S4 trees) were each equipped with an SHB gauge (Model SGB25, Dynamax Inc., Houston, TX, USA) in their main stems in the Mays-West location.
In addition, two juveniles (J1 and J2 trees) were equipped each with an SHB gauge (Model SGB35, Dynamax Inc., Houston, TX, USA) in their main stems in the Jensen-Upslope location. The diameters of the equipped stems/branches and related parameters are reported in (Table 1). The SHB gauges, comprising a flexible heater that itself is encircled by foam insulation, were wrapped around branches/main stems [63]. Gauges were wrapped in aluminum foil to shield them from rain and direct solar radiation. The SHB instrument description and theory of operation are described in detail in [63,69,70]. Sap flow measurements were taken every 15 min and recorded in dataloggers (SapIP dataloggers, Dynamax Inc., Houston, TX, USA). The sap flow rate (F) in the stems/branches in (g h−1) was calculated using the following equation [67].
- Qf = The convective heat flux carried by the sap in Watts;
- Cp = The specific heat capacity of xylem sap, assumed to be that of water (4.186 J g−1 k−1);
- Td and Tu = Temperatures in Celsius measured at an equal distance downstream (d) and upstream (u) from the heated stem. Each logger channel has a resolution and accuracy of +/−0.33 uV [71].
Sap flow measurements in mature juniper trees at the Jensen-Valley location were taken using TDP probes (Models TDP-30 and TDP-50, Dynamax Inc., Houston, TX, USA). The TDP probes were attached to a CR10X data logger (Campbell Scientific Inc., Logan, UT, USA) set to record data every five minutes. The CR10X analog outputs have an accuracy of ±5 mV; ±2.5 mV (0° to 40 °C) and resolution of 0.67 mV [72]. Seven mature (M1 to M7) trees were initially used for sap flow measurements (two trees were equipped with TDP-50 sensors and five trees with TDP-30 sensors). Thermocouple needles 1.2 and 1.65 mm in diameter (TDP-30 and TDP-50, respectively) were installed as a vertically aligned pair 40 mm apart within the sapwood of each tree. A set of probes were implanted on the north and south side of each tree in areas between 1 to 2 m above ground level. Plastic putty was installed around the needles for water protection and foam quarter-spheres were tightly secured on both sides of the needles to protect the wire from bending stress and to provide thermal insulation to the needles [73]. Reflective bubble wrap was installed around the tree trunks for additional insulation. There are some limitations to sap flow measurements, including probe spacing and stem geometry; various wound responses to probe implantation may cause heat ratios to vary over time; implanting sensors can cause mechanical damage and interrupt flow by occlusion or blocking of the plant’s vascular tissues [74]. When necessary, probes were relocated to different trees [54]. The general methodology is described by Köstner et al. [55], Lu [75] and Lu et al. [76].
A probe pair (two needles) linked via thermocouples was installed in the xylem of the tree. The upper probe was connected to a power source with a current constantly inducing heat into the sap stream while recording the temperature of the passing sap. The lower probe remained unheated. The temperature difference (dT) between the heated and unheated probes reflects the amount of water passing the probes [29]. When sap flow occurs, the sap transports part of the heat and, therefore, the temperature of the heated probe drops [77]. When no flow occurs, the dT reaches a maximum value [77]. The value of maximum temperature difference (dTm), necessary for calculating sap flow, is determined for each probe pair from the dTm measured during the night period, when transpiration is assumed to equal zero [77]. Dimensionless parameter (K) was calculated using the following equation [78,79].
Average sap flow velocity (cm s−1) was calculated using the following equation [78].
Sap flow velocity then was converted to sap flow rate (g h−1) using the equation.
where:
SA = Sapwood cross-sectional area (cm2).
Leaf area was calculated for each tree using the following pre-established equation developed by Miller et al. [80].
where:
- Y = Leaf area (m2);
- X = Basal circumference (m).
Then, sapwood area (Table 2), which is a necessary parameter to calculate whole-tree water use, was estimated using the following equation [80].
- Y = Leaf area (m2);
- X = Sapwood area (m2).
Sap flow volume was then calculated on a daily (L day−1) basis.
Juniper-sapling sap flow data were recorded for nine different periods from late June 2017 through October 2019. Sap flow data for juvenile trees were recorded for six different periods from April 2018 through September 2019. For mature juniper, sap flow data were recorded for nine different periods from late May 2017 to September 2019.
2.2.3. Leaf Water Potential Measurements
Leaf water potential (Ψ) measurements were used to predict water use for juniper. The Ψ measurements were taken within a period of 2 to 3 days in the middle of each month, from July 2018 to September 2019, using a Scholander pressure chamber [81] (PMS Instrument Co., Albany, OR, USA). Predawn measurements (Ψpd) began between 3 and 5 a.m. and were completed before sunrise. Midday measurements (Ψmd) were taken at approximately 12:30 p.m. The Ψ measurements were taken from the trees monitored with sap flow sensors. Vegetative stems (n = 3–5) were clipped from each tree using small scissors during each sampling period. The measurements were made in the field immediately after clipping the stems. Vegetative stems for two mature trees were not accessible, so only five mature trees were measured.
2.2.4. Soil Moisture Content
At the Jensen WS, soil volumetric water content (θ) data were obtained using two previously installed monitoring stations [30]. One of the stations is installed at the sap flow–juvenile trees upstream (Jensen-Upslope) location and the other one is installed at the sap flow–mature trees in the valley (Jensen-Valley) location (see Figure 1). In each station, a vertical network of three θ sensors placed at 0.2, 0.5, and 0.8 m soil depth was installed at under-canopy and inter-canopy sites. The under-canopy θ sensors were located 1 m northwest of one of the juvenile trees in the Jensen-Upslope location and at 1 m north of mature tree M1 in the Jensen-Valley location. The inter-canopy θ sensors were located 7 m north of the under-canopy θ sensors in both juvenile and mature juniper locations.
At the Mays WS, two additional θ monitoring stations were installed for this study. One was installed at the Mays-East site and the other one at the Mays-West site (see Figure 1). Only one vertical network of three θ sensors (Model CS655, Campbell Scientific, Inc., Logan, UT, USA), which were placed at 0.2, 0.5, and 0.8 m soil depth, was installed in the inter-canopy at both sites. All θ sensors were tested in air, water, and dry sand conditions prior to field installation. All sensors were factory calibrated and they operated within manufacturer specifications. The sensors were not calibrated for site-specific soil conditions. All soil moisture stations were set to record θ hourly.
2.3. Transpiration and Soil Moisture Relations
Hourly θ data across all soil depths (0.2, 0.5, 0.8 m) were used to generate a daily averaged θ value for the entire 0 to 0.8 m soil profile (θtot) at each monitoring station. These θtot values were compared against SF levels obtained for all trees in a specific monitoring station. Sensor outputs for SF were scaled to daily flow rates (L day−1).
2.4. Statistical Data Analyses
Multiple comparison analyses (Bonferroni t-test) were performed to compare the transpiration means of two trees or more within each juniper growth stage and across various time periods. Differences between Ψpd and Ψmd for all juniper growth stages were evaluated with a paired Student’s t-test. A Kruskal–Wallis One Way Analysis of Variance (ANOVA) on ranks test was performed to assess θ variability between inter-canopy and under-canopy zones in each location in the Jensen WS. Daily averaged θ values at each sensor depth were used in this analysis. We used non-linear regression analyses to evaluate the association between juniper water uptake and θtot for the three juniper growth stages (sapling, juvenile, and mature). SigmaPlot® version 14.0 (Systat Software, Inc., San Jose, CA, USA) was used for all statistical analyses.
3. Results
3.1. Transpiration—Juniper Growth Stages Scale
3.1.1. Sapling (Regrowth) Juniper in Mays WS
Table 3 shows seasonal transpiration estimates based on juniper sapling SF data recorded between 1 July 2017 and 31 October 2019. The highest mean transpiration values were obtained for S1 (2.59 L day−1) and S2 (2.93 L day−1) during the summer of 2017. Saplings S1 and S2 were significantly different (p ≤ 0.05) during all but the summer in 2017. A sharp decline in transpiration rates occurred for both S1 and S2 during the autumn season in 2017, with a mean value of 0.43 (±0.07) L day−1. The lowest transpiration value of 0.12 L day−1 was observed for S1 in both autumn 2018 and winter 2019.
When comparing all-sapling transpiration by season, no significant difference (p = 0.06) between spring and summer seasons in 2018 was observed, with mean values of 1.00 (±0.068) L day−1 and 0.79 (±0.03) L day−1, respectively. In the summer of 2018, transpiration was 1.3 times greater for saplings in the Mays-East location than in the Mays-West location, with S2 having significantly (p ≤ 0.05) greater water use compared to the other saplings. From October 2018 through March 2019, what can be considered the wet time of year, transpiration values were the lowest, with no significant (p ≥ 0.05) differences between autumn 2018 and winter 2019 seasons. In the spring of 2019, trees became more active and transpiration was significantly (p ≤ 0.05) greater than during the previous autumn and winter seasons, with an average of 0.74 (±0.04) L day−1. Transpiration values were 1.4 times greater in the summer (1.02 ± 0.04 L day−1) when compared to 2019 spring transpiration values. In early autumn 2019, transpiration declined significantly, reaching the minimum values, with an average of 0.42 (±0.04) L day−1. The results from the ANOVA test showed that S2 had the highest transpiration when compared to the other trees for most seasons. Across seasonal periods, the highest transpiration values were observed in summer 2017, followed by spring 2018, then by summer 2019 (Table 3).
3.1.2. Juvenile (Medium Growth Stage) Juniper in Jensen WS
Similar to that observed for juniper saplings in 2018, transpiration rates between juvenile trees were not different (p = 0.33) between spring (1.61 ± 0.09 L day−1) and summer (1.33 ± 0.08 L day−1) seasons (Table 4). Transpiration rates for both juvenile trees decreased substantially to a mean value of 0.27 (±0.02) L day−1 in autumn of 2018, which corresponded with the expected reduction in evaporative demand toward the end of the year. Likewise, as observed in juniper saplings, transpiration values were the lowest from October 2018 through March 2019, with no significant (p ≥ 0.05) differences between autumn 2018 and winter 2019 seasons. No statistical difference (p = 0.58) in mean transpiration rates between juvenile trees was observed in spring versus summer of 2019. Mean transpiration rates for both trees yielded a daily average of 1.76 (±0.15) L day−1 in the spring and 2.00 (±0.11) L day−1 in the summer. Similar to with the saplings, water consumption was not different (p = 1.00) in the spring season for the years 2018 and 2019. The results from the ANOVA test showed there was no statistical difference (p ≥ 0.05) in transpiration rates between juvenile trees for most seasons.
3.1.3. Mature Juniper in Jensen WS
Mean transpiration rates were significantly different between the two mature (M3 and M4) trees monitored in spring 2017. Mean transpiration of both trees was 89.6 (±5.80) L day−1 (Table 5). Similar to that observed in the juniper sapling locations, mean water consumption of all mature trees (115.2 ± 3.56 L day−1) was significantly higher in the summer of 2017 than any other season. In contrast to sapling and juvenile trees, water uptake by mature trees was 1.3 times greater in spring (72.7 ± 2.59 L day−1) than summer (57.0 ± 2.49 L day−1) for 2018. Similar to that observed in sapling and juvenile trees, transpiration of juniper mature trees sharply declined to its lowest values from October 2018 through March 2019. However, water uptake by juniper mature trees was 1.3 times greater in autumn 2018 (16.0 ± 2.26 L day−1) than winter 2019. In addition, mature juniper used the same amount of water in spring (53.5 ± 2.15 L day−1) and summer (60.1 ± 1.42 L day−1) for the year 2019, similar to juveniles and different from saplings. The results from the ANOVA test showed that transpiration rates were higher for M1 when compared to all other trees for most seasons. The M1 tree has the largest leaf area of all trees evaluated (see Table 2).
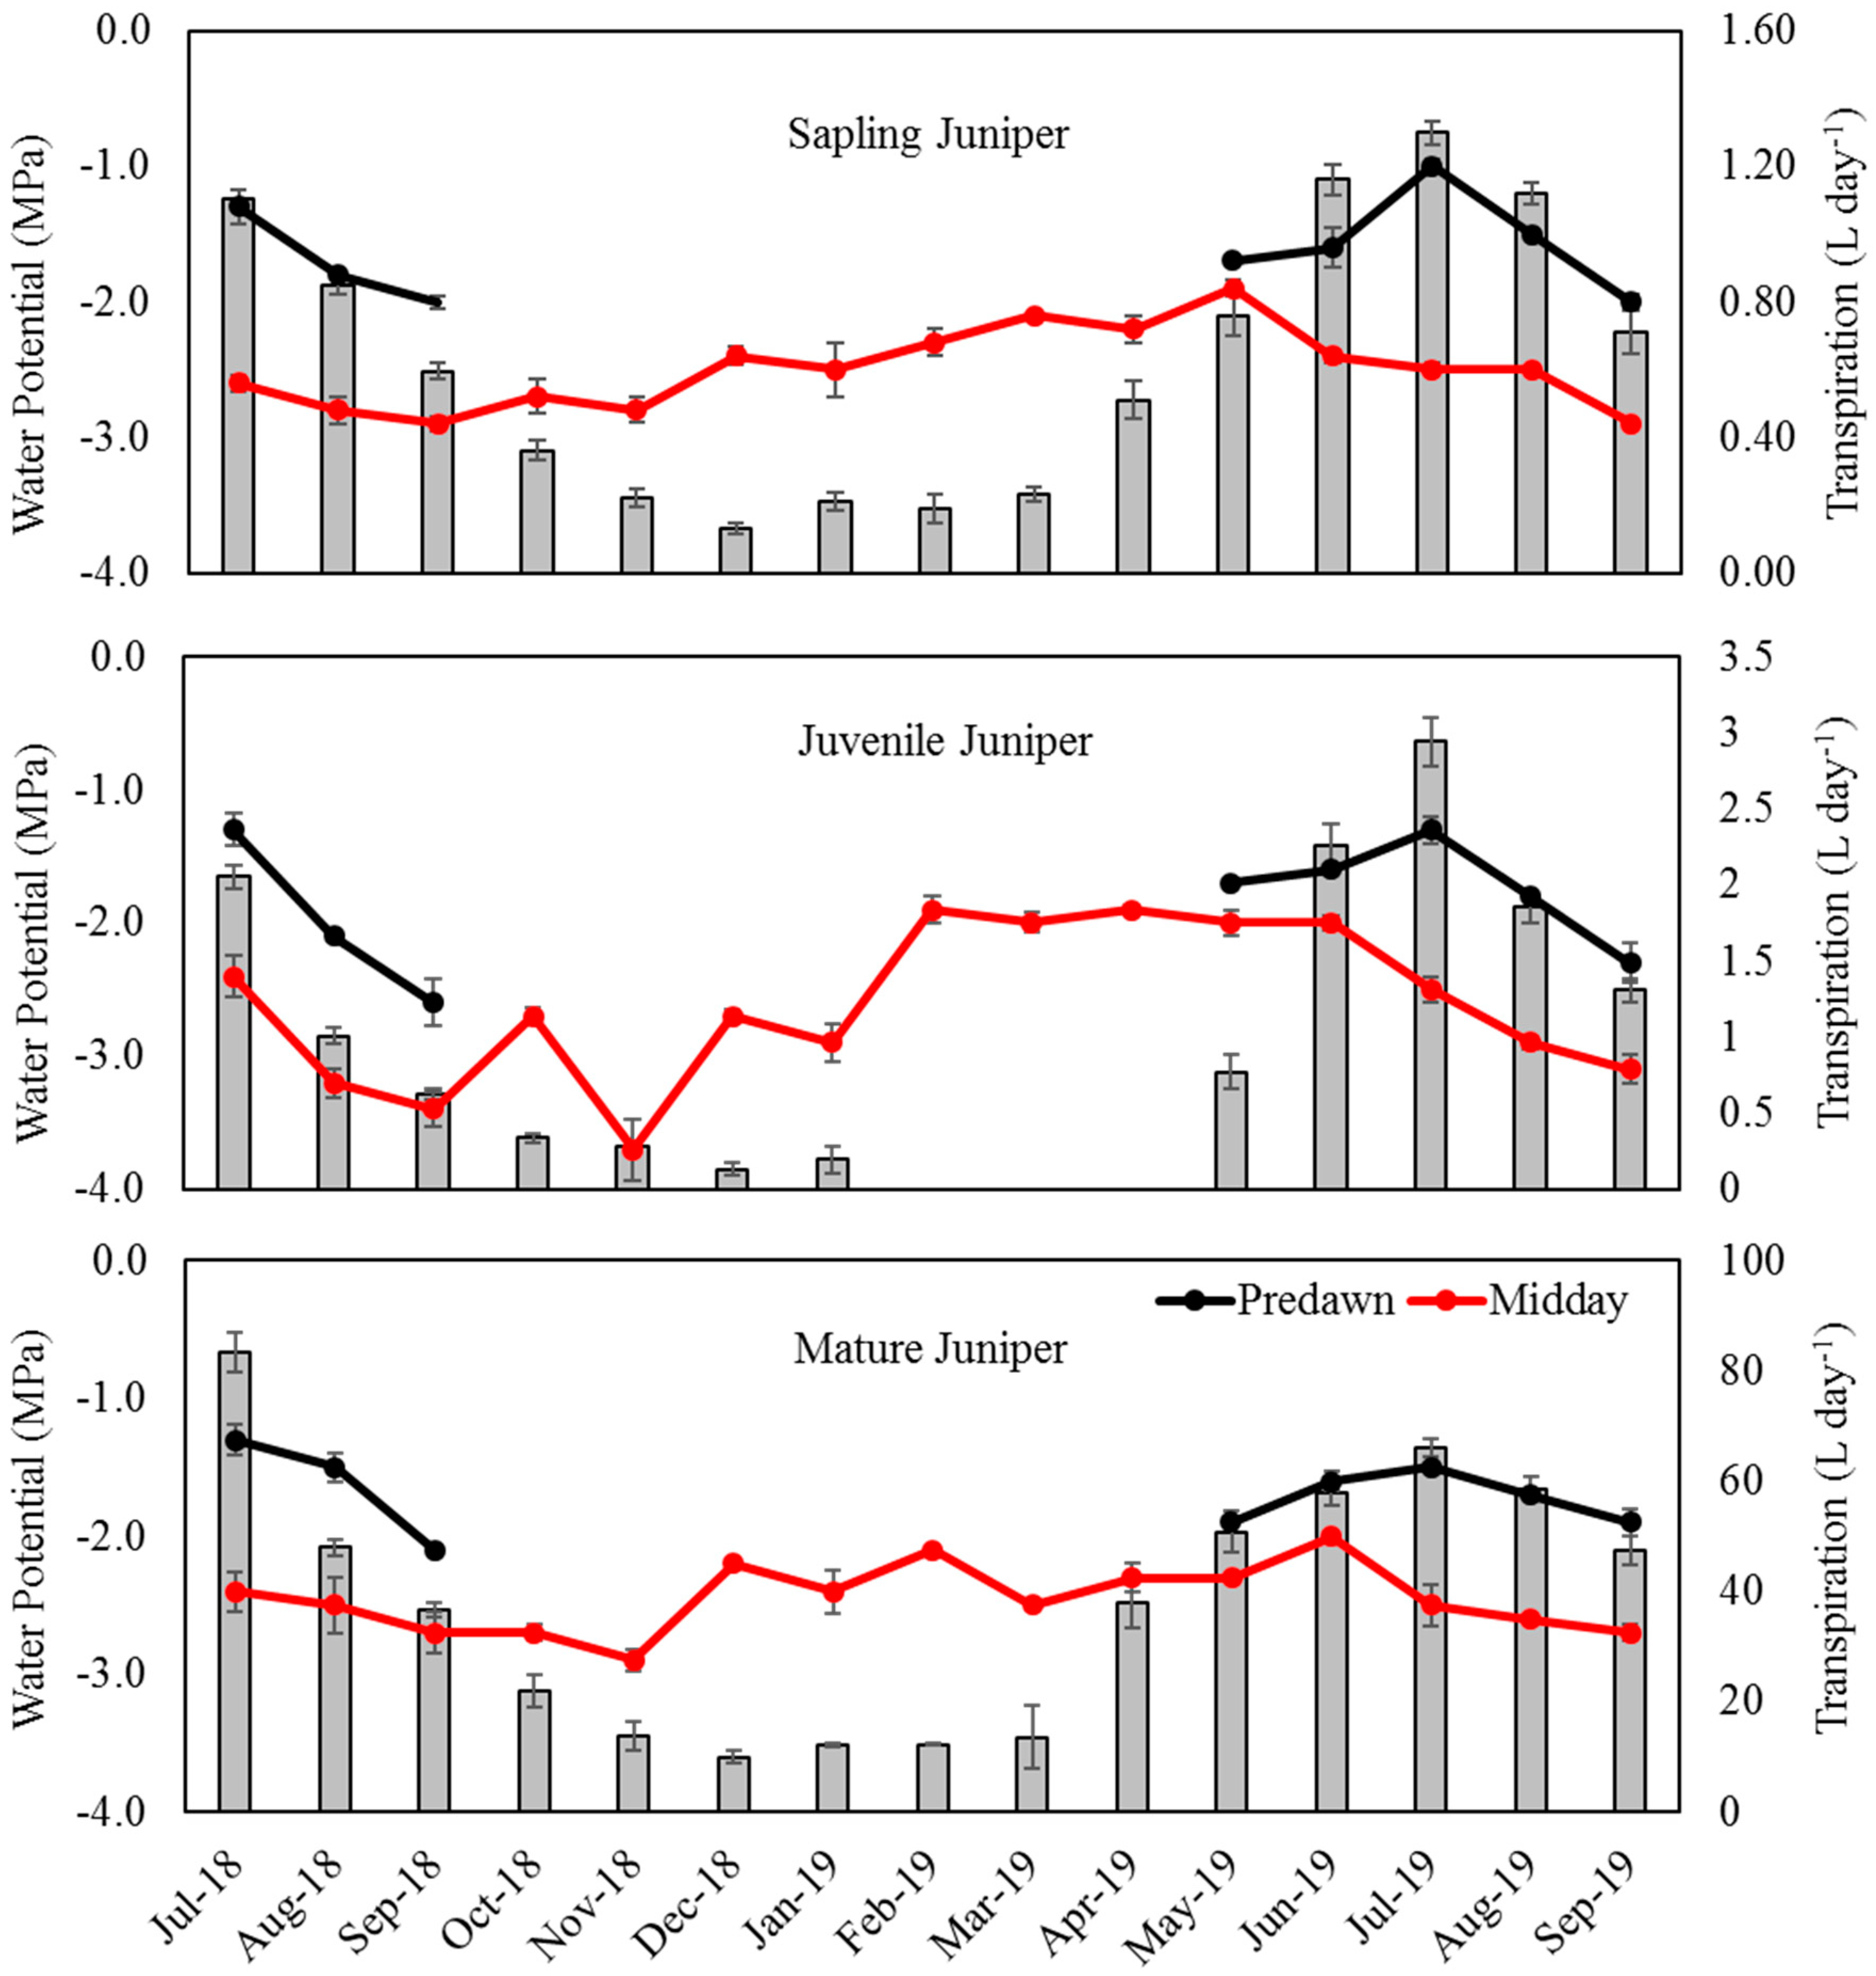
3.2. Leaf Water Potential
For all juniper stages, predawn water potential Ψpd gradually increased (more negative values) between July and September in both years (Figure 3), reaching as high as −2.6 (±0.18) MPa for the juvenile trees, reflecting lower water availability. According to Miller and Shultz [82], there is a gradual increase in Ψpd with the progression of summer drought, even though soil water remains available in the lower depths, and juniper roots are observed to be well distributed throughout the soil profile. Due to freezing or near-freezing air temperatures, Ψpd measurements were not taken from October 2018 to April 2019. In 2019, Ψpd significantly declined (less negative) from May through July for all juniper stages, indicating a gradual increase in transpiration that peaked in July. Following that, a steep rise in Ψpd, accompanied with less water consumption occurred from July to September.
Midday water potentials Ψmd for the saplings ranged from a high (more negative) of −2.9 MPa in September for both years (±0.05 and ±0.03; 2018 and 2019 respectively) to a lower (less negative) value of −1.9 (±0.06) MPa in May 2019. In contrast to the saplings, Ψmd for juveniles ranged from a high of −3.7 MPa (±0.23) in November 2018 to a low of −1.9 MPa (±0.01) in February 2019. Like the juveniles, Ψmd for mature trees was most negative in November 2018, −2.9 MPa (±0.08), and least negative in June 2019, −2.0 MPa (±0.03). In general, Ψmd for all juniper growth stages was highest during late summer and early autumn, when western juniper constantly started to use less water. The general trend of decline in Ψmd (less stress) in late winter and spring 2019 is an indication of transpiration activity in juniper.
Paired t-test results showed there were significant differences between Ψpd and Ψmd for all juniper stages, indicating some degree of water loss occurring over the course of the day. This is consistent with the findings of a study on Juniperus osteosperma conducted by West et al. [44]. Western juniper exhibited a comparable range in Ψpd and Ψmd throughout the study. During a part of the growing season (May to July), Ψpd and Ψmd values gradually diverged, corresponding with an increase in transpiration peaking in July (Figure 3). However, these values started to diverge less during summer (July to September) when transpiration started to gradually decline.
3.3. Soil Moisture Variability
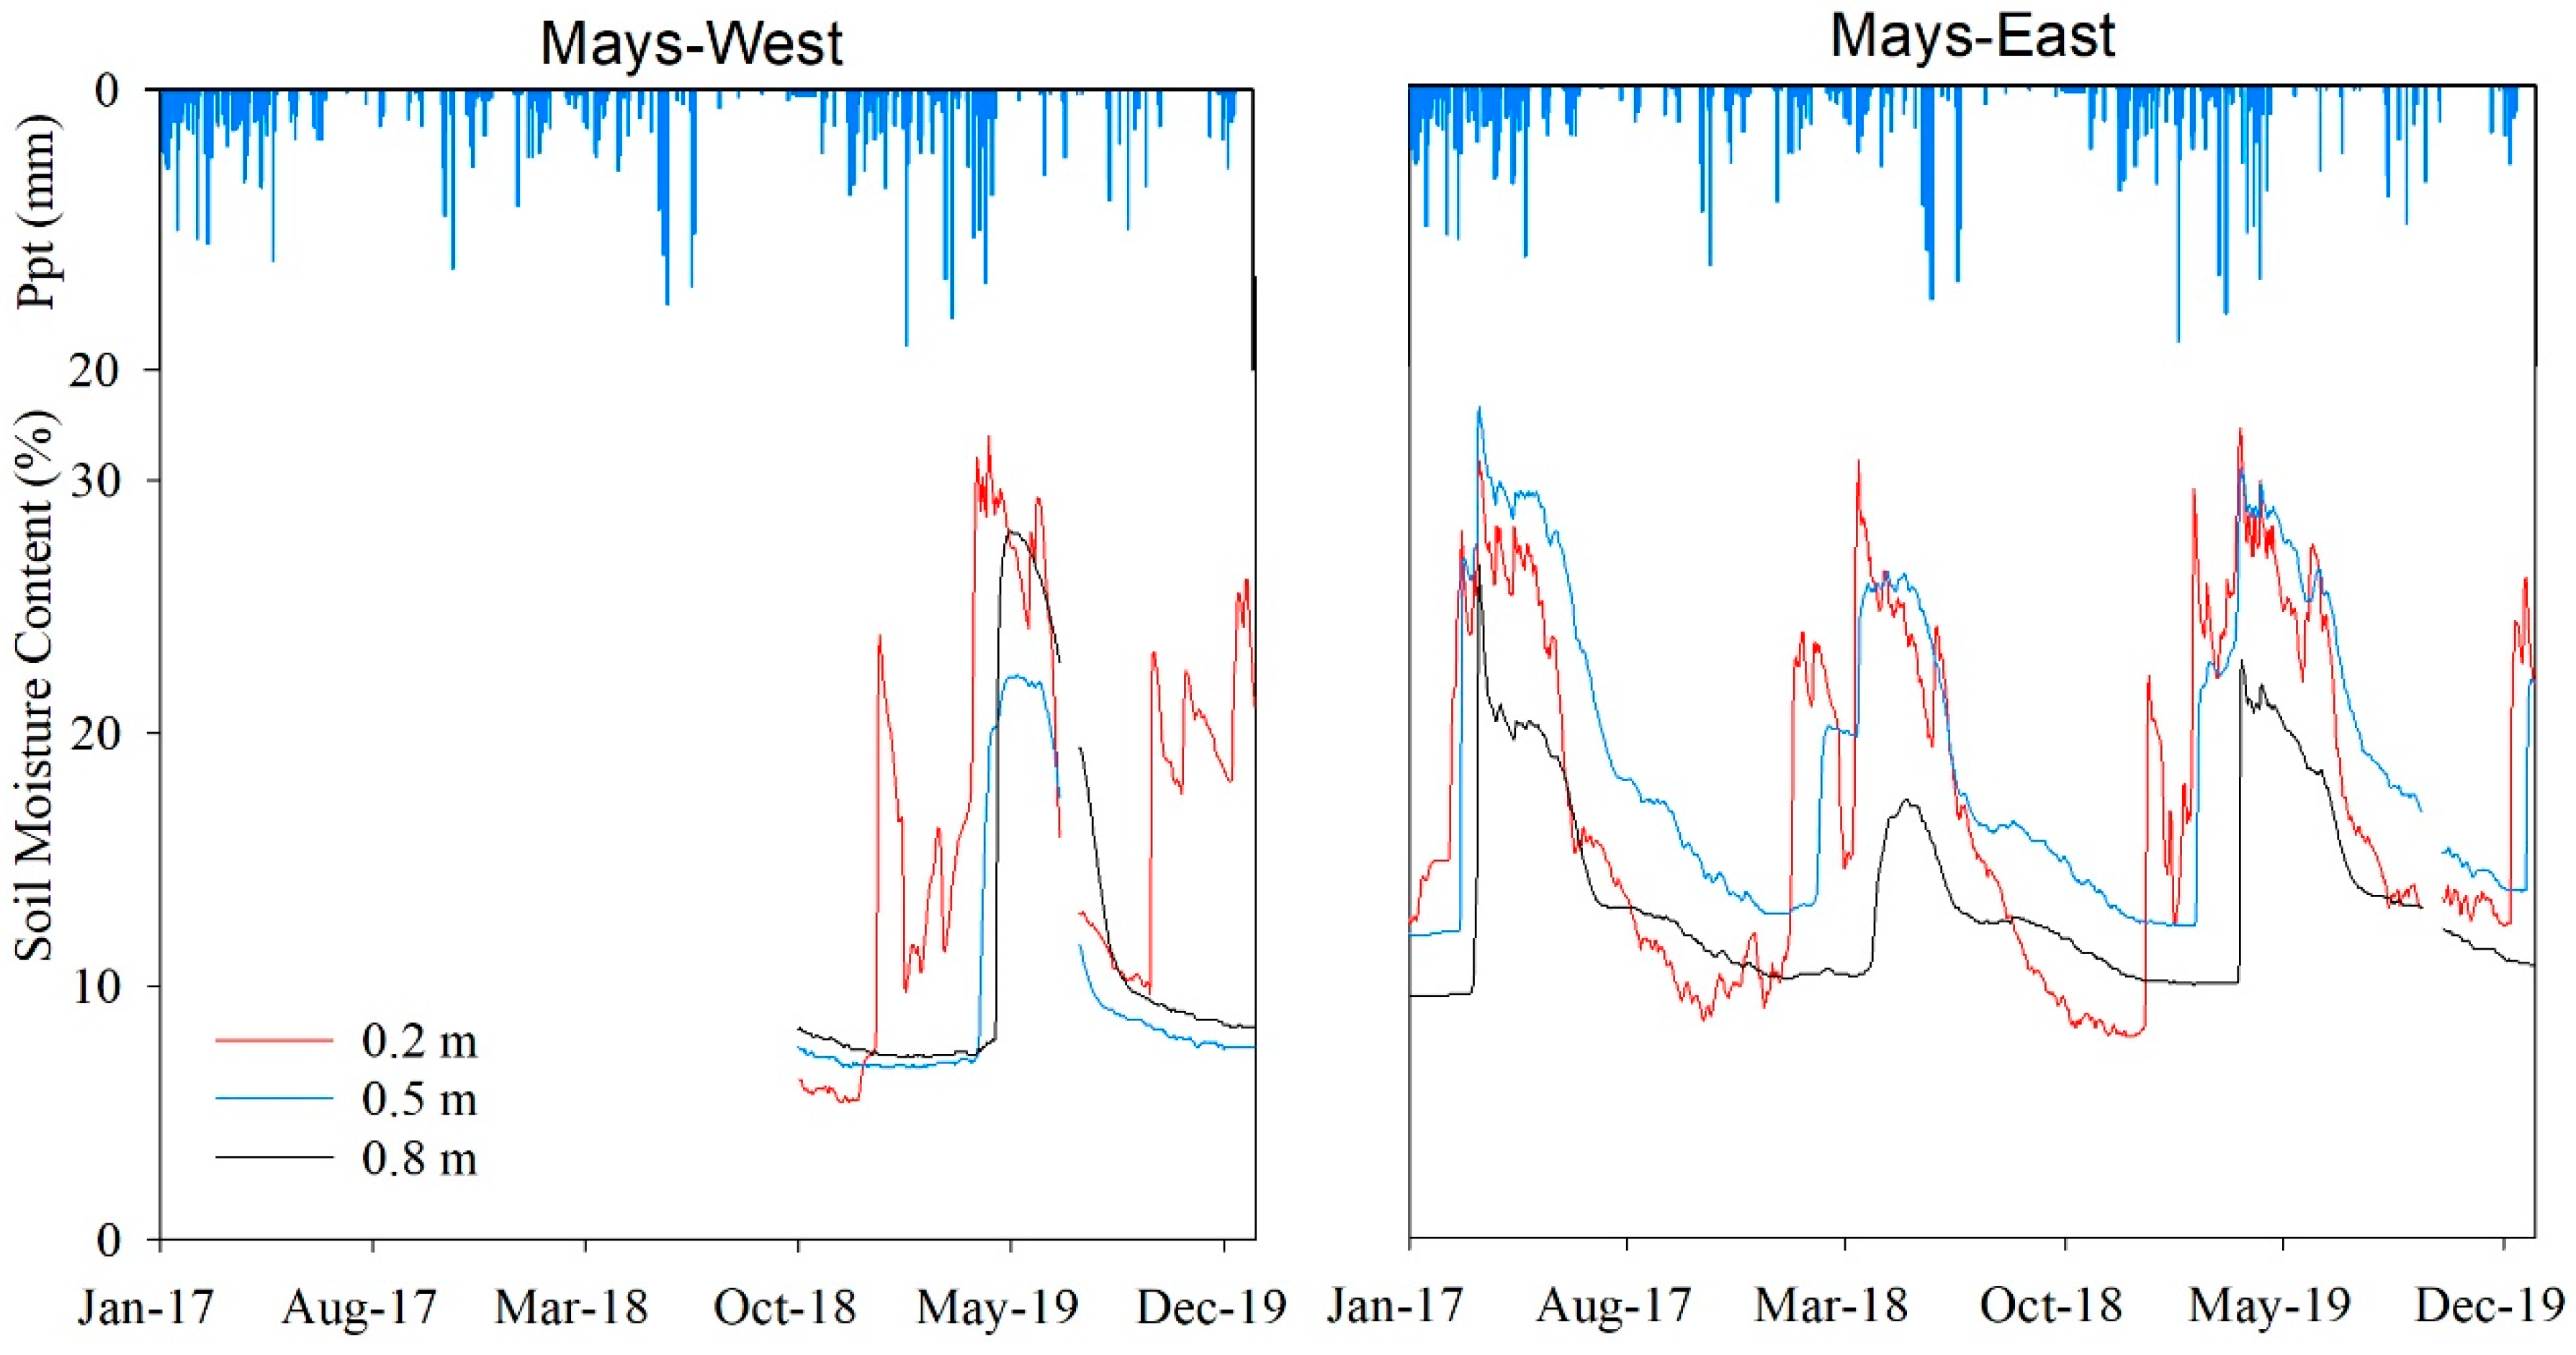
3.3.1. Mays WS
Figure 4 illustrates the seasonal pattern of daily averaged θ (%) fluctuations collected from the monitoring stations installed in Mays WS at two locations. For the Mays-East location, θ data were recorded from 1 January 2017 to 31 December 2019. For the Mays-West location, θ data were recorded from 1 October 2018 to 31 December 2019. For both locations, θ values were higher during the spring months when compared to other times evaluated. For the Mays-East location, the highest θ values at all depths were recorded in March for all years but 2018, when the highest θ values at 0.5 m (26%) and 0.8 m (17.4%) depths were observed in April. In general, θ recorded at the Mays-West location followed the same response to precipitation pattern than the Mays-East location with the highest θ values observed in the spring. However, peak θ values at the 0.5 m (22%) and 0.8 m (28%) depths in 2019 were not observed until April of that year.
The results from the ANOVA test showed there were significant θ differences (p ≤ 0.05) among sensor depths in both locations, with greater θ values at 0.5 m depth and lower θ values at 0.8 m in Mays-East. The lower θ values observed at 0.8 m in Mays-East were attributed to the higher soil bulk density and lower porosity found at that depth (Table A1). At Mays-West, θ for all sensor depths peaked in the month of May in 2019. Greater θ values were obtained at the 0.2 m sensor depth, followed by 0.8 m, then by 0.5 m. The higher winter and early spring precipitation amounts observed in 2019 may have contributed to the recharge of the entire soil profile.
3.3.2. Jensen WS
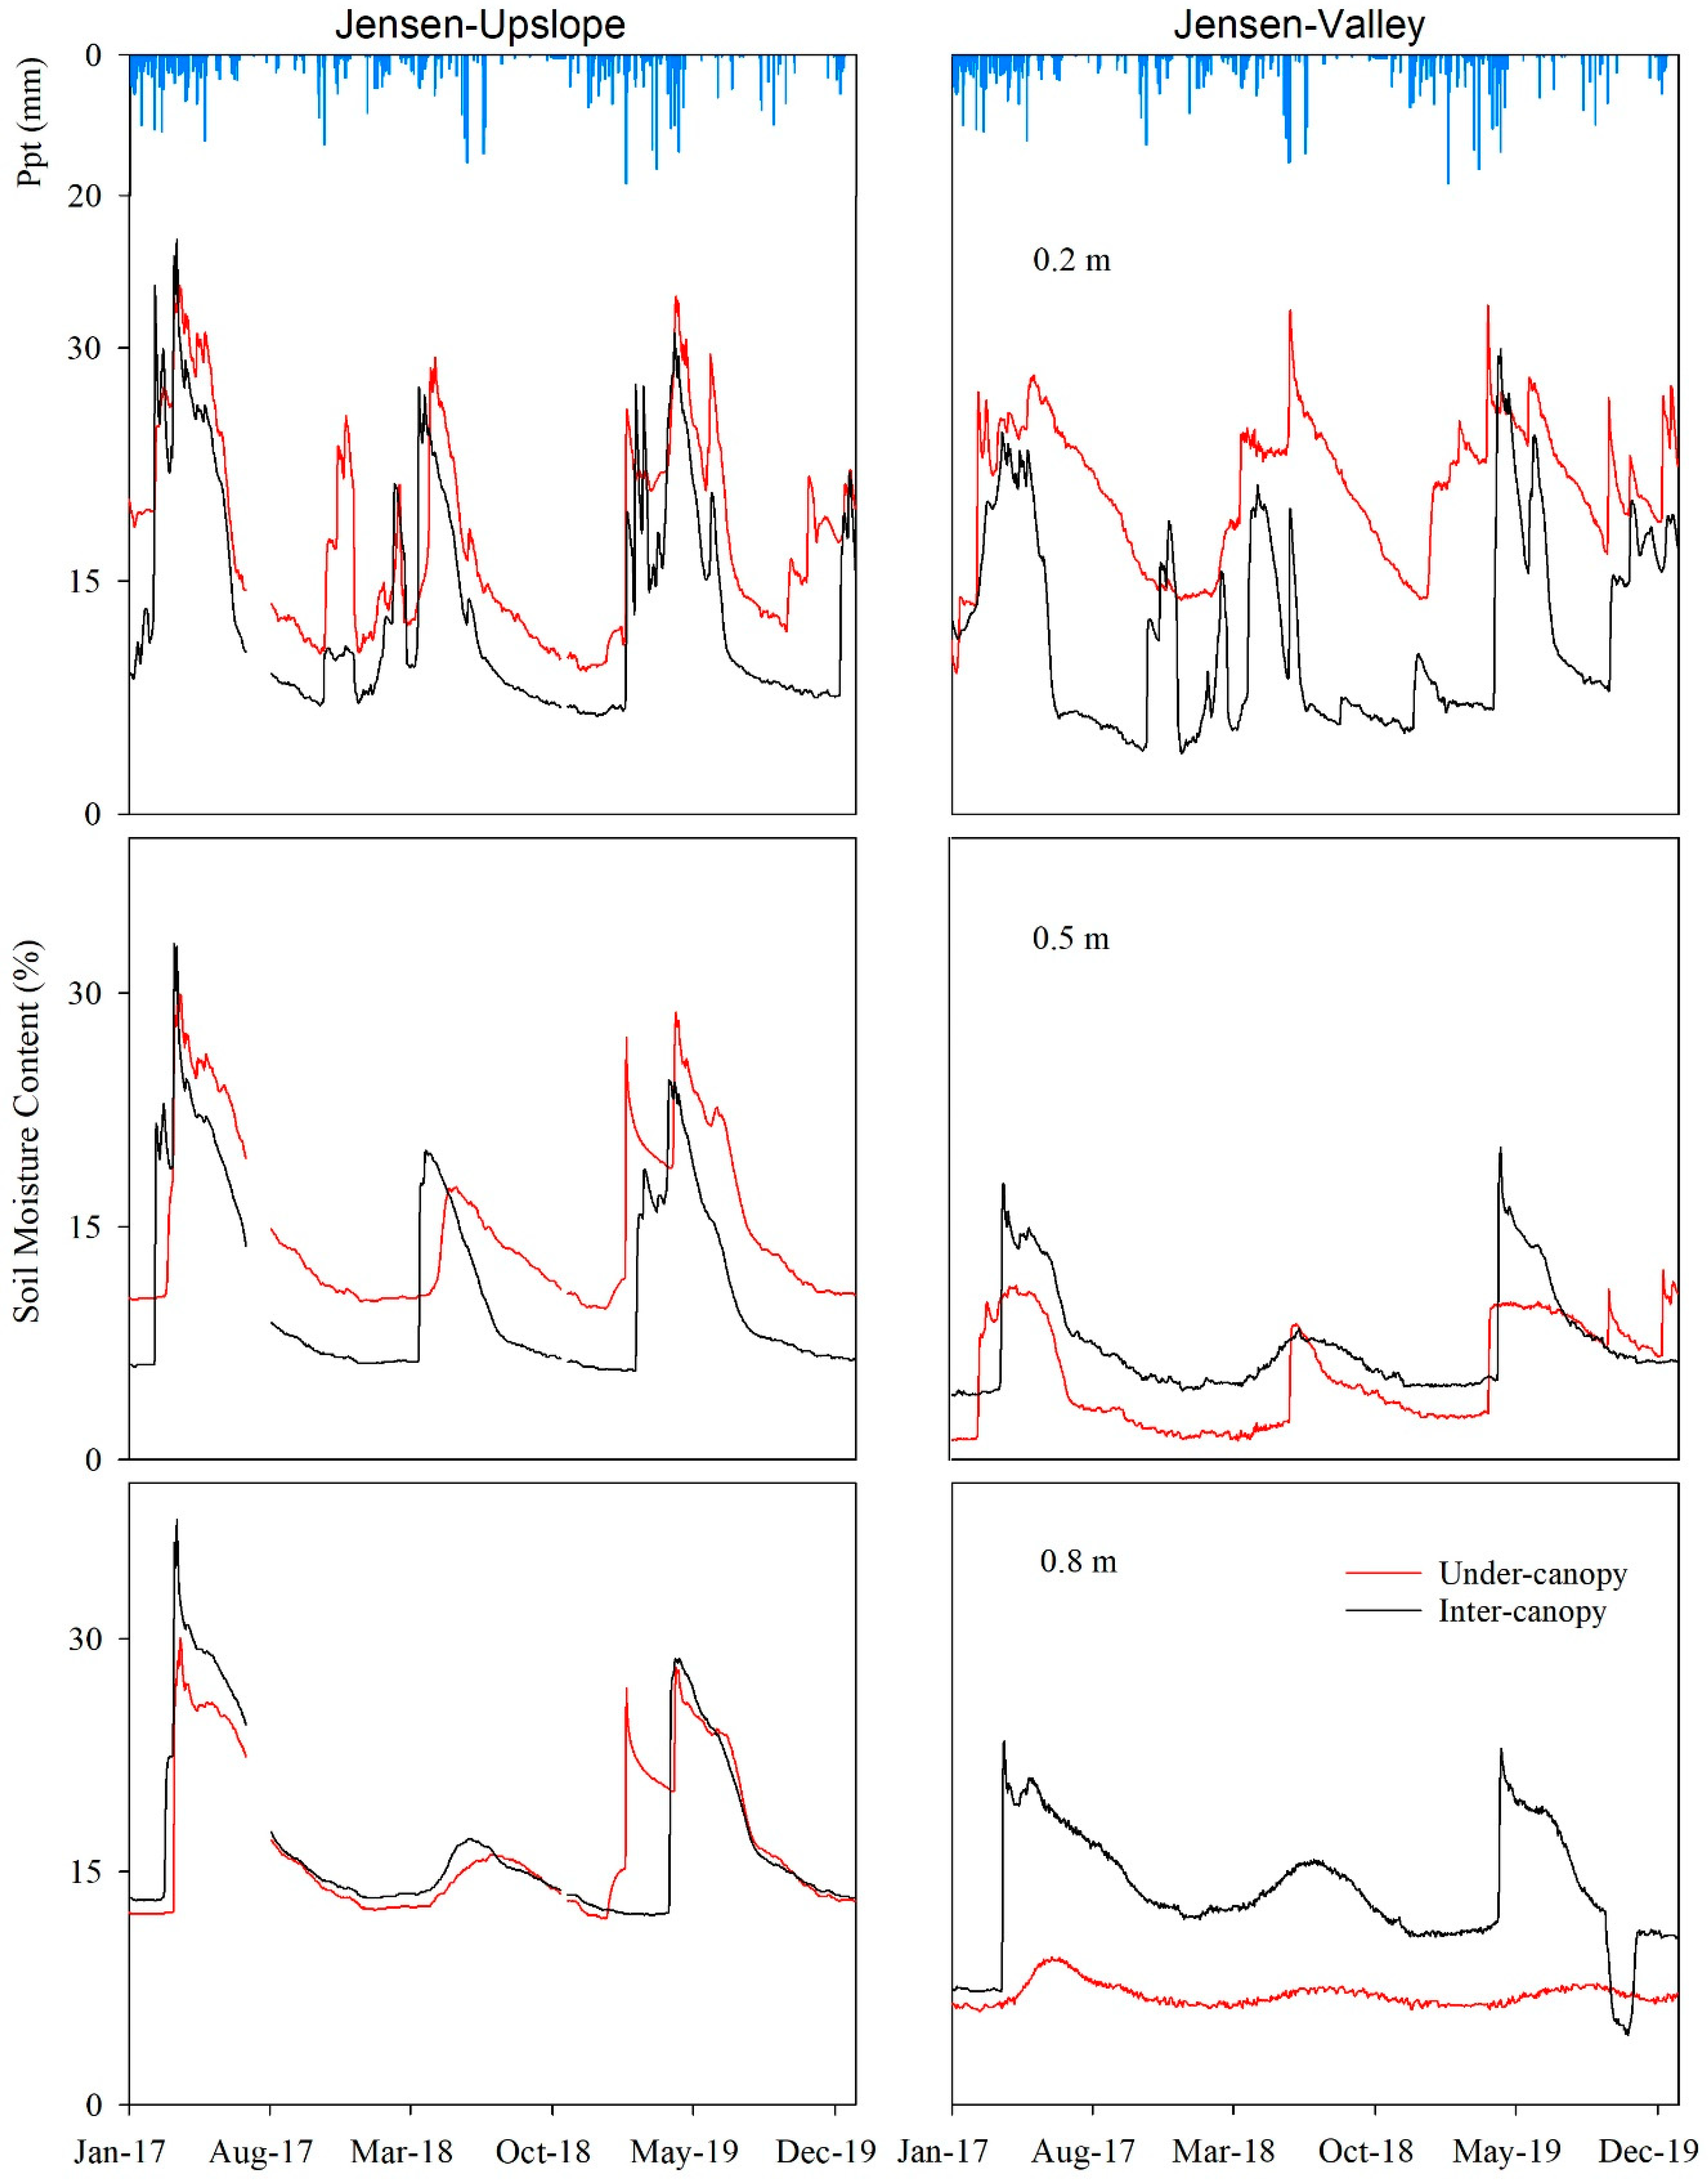
Similar to that observed in Mays WS, θ levels responded to seasonal precipitation variability in both locations in Jensen WS with the highest θ values generally observed during the spring (Figure 5). Higher θ levels were observed at the 0.2 m depth in both the under-canopy and inter-canopy stations at both the Jensen-Valley and the Jensen-Upslope locations. The gap between under-canopy and the inter-canopy θ was more apparent in the summer months at the Jensen-Valley location. The under-canopy θ at the 0.2 m depth in both Jensen WS locations was greater than the inter-canopy. Higher θ levels were observed at the inter-canopy location for both the 0.5 and 0.8 m depths in the Jensen-Valley location. The ANOVA results showed there were significant θ differences (p ≤ 0.05) between under-canopy and inter-canopy zones for all but the 0.8 m (p = 0.23) sensor depth at the Jensen-Upslope location.
3.4. Transpiration and Soil Moisture Relations
3.4.1. Mays WS
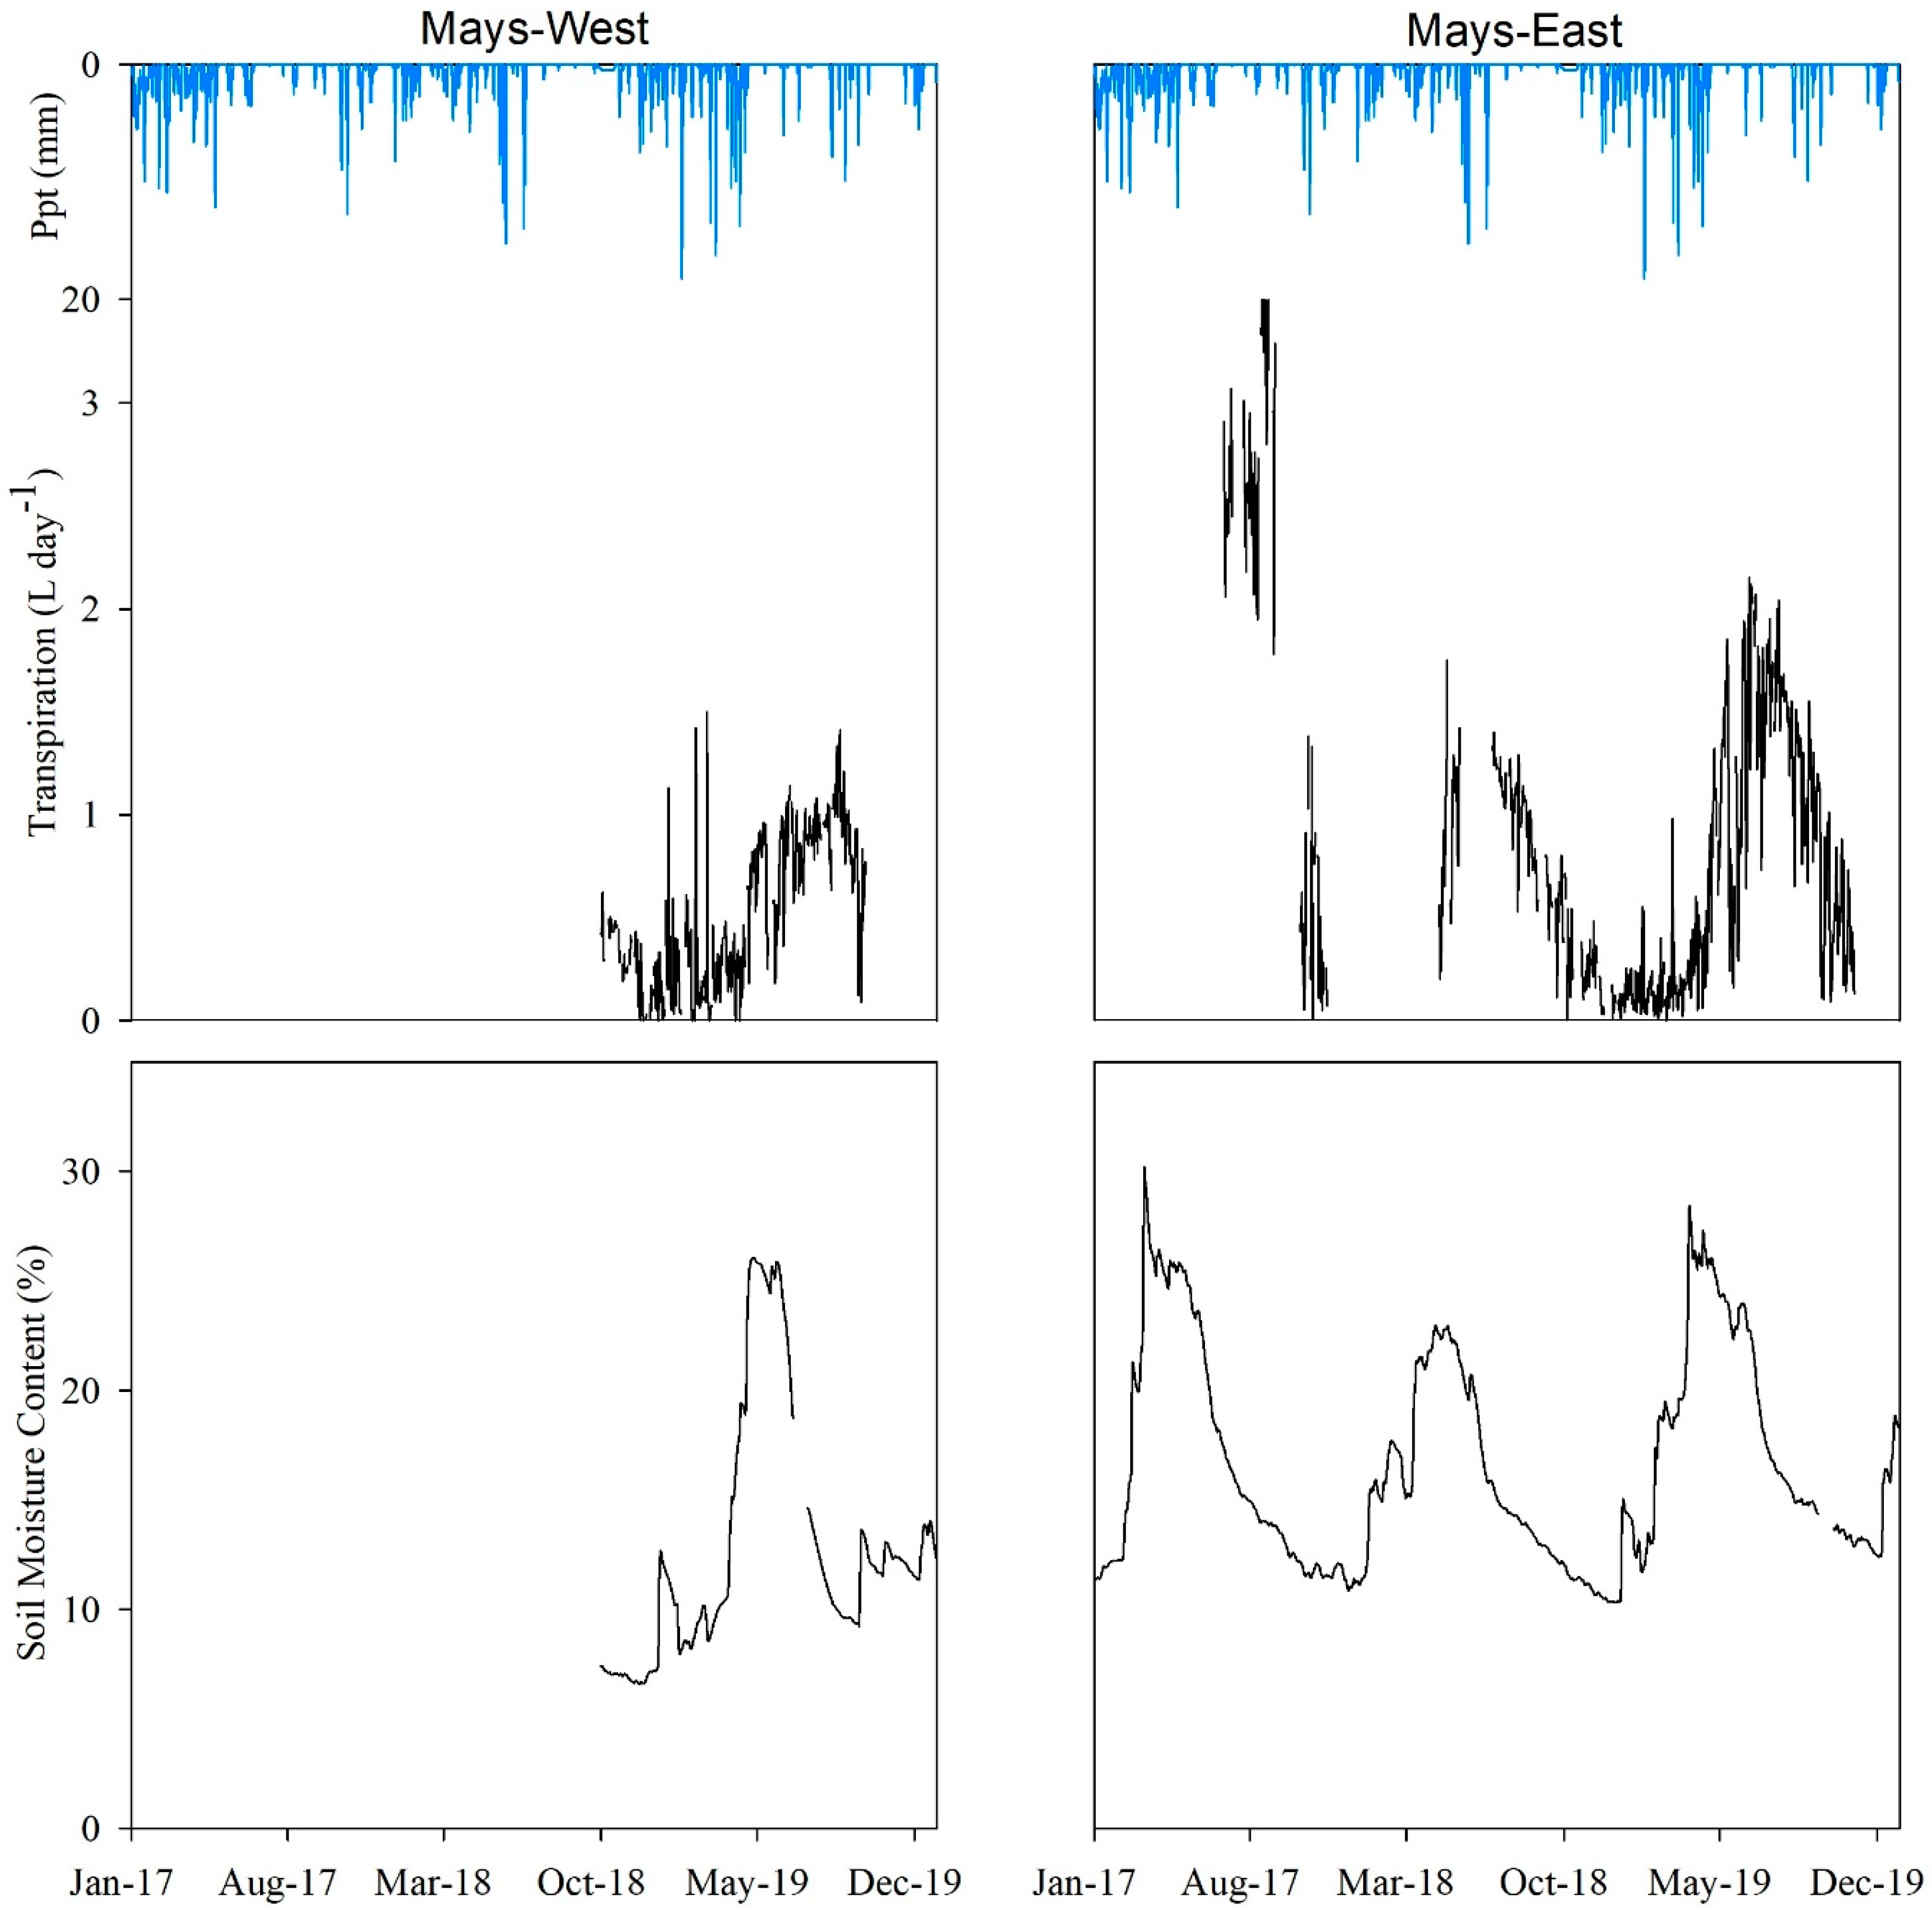
Figure 6 shows the daily averaged transpiration and θtot relationships in response to precipitation in Mays WS. No significant (p = 0.3) inter-annual variability differences in θtot at the onset (January–March) of the three-year study (2017–2019) for the Mays-East location. The θtot values peaked in late winter for years 2017 and 2019, whereas in 2018 θtot reached a maximum value in early spring. The greater θtot values recorded in spring season for year 2017 compared to 2018 (paired t-test, t = 27.5, df = 90, p ≤ 0.001), which may be in response to higher winter precipitation inputs resulted in sapling transpiration levels three times greater in the summer of 2017 when compared to 2018. Total winter precipitation was 2.8 times greater in 2017 than in 2018. When θtot dropped below 15% in the end of the summer and through the progression of the autumn for both 2017 and 2018, juniper transpiration levels also declined. The greater transpiration rates observed in summer 2019 were attributed to the higher θtot levels observed in spring 2019.
Juniper sapling transpiration rates at both locations in Mays WS peaked during spring and summer, then declined through late summer to autumn following the θtot drying, indicating the potential time at which soil moisture became limiting.
3.4.2. Jensen WS
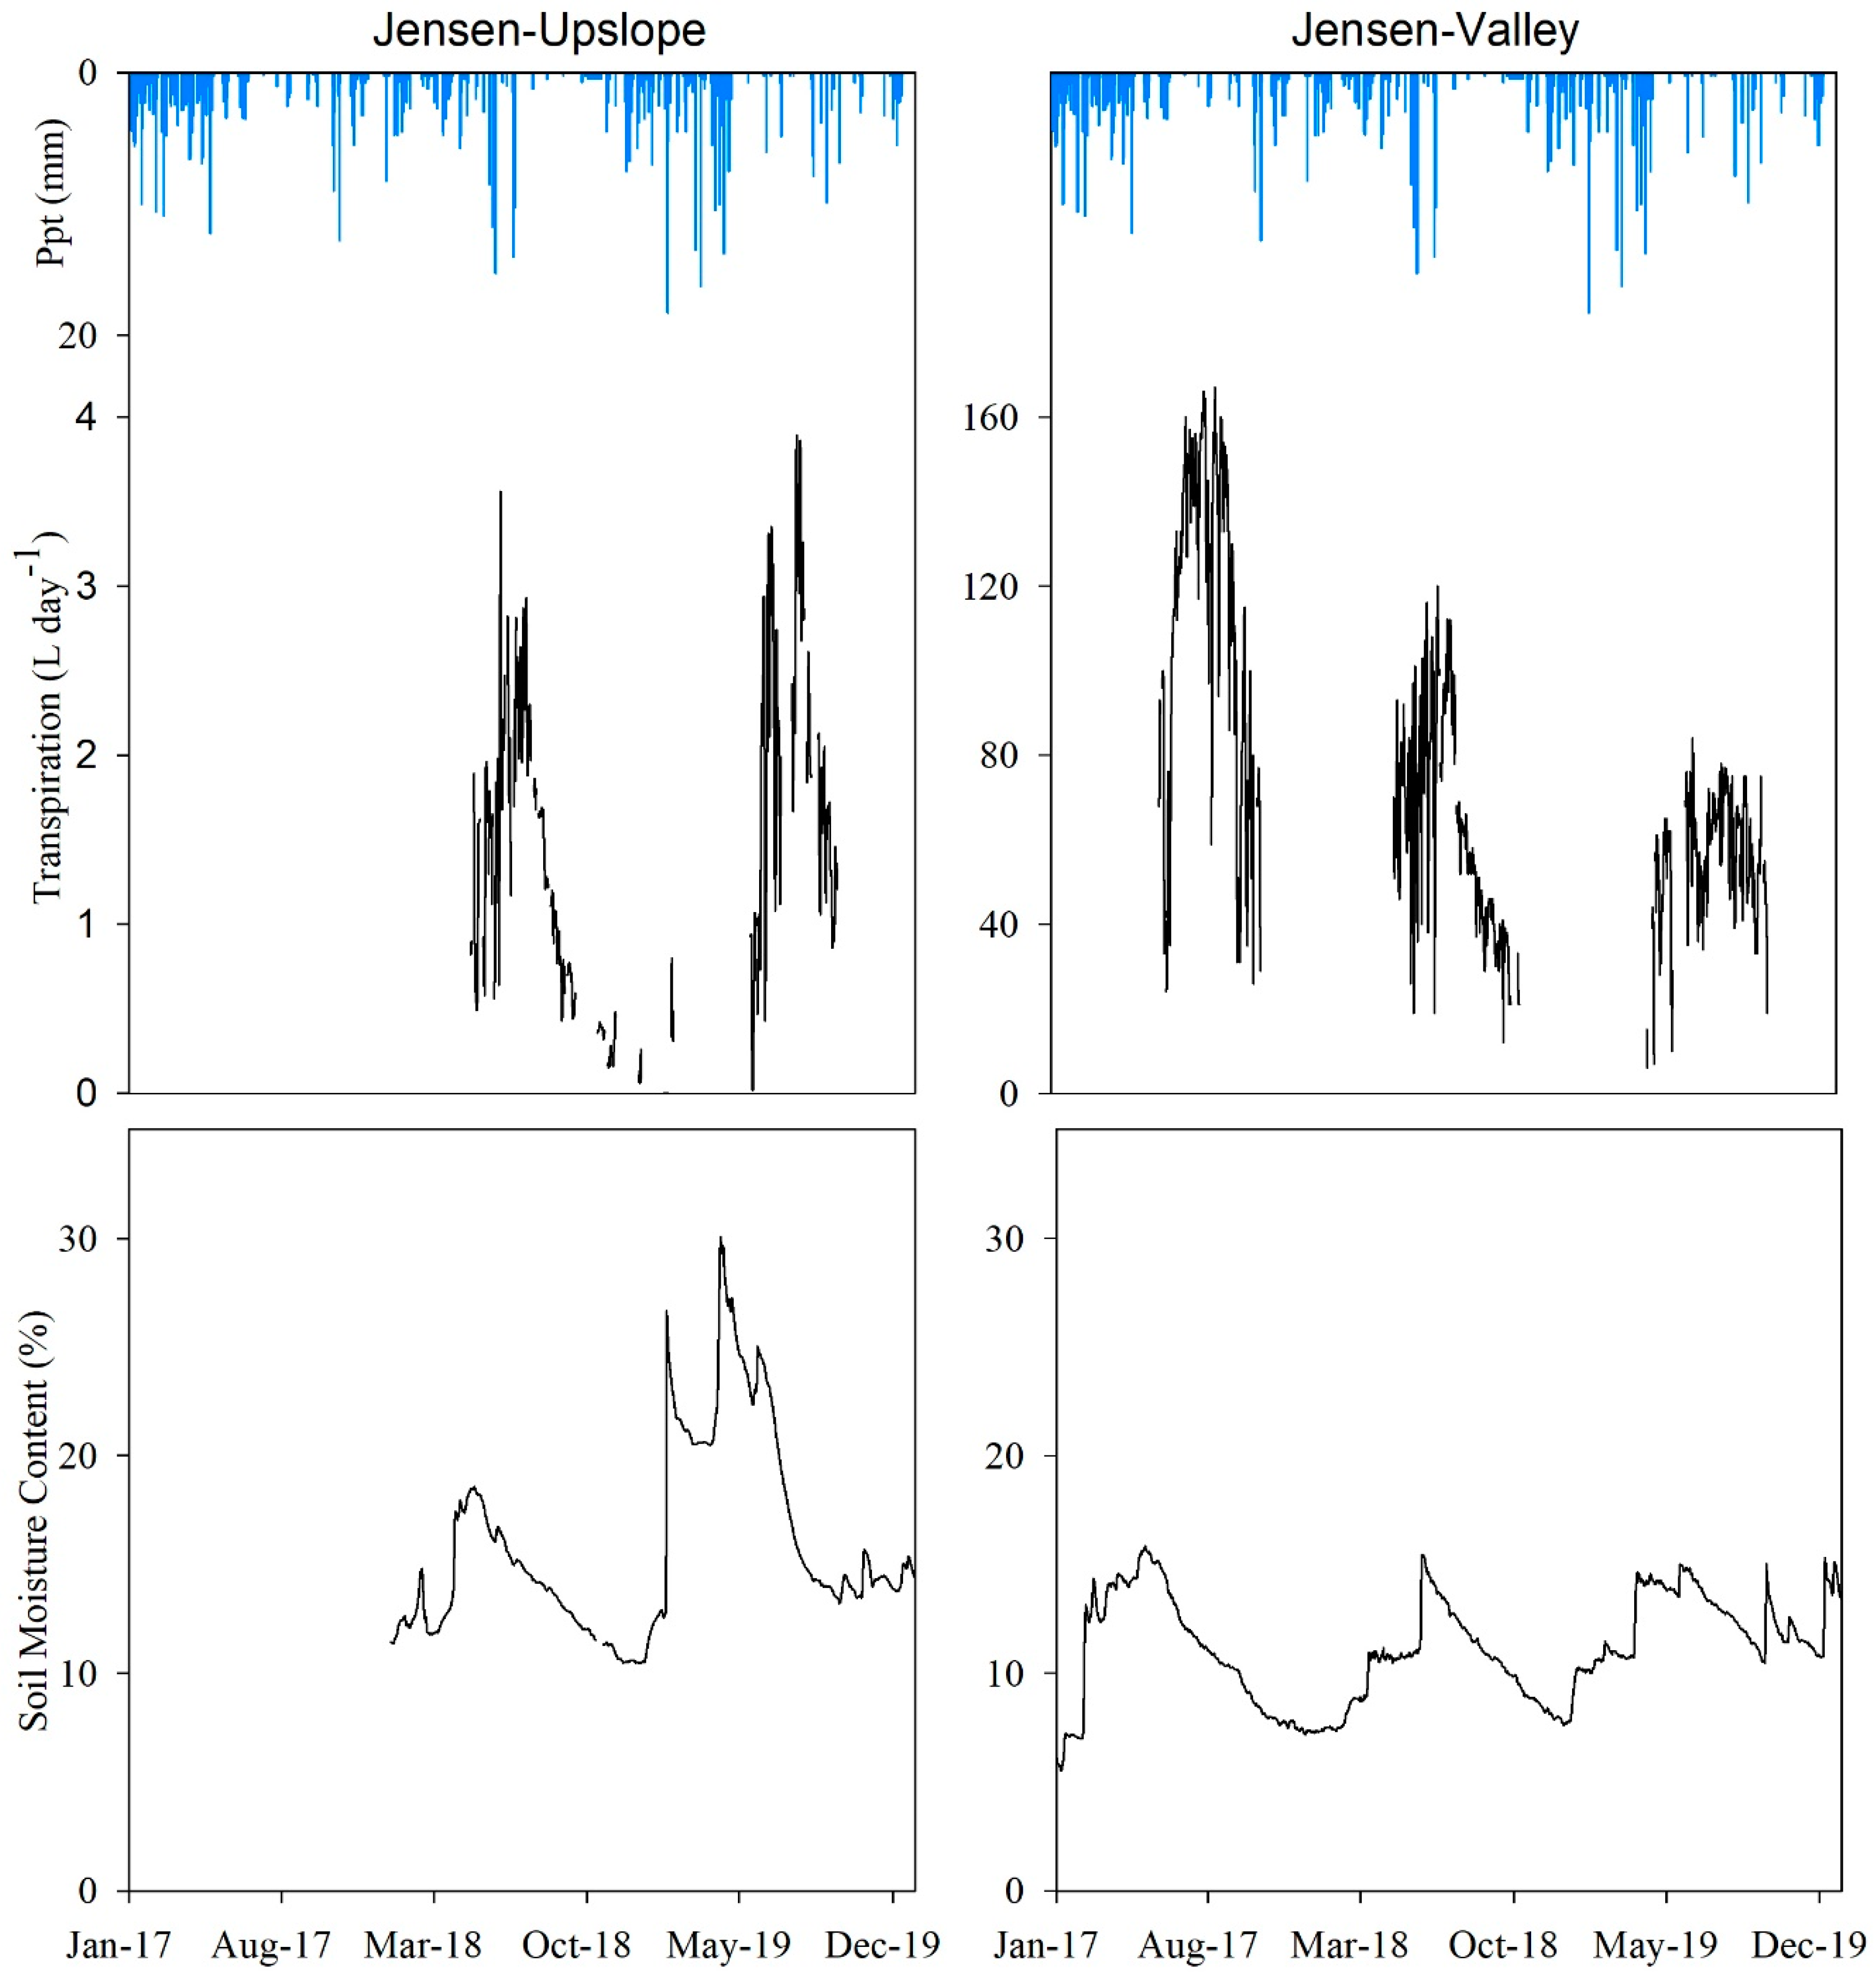
The daily averaged transpiration and θtot relationships in response to precipitation in Jensen WS are illustrated in Figure 7. For the Jensen-Valley location, peak values of θtot (16%) were recorded in spring. The lowest θtot (<11%), indicative of dry soil conditions, occurred at the end of autumn. Higher θtot levels were observed at the onset (January to March) of years 2017 and 2019 (with no difference, p = 0.11) compared to 2018. Spring θtot levels were not significantly different (p = 0.98) in 2017 and 2019 but were significantly (p ≤ 0.05) higher than 2018. The day at which maximum transpiration was recorded indicated the point at which θtot became limiting. This soil moisture limiting points in 2017 (18 August) and 2018 (22 June) were different, in part due to the higher amount of θtot available from the higher winter and spring precipitation observed in 2017 than in 2018. In 2019, θtot levels found in the under-canopy at Jensen-Valley gradually increased in response to winter precipitation and spring snowmelt runoff until they reached the highest value in mid-May (15%). Transpiration peaked in early June and then declined, with some fluctuations. In September 2019, transpiration and under-canopy θtot in Jensen-Valley were both at the lowest levels for the year. The limiting θtot, where transpiration started to decline, was 10 days longer in 2019 than 2018, which may have caused transpiration to be greater during spring 2018 than 2019.
A similar pattern was observed at the Jensen-Upslope site for juvenile juniper from January 2018 through December 2019 (Figure 7). Following precipitation, θtot rose to about 19% in late April and then started to gradually decline until it reached its minimum (10%) in mid-December. Transpiration, which was first recorded on 22 April, showed an immediate response to θtot. Transpiration rose sharply and peaked at 3.6 L day−1 on 2 June, then fluctuated around 2.7 L day−1 until 8 July, when it began a steady decline and bottomed out to 0.09 L day−1 on 16 December. Following rainfall events, transpiration rapidly increased during spring and early summer, then decreased as θtot decreased over the course of the summer. In early winter and spring 2019, there was a gradual increase in θtot in the Jensen-Upslope location, followed by a more rapid growth in transpiration in the spring, ranging from 0.02 to 3.89 L day−1 on 20 July. Following this, there was a noticeable decline in transpiration during the progression to the late summer. Differences in winter precipitation led to a significantly (p ≤ 0.05) greater θtot at the Jensen-Upslope location in spring 2019 compared to 2018. As a result, summer transpiration was 1.5 times greater in 2019 than 2018.
The θtot values recorded were within expected ranges of permanent wilting point and field capacity based on soil properties determination for different locations in both watersheds. The mean θtot values in the drier months (July–November, 12%) for all years were close to θPWP mean values (9.0%) calculated in both watersheds (Table A1). Mean θtot values in the wetter months (January–May, 17%) were lower than mean θFC (30%). Lower transpiration rates were observed in both watersheds at the end of the summer, as θtot approached θPWP. Considerable variation in precipitation and available θ was observed over the study (2017–2019). On average, available water ranged from 17% in Jensen WS to 27% in Mays WS.
Table 6 shows the monthly averaged temperature and precipitation variability over the three years of this study. Greater winter (January to March) precipitation amounts recorded for 2017 (169 mm) and 2019 (110 mm) were reflected in the higher θtot levels available for a longer portion of the growing season in these years compared to the drier winter quarter in 2018 (61 mm). Summer (July to September) precipitation in 2018 was marginal (5 mm), compared to 2017 (15 mm) and 2019 (42 mm), leading juniper daily transpiration rates to a rapid decline after peaking in spring (see Figure 7). Mean air temperature values during the most active transpiration seasons (spring and summer) remained relatively the same for all three years evaluated.
Table 7 shows the relationships between the soil water content and transpiration variables estimated from 1 July through 31 October, the most active transpiration period observed, each year during 2017 to 2019. For some years, transpiration data were only collected through 30 September. A strong association between soil moisture averaged over the upper 0.8 profile (θtot) and tree transpiration rates for all juniper growth stages was observed in 2018 and for the saplings and mature trees measured in 2017. A weak association between the two variables was observed for all growth stages in 2019.
4. Discussion
This study shows that western juniper transpiration for sapling, juvenile, and mature growth stages follow a similar pattern, that is consistent with soil moisture availability in response to seasonal precipitation in cool climate rangeland ecosystems of semiarid central Oregon, USA. Transpiration rates are influenced by water availability and atmospheric evaporative demand [52,83,84,85]. In this study, we focused on the water availability component and characterized transpiration–soil moisture relationships for western juniper trees at different growth stages (sapling, juvenile, and mature).
All mature, juvenile, and sapling trees showed similar patterns of seasonal transpiration, with generally maximum values obtained in late spring/early summer and acute reductions as the summer drying of the soil progressed. During winter, cold soil temperatures restrict transpiration in juniper woodlands. The reduced transpiration in winter is commonly attributed to factors such as cold soil and air temperature, low vapor pressure deficit, and minimum stomatal conductance [82]. The inhibitory effects of low soil temperature on transpiration have also been reported in other forest types [86,87,88]. Equipment failure (battery power and damage from livestock) and limited access to the study site due to weather conditions affected data collection. Some limitations associated with probe installation may also have impacted SF data.
As soil temperature starts increasing in spring, juniper begins to transpire and grow actively [12]. The observed seasonal decrease in leaf water potential values and the range between predawn and midday water potentials helped to validate sap flow-based transpiration estimates that peaked during the summer and declined as the soil started drying. Soil water is an important determinant of transpiration rates, particularly in water-limited environments such as the one addressed in this study. Juniper woodlands maintain low transpiration, while leaf water potentials continuously increase with soil drying [54,82,89]. The higher transpiration rates (57 to 115 L day−1) observed for mature trees in the summer are within the range of values reported in other western juniper studies [29,40], and for other woody vegetation species (e.g., J. ashei [41], Abies amabilis [90], Pinus pinaster [91], Pinus radiata [92], Eucalyptus loxophleba [93], and Ficus insipida [94]).
The higher soil moisture content levels observed at under-canopy locations in the untreated Jensen WS, particularly during the dry season, appeared to be influenced by the shade provided by juniper canopy that prevented soil evaporation. This is consistent with the finding of studies conducted in other juniper [95] and pine [96] tree species that have reported that tree canopy acts as a barrier to prevent soil evaporative losses. The generally lower soil moisture content obtained at the deeper 0.8 m depth in under-canopy locations can be attributed to a combination of factors including the finer-textured soil found at that soil depth, precipitation interception that limited water recharge, and to tree water uptake by neighboring mature juniper trees. Juniper is an evergreen with extensive lateral and deep roots, and it has physiological adaptations that enable it to maximize water extraction from deeper depths [25]. Deep roots of trees may increase the supply of hydraulically lifted water [97] from deeper soil zones in arid and semiarid environments. Water uptake by western juniper is not only exploited in shallow soil layers; it also occurs at greater depths [29]. A study conducted by Leffler et al. [98] on J. osteosperma in the Great Basin reported juniper can extract water from 1 m below the soil surface. Additionally, a study by Eliades et al. [99] on Pinus brutia in a semiarid Mediterranean landscape has shown bedrock water contribution to transpiration can reach 100% in summer.
The similar spring and summer air temperature values observed for all three years of the study indicate transpiration rates may have been more influenced by factors such as precipitation and available soil water than from air temperature. Total amount and timing of precipitation seemed to have influenced transpiration rates throughout the year. Higher soil moisture content availability, following winter precipitation and snowmelt runoff, in 2017 resulted in higher transpiration rates overall. Mature juniper transpiration rates in the summer were about two times greater in 2017 year than those observed in the below-average precipitation years 2018 and 2019. Transpiration declined quickly as soil moisture was depleted. The seasonal soil moisture effects on transpiration rates observed in this study are consistent with those reported for other woody vegetation species in arid and semiarid landscapes [53,54,100,101,102].
5. Conclusions
This study evaluated western juniper transpiration and soil moisture relationships at different tree growth stages. Sapling, juvenile, and mature juniper trees follow a similar seasonal transpiration pattern driven by total amount and timing of precipitation that recharges soil moisture each year. Transpiration rates peak during the summer then start declining as soil moisture content levels decrease at the end of the summer and into the autumn. Juniper transpiration rates are higher in years with greater winter precipitation levels that help replenish soil moisture before the onset of the growing season. A strong association between soil moisture available in the upper 0 to 0.8 m soil profile and tree transpiration rates exists. While topsoil (<0.2 m) moisture levels are generally higher at under-canopy locations, water uptake by mature juniper trees during the summer appears to deplete soil moisture levels at the deeper 0.8 m profile. Study results show that mature juniper consumed between 120 and 175 L day−1 more water than saplings depending on precipitation, and consequently, soil water availability. Leaf water potential measurements are good indicators of juniper water status where less negative values correspond with the occurrence of transpiration. This study provides important information regarding precipitation, soil moisture, and tree transpiration relationships in cool-climate rangeland ecosystems. The comparison of western juniper water uptake at different growth stages adds a critical component to assess potential water savings and redistribution following vegetative manipulation practices such as juniper control. Further investigation is needed to evaluate the long-term dynamics of western transpiration and other associated factors (e.g., soil moisture, evaporative demand).
Author Contributions
M.A.B.A., R.M.-G. and C.G.O. developed the study design. M.A.B.A, N.D. and C.G.O. conducted field data collection and analyses. M.A.B.A., N.D., R.M.-G., C.G.O. and J.S.N. contributed to the writing of the manuscript. All authors have read and agreed to the published version of the manuscript.
Acknowledgments
The authors gratefully acknowledge the continuous support of the Hatfield High Desert Ranch, the U.S. Department of Interior Bureau of Land Management—Prineville Office, and the OSU’s Extension Service, in this research effort. We also want to thank the multiple graduate and undergraduate students from Oregon State University, and volunteers, who participated in various field data collection activities related to the results here presented. Thank to Tim Deboodt. Michael Fisher, and John Buckhouse who pioneered the establishment of the long-term CCPWS site in 1993. Thanks to Maria Dragila for taking time out of her busy schedule to help us take soil water potential measurements at the Soil Physics Laboratory of OSU. This study was funded in part by the Oregon Beef Council, USDA NIFA, and the Oregon Agricultural Experiment Station.
Conflicts of Interest
The authors declare no conflict of interest.
Appendix A
Soil Physical Properties
At each sensor depth (Figure 2), three soil cores for bulk density, water content and porosity using a soil core sampler (48 mm diameter × 100 mm length), and one loose soil sample for textural classification were obtained. Soil texture was determined using the hydrometer method described by Gee and Bauder [103]. Soil cores were weighed, oven-dried at 105 °C for 48 h and reweighed to determine percent gravimetric water content (GWC, kg kg−1) [104]. Bulk density (BD, Mg m−3) was calculated as the ratio of the mass of oven-dried soil sample to core volume. The percent of soil volumetric water content (θ, m3 m−3) was computed using the formula
θ = (GWC) × (BD)
Soil porosity (%PS) was determined using the formula
where PD = particle density, the value of which is 2.65 Mg m3 [105].
The three soil cores used for bulk density and water content determinations were mixed to produce a representative sample for each sensor depth and location. The characteristic water retention curve of each soil mix was determined at the Soil Physics Laboratory of Oregon State University. Soil matric potential was determined for each representative sample using a pressure plate apparatus (5-bar pressure chamber using a 5-bar ceramic plate, Soilmoisture Equipment Corp., Santa Barbara, CA, USA) and dew point meter (Model WP4C, Group Meter Inc., Pullman, WA, USA) [106,107].

Table A1.
Soil physical properties for the paired watersheds within the study area, (a) Jensen WS and (b) Mays WS, showing the mean and standard error (n = 3) of soil bulk density, soil particle distribution of sand, silt, and clay, volumetric water content and soil porosity at each soil depth. Additionally, mean θ values at permanent wilting point (θPWP), field capacity (θFC), and available water content (AWC) are identified for each soil depth. The Jensen WS location illustrates data collected at under-canopy and inter-canopy area in upslope and valley settings. Means with the same letter superscripts (a, b) along columns indicate no significant differences for soil depths (p < 0.05).
| Soil Depth | BD (Mg m−3) | Sand (%) | Silt (%) | Clay (%) | VWC (%) | PS (%) | θFC (%) | θPWP (%) | AWC (%) |
|---|---|---|---|---|---|---|---|---|---|
| (a) Jensen WS | |||||||||
| Upslope-Under-canopy | |||||||||
| 0.2 m | 1.22 ± 0.04 b | 54.4 ± 2.80 a | 25.1 ± 0.35 a | 20.51 ± 2.45 a | 31.10 ± 4.80 a | 53.97 ± 1.52 a | 27 | 10 | 17 |
| 0.5 m | 1.35 ± 0.03 ab | 56.3 ± 2.40 a | 25.9 ± 3.08 a | 17.91 ± 0.81 a | 40.95 ± 12.20 a | 49.05 ± 1.06 ab | 27 | 9.8 | 17.2 |
| 0.8 m | 1.49 ± 0.03 a | 53.7 ± 1.04 a | 24.4 ± 0.23 a | 21.91 ± 1.27 a | 33.68 ± 9.12 a | 43.61 ± 1.05 b | 28 | 10 | 18 |
| Upslope-Inter-canopy | |||||||||
| 0.2 m | 1.33 ± 0.04 b | 54.3 ± 0.67 a | 26.6 ± 1.94 a | 19.1 ± 1.85 a | 25.51 ± 0.74 a | 49.62 ± 1.30 a | 29 | 9.7 | 19.3 |
| 0.5 m | 1.43 ± 0.015 b | 49.9 ± 2.73 a | 26.6 ± 1.20 a | 23.5 ± 1.58 a | 26.76 ± 0.23 a | 46.21 ± 0.51 a | 27 | 10 | 17 |
| 0.8 m | 1.63 ± 0.015 a | 54.4 ± 1.47 a | 22.3 ± 1.33 a | 23.3 ± 0.47 a | 29.02 ± 2.21 a | 38.49 ± 0.62 b | 25 | 9.9 | 15.1 |
| Valley-Under-canopy | |||||||||
| 0.2 m | 1.19 ± 0.042 b | 50.3 ± 0.73 c | 33.6 ± 0.70 a | 16.1 ± 0.07 a | 21.45 ± 0.63 a | 55.20 ± 1.57 a | 42 | 10.7 | 31.3 |
| 0.5 m | 1.46 ± 0.061 a | 58.2 ± 0.60 b | 24.2 ± 0.24 b | 17.7 ± 0.37 a | 24.05 ± 1.27 a | 44.92 ± 2.26 b | 30 | 9.8 | 20.2 |
| 0.8 m | 1.28 ± 0.067 ab | 63.7 ± 1.16 a | 18.6 ± 0.95 c | 17.7 ± 0.82 a | 19.46 ± 5.48 a | 51.63 ± 2.43 ab | 26 | 9.3 | 16.7 |
| Valley-Inter-canopy | |||||||||
| 0.2 m | 1.43 ± 0.118 a | 60.5 ± 1.07 b | 20.6 ± 0.35 a | 18.9 ± 1.12 a | 27.33 ± 1.13 a | 46.02 ± 4.46 a | 39 | 8.9 | 30.1 |
| 0.5 m | 1.52 ± 0.027 a | 68.7 ± 1.62 a | 14.5 ± 1.29 b | 16.9 ± 1.79 a | 20.71 ± 0.49 a | 42.55 ± 0.93 a | 27 | 9.5 | 17.5 |
| 0.8 m | 1.64 ± 0.072 a | 73.8 ± 0.31 a | 10.5 ± 1.00 b | 15.7 ± 0.70 a | 23.00 ± 5.07 a | 38.21 ± 2.71 a | 24 | 4.9 | 19.1 |
| (b) Mays WS | |||||||||
| Inter-canopy (Mays-East) | |||||||||
| 0.2 m | 1.52 ± 0.009 b | 60.1 ± 1.43 b | 22.1 ± 0.74 a | 17.9 ± 0.70 a | 22.85 ± 4.05 a | 42.65 ± 0.34 a | 33 | 9.3 | 23.7 |
| 0.5 m | 1.59 ± 0.006 a | 61.7 ± 0.71 ab | 20.1 ± 0.79 ab | 18.2 ± 0.42 a | 34.57 ± 4.57 a | 40.04 ± 0.27 b | 28 | 9.5 | 18.5 |
| 0.8 m | 1.57 ± 0.012 a | 65.9 ± 0.29 a | 17.5 ± 0.29 b | 16.5 ± 0.47 a | 24.83 ± 5.58 a | 40.88 ± 0.44 b | 25 | 3.8 | 21.2 |
| Inter-canopy (Mays-West) | |||||||||
| 0.2 m | 1.31 ± 0.012 a | 58.1 ± 2.27 a | 24.5 ± 1.53 a | 17.5 ± 0.74 a | 24.85 ± 4.05 a | 50.48 ± 0.38 a | 39 | 10.1 | 28.9 |
| 0.5 m | 1.33 ± 0.055 a | 53.3 ± 0.55 a | 28.7 ± 3.65 a | 18 ± 3.22 a | 19.77 ± 1.01 a | 49.68 ± 2.07 a | 35 | 10.1 | 24.9 |
| 0.8 m | 1.38 ± 0.019 a | 47.9 ± 0.41 a | 34.5 ± 1.43 a | 17.6 ± 1.47 a | 27.85 ± 1.52 a | 48.10 ± 0.74 a | 36 | 9.9 | 26.1 |
References
- Andela, N.; Liu, Y.Y.; van Dijk, A.I.J.M.; de Jeu, R.A.M.; McVicar, T.R. Global changes in dryland vegetation dynamics (1988–2008) assessed by satellite remote sensing: Comparing a new passive microwave vegetation density record with reflective greenness data. Biogeosciences 2013, 10, 6657–6676. [Google Scholar] [CrossRef] [Green Version]
- Elkington, R.J.; Rebel, K.T.; Heilman, J.L.; Litvak, M.E.; Dekker, S.C.; Moore, G.W. Species-specific water use by woody plants on the Edwards Plateau, Texas. Ecohydrology 2014, 7, 278–290. [Google Scholar] [CrossRef]
- Archer, S.R.; Andersen, E.M.; Predick, K.I.; Schwinning, S.; Steidl, R.J.; Woods, S.R. Woody plant encroachment causes and consequences. In Rangeland Systems; Springer: Cham, Switzerland, 2017; pp. 25–84. [Google Scholar]
- Zhou, Y.; Boutton, T.W.; Wu, X.B. Soil carbon response to woody plant encroachment: Importance of spatial heterogeneity and deep soil storage. J. Ecol. 2017, 105, 1738–1749. [Google Scholar] [CrossRef]
- Hibbard, K.A.; Schimel, D.S.; Archer, S.; Ojima, D.S.; Parton, W. Grassland to woodland transitions: Integrating changes in landscape structure and biogeochemistry. Ecol. Appl. 2003, 13, 911–926. [Google Scholar] [CrossRef]
- Huxman, T.E.; Wilcox, B.P.; Breshears, D.D.; Scott, R.L.; Snyder, K.A.; Small, E.E.; Hultine, K.; Pockman, W.T.; Jackson, R.B. Ecohydrological implications of woody plant encroachment. Ecology 2005, 86, 308–319. [Google Scholar] [CrossRef]
- Baker, W.L.; Shinneman, D.J. Fire and restoration of pinon-juniper woodlands in the western United States: A review. For. Ecol. Manag. 2004, 189, 1–21. [Google Scholar] [CrossRef]
- Sankey, T.T.; Glenn, N.; Ehinger, S.; Boehm, A.; Hardegree, S. Characterizing western juniper expansion via a fusion of Landsat 5 Thematic Mapper and lidar data. Rangel. Ecol. Manag. 2010, 63, 514–523. [Google Scholar] [CrossRef]
- Romme, W.H.; Allen, C.D.; Bailey, J.D.; Baker, W.L.; Bestelmeyer, B.T.; Brown, P.M.; Miller, R.F. Historical and modern disturbance regimes, stand structures, and landscape dynamics in pinon–juniper vegetation of the western United States. Rangel. Ecol. Manag. 2009, 62, 203–222. [Google Scholar] [CrossRef] [Green Version]
- Sankey, T.T.; Germino., M.J. Assessment of juniper encroachment with the use of satellite imagery and geospatial data. Rangel. Ecol. Manag. 2008, 61, 412–418. [Google Scholar] [CrossRef]
- Soule´, P.T.; Knapp, P.A.; Grissino-Mayer, H.D. Human agency, environmental drivers, and western juniper establishment during the late Holocene. Ecol. Appl. 2004, 14, 96–112. [Google Scholar] [CrossRef]
- Miller, R.F.; Bates, J.D.; Svejcar, T.J.; Pierson, F.B.; Eddleman, L.E. Biology, Ecology, and Management of Western Juniper (Juniperus occidentalis); Oregon State University: Corvallis, OR, USA, 2005. [Google Scholar]
- Cowlin, R.W.; Briegleb, P.A.; Moravets, F.L. Forest Resources of the Ponderosa Pine Region of Washington and Oregon; U.S. Department of Agriculture, Forest Service: Washington, DC, USA, 1942; p. 122.
- Azuma, D.L.; Hiserote, B.A.; Dunham, P.A. The Western Juniper Resource of Eastern Oregon; U.S. Department of Agriculture, Forest Service, Pacific Northwest Research Station: Portland, OR, USA, 2005; p. 18.
- Belsky, A.J. Viewpoint: Western juniper Expansion: Is It a Threat to Arid Northwestern Ecosystems? J. Range Manag. 1996, 49, 53–59. [Google Scholar] [CrossRef]
- Dobkin, D.S.; Sauder, J.D. Shrubsteppe Landscapes in Jeopardy. Distributions, Abundances, and the Uncertain Future of Birds and Small Mammals in the Intermountain West; High Desert Ecological Research Institute: Bend, OR, USA, 2004. [Google Scholar]
- Rumble, M.A.; Gobeille, J.E. Wildlife Associations in Rocky Mountain Juniper in the Northern Great Plains, South Dakota. In Desired Future Conditions for Pinon-Juniper Ecosystems, Proceedings of the Symposium, Flagstaff, AZ, USA, 8–12 August 1994; Shaw, D.W., Aldon, E.F., LoSapio, C., Eds.; Gen. Tech. Rep. RM-258; U.S. Department of Agriculture, Forest Service, Rocky Mountain Forest and Range Experiment Station: Fort Collins, CO, USA, 1995; pp. 80–90. [Google Scholar]
- Abdallah, M.A.B.; Mata-González, R.; Noller, J.S.; Ochoa, C.G. Ecosystem carbon in relation to woody plant encroachment and control: Juniper systems in Oregon, USA. Agric. Ecosyst. Environ. 2020, 290, 106762. [Google Scholar] [CrossRef]
- Bunting, S.C.; Kingery, J.L.; Strand, E. Effects of succession on species richness of the western juniper woodland/sagebrush steppe mosaic. In Proceedings Ecology and Management of Piñon-Juniper Communities within the Interior West; Monsen, S.B., Richards, S., Tausch, R.J., Miller, R.F., Goodrich, C., Eds.; RMRS-P-9; USDA Forest Service: Ogden, UT, USA, 1999; pp. 76–81. [Google Scholar]
- Ray, G.; Ochoa, C.G.; Deboodt, T.; Mata-Gonzalez, R. Overstory–understory vegetation cover and soil water content observations in western juniper woodlands: A paired watershed study in Central Oregon, USA. Forests 2019, 10, 151. [Google Scholar] [CrossRef] [Green Version]
- Baruch-Mordo, S.; Evans, J.S.; Severson, J.P.; Naugle, D.E.; Maestas, J.D.; Kiesecker, J.M.; Reese, K.P. Saving sage-grouse from the trees: A proactive solution to reducing a key threat to a candidate species. Biol. Conserv. 2013, 167, 233–241. [Google Scholar] [CrossRef]
- Coultrap, D.E.; Fulgham, K.O.; Lancaster, D.L.; Gustafson, J.; Lile, D.F.; George, M.R. Relationships between western juniper (Juniperus occidentalis) and understory vegetation. Invas. Plant Sci. Manag. 2008, 1, 3–11. [Google Scholar] [CrossRef] [Green Version]
- Vaitkus, M.R.; Eddleman, L.E. Composition and productivity of a western juniper understory and its response to canopy removal. In Proceedings Piñon-juniper Conference; Everett, R.L., Ed.; USDA Forest Service: Ogden, UT, USA, 1987; pp. 456–460. [Google Scholar]
- Eddleman, L.E.; Miller, R.F.; Miller, P.M.; Dysart, P.L. Western Juniper Woodlands of the Pacific Northwest: Science Assessment; Department of Rangeland Resources, Oregon State University: Corvallis, OR, USA, 1994. [Google Scholar]
- Thurow, T.L.; Hester, J.W. How an increase or reduction in juniper cover alters rangeland hydrology. In Juniper Symposium Proceedings; Texas A&M University: San Angelo, TX, USA, 1997; pp. 9–22. [Google Scholar]
- Owens, M.K.; Lyons, R.K.; Alejandro, C.L. Rainfall partitioning within semiarid juniper communities: Effects of event size and canopy cover. Hydrol Process. 2006, 20, 3179–3189. [Google Scholar] [CrossRef]
- Pierson, F.B.; Bates, J.D.; Svejcar, T.J.; Hardegree, S.P. Runoff and erosion after cutting western juniper. Rangel. Ecol. Manag. 2007, 60, 285–292. [Google Scholar] [CrossRef]
- Petersen, S.L.; Stringham, T.K. Infiltration, runoff, and sediment yield in response to western juniper encroachment in southeast Oregon. Rangel. Ecol. Manag. 2008, 61, 74–82. [Google Scholar] [CrossRef]
- Mollnau, C.; Newton, M.; Stringham, T. Soil water dynamics and water use in a western juniper (Juniperus occidentalis) woodland. J. Arid Environ. 2014, 102, 117–126. [Google Scholar] [CrossRef]
- Ochoa, C.G.; Caruso, P.; Ray, G.; Deboodt, T.; Jarvis, W.T.; Guldan, S.J. Ecohydrologic connections in semiarid watershed systems of central Oregon USA. Water 2018, 10, 181. [Google Scholar] [CrossRef] [Green Version]
- Dugas, W.A.; Hicks, R.A.; Wright, P. Effect of removal of Juniperus ashei on evapotranspiration and runoff in the Seco Creek watershed. Water Resour. Res. 1998, 34, 1499–1506. [Google Scholar] [CrossRef]
- Wilcox, B.P.; Owens, M.K.; Knight, R.W.; Lyons, R.K. Do woody plants affect streamflow on semiarid karst rangelands? Ecol. Appl. 2005, 15, 127–136. [Google Scholar] [CrossRef]
- Wilcox, B.P.; Owens, M.K.; Dugas, W.A.; Ueckert, D.N.; Hart, C.R. Shrubs, streamflow, and the paradox of scale. Hydrol. Process Int. J. 2006, 20, 3245–3259. [Google Scholar] [CrossRef]
- Bates, J.D.; Miller, R.F.; Svejcar, T.J. Understory dynamics in cut and uncut western juniper woodlands. J. Range Manag. 2000, 53, 119–126. [Google Scholar] [CrossRef]
- Pierson, F.B.; Robichaud, P.R.; Spaeth, K.E.; Moffet, C.A. Impacts of fire on hydrology and erosion in steep mountain big sagebrush communities. In Proceedings of the First Interagency Conference on Research in the Watersheds, Benson, AZ, USA, 27–30 October 2003; US Dept. of Agriculture, Agricultural Research Service: Washington, DC, USA, 2003; pp. 625–630. [Google Scholar]
- Li, X.Y. Mechanism of coupling, response and adaptation between soil, vegetation and hydrology in arid and semiarid regions. Sci. Sin. Terrae 2011, 41, 1721–1730. [Google Scholar]
- Skaloš, J.; Berchová, K.; Pokorný, J.; Sedmidubský, T.; Pecharová, E.; Trpáková, I. Landscape water potential as a new indicator for monitoring macrostructural landscape changes. Ecol. Indic. 2014, 36, 80–93. [Google Scholar] [CrossRef]
- Jarvis, P.G. The interpretation of the variations in leaf water potential and stomatal conductance found in canopies in the field. Philos. Trans. R. Soc. Lond. B Biol. Sci. 1976, 273, 593–610. [Google Scholar]
- Manzoni, S.; Vico, G.; Katul, G.; Palmroth, S.; Jackson, R.B.; Porporato, A. Hydraulic limits on maximum plant transpiration and the emergence of the safety–efficiency trade-off. New Phytol. 2013, 198, 169–178. [Google Scholar] [CrossRef]
- Miller, R.F.; Angell, R.F.; Eddleman, L.E. Water use by western juniper. In Proceedings of the Pinyon-Juniper Conference, Reno, NV, USA, 13–16 January 1986; Everett, R.L., Ed.; Reno, NV. Gen. Tech. Rep. INT-215. Department of Agriculture, Forest Service, Intermountain Research Station: Ogden, UT, USA, 1987; pp. 418–422. [Google Scholar]
- Owens, K.; Ansley., J. Ecophysiology and growth of ashe and redberry juniper. In Juniper Symposium Proceedings; Texas Agricultrual Experiment Station Technical Report 97-1; Texas Agricultural Experiment Station: San Angelo, TX, USA, 1997. [Google Scholar]
- Irvine, J.; Law, B.E.; Anthoni, P.M.; Meinzer, F.C. Water limitations to carbon exchange in old-growth and young ponderosa pine stands. Tree Physiol. 2002, 22, 189–196. [Google Scholar] [CrossRef]
- McCole, A.A.; Stern, L.A. Seasonal water use patterns of juniperus ashei on the Edwards Plateau, Texas, based on stable isotopes in water. J. Hydrol. 2007, 342, 238–248. [Google Scholar] [CrossRef]
- West, A.G.; Hultine, K.R.; Burtch, K.G.; Ehleringer, J.R. Seasonal variations in moisture use in a piñon–juniper woodland. Oecologia 2007, 153, 787–798. [Google Scholar] [CrossRef] [PubMed]
- Moore, G.W.; Owens, M.K. Removing adult overstory trees stimulates growth and transpiration of conspecific juvenile trees. Rangel. Ecol. Manag. 2006, 59, 416–421. [Google Scholar] [CrossRef]
- Zhao, W.; Liu, B.; Chang, X.; Yang, Q.; Yang, Y.; Liu, Z.; Cleverly, J.; Eamus, D. Evapotranspiration partitioning, stomatal conductance, and components of the water balance: A special case of a desert ecosystem in China. J. Hydrol. 2016, 538, 374–386. [Google Scholar] [CrossRef]
- Schwinning, S. The ecohydrology of roots in rocks. Ecohydrology: Ecosystems, Land and Water Process Interactions. Ecohydrogeomorphology 2010, 3, 238–245. [Google Scholar]
- Sternberg, P.D.; Anderson, M.A.; Graham, R.C.; Beyers, J.L.; Tice, K.R. Root distribution and seasonal water status in weathered granitic bedrock under chaparral. Geoderma 1996, 72, 89–98. [Google Scholar] [CrossRef]
- Rose, K.L.; Graham, R.C.; Parker, D.R. Water source utilization by Pinus jeffreyi and Arctostaphylos patula on thin soils over bedrock. Oecologia 2003, 134, 46–54. [Google Scholar]
- Schwinning, S. The water relations of two evergreen tree species in a karst savanna. Oecologia 2008, 158, 373–383. [Google Scholar] [CrossRef] [PubMed]
- Angstmann, J.L.; Ewers, B.E.; Barber, J.; Kwon, H. Testing transpiration controls by quantifying spatial variability along a boreal black spruce forest drainage gradient. Ecohydrology 2013, 6, 783–793. [Google Scholar] [CrossRef]
- Jiao, L.; Lu, N.; Fang, W.; Li, Z.; Wang, J.; Jin, Z. Determining the independent impact of soil water on forest transpiration: A case study of a black locust plantation in the Loess Plateau, China. J. Hydrol. 2019, 572, 671–681. [Google Scholar] [CrossRef]
- Loik, M.E.; Breshears, D.D.; Lauenroth, W.K.; Belnap, J.A. Multi-scale perspective of water pulses in dryland ecosystems: Climatology and ecohydrology of the western USA. Oecologia 2004, 141, 269–281. [Google Scholar] [CrossRef]
- West, A.G.; Hultine, K.R.; Sperry, J.S.; Bush, S.E.; Ehleringer, J.R. Transpiration and hydraulic strategies in a piñon–juniper woodland. Ecol. Appl. 2008, 18, 911–927. [Google Scholar] [CrossRef] [PubMed] [Green Version]
- Köstner, B.; Granier, A.; Cermák, J. Sapflow measurements in forest stands: Methods and uncertainties. In Annales des Sciences Forestières; EDP Sciences: Paris, France, 1998; Volume 55, pp. 13–27. [Google Scholar]
- Granier, A.; Biron, P.; Bre´da, N.; Pontailler, J.-Y.; Saugier., B. Transpiration of trees and forests: Short and long-term monitoring using sapflow methods. Glob. Chang. Biol. 1996, 2, 265–274. [Google Scholar] [CrossRef]
- Deboodt, T.L. Watershed Response to Western Juniper Control. Ph.D. Thesis, Oregon State University, Corvallis, OR, USA, May 2008. [Google Scholar]
- Fisher, M. Analysis of Hydrology and Erosion in Small, Paired Watersheds in a Juniper-Sagebrush Area of Central Oregon. Ph.D. Thesis, Oregon State University, Corvallis, OR, USA, September 2004. [Google Scholar]
- Official Soil Series Descriptions (OSDs)|NRCS Soils. Available online: https://www.nrcs.usda.gov/wps/portal/nrcs/detail/soils/survey/geo/?cid=nrcs142p2_053587 (accessed on 15 February 2019).
- Caruso, P.; Ochoa, C.G.; Jarvis, W.T.; Deboodt, T. A hydrogeologic framework for understanding local groundwater flow dynamics in the southeast Deschutes Basin, Oregon, USA. Geosciences 2019, 9, 57. [Google Scholar] [CrossRef] [Green Version]
- Waller, P.; Yitayew, M. Irrigation and Drainage Engineering; Springer International Publishing AG: Cham, Switzerland, 2016; 747p. [Google Scholar]
- Baker, J.M.; van Bavel, C.H.M. Measurement of mass flow of water in the stems of herbaceous plants. Plant Cell Environ. 1987, 10, 777–782. [Google Scholar]
- Smith, D.M.; Allen, S.J. Measurement of sap flow in plant stems. J. Exp. Bot. 1996, 47, 1833–1844. [Google Scholar] [CrossRef] [Green Version]
- Bladon, K.D.; Silins, U.; Landhäusser, S.M.; Lieffers, V.J. Differential transpiration by three boreal tree species in response to increased evaporative demand after variable retention harvesting. Agric. For. Meteorol. 2006, 138, 104–119. [Google Scholar] [CrossRef]
- Davis, T.W.; Kuo, C.M.; Liang, X.; Yu, P.S. Sap flow sensors: Construction, quality control and comparison. Sensors 2012, 12, 954–971. [Google Scholar] [CrossRef] [Green Version]
- Chabot, R.; Bouarfa, S.; Zimmer, D.; Chaumont, C.; Moreau, S. Evaluation of the sap flow determined with a heat balance method to measure the transpiration of a sugarcane canopy. Agric. Water Manag. 2005, 75, 10–24. [Google Scholar] [CrossRef]
- Grime, V.L.; Sinclair, F.L. Sources of error in stem heat balance sap flow measurements. Agric. For. Meteorol. 1999, 94, 103–121. [Google Scholar] [CrossRef]
- Kirmse, R.D.; Norton, B.E. Comparison of the reference unit method and dimensional analysis methods for two large shrubby species in the Caatinga woodlands. J. Range Manag. 1985, 38, 425–428. [Google Scholar] [CrossRef]
- Steinberg, S.L.; van Bavel, C.H.M.; McFarland, M.J. A gauge to measure mass flow rate of sap in stems and trunks of woody plants. J. Am. Soc. Hortic. Sci. 1989, 114, 466–472. [Google Scholar]
- Lascano, R.J.; Baumhardt, R.L.; Lipe, W.N. Measurement of water flow in young grapevines using the stem heat balance method. Am. J. Enol. Viticult. 1992, 43, 159–165. [Google Scholar]
- Dynagage Sap Flow Sensor User Manual; Dynamax Inc.: Houston, TX, USA, 2007.
- CR10X Measurement and Control Module Operator’s Manual; Campbell Scientific Inc.: Logan, UT, USA, 1992.
- Gazal, R.M.; Scott, R.L.; Goodrich, D.C.; Williams, D.G. Controls on transpiration in a semiarid riparian cottonwood forest. Agric. For. Meteorol. 2006, 137, 56–67. [Google Scholar] [CrossRef]
- Allen, R.G.; Pereira, L.S.; Howell, T.A.; Jensen, M.E. Evapotranspiration information reporting: I. Factors governing measurement accuracy. Agric. Water Manag. 2011, 98, 899–920. [Google Scholar] [CrossRef] [Green Version]
- Lu, P.A. Direct method for estimating the average sap flux density using a modified Granier measuring system. Aust. J. Plant Physiol. 1997, 24, 701–705. [Google Scholar] [CrossRef]
- Lu, P.; Urban, L.; Zhao, P. Granier’s thermal dissipation probe (TDP) method for measuring sap flow in trees: Theory and practice. Acta Bot. Sin.-Engil Ed. 2004, 46, 631–646. [Google Scholar]
- Ringersma, J.; Mechergui, M.; Pijnenburg, S. Transpiration measurements in Date Palms using the Granier method. In Proceedings of the International Conference on Evapotranspiration and Irrigation Scheduling, San Antonio, TX, USA, 3–6 November 1996; pp. 141–146. [Google Scholar]
- Granier, A. Une nouvelle me´thode pour la mesure du flux de se‘ve brute dans le tronc des arbres. Ann. Sci. For. 1985, 42, 193–200. [Google Scholar] [CrossRef]
- Granier, A. Evaluation of transpiration in a Douglas-fir stand by means of sap flow measurements. Tree Physiol. 1987, 3, 309–320. [Google Scholar] [CrossRef]
- Miller, R.F.; Eddleman, L.E.; Angell, R.F. Relationship of western juniper stem conducting tissue and basal circumference to leaf area and biomass. Great Basin Nat. 1987, 47, 349–354. [Google Scholar]
- Scholander, P.F.; Hammel, H.T.; Bradstreet, E.D.; Hemmingsen., E.A. Sap pressure in vascular plants. Science 1965, 148, 339–346. [Google Scholar] [CrossRef]
- Miller, R.F.; Shultz, L.M. Water relations and leaf morphology of Juniperus occidentalis in the northern Great Basin. For. Sci. 1987, 33, 690–706. [Google Scholar]
- Ungar, E.D.; Rotenberg, E.; Raz-Yaseef, N.; Cohen, S.; Yakir, D.; Schiller, G. Transpiration and annual water balance of Aleppo pine in a semiarid region: Implications for forest management. For. Ecol. Manag. 2013, 298, 39–51. [Google Scholar] [CrossRef]
- Grossiord, C.; Sevanto, S.; Borrego, I.; Chan, A.M.; Collins, A.D.; Dickman, L.T.; Hudson, P.J.; McBranch, N.; Michaletz, S.T.; Pockman, W.T.; et al. Tree water dynamics in a drying and warming world. Plant Cell Environ. 2017, 40, 1861–1873. [Google Scholar] [CrossRef] [PubMed] [Green Version]
- Li, Z.; Yu, P.; Wang, Y.; Webb, A.A.; He, C.; Wang, Y.; Yang, L. A model coupling the effects of soil moisture and potential evaporation on the tree transpiration of a semi-arid larch plantation. Ecohydrology 2017, 10, e1764. [Google Scholar] [CrossRef]
- Mellander, P.E.; Stähli, M.; Gustafsson, D.; Bishop, K. Modelling the effect of low soil temperatures on transpiration by Scots pine. Hydrol. Process Int. J. 2006, 20, 1929–1944. [Google Scholar] [CrossRef]
- Repo, T.; Lehto, T.; Finér, L. Delated soil thawing affects root and shoot functioning and growth in Scots pine. Tree Physiol. 2008, 28, 1583–1591. [Google Scholar] [CrossRef] [Green Version]
- Liu, X.; Nie, Y.; Luo, T.; Yu, J.; Shen, W.; Zhang, L. Seasonal shift in climatic limiting factors on tree transpiration: Evidence from sap flow observations at Alpine treelines in southeast Tibet. Front. Plant Sci. 2016, 7, 1018. [Google Scholar] [CrossRef] [Green Version]
- McDowell, N.G.; White, S.; Pockman, W.T. Transpiration and stomatal conductance across a steep climate gradient in the southern Rocky Mountains. Ecohydrology: Ecosystems, Land and Water Process Interactions. Ecohydrology 2008, 1, 193–204. [Google Scholar] [CrossRef] [Green Version]
- Martin, T.A.; Brown, K.J.; Èermák, J.; Ceulmans, R.; Kuèera, J.; Meinzer, F.C.; Rombold, J.S.; Sprugel, D.G.; Hinkley, T.M. Crown conductance and tree and stand transpiration in a secondgrowth Abies amabilis forest. Can. J. For. Res. 1997, 27, 797–808. [Google Scholar] [CrossRef]
- Granier, A.; Bobay, V.; Gash, J.H.C.; Gelpe, J.; Saugier, B.; Shuttleworth, W.J. Vapour flux density and transpiration rate comparisons in a stand of Maritime pine (Pinus pinaster Ait.) in Les Landes forest. Agric. For. Meteorol. 1990, 51, 309–319. [Google Scholar] [CrossRef]
- Edwards, W.R.N. Precision weighing lysimetry for trees, using a simplified tared-balance design. Tree Physiol. 1986, 1, 127–144. [Google Scholar] [CrossRef] [PubMed]
- Barrett, D.J.; Hatton, T.J.; Ash, J.E.; Ball., M.C. Transpiration by trees from contrasting forest types. Aust. J. Bot. 1996, 44, 249–263. [Google Scholar] [CrossRef]
- Goldstein, G.; Andrade, J.L.; Meinzer, F.C.; Holbrook, N.M.; Cavelier, J.; Jackson, P.; Celis, A. Stem water storage and diurnal patterns of water use in tropical forest canopy trees. Plant Cell Environ. 1998, 21, 397–406. [Google Scholar] [CrossRef]
- Breshears, D.D.; Myers, O.B.; Barnes, F.J. Horizontal heterogeneity in the frequency of plant available water with woodland intercanopy–canopy vegetation patch type rivals that occurring vertically by soil depth. Ecohydrology 2009, 2, 503–519. [Google Scholar] [CrossRef]
- Raz-Yaseef, N.; Rotenberg, E.; Yakir, D. Effects of spatial variations in soil evaporation caused by tree shading on water flux partitioning in a semi-arid pine forest. Agric. For. Meteorol. 2010, 150, 454–462. [Google Scholar] [CrossRef]
- Fernández, M.; Gyenge, J.; Licata, J.; Schlichter, T.; Bond, B. Belowground interactions for water between trees and grasses in a temperate semiarid agroforestry system. Agroforest Syst. 2008, 74, 185–197. [Google Scholar] [CrossRef]
- Leffler, A.J.; Ryel, R.J.; Hipps, L.; Ivans, S.; Caldwell, M.M. Carbon acquisition and water use in a northern Utah Juniperus osteosperma (Utah juniper) population. Tree Physiol. 2002, 22, 1221–1230. [Google Scholar] [CrossRef] [Green Version]
- Eliades, M.; Bruggeman, A.; Lubczynski, M.W.; Christou, A.; Camera, C.; Djuma, H. The water balance components of Mediterranean pine trees on a steep mountain slope during two hydrologically contrasting years. J. Hydrol. 2018, 562, 712–724. [Google Scholar] [CrossRef]
- Eliades, M.; Bruggeman, A.; Djuma, H.; Lubczynski, M.W. Tree water dynamics in a semi-arid, Pinus brutia forest. Water 2018, 10, 1039. [Google Scholar] [CrossRef] [Green Version]
- Schwinning, S.; Sala, O.E. Hierarchy of responses to resource pulses in and semi-arid ecosystems. Oecologia 2004, 141, 211–220. [Google Scholar] [CrossRef]
- Brito, P.; Lorenzo, J.R.; González-Rodríguez, Á.M.; Morales, D.; Wieser, G.; Jiménez, M.S. Canopy transpiration of a semi-arid Pinus canariensis forest at a treeline ecotone in two hydrologically contrasting years. Agric. For. Meteorol. 2015, 201, 120–127. [Google Scholar] [CrossRef]
- Gee, G.W.; Bauder, J.W. Particle-size analysis. In Methods of Soil Analysis. Part 1; ASA and SSSA: Madison, WI, USA, 1986; pp. 383–411. [Google Scholar]
- Topp, G.C. Soil water content. In Soil Sampling and Methods of Analysis; Carter, M.R., Ed.; Lewis Publishers: London, UK, 1993. [Google Scholar]
- Tian, Z.; Gao, W.; Kool, D.; Ren, T.; Horton, R.; Heitman, J.L. Approaches for estimating soil water retention curves at various bulk densities with the extended van Genuchten model. Water Resour. Res. 2018, 54, 5584–5601. [Google Scholar] [CrossRef]
- Gardner, W.H. Water content. In Methods of Soil Analysis; American Society of Agronomy: Madison, WI, USA, 1965; pp. 82–127. [Google Scholar]
- Bittelli, M.; Flury, M. Errors in water retention curves determined with pressure plates. Soil Sci. Soc. Am. J. 2009, 73, 1453–1460. [Google Scholar] [CrossRef] [Green Version]
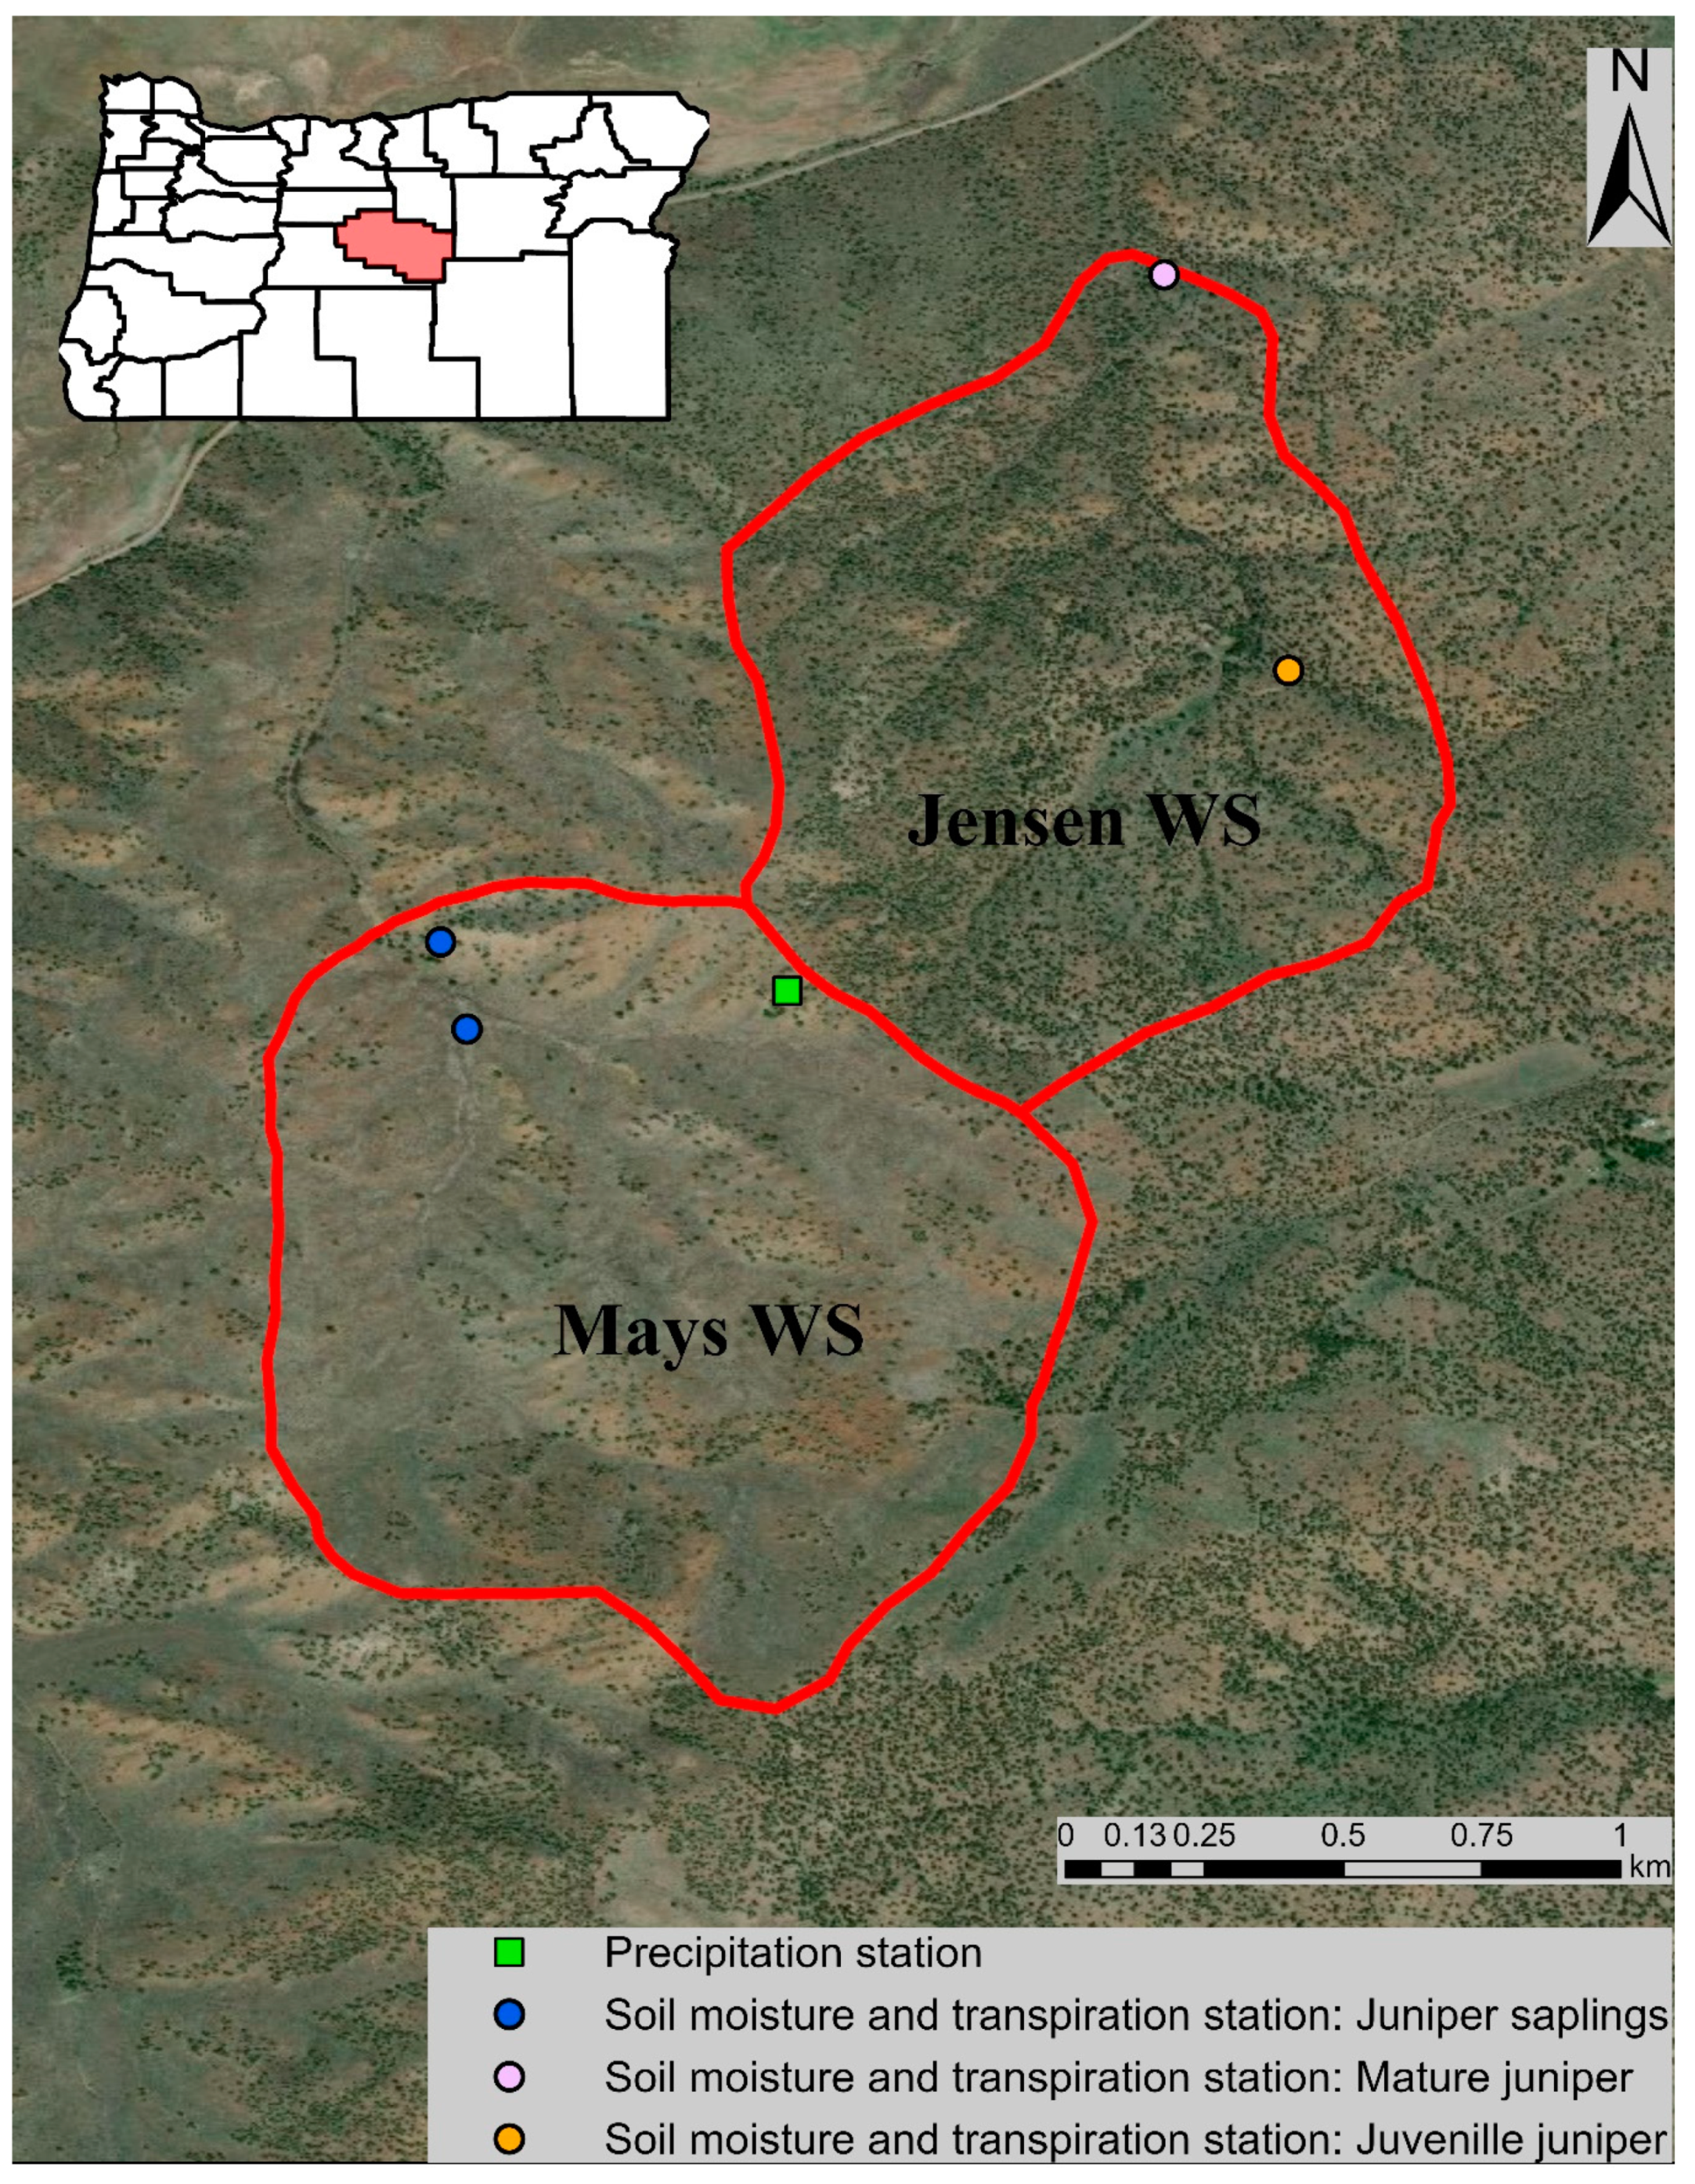
Figure 1.
Map of the study area showing Mays WS and Jensen WS, indicating the locations of different monitoring instrumentation used in this study. The monitoring station for mature juniper in Jensen WS is located at 1370 m elevation, in alluvial deposits [60]. The other monitoring stations are located at elevations ranging from 1400 m to 1524 m, in mostly fractured basalt [30,60]. Base map source: Esri, Digital Globe, GeoEye, Earthstar Geographics, CNES/Airbus DS, U.S. Department of Agriculture (USDA), U.S. Geological Survey (USGS), AeroGRID, IGN, and the GIS User Community. Oregon counties map source: Esri, TomTom North America, Inc., U.S. Census Bureau, USDA, National Agricultural Statistics Service (NASS). Spatial reference: GCS WGS 1984.

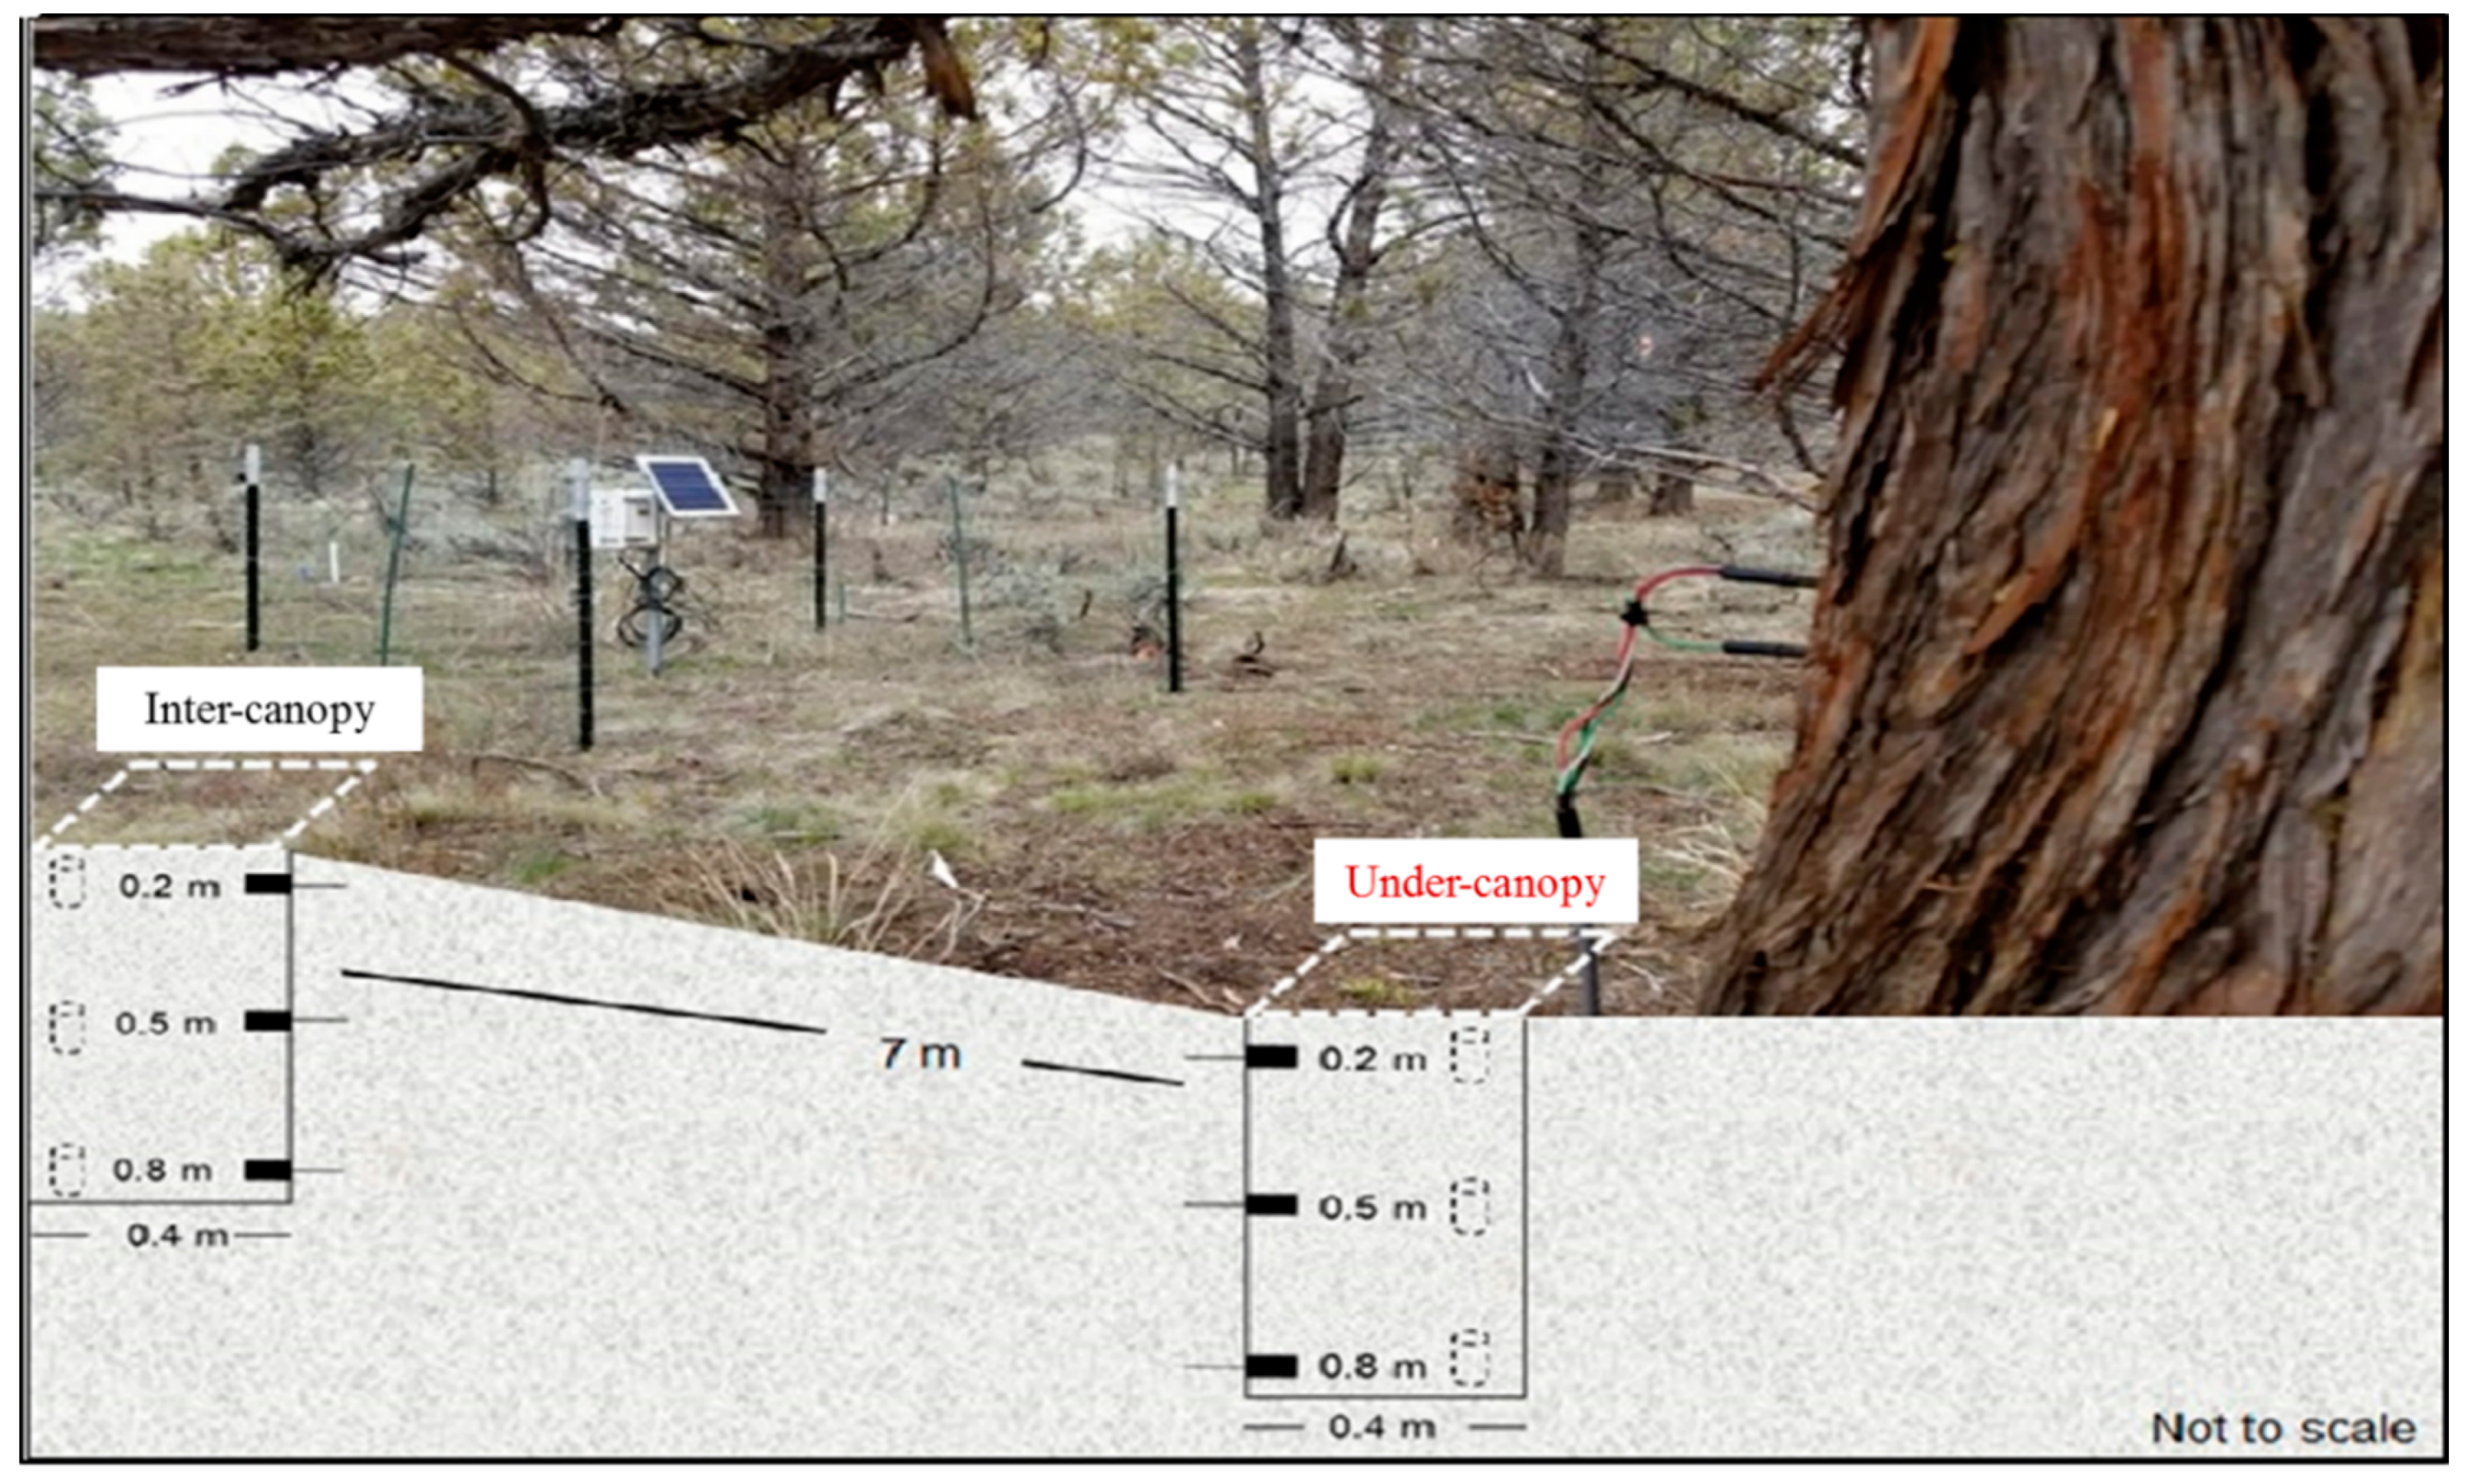
Figure 2.
Schematic illustrating soil moisture sensor placement, soil sampling depth at under-canopy and inter-canopy locations, and a thermal dissipation probe installation for transpiration measurement in the valley location in Jensen WS.
Figure 2.
Schematic illustrating soil moisture sensor placement, soil sampling depth at under-canopy and inter-canopy locations, and a thermal dissipation probe installation for transpiration measurement in the valley location in Jensen WS.

Figure 3.
Monthly leaf water potential at predawn (least water stressed) and midday (most water stressed), and transpiration estimate for western juniper growth stages: sapling, juvenile, and mature. Data points are mean ± standard error.
Figure 3.
Monthly leaf water potential at predawn (least water stressed) and midday (most water stressed), and transpiration estimate for western juniper growth stages: sapling, juvenile, and mature. Data points are mean ± standard error.

Figure 4.
Daily averaged precipitation (Ppt) and soil moisture content (θ) at different soil depths (0.2, 0.5, and 0.8 m) in inter-canopy zones for the Mays-East and Mays-West monitoring locations in Mays WS.
Figure 4.
Daily averaged precipitation (Ppt) and soil moisture content (θ) at different soil depths (0.2, 0.5, and 0.8 m) in inter-canopy zones for the Mays-East and Mays-West monitoring locations in Mays WS.

Figure 5.
Daily averaged precipitation (Ppt) and soil moisture content (θ) at different soil depths (0.2, 0.5, and 0.8 m) in inter-canopy and under-canopy zones for Jensen-Upslope and Jensen-Valley monitoring locations in Jensen WS.
Figure 5.
Daily averaged precipitation (Ppt) and soil moisture content (θ) at different soil depths (0.2, 0.5, and 0.8 m) in inter-canopy and under-canopy zones for Jensen-Upslope and Jensen-Valley monitoring locations in Jensen WS.

Figure 6.
Juniper sapling daily averaged transpiration rates and soil moisture content, 0 to 0.8 m (θtot) in response to precipitation (Ppt) inputs in the Mays-West and Mays-East monitoring locations at Mays WS.
Figure 6.
Juniper sapling daily averaged transpiration rates and soil moisture content, 0 to 0.8 m (θtot) in response to precipitation (Ppt) inputs in the Mays-West and Mays-East monitoring locations at Mays WS.

Figure 7.
Juniper daily averaged transpiration and soil moisture content, 0 to 0.8 m (θtot) response to precipitation (Ppt) inputs in the Jensen-Upslope and Jensen-Valley monitoring locations at Jensen WS.
Figure 7.
Juniper daily averaged transpiration and soil moisture content, 0 to 0.8 m (θtot) response to precipitation (Ppt) inputs in the Jensen-Upslope and Jensen-Valley monitoring locations at Jensen WS.

Table 1.
Sensor information and characteristics of sapling and juvenile juniper. Tree height, tree maximum width, and equipped stem/branch diameter were measured. Equipped stem/branch area and leaf area were computed.
Table 1.
Sensor information and characteristics of sapling and juvenile juniper. Tree height, tree maximum width, and equipped stem/branch diameter were measured. Equipped stem/branch area and leaf area were computed.
| Tree No. | SHB Sensor Model | Tree Height (m) | Tree Maximum Width (m) | Equipped Stem/Branch Diameter (mm) | Equipped Stem/Branch Area (mm2) | Leaf Area (m2) |
|---|---|---|---|---|---|---|
| S1 | SGB16 | 1.55 | 0.70 | 15 | 177 | 8.3 |
| S2 | SGB19 | 1.30 | 1.05 | 21 | 346 | 11.3 |
| S3 | SGB25 | 1.50 | 0.80 | 28 | 615 | 7.3 |
| S4 | SGB25 | 1.40 | 0.52 | 28 | 615 | 9.3 |
| J1 | SGB35 | 2.90 | 0.89 | 40 | 1256 | 14.4 |
| J2 | SGB35 | 3.75 | 1.14 | 40 | 1256 | 15.9 |
Table 2.
Sensor information and characteristics of the mature juniper trees. Basal diameter, basal circumference, and tree diameter at sensor placement were measured. Leaf area and sap woody area were computed.
Table 2.
Sensor information and characteristics of the mature juniper trees. Basal diameter, basal circumference, and tree diameter at sensor placement were measured. Leaf area and sap woody area were computed.
| Tree No. | TDP Sensor Model (mm) | Basal Diameter (m) | Basal Circumference (m) | Tree Diameter at Sensor Placement (m) | Leaf Area (m2) | Sap Wood Area (m2) |
|---|---|---|---|---|---|---|
| M1 | 50 | 0.87 | 2.85 | 0.70 | 619.3 | 0.1118 |
| M2 | 50 | 0.75 | 2.47 | 0.60 | 532.5 | 0.1023 |
| M3 | 30 | 0.52 | 1.74 | 0.38 | 363.8 | 0.0811 |
| M4 | 30 | 0.37 | 1.27 | 0.28 | 256.1 | 0.0649 |
| M5 | 30 | 0.52 | 1.74 | 0.37 | 364.5 | 0.0812 |
| M6 | 30 | 0.52 | 1.73 | 0.43 | 361.0 | 0.0807 |
| M7 | 30 | 0.40 | 1.39 | 0.30 | 284.1 | 0.0694 |
Table 3.
Transpiration rates of juniper sapling in the treated Mays WS, averaged by individual sapling (S1–S4), and by all-saplings, for summer (1 July to 30 September), autumn (1 October to 31 December), winter (1 January to 31 March), and spring (1 April to 30 June), from July 2017 through October 2019. Different lowercase letters (a, b, c) along rows indicate significant differences (p ≤ 0.05) in mean transpiration rate by sapling for each season. Different uppercase letters (A, B, C, D, E) along the last column indicate mean transpiration differences (p ≤ 0.05) by season for all saplings. Numbers in parentheses in S1–S4 represent the number of days when sap flow data were collected for each individual tree. Numbers in parentheses for all saplings represent the number of averaged days using data from at least two saplings. N/A = Data not available.
| Season, Year | Mean Transpiration Rate (L day−1) | ||||
|---|---|---|---|---|---|
| S1 | S2 | S3 | S4 | All Saplings | |
| Summer, 2017 | 2.59(43) a | 2.93(30) a | N/A | N/A | 2.76(24) A |
| Autumn, 2017 | 0.26(22) b | 0.60(27) a | N/A | N/A | 0.43(22) D |
| Spring, 2018 | 0.70(31) b | 1.30(29) a | N/A | N/A | 1.00(28) BC |
| Summer, 2018 | 0.46(72) c | 1.32(71) a | 0.68(51) b | 0.71(52) b | 0.79(81) C |
| Autumn, 2018 | 0.12(56) c | 0.29(54) ab | 0.21(65) bc | 0.30(68) a | 0.23(80) E |
| Winter, 2019 | 0.12(81) c | 0.23(84) ab | 0.23(79) b | 0.28(81) a | 0.22(88) E |
| Spring, 2019 | 0.55(39) bc | 1.13(87) a | 0.74(80) b | 0.53(73) c | 0.74(84) C |
| Summer, 2019 | 0.79(78) c | 1.55(85) a | 0.98(82) b | 0.75(63) c | 1.02(90) B |
| Autumn, 2019 | 0.14(30) b | 0.70(31) a | N/A | N/A | 0.42(30) D |
Table 4.
Transpiration rates of juniper juvenile trees in the untreated Jensen WS, averaged by individual tree (J1 and J2), and by both juvenile trees, for summer (1 July to 30 September), autumn (1 October to 31 December), winter (1 January to 31 March), and spring (1 April to 30 June), from April 2018 through September 2019. Different lowercase letters (a, b) along rows indicate significant differences (p ≤ 0.05) in mean transpiration rate by juvenile tree for each season. Different uppercase letters (A, B, C, D) along the last column indicate mean differences (p ≤ 0.05) by season for both trees. Numbers in parentheses in J1 and J2 represent the number of days when sap flow data were collected for each individual tree. Numbers in parentheses for both juvenile trees represent the number of averaged days. N/A = Data not available.
| Season, Year | Mean Transpiration Rate (L day−1) | ||
|---|---|---|---|
| J1 | J2 | Both Juvenile Trees | |
| Spring 2018 | 1.79(52) a | 1.42(53) b | 1.61(51) BC |
| Summer 2018 | 1.39(66) a | 1.26(67) a | 1.33(66) C |
| Autumn 2018 | 0.25(29) a | 0.28(29) a | 0.27(29) D |
| Winter 2019 | 0.24(10) a | 0.15(6) a | 0.19(6) D |
| Spring 2019 | 1.69(42) a | 1.83(42) a | 1.76(42) AB |
| Summer 2019 | 1.66(49) b | 2.35(51) a | 2.00(48) A |
Table 5.
Transpiration rates of mature juniper trees in the untreated Jensen WS, averaged by individual tree (M1–M7), and by all mature trees, for summer (1 July to 30 September), autumn (1 October to 31 December), winter (1 January to 31 March), and spring (1 April to 30 June), from May 2017 through September 2019. Different lowercase letters (a, b, c, d, e) along rows indicate significant differences (p ≤ 0.05) in mean transpiration rate by mature trees for each season. Different uppercase letters (A, B, C, D, E, F) along the last column indicate mean differences (p ≤ 0.05) by season for all trees. Numbers in parentheses for M1–M7 represent the number of days when sap flow data were collected for each individual tree. Numbers in parentheses for all trees represent the number of averaged days. N/A = Data not available.
| Season, Year | Mean Transpiration Rate (L day−1) | |||||||
|---|---|---|---|---|---|---|---|---|
| M1 | M2 | M3 | M4 | M5 | M6 | M7 | All Trees | |
| Spring 2017 | N/A | N/A | 75.1(30) b | 104.0(32) a | N/A | N/A | N/A | 89.6(30) B |
| Summer 2017 | 93.7(13) b | N/A | 117.4(90) b | 134.5(91) a | N/A | N/A | N/A | 115.2(90) A |
| Autumn 2017 | 95.7(16) a | N/A | 36.9(15) b | 52.9(16) b | N/A | N/A | N/A | 61.8(16) CD |
| Spring 2018 | 138.9(46) a | N/A | 52.5(65) cd | 78.1(67) b | 34.1(16) d | 66.3(69) b | 66.5(39) bc | 72.7(69) BC |
| Summer 2018 | 83.5(38) a | 73.9(46) a | 37.4(84) b | 71.2(90) a | 44.2(73) b | 47.1(90) b | 42.0(83) b | 57.0(90) D |
| Autumn 2018 | 32.6(9) a | N/A | 8.3(2) d | 13.5(11) b | 17.5(11) b | 13.9(11) b | 10.3(3) c | 16.0(11) E |
| Winter 2019 | 18.7(6) a | N/A | 6.2(1) d | 12.5(14) b | 13.6(10) b | 9.6(11) c | 11.7(7) b | 12.1(14) F |
| Spring 2019 | 106.4(43) a | N/A | 37.4(59) c | 77.3(60) b | 44.2(52) c | 31.7(60) d | 24.1(58) e | 53.5(60) D |
| Summer 2019 | N/A | N/A | 44.4(82) c | 91.9(71) a | 63.1(81) b | 41(78) c | N/A | 60.1(82) D |
Table 6.
Monthly averaged maximum (T Max), minimum (T min), and mean (T mean) air temperature in Celsius degrees, and total monthly and annual precipitation (Ppt) in mm at the CCPWS site for the three-year (2017–2019) duration of the study.
Table 6.
Monthly averaged maximum (T Max), minimum (T min), and mean (T mean) air temperature in Celsius degrees, and total monthly and annual precipitation (Ppt) in mm at the CCPWS site for the three-year (2017–2019) duration of the study.
| Month | 2017 | 2018 | 2019 | |||||||||
|---|---|---|---|---|---|---|---|---|---|---|---|---|
| T Max | T Min | T Mean | Ppt | T Max | T Min | T Mean | Ppt | T Max | T Min | T Mean | Ppt | |
| January | 1 | −11 | −5 | 64 | 7 | −3 | 1 | 28 | 6 | −6 | −1 | 35 |
| February | 5 | −5 | 0 | 54 | 5 | −8 | −2 | 5 | 2 | −9 | −4 | 22 |
| March | 9 | −1 | 4 | 51 | 9 | −5 | 1 | 28 | 10 | −6 | 1 | 53 |
| April | 10 | −2 | 4 | 48 | 14 | −2 | 6 | 19 | 15 | 0 | 7 | 49 |
| May | 19 | 1 | 10 | 12 | 22 | 5 | 13 | 58 | 20 | 3 | 11 | 1 |
| June | 23 | 5 | 15 | 16 | 25 | 5 | 15 | 28 | 22 | 7 | 14 | 13 |
| July | 31 | 9 | 21 | 1 | 33 | 10 | 22 | 3 | 26 | 10 | 18 | 1 |
| August | 30 | 10 | 20 | 7 | 31 | 9 | 20 | 1 | 28 | 12 | 20 | 30 |
| September | 23 | 5 | 14 | 7 | 25 | 4 | 14 | 1 | 19 | 7 | 12 | 11 |
| October | 15 | −1 | 6 | 35 | 15 | 0 | 7 | 17 | 11 | −1 | 5 | 7 |
| November | 7 | −3 | 1 | 25 | 10 | −4 | 2 | 21 | 10 | −1 | 4 | 4 |
| December | 5 | −8 | −2 | 9 | 2 | −7 | −3 | 36 | 2 | −4 | −1 | 21 |
| Total | 329 | 245 | 247 | |||||||||
Table 7.
Fitted linear equations obtained to determine relationships between daily transpiration rates (y) and top 0.8 m soil average soil moisture content (θtot ) for years 2017–2019.
Table 7.
Fitted linear equations obtained to determine relationships between daily transpiration rates (y) and top 0.8 m soil average soil moisture content (θtot ) for years 2017–2019.
| Period | Location (Growth Stage) | Equation (f = y0 + a x θtot) | R2 | SE | p-Value |
|---|---|---|---|---|---|
| July–October 2017 | Mays-East (Sapling) | f = −4.66 − 0.494 θtot | 0.449 | 0.069 | <0.001 |
| July–September 2017 | Jensen-Valley (Mature) | f = −134.89 + 24.71 θtot | 0.529 | 2.276 | <0.0001 |
| July–October 2018 | Mays-East (Sapling) | f = −2.34 + 0.24 θtot | 0.788 | 0.013 | <0.001 |
| July–September 2018 | Jensen-Upslope (Juvenile) | f = −9.99 + 0.53 θtot | 0.875 | 0.039 | <0.0001 |
| July–October 2018 | Jensen-Valley (Mature) | f = −179.76 + 20.83 θtot | 0.796 | 1.087 | <0.0001 |
| July–September 2019 | Mays-East (Sapling) | f = 0.210 − 0.034 θtot | 0.347 | 0.034 | <0.001 |
| July–September 2019 | Mays-West (Sapling) | f = 1.171 − 0.025 θtot | 0.035 | 0.015 | 0.1096 |
| July–September 2019 | Jensen-Upslope (Juvenile) | f = −7.289 − 0.64 θtot | 0.504 | 0.090 | <0.0001 |
| July–September 2019 | Jensen-Valley (Mature) | f = 28.012 − 2.453 θtot | 0.031 | 1.494 | 0.1405 |
© 2020 by the authors. Licensee MDPI, Basel, Switzerland. This article is an open access article distributed under the terms and conditions of the Creative Commons Attribution (CC BY) license (http://creativecommons.org/licenses/by/4.0/).
Share and Cite
MDPI and ACS Style
Abdallah, M.A.B.; Durfee, N.; Mata-Gonzalez, R.; Ochoa, C.G.; Noller, J.S. Water Use and Soil Moisture Relationships on Western Juniper Trees at Different Growth Stages. Water 2020, 12, 1596. https://doi.org/10.3390/w12061596
AMA Style
Abdallah MAB, Durfee N, Mata-Gonzalez R, Ochoa CG, Noller JS. Water Use and Soil Moisture Relationships on Western Juniper Trees at Different Growth Stages. Water. 2020; 12(6):1596. https://doi.org/10.3390/w12061596
Chicago/Turabian StyleAbdallah, Mohamed A. B., Nicole Durfee, Ricardo Mata-Gonzalez, Carlos G. Ochoa, and Jay S. Noller. 2020. "Water Use and Soil Moisture Relationships on Western Juniper Trees at Different Growth Stages" Water 12, no. 6: 1596. https://doi.org/10.3390/w12061596
Note that from the first issue of 2016, this journal uses article numbers instead of page numbers. See further details here.