Performance of KMA-ADAM3 in Identifying Asian Dust Days over Northern China


National Institute of Meteorological Sciences, 33, Seohobuk-ro, Seogwipo-si, Jeju-do 63568, Korea
*
Author to whom correspondence should be addressed.
Atmosphere 2020, 11(6), 593; https://doi.org/10.3390/atmos11060593
Submission received: 24 April 2020
/
Revised: 27 May 2020
/
Accepted: 1 June 2020
/
Published: 4 June 2020
(This article belongs to the Section Aerosols)
Abstract
:Recently, the Korea Meteorological Administration developed Asian Dust Aerosol Model version 3 (ADAM3) by incorporating additional parameters into ADAM2, including anthropogenic particulate matter (PM) emissions, modification of dust generation by considering real-time surface vegetation, and assimilations of surface PM observations and satellite-measured aerosol optical depth. This study evaluates the performance of ADAM3 in identifying Asian dust days over the dust source regions in Northern China and their variations according to regions and soil types by comparing its performance with ADAM2 (from January to June of 2017). In all regions the performance of ADAM3 was markedly improved, especially for Northwestern China, where the threat score (TS) and the probability of detection (POD) improved from 5.4% and 5.5% to 30.4% and 34.4%, respectively. ADAM3 outperforms ADAM2 for all soil types, especially for the sand-type soil for which TS and POD are improved from 39.2.0% and 50.7% to 48.9% and 68.2%, respectively. Despite these improvements in regions and surface soil types, Asian dust emission formulas in ADAM3 need improvement for the loess-type soils to modulate the overestimation of Asian dust events related to anthropogenic emissions in the Huabei Plain and Manchuria.
1. Introduction
Dust events occur when strong or turbulent wind occurs over dry surfaces with exposed and loose soil. These conditions are common in semi-arid and arid regions [1], including northeastern Asia, where Asian dust events are most frequent in spring, from March to May [2,3,4]. Previous studies showed that Asian dust caused a number of adverse effects on human health, agricultural land, infrastructure, and transport [1,5,6,7,8]. In recent decades, the expansion of arid regions in eastern Mongolia and the Manchuria has increased the frequency of dust events in downwind regions, including Korea and Japan [9]. Some studies showed a decrease in China’s dust event frequency [9,10,11], which may be related to warmer temperatures and increased rainfall [12,13] and/or to government-sponsored land restoration and afforestation schemes [14] that resulted in the contraction of arid regions. However, the impact of afforestation schemes is a matter for debate [15,16].
A number of nations run dust models for operational forecasting. The Korea Meteorological Administration (KMA) has also operated the Asian Dust Aerosol Model (ADAM) for forecasting Asian dust events since 2007. The ADAM model has been continuously improved through various research projects [17,18,19]. Most recently, KMA developed version 3 of the ADAM model (ADAM3) to improve operational Asian dust forecasting by incorporating anthropogenic emissions, the daily dust emissions reduction factor [20], and assimilations of particulate matter (PM) data from surface stations and satellite-observed aerosol optical depth (AOD) data into the ADAM2 model.
Evaluation of the forecast skills of a dust model is critical for improving operational dust forecasting. The Asian node of the Sand and Dust Storm Warning Advisory and Assessment System (SDS-WAS) of the World Meteorological Organization inter-compares Asian dust predictions by KMA, China Meteorological Administration, the European Centre for Medium-Range Weather Forecasts, the National Centers for Environmental Prediction, the Japan Meteorological Agency, and the Finnish Meteorological Institute through annual meetings of a regional steering group.
Recently, Hong et al. [21] evaluated version 2 of ADAM (ADAM2) for its ability to detect Asian dust events over the dust source regions in Northern China during the first half (from January to June) of 2017. They showed that ADAM2 notably underestimates Asian dust days in Northwestern China and overestimates them in Manchuria. They also showed that the performance of ADAM2 in estimating Asian dust emissions varied systematically according to dominant soil types. For example, the model worked well for the Gobi and sand-type soils, but substantially overestimated dust emissions for the loess-type soils. They concluded that the ADAM2 errors likely originated from the formulation of soil-type-dependent dust emissions in addition to the inability to account for the concentration of fine PMs (less than PM2.5) from anthropogenic source, resulting in large false rates over heavily industrialized regions.
This study aims to evaluate the performance of ADAM3 in identifying the Asian dust days over the dust source regions in Northern China and their variations according to regions and soil types over the same period as in Hong et al. [21]. The effects of the incorporation of the anthropogenic emissions, data assimilation, and the daily dust emission reduction factor, which is newly added to ADAM3, are also synthetically analyzed with inter-comparison of the ADAM2 simulations shown in Hong et al. [21].
2. Data Analysis and Methods
2.1. Asian Dust Aerosol Model 3 (ADAM3)
The family of the ADAM models was developed by incorporating the Asian dust emission algorithm [17,22] into the Community Multiscale Air Quality (CMAQ) model version 4.7.1 of United States Environmental Protection Agency (US EPA) (Washington, DC, USA) [23], which is the chemical transport model developed at the United States Environmental Protection Agency. The meteorological fields used to drive ADAM simulations were obtained from the Unified Model (UM) of the United Kingdom Met Office [24], which is the current global forecasting model used at KMA.
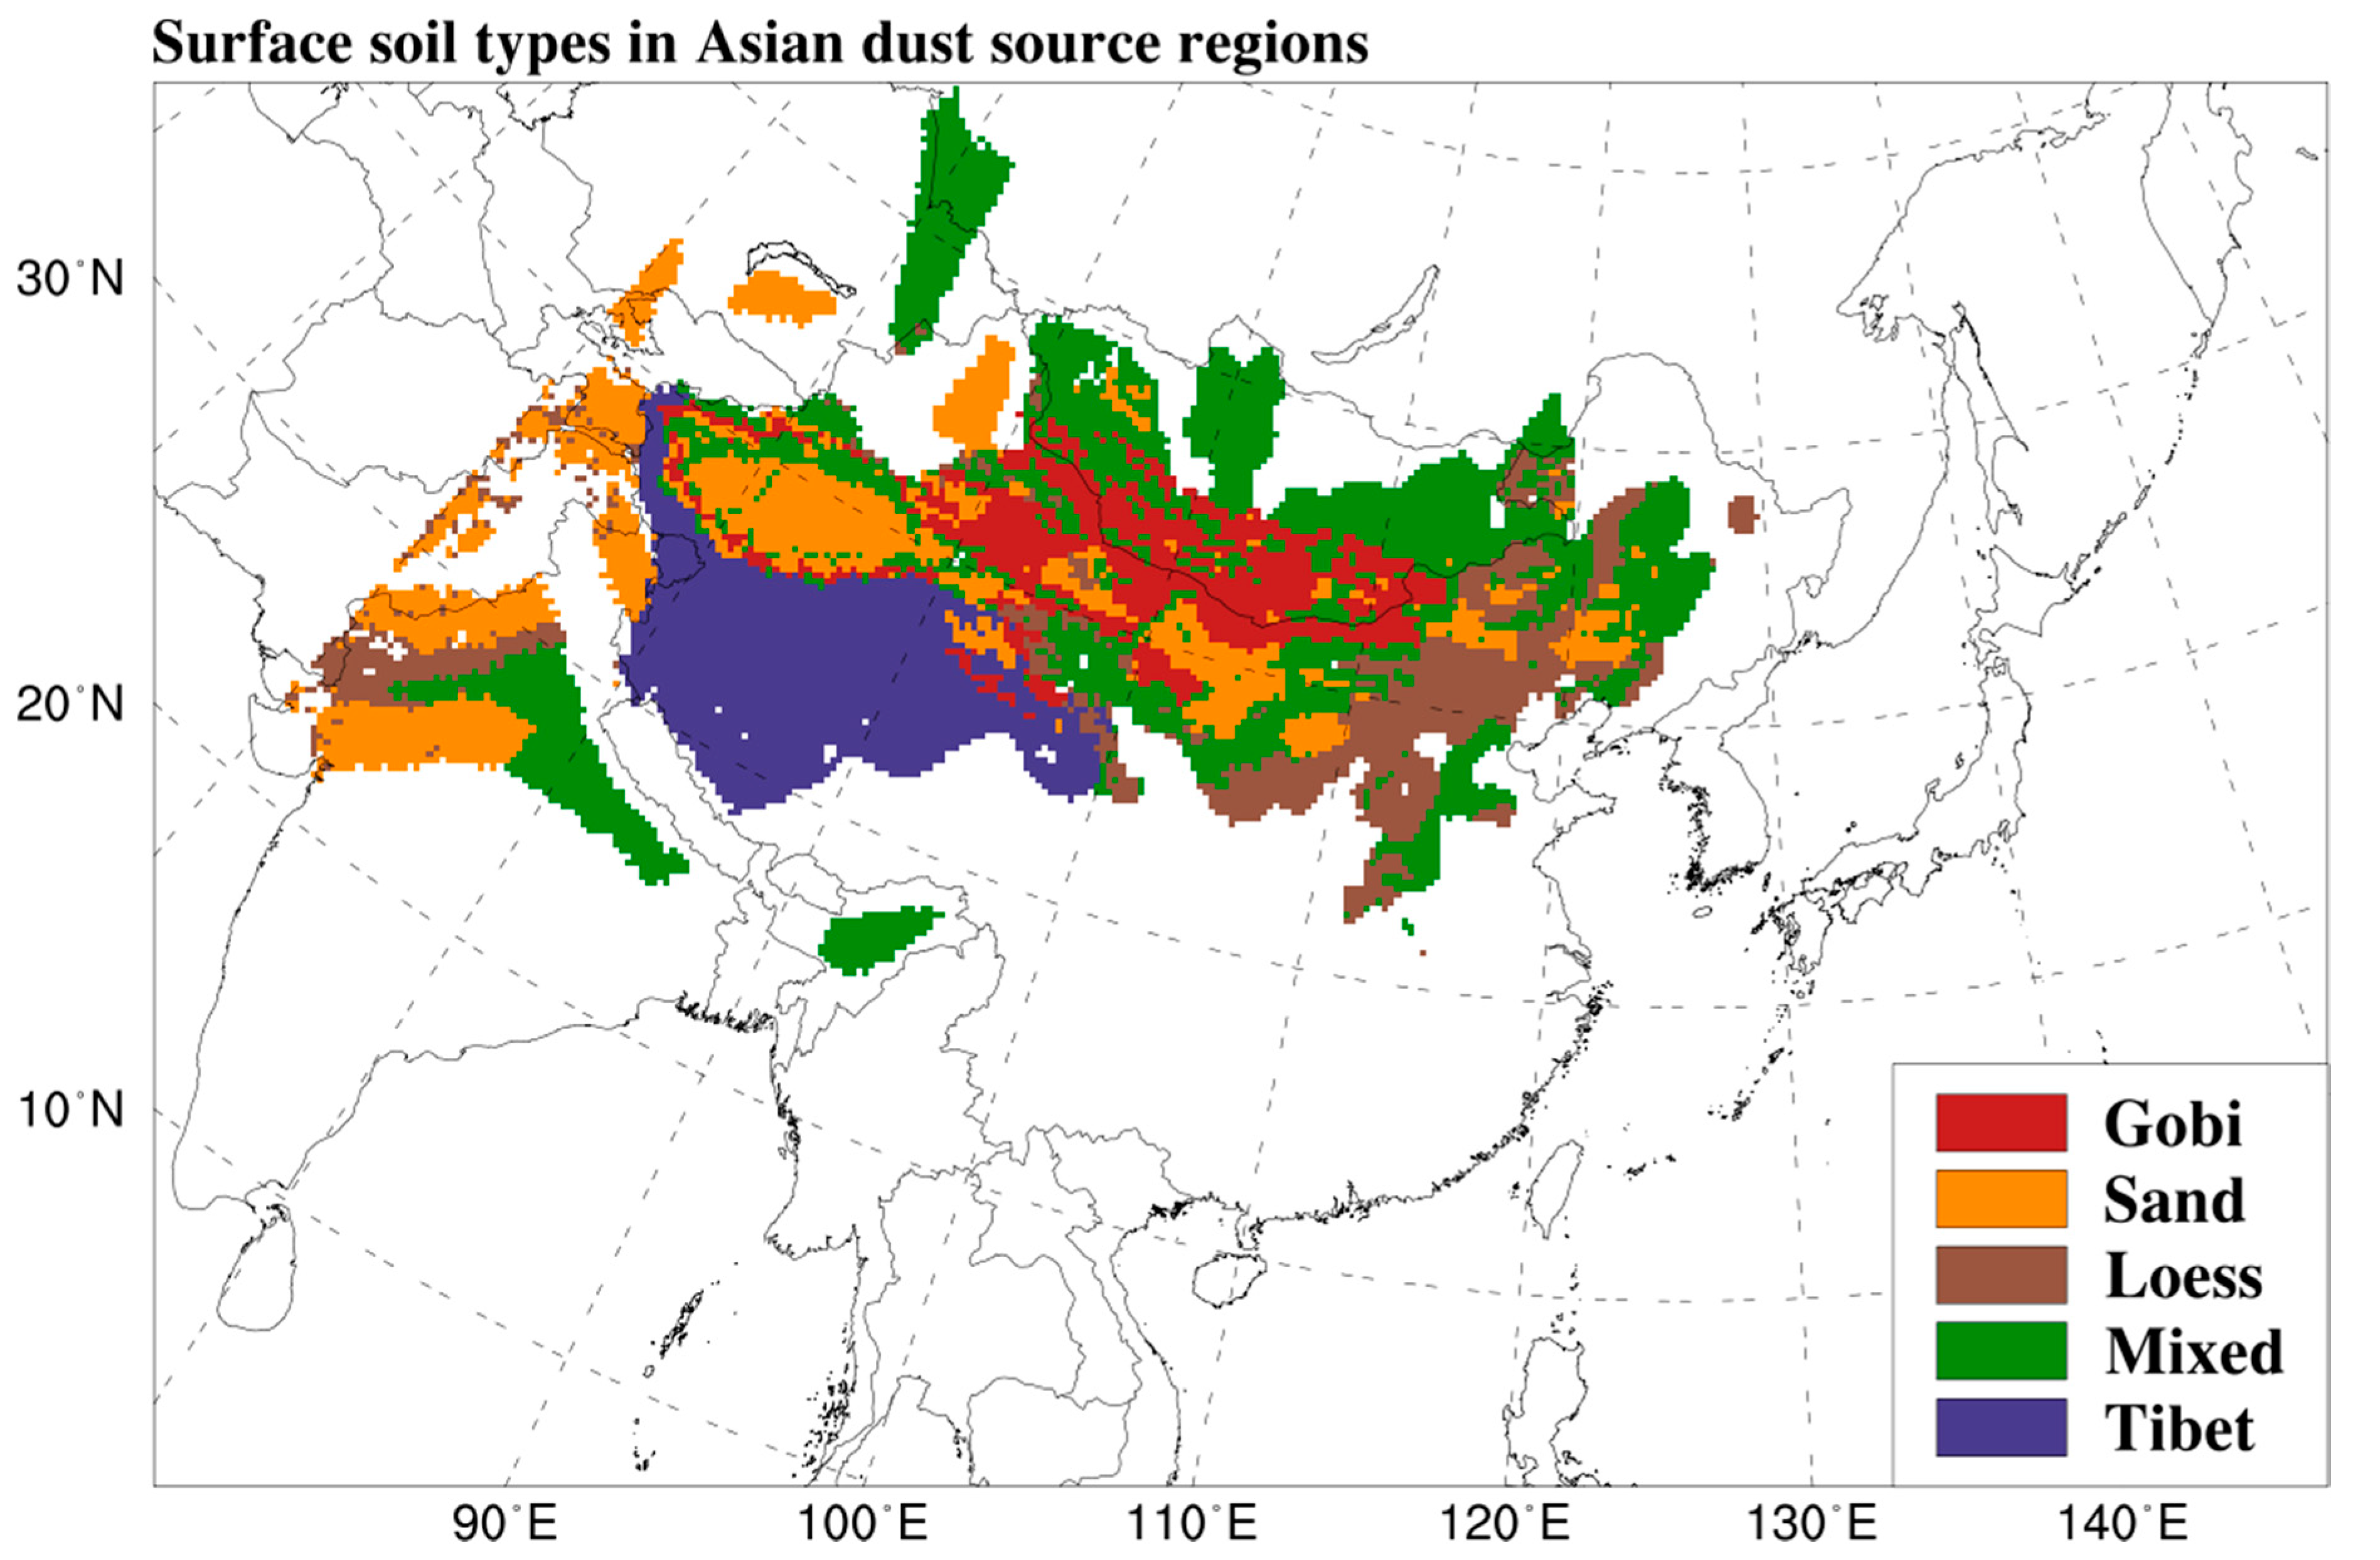
The Asian dust emission in the ADAM models is determined by the threshold wind speed, relative humidity, temperature, and precipitation which vary with time and region. Asian dust emission amounts are proportional to the fourth power of the friction velocity and are reduced according to the fraction of vegetated surfaces [18]. Asian dust source regions are defined by dust occurrence statistics using 3-h SYNOP reports from 1998 to 2006 and are largely limited to Northern China, Mongolia, Northern India, and Central Asia (Figure 1). Surface soils over the dust source region in ADAM models are categorized as Gobi, sand, loess, mixed, and Tibetan. Since it is difficult to determine the presence of Asian dust event in the Tibetan plateau area because of the lack of observation stations, we have excluded the Tibet type from the analysis in this study.
ADAM3 has been developed by incorporating the following parameters into ADAM2: anthropogenic emissions, assimilations of surface-observed PM and satellite-observed AODs, and the daily dust emissions reduction factor due to vegetation cover. The anthropogenic emissions were prepared using Sparse Matrix Operator of Kernel Emissions (SMOKE) version 3.1 of US EPA (Washington, DC, USA) [25] with inputs from the Clean Air Policy Support System (CAPSS) 2013 of the Korea Ministry of Environment for South Korea and the MICS-Asia 2010 data for the regions outside South Korea. Natural emissions amounts were produced using Model of Emissions of Gases and Aerosols from Nature (MEGAN) version 2.0.4 [26]. The hourly PM assimilation was performed using PM10 mass concentration data from 1107 stations in Korea and China that passed quality control steps. The input PM10 data were interpolated using the optimal interpolation method with correlation lengths of 250 km and 400 m in the horizontal and vertical, respectively, for defining the background error covariance. The KMA Communication, Ocean and Meteorological Satellite (COMS) aerosol optical depth (AOD) data over the 90-min period around the analysis time were assimilated using the optimal interpolation method once a day at 6:00 UTC. The horizontal correlation lengths for the satellite AOD assimilation was set at 25 km, the same as the ADAM3 model resolution.
A daily dust emission reduction factor was applied to ADAM3 on the basis of the updated moderate resolution imaging spectroradiometer (MODIS) normalized difference vegetation index (NDVI) data in order to reflect recent vegetation effects in dust emissions in the Asian dust source regions [19]. A sensitivity study [19] showed that the new reduction factor contributes positively to the forecast skill in the dust source as well the downwind regions. In Table 1, we summarized the main difference between ADAM2 and ADAM3.
2.2. Threshold PM Values for Identifying Asian Dust Events
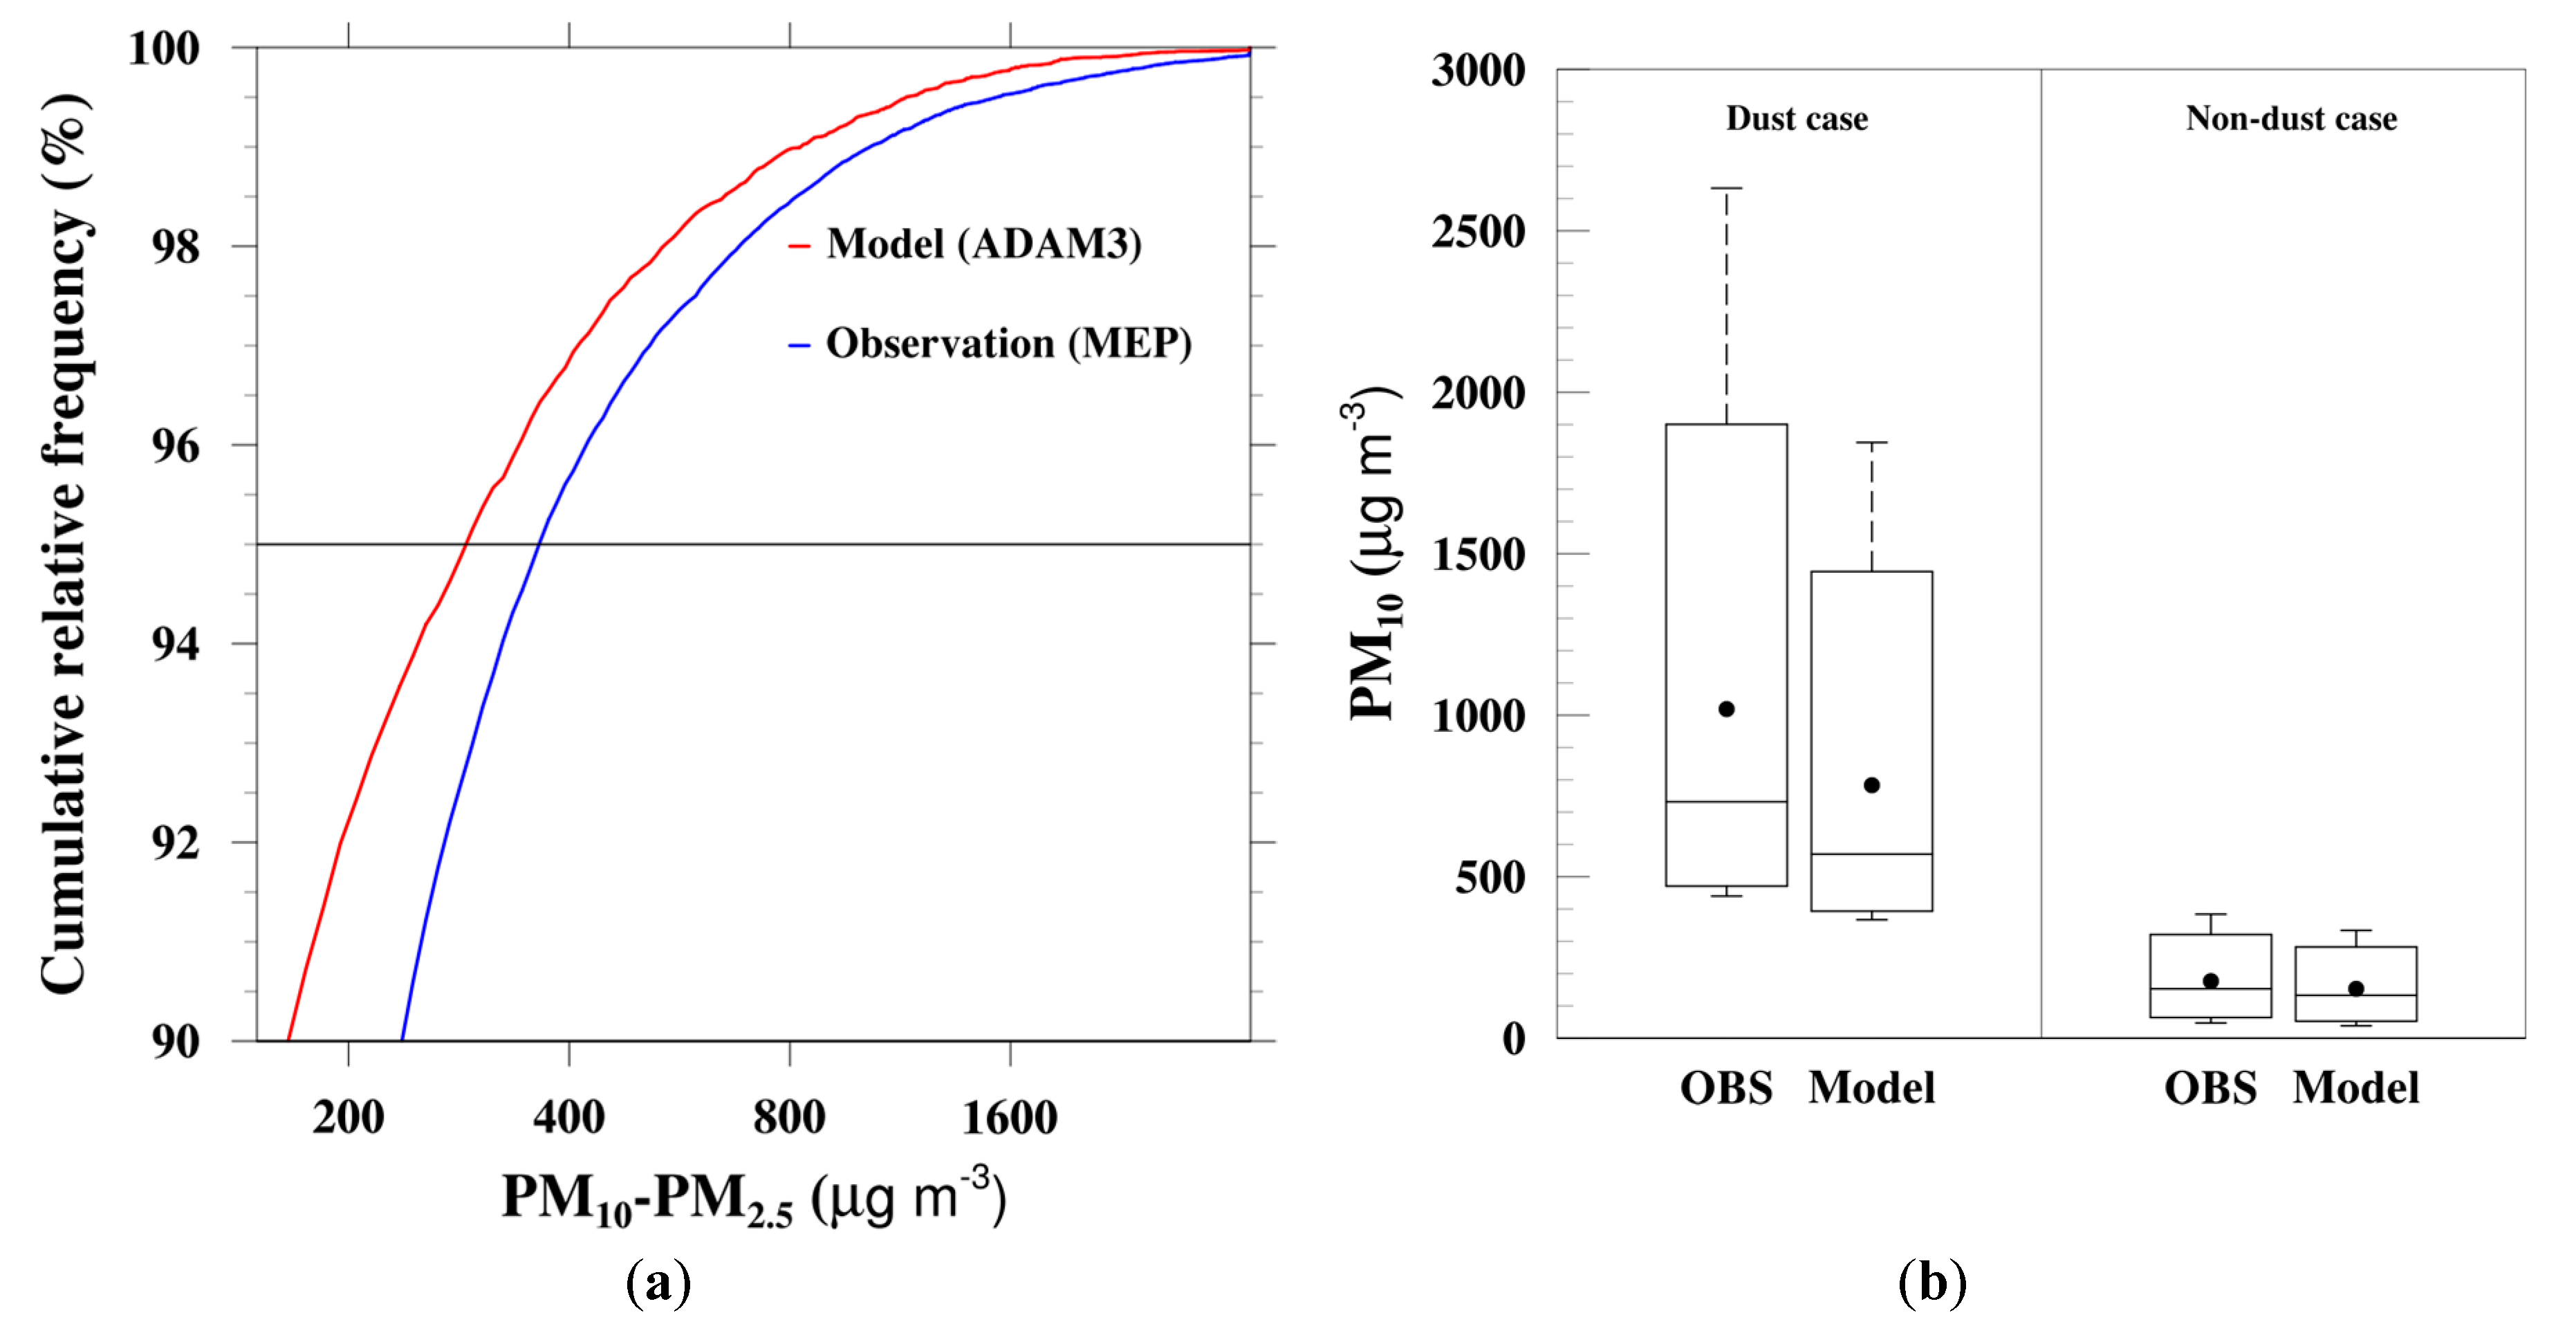
The threshold values for identifying Asian dust days were developed using the hourly PM observations of the Ministry of Environmental Protection (MEP) of China and the ADAM3 simulations over the dust source regions in Northern China during the period from January to June of 2017. The hourly PM10 and PM2.5 mass concentration data observed at 355 MEP observatories in the Northern China Asian dust source region were employed in this study. Based on the Asian dust events reported at the GTS synoptic stations in the Asian dust source region within 35 °N–50 °N and 75 °E–130 °E, we assumed that 5% of all weather events corresponded to Asian dust days in the source region based on Hong et al. [21]. To remove the effect of anthropogenic aerosols, Hong et al. [21] used the difference between PM10 and PM2.5 in determining an Asian dust day. Note that the PM2.5 data in Northern China originate primarily from anthropogenic sources. Figure 2a shows the cumulative relative frequency of PM10PM2.5 for the ADAM3 simulation and MEP observations. The 95th percentile values are 369 µg m−3 for MEP observations and 293 µg m−3 for ADAM3 simulations. We adopted these as threshold values for identifying Asian dust days in MEP observations and ADAM3 simulations, respectively.
Figure 2b shows a box-whisker plot of the PM10 concentrations for the Asian dust days and the days free of Asian dusts in the MEP data, and the ADAM3 simulations with threshold values of 369 µg m−3 and 293 µg m−3, respectively. In both the observations and simulations, PM10 concentrations for the Asian dust days are clearly separated from those for the non-Asian dust days. ADAM3 generally underestimates the PM10 concentrations in the Asian dust cases over the dust source regions in Northern China from January to June of 2017. This underestimation of the ADAM3 PM10 concentrations may have resulted due to the lower threshold value for simulations.
2.3. Evaluation of Accuracy
We evaluated four measures of accuracy for binary forecasts [21]: the hit rate (HR), the threat score (TS), the probability of detection (POD), and the false-alarm rate (FAR), of the ADAM3-simulated Asian dust days against the MEP-observed ones using a 2 × 2 contingency table (Table 2), constructed as follows: when a day was identified as an Asian dust day in both the observation and the simulation, it was counted toward the hit (denoted as H); if an observed Asian dust day was not an Asian dust day in the simulation, it was a miss (denoted as M); when a non-Asian dust day in the observations was an Asian dust day in the simulations, it was a false-alarm (denoted as FA); and when both the observations and simulations indicated a non-Asian dust day, it was a correct rejection (denoted as CR). For a total number of forecasts n, n = H+M+FA+CR, the hit rate (HR) was HR = (H + CR)/n × 100, the threat score (TS) was TS = H/(H + M + FA) × 100, the probability of detection (POD) was POD = H/(H + M) × 100, and the false-alarm rate (FAR) was FAR = FA/(H + FA) × 100. The worst and best possible HR, TS, and POD were zero and one, respectively. The worst and the best FAR were one and zero, respectively.
3. Results and Discussion
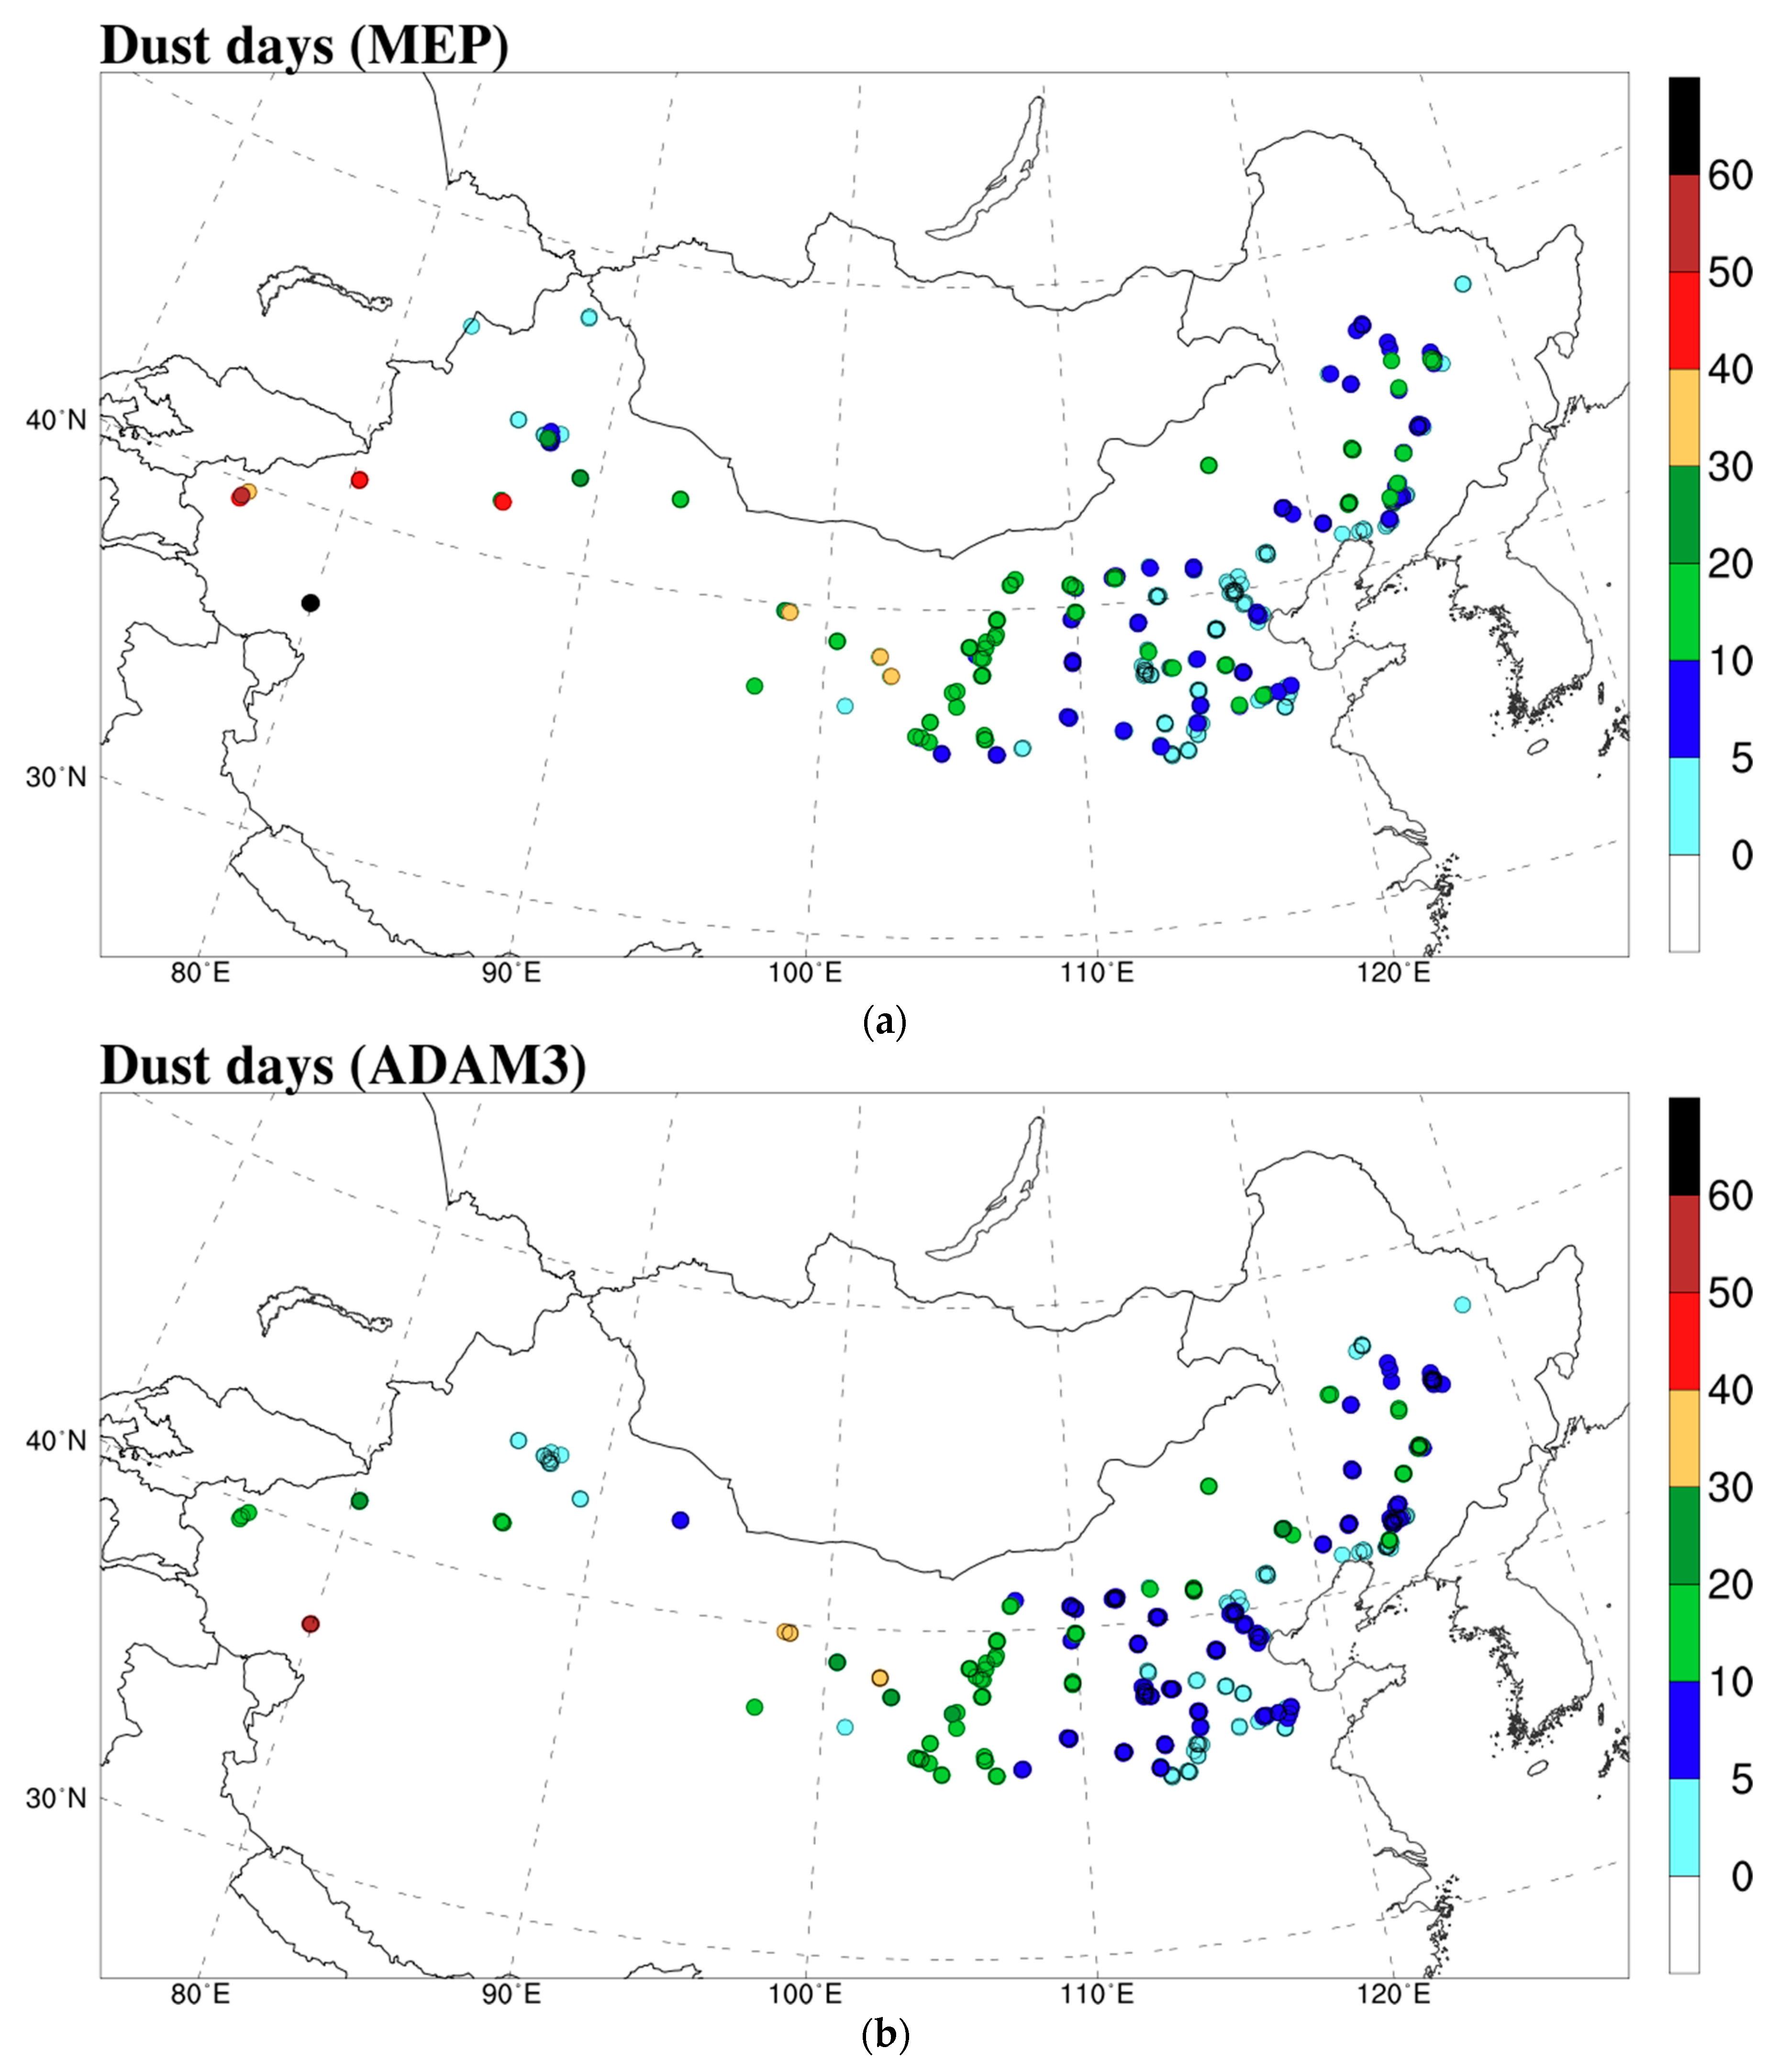
The Asian dust day threshold value in Section 2 was used to analyze the Asian dust days in the observed and simulated data. Figure 3a shows the regional variations in the MEP-based Asian dust days. Asian dust days were observed most frequently in northwestern China, near the border with Kyrgyzstan, Tajikistan, and Pakistan, as well as within the Inner Mongolia near the Badain Juran and the Tengger deserts. Asian dust days were also frequent in the vicinity of the four provinces around the Huabei Plain. Figure 3b shows that ADAM3 reasonably simulated the MEP-observed regional variations in Asian dust days, except in Northwestern China, where the simulations notably underestimated the observations.
3.1. Assessments According to Dust Source Regions
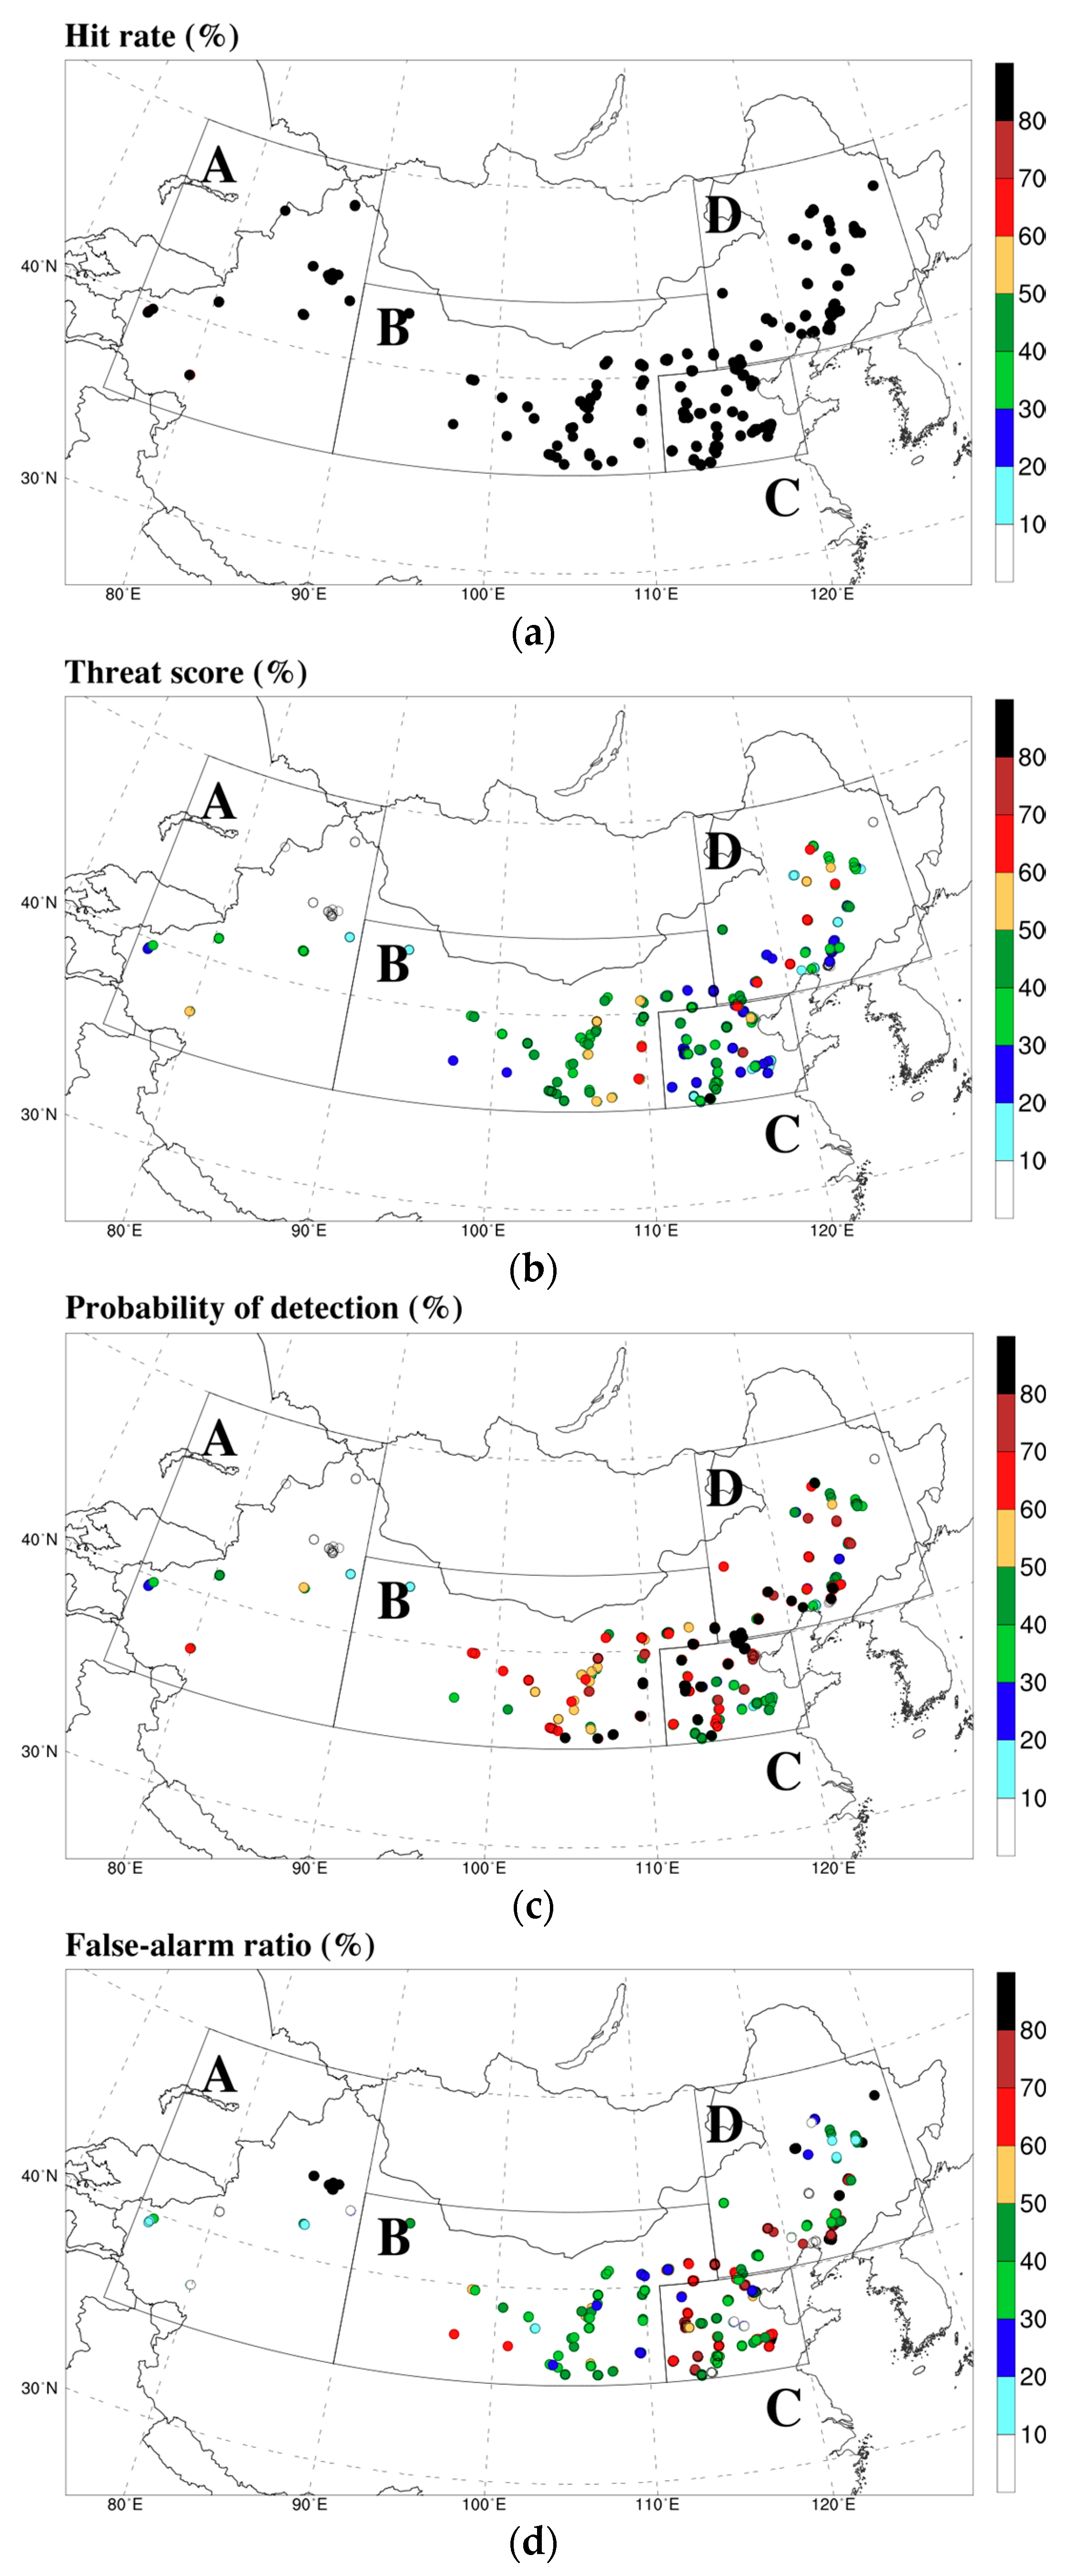
In order to assess the ADAM3 performance in simulating Asian dust days in each region, the dust source region in Northern China was divided into four regions: Northwestern China (Region A), Inner Mongolia (Region B), the four provinces near the Huabei Plain (Region C), and Manchuria (Region D).
Figure 4 shows the spatial distributions of the four measures of accuracy (HR, TS, POD, and FA). The accuracy values in each region are summarized in Table 3, together with results of Hong et al. [14] for comparison. In all regions, the performance of ADAM3 was markedly improved, especially in Region A. TS and POD in Region A improved from 5.4% and 5.5% to 30.4% and 34.4%, respectively; however, the lower POD value (30.4%), compared to the other regions (45.1–58.6%), indicated that ADAM3 substantially underestimated the Asian dust events in Region A. TS (39.3%) and POD (58.6%) were highest in the Badain Juran and the Tengger deserts in Region B.
In Regions C and D, HR values of 96.7% and 95.3%, respectively, were higher than those of other regions. But FAR values of 61.6% and 61.7%, respectively, were also larger than those of other regions. Thus, TS in Regions C and D were relatively lower at 26.7% and 26.1%, respectively. The large amount of anthropogenic aerosol emissions in Regions C and D likely caused the relatively higher FAR and relatively lower TS values compared to Regions A and B.
3.2. Assessments According to Soil Types
To assess the ADAM3 performance in identifying Asian dust days according to different surface soil types (Gobi-, sand-, loess-, and mixed-type surface soils), a similar region-based analysis for Regions A–D was carried out for each soil type (Table 4). Sand was the dominant soil type in Region A and mixed and Gobi were dominant within Region B. Mixed- and loess-type soils were present in Region C. Lastly, Region D showed a similar pattern to Region C but sand-type soil was also present. In order to directly compare with the results of Hong et al. [21], we evaluated the four accuracy measures in all regions except Region A and this was because of the problematic ADAM2 performance in identifying the Asian dust days in this region.
For all soil types, ADAM3 simulations yielded higher evaluation metrics than ADAM2 simulations; largest improvements in TS (48.9%) and POD (68.2%) occurred for the sand-type soil. These values were improved by 25% and 35%, respectively, from 39.2% and 50.7% in ADAM2 simulations [21]. For the Gobi-type soil, TS and POD improved from 29.0% and 37.2%, to 37.4% and 57.2%, respectively. However, for loess-type soil, FAR remained large (62.4%), although it was improved from ADAM2 (FAR value of 71.9%) [21]. This indicates that ADAM3 still simulated excessive Asian dust events for the loess area, resulting in larger FAR values in Regions C and D compared to other regions.
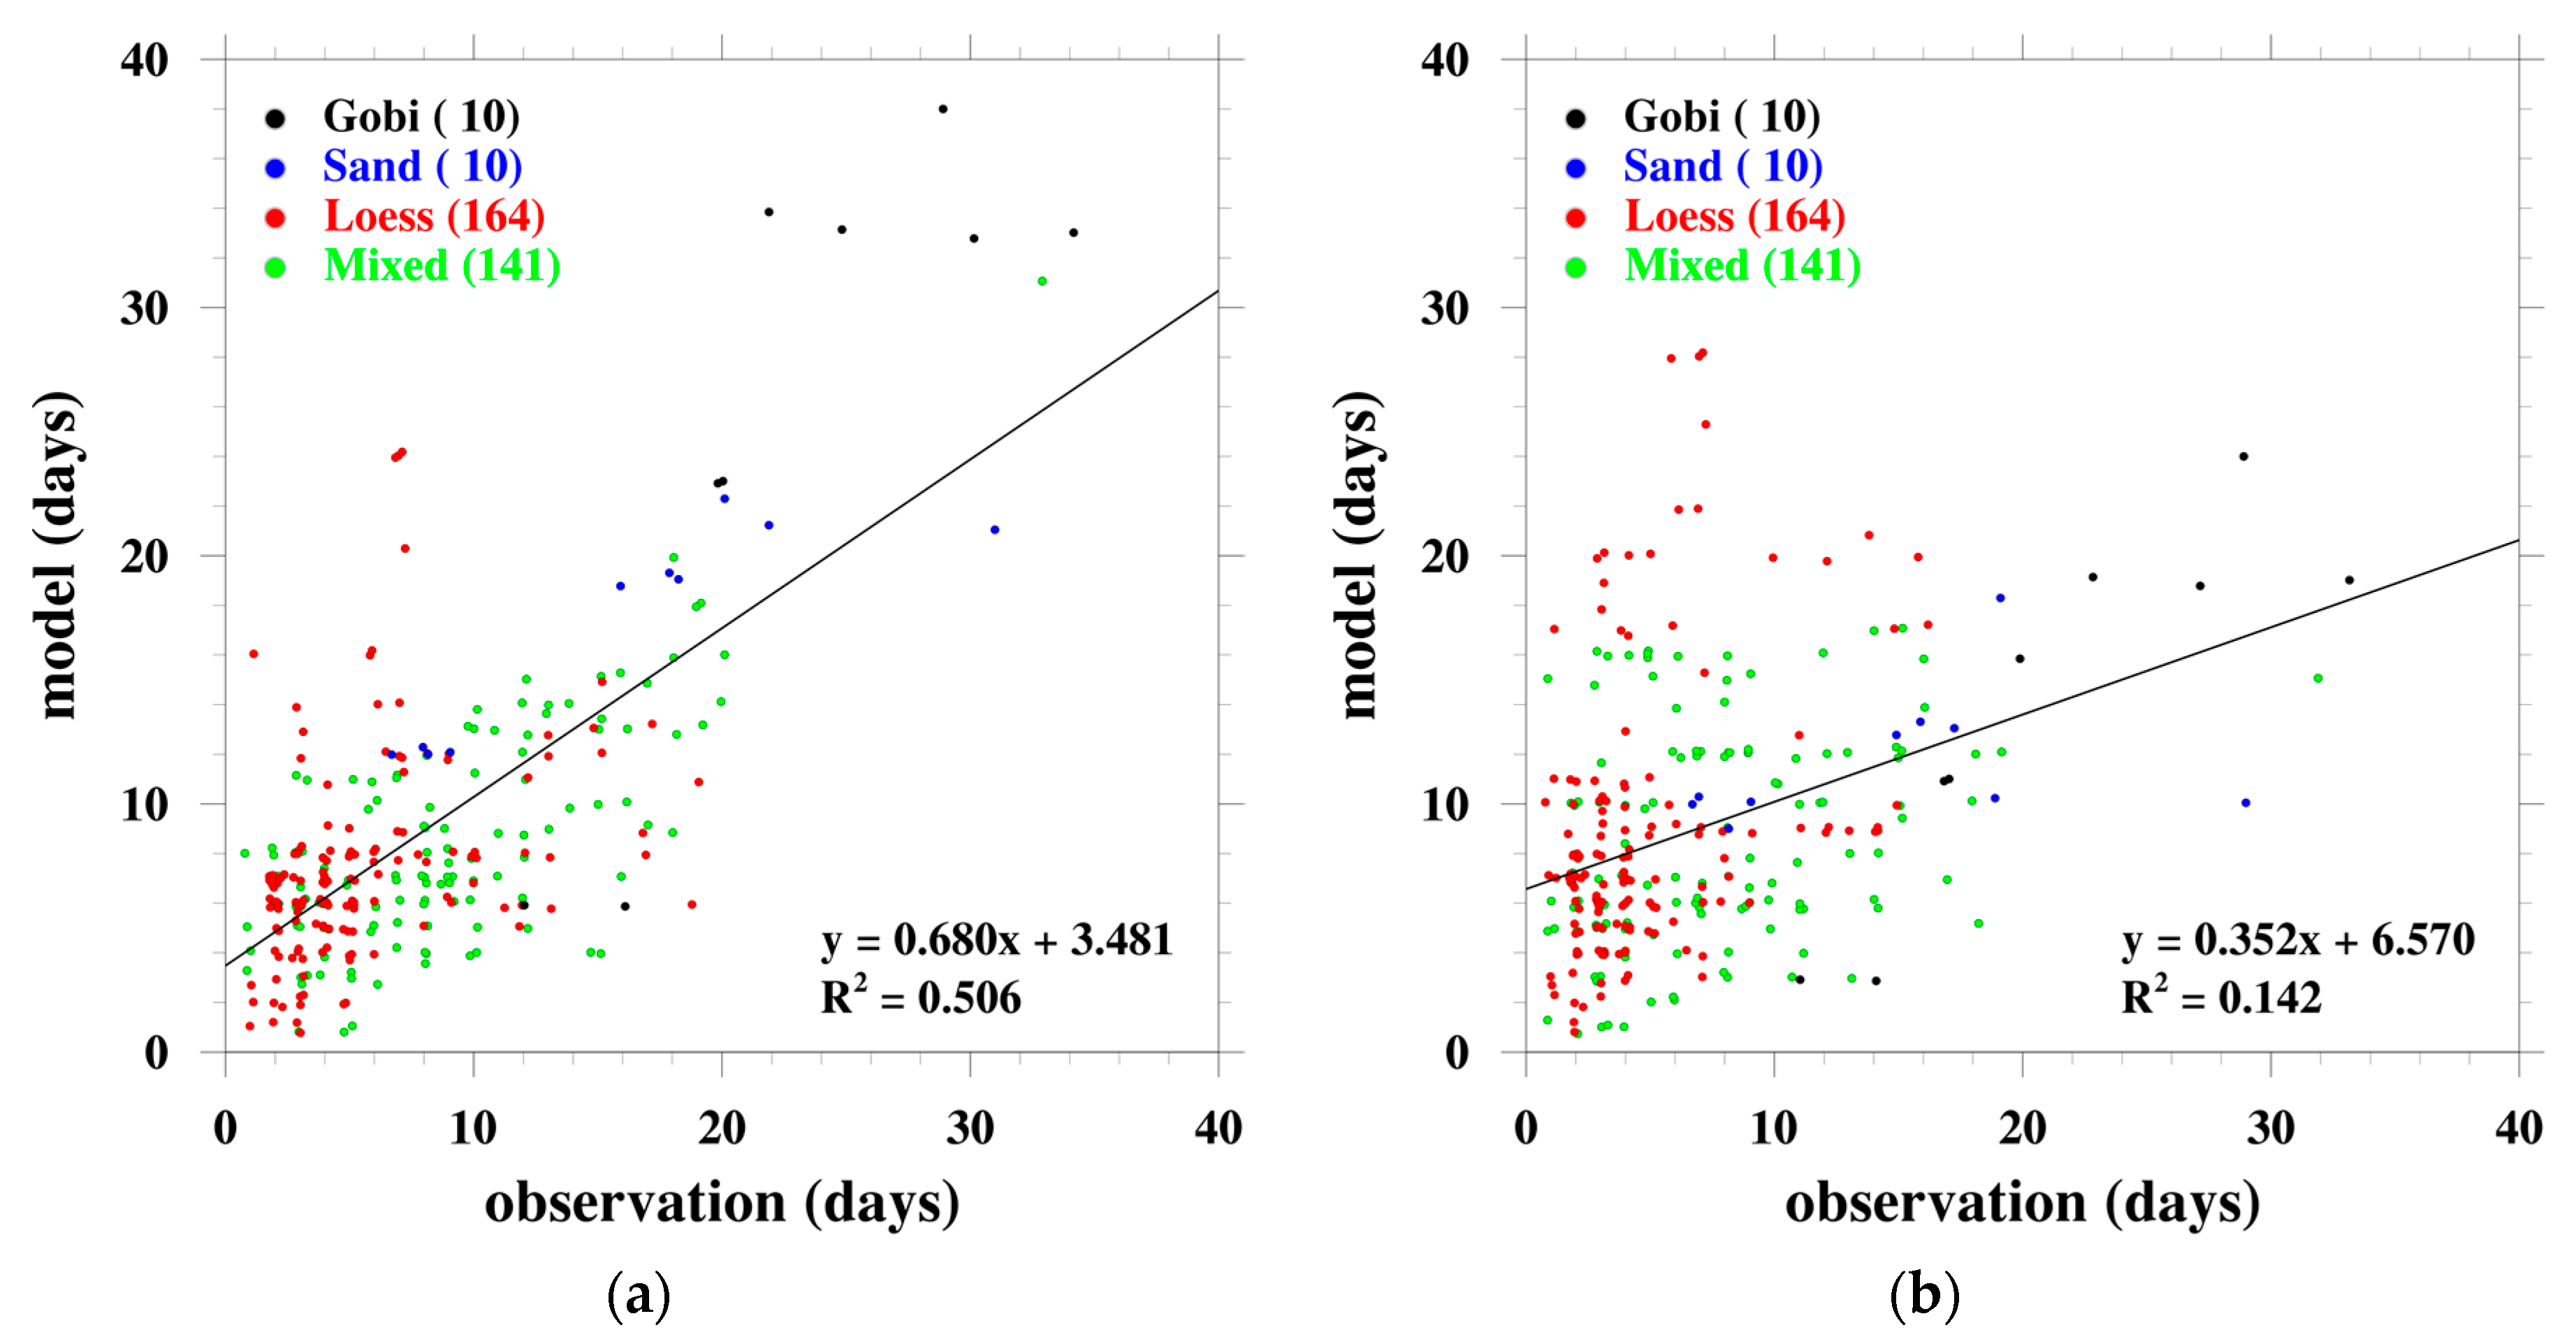
Figure 5a,b compare the Asian dust days at all Northern China MEP sites except Region A in ADAM3 and ADAM2 simulations, respectively, against MEP observations according to surface soil types. Both ADAM3 and ADAM2 reasonably simulated the observed number of Asian dust days for the Gobi- and sand-type soils. The ADAM3 simulations yielded a stronger linear relationship (Figure 5a) with the observations than the ADAM2 simulations (Figure 5b) and the improvement for the mixed-type soil was particularly noticeable. The determination coefficient (R2) of regression equation improved from 0.142 (ADAM2) to 0.506 (ADAM3). However, the model still overestimated the number of Asian dust days for the loess-type soil, implying that the dust emission algorithm in ASDAM3 needed further improvements for loess-type soil.
4. Conclusions
In an attempt to improve operational Asian dust forecasting, the KMA has developed ADAM3 by incorporating into ADAM2 the following parameters: anthropogenic emissions, assimilation of surface PM observations and satellite-measured AOD, and the effects of real-time vegetation reducing dust emissions (the daily dust emission reduction factor). Using the observed and ADAM3-simulated hourly PM data from January to June of 2017, we evaluated the performance of ADAM3 relative to findings by Hong et al. [21] of its preceding version, ADAM2, in identifying Asian dust days over the dust source regions in Northern China according to regions and soil types. The daily maximum values of the difference in mass concentration data 369 and 293 µg m−3 (given by PM10PM2.5) were adopted as threshold values for identifying Asian dust events for MEP data and ADAM3 simulations, respectively.
In all regions, performance of ADAM3 was markedly improved from ADAM2, although ADAM3 still substantially underestimated Asian dust days in Northwestern China. The TS and POD values were highest in the Inner Mongolia, while the large amount of anthropogenic aerosol emissions near the Huabei Plain and Manchuria yielded relatively higher FAR and relatively lower TS values compared to northwestern China and the Inner Mongolia.
ADAM3 also outperformed ADAM2 in identifying the Asian dust days for all soil types, including the Gobi- and mixed-type, and especially for the sand-type soils; however, ADAM3 substantially overestimated the observed Asian dust days for the loess-type soils. This overestimation contributed to the higher FAR and relatively lower TS values in the Huabei Plain and the Manchuria. Thus, Asian dust emission formulas in ADAM3 need to be improved for the loess-type soils. In addition, the effects of the large anthropogenic emissions in these regions on the overestimation of Asian dust days need further investigation, especially in developing an improved Asian dust threshold value.
In this study, we synthetically evaluated the integrated effects of the incorporation of anthropogenic emissions, surface PM and satellite AOD data assimilation, and the daily dust emission reduction factor into the most recent KMA ADAM3 model for forecasting Asian dust events through the examination of model performance for identifying Asian dust events over dust source region in Northern China. The effects of individual components of these additions exert their own unique effects and will be evaluated in future studies for further improving the ADAM3. To deal with sand and dust storm (SDS), the United Nations Convention to Combat Desertification (UNCCD), in collaboration with the United Nations Environment Program (UNEP) and the World Meteorological Organization (WMO), have been developing a global SDS-source base-map, which is designed as a set of geo-referenced numerical maps at the 1 km resolution and focuses on soil surface status, including textural and structural soil parameters, moisture, and temperature as well as vegetation coverage to better detect active and dormant SDS sources [27]. This SDS-source base-map will improve the predictive abilities of dust models. In order to further improve the predictability of dust model related to the lack of observation, it is necessary to construct more observation stations over dust source region, such as the Tibetan plateau area. Trying to improve the poor performance of ADAM3 in Northwestern China will be the main target of our future study.
Author Contributions
Conceptualization, S.-B.R.; methodology, S.-B.R. and J.K.; software, J.H.C.; validation, S.-B.R. and J.H.C.; formal analysis, S.-B.R. and J.K.; investigation, J.K.; resources, J.H.C.; data curation, J.H.C.; writing—original draft preparation, S.-B.R.; writing—review and editing, S.-B.R. and J.K.; visualization, J.H.C.; supervision, S.-B.R.; project administration, S.-B.R.; funding acquisition, S.-B.R. All authors have read and agreed to the published version of the manuscript.
Funding
This research was funded by the Korea Meteorological Administration Research and Development Program “Development of Asian Dust and Haze Monitoring and Prediction Technology” under Grant (KMA2018-00521) and “Development and Assessment of IPCC AR6 Climate Change Scenario” under Grant (KMA2018-00321).
Conflicts of Interest
The authors declare no conflicts of interest.
References
- UNEP; WMO; UNCCD. Global Assessment of Sand and Dust Storms; United Nations Environment Programme: Nairobi, Kenya, 2016; pp. 6–19, 46–62. [Google Scholar]
- Chun, Y.; Boo, K.O.; Kim, J.; Park, S.U.; Lee, M. Synopsis, transport, and physical characteristics of Asian dust in Korea. J. Geophys. Res. Atmos. 2001, 106, 18461–18469. [Google Scholar] [CrossRef] [Green Version]
- Kim, J. Transport routes and source regions of Asian dust observed in Korea during the past 40 years (1965–2004). Atmos. Environ. 2008, 42, 4778–4789. [Google Scholar] [CrossRef]
- Shao, Y.; Klose, M.; Wyrwoll, K.H. Recent global dust trend and connections to climate forcing. J. Geophys. Res. Atmos. 2013, 118, 11–107. [Google Scholar] [CrossRef]
- Giannadaki, D.; Pozzer, A.; Lelieveld, J. Modeled global effects of airborne desert dust on air quality and premature mortality. Atmos. Chem. Phys. 2014, 14, 957–968. [Google Scholar] [CrossRef] [Green Version]
- Kashima, S.; Yorifuji, T.; Bae, S.; Honda, Y.; Lim, Y.H.; Hong, Y.C. Asian dust effect on cause-specific mortality in five cities across South Korea and Japan. Atmos. Environ. 2016, 128, 20–27. [Google Scholar] [CrossRef]
- Kwon, H.J.; Cho, S.H.; Chun, Y.; Lagarde, F.; Pershagen, G. Effects of the Asian dust events on daily mortality in Seoul, Korea. Environ. Res. 2002, 90, 1–5. [Google Scholar] [CrossRef]
- Zhang, X.; Zhao, L.; Tong, D.; Wu, G.; Dan, M.; Teng, B. A systematic review of global desert dust and associated human health effects. Atmosphere 2016, 7, 158. [Google Scholar] [CrossRef] [Green Version]
- Lee, E.H.; Sohn, B.J. Recent increasing trend in dust frequency over Mongolia and Inner Mongolia regions and its association with climate and surface condition change. Atmos. Environ. 2011, 45, 4611–4616. [Google Scholar] [CrossRef]
- Fan, B.; Guo, L.; Li, N.; Chen, J.; Lin, H.; Zhang, X.; Shen, M.; Rao, Y.; Wang, C.; Ma, L. Earlier vegetation green-up has reduced spring dust storms. Sci. Rep. 2014, 4, 6749. [Google Scholar] [CrossRef]
- Zhu, C.; Wang, B.; Qian, W. Why do dust storms decrease in northern China concurrently with the recent global warming? Geophys. Res. Lett. 2008, 35, L18702. [Google Scholar] [CrossRef] [Green Version]
- Piao, S.; Fang, J.; Liu, H.; Zhu, B. NDVI-indicated decline in desertification in China in the past two decades. Geophys. Res. Lett. 2005, 32. [Google Scholar] [CrossRef]
- Sternberg, T.; Ruef, H.; Middleton, N. Contraction of the Gobi Desert, 2000–2012. Remote Sens. 2015, 7, 1346–1358. [Google Scholar] [CrossRef] [Green Version]
- Tan, M.; Li, X. Does the Green Great Wall effectively decrease dust storm intensity in China? A study based on NOAA NDVI and weather station data. Land Use Policy 2015, 43, 42–47. [Google Scholar] [CrossRef]
- Wang, X.M.; Zhang, C.X.; Hasi, E.; Dong, Z.B. Has the Three Norths Forest Shelterbelt Program solved the desertification and dust storm problems in arid and semiarid China? J. Arid Environ. 2010, 74, 13–22. [Google Scholar] [CrossRef]
- Middleton, N. Rangeland management and climate hazards in drylands: Dust storms, desertification and the overgrazing debate. Nat. Hazards 2018, 92, 57–70. [Google Scholar] [CrossRef] [Green Version]
- In, H.J.; Park, S.U. The soil particle size dependent emission parameterization for an Asian dust (Yellow Sand) observed in Korea in April 2002. Atmos. Environ. 2003, 37, 4625–4636. [Google Scholar] [CrossRef]
- Park, S.U.; Choe, A.; Lee, E.H.; Park, M.S.; Song, X. The Asian dust aerosol model 2 (ADAM2) with the use of normalized difference vegetation index (NDVI) obtained from the Spot4/vegetation data. Theor. Appl. Climatol. 2010, 101, 191–208. [Google Scholar] [CrossRef]
- Lee, S.-S.; Lee, E.H.; Sohn, B.J.; Lee, H.C.; Cho, J.H.; Ryoo, S.-B. Improved Dust Forecast by Assimilating MODIS IR-Based Nighttime AOT in the ADAM2 Model. SOLA 2017, 13, 192–198. [Google Scholar] [CrossRef] [Green Version]
- Lee, S.-S.; Lim, Y.-K.; Cho, J.H.; Lee, H.C.; Ryoo, S.-S. Improved Dust Emission Reduction Factor in the ADAM2 Model Using Real-Time MODIS NDVI. Atmosphere 2019, 10, 702. [Google Scholar] [CrossRef]
- Hong, S.K.; Ryoo, S.-S.; Kim, J.; Lee, S.-S. Prediction of Asian Dust Days over Northern China Using the KMA-ADAM2 Model. Weather Forecast 2019, 34, 1777–1787. [Google Scholar] [CrossRef]
- Park, S.U.; In, H.J. Parameterization of dust emission for the simulation of the yellow sand (Asian dust) event observed in March 2002 in Korea. J. Geophys. Res. Atmos. 2003, 108, 4618. [Google Scholar] [CrossRef]
- Byun, D.; Schere, K.L. Review of the governing equations, computational algorithms, and other components of the Models-3 Community Multiscale Air Quality (CMAQ) modeling system. Appl. Mech. Rev. 2006, 59, 51–77. [Google Scholar] [CrossRef]
- Davies, T.; Cullen, M.J.; Malcolm, A.J.; Mawson, M.H.; Staniforth, A.; White, A.A.; Wood, N. A new dynamical core for the Met Office’s global and regional modelling of the atmosphere. Q. J. Roy. Meteor. Soc. 2005, 131, 1759–1782. [Google Scholar] [CrossRef]
- Houyoux, M.R.; Vukovich, J.M. Updates to the Sparse Matrix Operator Kernel Emissions (SMOKE) modeling system and integration with Models-3. Emiss. Inventory: Reg. Strateg. Future 1999, 1461, 1–11. [Google Scholar]
- Guenther, A.; Karl, T.; Harley, P.; Wiedinmyer, C.; Palmer, P.I.; Geron, C. Estimates of global terrestrial isoprene emissions using MEGAN (Model of Emissions of Gases and Aerosols from Nature). Atmos. Chem. Phys. 2006, 6, 3181–3210. [Google Scholar] [CrossRef] [Green Version]
- The Science-Policy Interface, the UNCCD Knowledge Hub, and the Analysis, Dissemination and Accessibility of Best Practices. Available online: http://www.unccd.int/sites/default/files/sessions/documents/2019-07/ICCD_COP%2814%29_17-1910488E.pdf (accessed on 20 May 2020).
Figure 1.
Surface soil types in Asian dust source regions in the Asian Dust Aerosol Model (ADAM) (after Figure 1 of Park et al. [22]).

Figure 2.
(a) Cumulative relative frequency of particulate matter, PM10-PM2.5, in the ADAM3 simulation (red line) and that in the Ministry of Environmental Protection (MEP) observations (blue line) over dust source region in Northern China from January to June of 2017; (b) box plots of PM10 mass concentrations in the dust case and non-dust case in the ADAM3 simulation (model) and those in the MEP observations (OBS). Bars from the top represent 95%, 90%, 50%, 10%, and 5% of the total data and the dot point is the average value.

Figure 3.
Dust days over the dust source region in Northern China in the first half of 2017 derived from: (a) MEP observations and (b) ADAM3 simulations.
Figure 3.
Dust days over the dust source region in Northern China in the first half of 2017 derived from: (a) MEP observations and (b) ADAM3 simulations.

Figure 4.
(a) Hit rate; (b) threat score; (c) probability of detection; and (d) false-alarm ratio of the dust simulation in ADAM3 compared with those in MEP observations over the dust source region in Northern China (from January to June of 2017).
Figure 4.
(a) Hit rate; (b) threat score; (c) probability of detection; and (d) false-alarm ratio of the dust simulation in ADAM3 compared with those in MEP observations over the dust source region in Northern China (from January to June of 2017).

Figure 5.
Scatter plots of Asian dust days at all Northern China MEP sites except for Northwestern China in (a) ADAM3; and (b) ADAM2 simulations, respectively, to that in MEP observations according to surface soil types as Gobi (black), sand (blue), loess (red), and mixed (green) surface soil types.


Table 1.
Main differences of ADAM2 and ADAM3.
| Model Component | ADAM2 | ADAM3 |
|---|---|---|
| Data assimilation | NO DA | Optimal interpolation with surface PM10 concentration and satellite AOD |
| Dust reduction factor | Based on climatological NDVI | Based on most recent NDVI |
| Anthropogenic aerosol | No | Yes |
Table 2.
The contingency table for categorical verification of Asian dust day simulation.
| Observation | |||
|---|---|---|---|
| Asian dust day | non-Asian dust day | ||
| Simulation | Asian dust day | H | FA |
| non-Asian dust day | M | CR | |
Table 3.
Accuracy measures of ADAM3 simulations from January to June of 2017 at all MEP (Ministry of Environmental Protection) sites over the Regions A, B, C, and D compared with those of ADAM2 simulations [21]. A total number of forecasts (n) is 58,359.
Table 3.
Accuracy measures of ADAM3 simulations from January to June of 2017 at all MEP (Ministry of Environmental Protection) sites over the Regions A, B, C, and D compared with those of ADAM2 simulations [21]. A total number of forecasts (n) is 58,359.
| Region | Model | H | M | FA | CR | HR (%) | TS (%) | POD (%) | FAR (%) |
|---|---|---|---|---|---|---|---|---|---|
| A | ADAM3 | 209 | 399 | 79 | 3774 | 89.3 | 30.4 | 34.4 | 27.4 |
| ADAM2 | 30 | 519 | 12 | 3900 | 88.1 | 5.4 | 5.5 | 28.6 | |
| B | ADAM3 | 672 | 474 | 564 | 14,537 | 93.6 | 39.3 | 58.6 | 45.6 |
| ADAM2 | 455 | 582 | 454 | 14,756 | 93.6 | 30.5 | 43.9 | 50.1 | |
| C | ADAM3 | 241 | 275 | 386 | 19,203 | 96.7 | 26.7 | 46.7 | 61.6 |
| ADAM2 | 160 | 253 | 434 | 19,258 | 96.6 | 18.9 | 38.7 | 73.1 | |
| D | ADAM3 | 293 | 356 | 472 | 16,425 | 95.3 | 26.1 | 45.1 | 61.7 |
| ADAM2 | 369 | 197 | 882 | 16,098 | 93.9 | 25.5 | 65.2 | 70.5 | |
| Total | ADAM3 | 1415 | 1504 | 1501 | 53,939 | 94.9 | 32.0 | 48.5 | 51.5 |
| ADAM2 | 1014 | 1151 | 1782 | 54,012 | 94.3 | 23.3 | 39.5 | 63.7 |
Table 4.
Accuracy measures of ADAM3 simulations from January to June of 2017 at all MEP sites except Northwestern China with Gobi, sand, loess, and mixed surface soil types, compared with those of ADAM2 simulations in Hong et al. [21]. A total number of forecasts n is 58,359.
Table 4.
Accuracy measures of ADAM3 simulations from January to June of 2017 at all MEP sites except Northwestern China with Gobi, sand, loess, and mixed surface soil types, compared with those of ADAM2 simulations in Hong et al. [21]. A total number of forecasts n is 58,359.
| Soil Type | Model | H | M | FA | CR | HR (%) | TS (%) | POD (%) | FAR (%) |
|---|---|---|---|---|---|---|---|---|---|
| Gobi | ADAM3 | 119 | 89 | 110 | 1304 | 87.7 | 37.4 | 57.2 | 48.0 |
| ADAM2 | 71 | 120 | 54 | 1377 | 89.3 | 29.0 | 37.2 | 43.2 | |
| Sand | ADAM3 | 107 | 50 | 62 | 1571 | 93.7 | 48.9 | 68.2 | 36.7 |
| ADAM2 | 74 | 72 | 43 | 1601 | 93.6 | 39.2 | 50.7 | 36.8 | |
| Loess | ADAM3 | 435 | 398 | 722 | 26,428 | 96.0 | 28.0 | 52.2 | 62.4 |
| ADAM2 | 398 | 314 | 1018 | 26,253 | 95.2 | 23.0 | 55.9 | 71.9 | |
| Mixed | ADAM3 | 545 | 568 | 528 | 20,862 | 95.1 | 33.2 | 49.0 | 49.2 |
| ADAM2 | 441 | 526 | 655 | 20,881 | 94.8 | 27.2 | 45.6 | 59.8 | |
| Total | ADAM3 | 1206 | 1105 | 1422 | 50,165 | 95.3 | 32.3 | 52.2 | 54.1 |
| ADAM2 | 984 | 1032 | 1770 | 50,112 | 94.8 | 26.0 | 48.8 | 64.3 |
© 2020 by the authors. Licensee MDPI, Basel, Switzerland. This article is an open access article distributed under the terms and conditions of the Creative Commons Attribution (CC BY) license (http://creativecommons.org/licenses/by/4.0/).
Share and Cite
MDPI and ACS Style
Ryoo, S.-B.; Kim, J.; Cho, J.H. Performance of KMA-ADAM3 in Identifying Asian Dust Days over Northern China. Atmosphere 2020, 11, 593. https://doi.org/10.3390/atmos11060593
AMA Style
Ryoo S-B, Kim J, Cho JH. Performance of KMA-ADAM3 in Identifying Asian Dust Days over Northern China. Atmosphere. 2020; 11(6):593. https://doi.org/10.3390/atmos11060593
Chicago/Turabian StyleRyoo, Sang-Boom, Jinwon Kim, and Jeong Hoon Cho. 2020. "Performance of KMA-ADAM3 in Identifying Asian Dust Days over Northern China" Atmosphere 11, no. 6: 593. https://doi.org/10.3390/atmos11060593
Note that from the first issue of 2016, this journal uses article numbers instead of page numbers. See further details here.