Network Structural Transformation-Based Community Detection with Autoencoder


1
School of Computer Science and Communication Engineering, Jiangsu University, Jiangsu 212013, China
2
School of Electrical and Information Engineering, Jiangsu University, Jiangsu 212013, China
*
Author to whom correspondence should be addressed.
Symmetry 2020, 12(6), 944; https://doi.org/10.3390/sym12060944
Submission received: 16 March 2020
/
Revised: 21 May 2020
/
Accepted: 1 June 2020
/
Published: 3 June 2020
Abstract
:In this paper, we proposed a novel community detection method based on the network structure transformation, that utilized deep learning. The probability transfer matrix of the network adjacency matrix was calculated, and the probability transfer matrix was used as the input of the deep learning network. We use a denoising autoencoder to nonlinearly map the probability transfer matrix into a new sub space. The community detection was calculated with the deep learning nonlinear transform of the network structure. The network nodes were clustered in the new space with the K-means clustering algorithm. The division of the community structure was obtained. We conducted extensive experimental tests on the benchmark networks and the standard networks (known as the initial division of communities). We tested the clustering results of the different types, and compared with the three base algorithms. The results showed that the proposed community detection model was effective. We compared the results with other traditional community detection methods. The empirical results on datasets of varying sizes demonstrated that our proposed method outperformed the other community detection methods for this task.
1. Introduction
The real-life connections of many systems are represented in the form of graphs. These system connections could be represented by networks [1]. These network connections ignore the diversity of the system. The connection relationship could be analyzed by examining the network structure. These networks exhibit complex network characteristics. There have been some network analysis methods widely used in complex networks, such as in the small world [2] and scale-free network [3].
The community detection method is a graph partitioning technique that is commonly used in network structure analysis [4]. Some networks have important nodes that show the clustering characteristics of networks. The graph partitioning method could be used in these networks to divide the entire network into sub networks, also known as community detection. The community partition method has significance in solving the network structures for many real-world networks, such as infectious diseases in a crowd or the analysis of neuronal clustering structures in the brain’s cognitive function [5,6].
The deep learning neural network has been used to study various types of network structures, in order to achieve a variety of tasks. Our approach is inspired by recent successes of deep learning. We considered the original network’s structure’s use of deep neural networks for nonlinear transformation. We then clustered the network nodes into different classes in the new vector representation of the network structure. We proposed a community detection method based on the autoencoder structural transformation of the network connection matrix. The key contributions of this paper are summarized as follows:
- (1).
- We propose a nonlinear network structure transformation method based on the probability transfer matrix. The probability transfer matrix is an explicit representation matrix of the graph.
- (2).
- We propose a community detection method based on the autoencoder structural transformation. The autoencoder structural transformation is an effective method of feature representation, as it could map a high-dimensional data space to a nonlinear, low-dimensional space.
2. Related Work
With the increasing need to analyze social networks, many different community structure detection approaches have been proposed. Girvan and Newman first proposed a community detection method as based on the calculation of edge betweenness [4].
The community detection method originates from the graph partition analysis method. There have been many community detection methods proposed to perform community partitioning in real social networks [7,8]. These community detection methods are divided into two categories: the method of community detection based on modularity Q optimization, and the community detection method without modularity Q optimization. Modularity Q was initially proposed by Newman et al. [7]. The traditional modularity Q is considered to be used to measure the network partitioning performance.
Many community detection methods have been proposed based on modularity optimization. Li proposed that the partition method could be used to maximize modularity via the spectral relaxation method [9]. Zhang et al. proposed a Qcut community partitioning method [10]. The modularity function has a resolution limit problem, where it cannot identify the small community network for communities that are smaller than a certain scale [11]. The community division of modularity optimization is primarily used for the community division of some unknown network structures. For the networks that have provided the ground-truth of network structures, the partition results based on the modularity Q are not in accordance with standard network community structures. The community detection method, based on modularity Q, is not appropriate for the division of such networks [12]. The community detection and performance evaluation of these networks are done with community partition methods without modularity Q optimization.
Other community detection methods have also been proposed. The non-negative matrix factorization partitioning method, which uses the adjacency matrix decomposition of the network, shows good performance for community detection [13]. A method based on the stochastic block model is proposed to partition networks (SBM), which is similar to a Bayes network [14]. Langone et al. proposed a method for the community division based on kernel spectral partitioning [15]. The performance of the community detection algorithms should be appropriately evaluated, to address the issues surrounding the network community partition with known initial community structures.
The deep learning neural network has been used to study various types of network structures in order to achieve a variety of tasks. These include classification and feature representation [16]. The deep autoencoder is considered to be an effective method of feature representation, as it could map a high-dimensional data space to a nonlinear, low-dimensional space [17]. Its performance is better than that of linear feature transform processing technology, such as Principal components analysis (PCA). Cao [18] proposed a novel model to learn graph representations, which generates a low-dimensional vector representation for each vertex. The clustering and visualization tasks achieved a superior performance.
Autoencoder is a symmetric, unsupervised learning neural network, which employs self-supervision to train so that it can non-linearly reduce dimensionality, with the ability to reconstruct data features. The autoencoder neural network has symmetry.
In this paper, we propose a new community detection method, which combines the random walk model and deep autoencoder to realize the community partitioning.
In accordance with the adjacency matrix of a given network A, the probability transfer matrix of P was calculated by random walk distance. The k step transfer matrix of Pk was calculated. We postulated that the transfer matrix Pk was an explicit representation matrix of the graph. It is not appropriate for direct applications of community division. We took the Pk as the input of the deep neural network, and used the denoising autoencoder to transfer the matrix of Pk into another feature space, X. The X vector was used as the characteristics of the initial network node representation. We calculated the transformation of the probabilistic matrix with the autoencoder. The effectiveness of the proposed transformation was confirmed by using the K-means algorithm to cluster the new node feature space T into some classes. The original network structure was divided into k community structures. A method of community detection based on the deep denoising autoencoder feature learning was implemented.
3. The Proposed Method
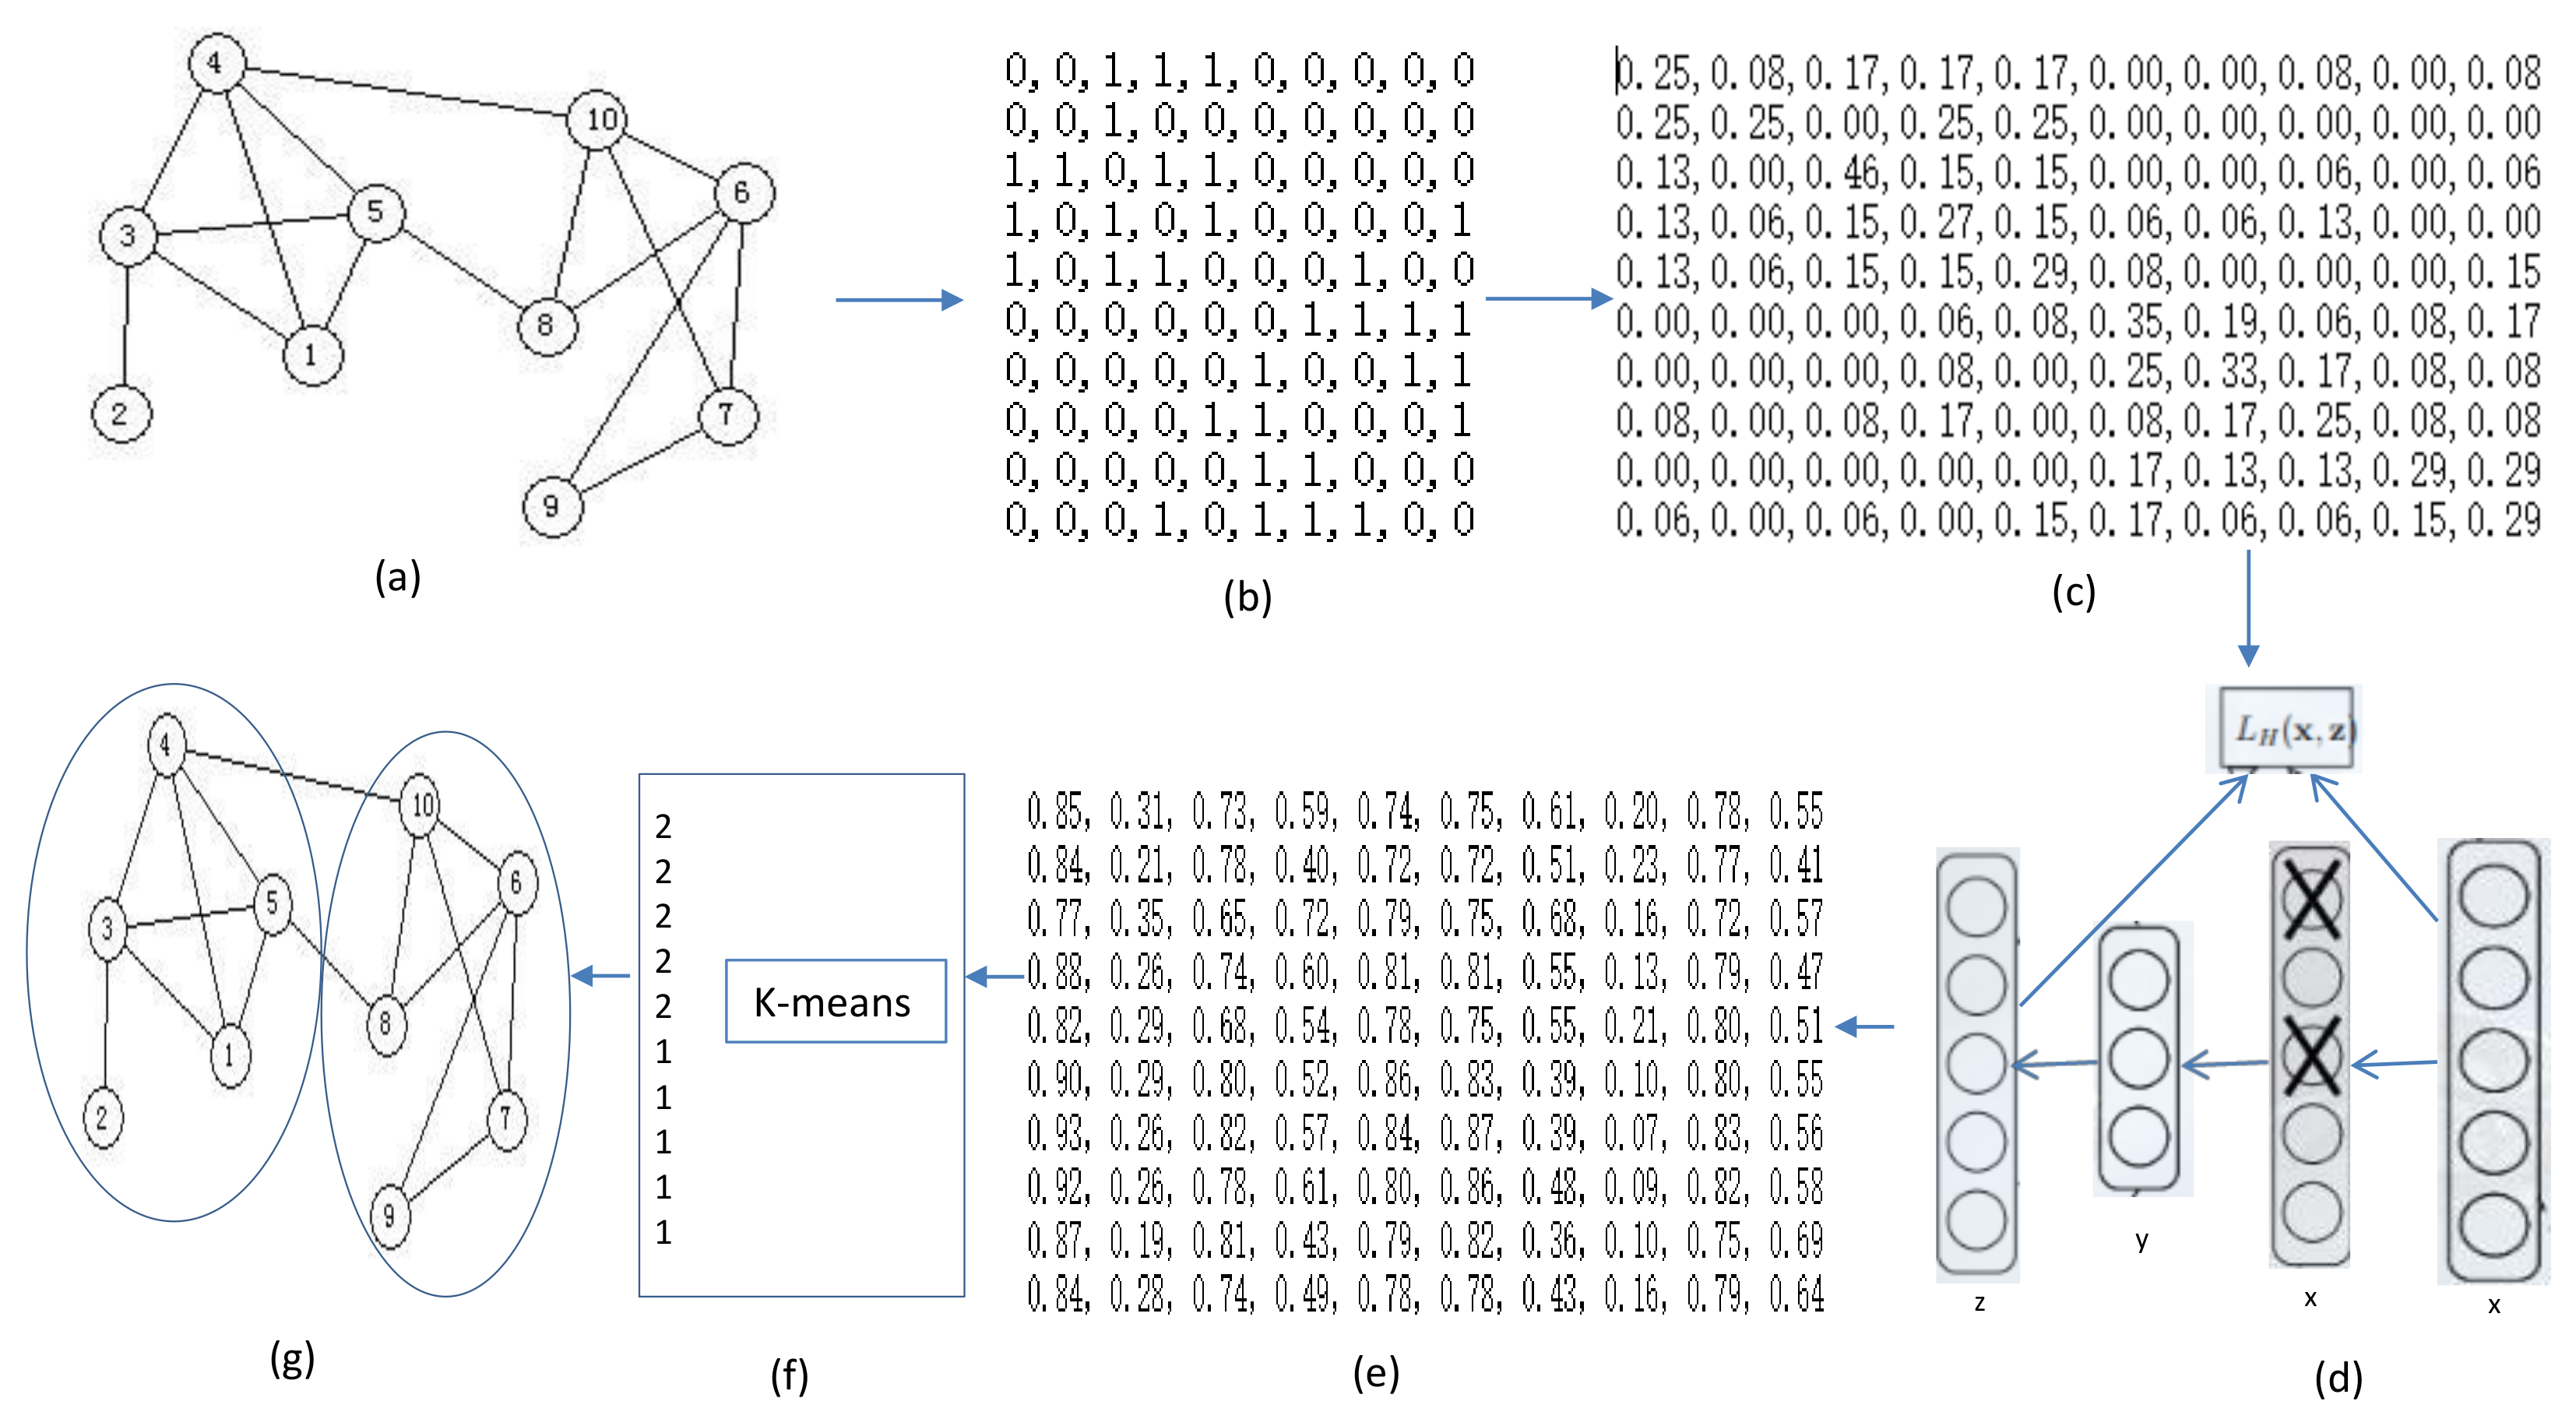
We now detail our proposed method. The framework of the proposed method is shown in Figure 1. The framework consists of three major steps. First, given a primitive network, we introduce random walk model (Section 3.1) to capture network structural information and generate a probability transfer matrix. Next, we introduce the stacked denoising autoencoder to learn low-dimensional feature representations and obtain the new representation matrix (Section 3.2). After that, we use a Euclidean space clustering algorithm to directly cluster the nodes of the new representation matrix, such as the K-means clustering algorithm.
3.1. Probability Transfer Matrix
The K-means algorithm was applied to divide the network into communities in a Euclidean space. To obtain the new Euclidean space, the map of the adjacency matrix of the graph G needed to be transformed into a new nonlinear space. A network can be represented in the form of a graph G = (V, E), where V is a collection of nodes, E was a collection of edges that connect nodes, and N = was the number of nodes. was the adjacency matrix of graph G, which was a symmetric matrix. For a node i belonging to V, D(i) was the degree for node i, D was a N * N diagonal matrix, , namely D was the degree matrix of G. The transition probability of the i node to the j node was defined as
The definition of the probability transfer matrix of random walk could also be expressed as
If the P2 was the two-step probability transfer matrix for graph G, P2 was defined as P2 = P * P. For a given value k, the k step length random walk probability transfer matrix was Pk. The probability transition matrix was different when the number of steps was different.
The adjacency matrix of the network graph G was used to obtain the k step probability transition matrix Pk of the graph G. In previous research, the spectral decomposition method could be used to calculate spectral clustering. The principal component analysis (PCA) could be used, with the Pk matrix being used as a row vector, where it is projected into a new vector space by linear transformation. Then, the new vector space was used for further clustering analysis. We studied the effectiveness of the nonlinear transformations of the deep learning autoencoder. The Pk matrix was considered to be the input data for the nonlinear transformation, and was mapped to a different space vector X. The original matrix Pk showed a high-dimensional transformation or a low-dimensional transformation for the new space X. The new matrix X, as well as the clustering that occasionally occurred, was used to calculate the network community division.
3.2. Deep Nonlinear Matrix Reconstruction
We proposed a nonlinear matrix transformation method of the probability transfer matrix by utilizing the deep neural networks. This was used for community detection. The deep neural networks could be used for feature learning. Many deep neural network models, such as the autoencoder [19] and the convolution network [20] models, have been proposed.
An autoencoder is a neural network that could reproduce the input signal indefinitely. For the replication to take place, the autoencoder must capture the most important factor for representing the input data. The autoencoder requires the input a data to encode. This was the point at which the network probability transfer matrix was used in the inputs for automatic encoding, x = P. The ith line of the matrix represented the input information of node i for a hidden y, through the deterministic mapping, e.g.,
where S was a non-linearity such as the sigmoid.
y = S(wx + b),
The latent representation y, or code, was then mapped back (with a decoder) into a reconstruction z of the same shape as x. The mapping occurred through a similar transformation, e.g.,
z could be viewed as a prediction of the x under a given coding y. The purpose of an autoencoder was to minimize the reconstruction error function by selecting the proper w, b.
Following the decoding of the autoencoder, we obtained the new representation matrix X(i) of the original probability transition matrix P, for each level of the deep neural network.
To determine if the new matrix X was favorable for community detection, we used a Euclidean space clustering algorithm to directly cluster the nodes, such as the K-means clustering algorithm.
The K-means algorithm finds optimal solutions with a number of K prototypes {Ci}i=1,2,..,K. In K-means clustering, objective function is defined as the sum of the squared Euclidean distance between each data point xi and the cluster center uj, to which xi belongs. The K-means Algorithm 1 has been widely used for data clustering
| Algorithm 1 Description: |
| Input: network adjacency matrix A, and parameter k. |
|
| Output: the division of network societies Vk. |
4. Results and Discussions
4.1. Network Dataset
In order to evaluate the effectiveness of the proposed model, we performed the test with the benchmark and real networks. We used the testing networks with the ground-truth. That is, the number of clusters in the K-means algorithm was equal to the number of communities. The two benchmark networks and the five real networks were adopted. The networks are shown in Table 1.
With the networks known, the number of communities was tested, in order to compare the performance of the community detection methods. The two benchmark networks used were widely used in community detection. The first one was the Girvan–Newman (GN) benchmark. The GN benchmark network had 128 nodes that were divided into four groups. Each group had 32 nodes [4]. The other was the Lancichinetti-Fortunato-Radicchi (LFR) benchmark network. The LFR had 1000 nodes [21]. The number of communities was 28, which made it difficult to identify the structure of the communities.
We selected five real networks with various sizes that were commonly used in the community detection algorithm performance evaluation. These networks are available from the website (Http://www-personal.umich.edu/~mejn/netdata/).
4.2. Baseline Comparisons
We compared the results with the three different types of baseline algorithms to demonstrate the performance of the proposed method.
To demonstrate the effectiveness of the nonlinear transformation of the denoising autoencoder, we used two additional types of matrix transform methods to compare the results. These included the spectral clustering matrix decomposition method (SC), the K-means clustering method after the principal component analysis (PCA+kmeans), and the K-means clustering algorithm directly in the probability transfer matrix P (P+kmeans).
We compared the results from the various parameters. We used two parameters in our proposed method. The number of steps k of the transition probability matrix, and the number of structure layers D of the deep neural network, were used to evaluate the partitioning performance under the various parameter conditions.
The proposed method was shown to be effective for the community detection, by comparing the results with several existing community partitioning algorithms. We used the existing two types of partition methods; the partitioning algorithm based on modularity optimization, and the partitioning algorithms without modularity optimization.
The performance results were evaluated by calculating the standard mutual information values between the discovered community structure and the ground-truth community structure.
4.3. Normalized Mutual Information
Mutual information is a commonly used method. If the community structure and the number of clusters of a network have been given in advance, the Normalized Mutual Information (NMI) can be applied to measure the similarity of the detected community structure and the original community structure. Mutual information as an evaluation function has been widely used in community structures. If A and B represent the original partition and the detected partition, respectively, C is the confusion matrix, where Cij is the number of nodes in the ith group of the partition A, that are also in the jth group of the partition B. The calculation method of NMI is as follows:
where CA and CB are the number of groups in the partitions A and B. Ci is the sum of the elements of C in row i, and Cj is the sum of the elements of C in column j. N is the number of nodes. The value of NMI is between 0 and 1. The larger value represents the detected community structures that are more consistent with the original partition, which means good results. Mutual information is an external performance measurement method. Because our testing networks have ground-truth, we can use mutual information value to evaluate the performance of the different methods.
4.4. Network Structures of Autoencoder
The number of neurons in the various layers was not the same when applied to a different number of nodes in the network. In order to compare the influence of the various layers on the clustering results, we divided the deep neural network into four layers. The first layer was the input layer. The number of neurons for each layer is shown in Table 2. The neurons were activated by the sigmoid function.
4.5. Baseline Results
In the first experiment, we set the parameter k of the probability transfer matrix to 2. The first layer was the input layer. We took the first output layer, or the second layer of the deep neural network, as the feature mapping of the original adjacency network. We used the K-means to cluster the nodes into K clusters within this space. The results of the clustering were compared with the other three cases. The results are shown in Table 3.
As can be seen from Table 3, the performance of the proposed community detection method was generally better than the other three processing methods after the feature transformation of the denoising autoencoder. In Table 3, Table 4, Table 5 and Table 6, the bold numbers represent the best results in each method.
We can see from Table 3 that the proposed community structure method obtained the best results in six networks. For example, our proposed algorithm obtained the biggest value of NMI in the LFR Network, wherein NMI is 0.9157.
The results from the probability transfer matrix were different when the parameter k of the probability transfer matrix was different. The number of steps was set to 2, 3 and 4. We obtained the different probability transfer matrix and performed the K-means algorithm to obtain the clustering results. The clustering results are shown in Table 4.
Table 4 illustrates that, when the probability transfer matrices were different, the results obtained by the community detection were not the same. The best results for all data sets from a fixed matrix could not be obtained.
We used the different output layers of the autoencoder as the output feature mapping matrix. The results of each layer were different, depending on the different numbers of neurons used to encode and decode. We took every output layer of the autoencoder of each network as the input data. The K-means clustering algorithm for clustering was applied. The community partitioning results are shown in Table 5.
As can be seen from Table 5, we obtained the best community division when we took the output of the second layer of the autoencoder and applied it as the input of the K-means algorithm. We concluded that exploring the underlying structure of networks via deep learning could improve the performance of community detection.
4.6. Comparison with Other Community Detection Methods
There are many community partitioning algorithms that have been proposed. We used these real networks, which are widely used to evaluate the performance of community partitioning. We compared them with other community partitioning methods. The networks we chose had a known number of communities, so the community detection methods of modularity maximization were not suitable for comparison. We chose a fast community detection method based on modularity optimization (fastmo) [22]. We selected several commonly used community detection methods that specified the number of communities before partitioning. These included the community detection with non-negative matrix factorization method (NMF) [13], the kernel spectral community partition method (SKSC) [14], and the stochastic block model-based community detection method (WSBM) [15]. The experimental results are shown in Table 6.
As can be seen from Table 6, the proposed algorithm achieves the best results in four networks. While it does not obtain the best experimental results in all networks, it was typically superior to the other four detection methods.
5. Conclusions
We proposed a deep learning community detection method based on the network structure transformation. This was chosen to avoid the deficiencies of traditional linear transformations of PCA, or the problems of the community partitioning method based on modularity optimization. This was done through the autoencoder to nonlinearly transform the network probability matrix into the different layers of the deep neural network. K-means clustering was used in a low-dimensional vector representation. We performed different experiments and compared the results with other methods. The results showed that the proposed method was superior to the other partition methods, for both the benchmark and the real networks. Our model showed that the autoencoder could extract meaningful information from the network graph structure, and perform a nonlinear transformation to generate novel feature representations. After the conversion of the autoencoder, the novel representation was more conducive to the identification of the network community structure. Here, we used the simplest K-means clustering algorithm to obtain superior partitioning results over the other community detection methods. There has been some research that uses automatic graph subspace learning recognition with an autoencoder [23,24]. Our work also added the network graph feature transform learning clustering algorithm, and complex network community partitioning recognition. Our future research will utilize more complex clustering algorithms to classify the output layer features of deep learning [25,26].
Our proposed method is a two-stage work, that applies clustering after having learned a representation. Our future research will utilize more complex deep clustering algorithms, that jointly optimize feature learning and clustering.
Author Contributions
Conceptualization, X.G.; methodology, H.L. and J.S.; supervision. All authors have read and agreed to the published version of the manuscript.
Funding
This study was supported by the Scientific Research Foundation for Advanced Talents of Jiangsu University (Project No. 14JDG040).
Conflicts of Interest
The authors declare no conflict of interest.
References
- Newman, M.E.J.; Barabasi, A.-L.; Watts, D.J. The Structure and Dynamics of Networks; Princeton University Press: Princeton, NJ, USA, 2006. [Google Scholar]
- Watts, D.J.; Strogatz, S.H. Collective dynamics of “small-world” networks. Nature 1998, 393, 440–442. [Google Scholar] [CrossRef] [PubMed]
- Barabási, A.-L.; Albert, R. Emergence of scaling in random networks. Science 1999, 286, 509–512. [Google Scholar] [CrossRef] [PubMed] [Green Version]
- Girvan, M.; Newman, M.E.J. Community structure in social and biological networks. Proc. Natl. Acad. Sci. USA 2002, 99, 7821–7826. [Google Scholar] [CrossRef] [PubMed] [Green Version]
- Hu, L.; Xinghao, H.; Yuqing, S. Partitioning the Firing Patterns of Spike Trains by Community Modularity. In Proceedings of the 37th Cognitive Science Society Annual Conference, Pasadena, CA, USA, 22–25 July 2015; pp. 23–25. [Google Scholar]
- Hu, L.; Zhe, L.; Yuqing, S.; Hui, W. Hierarchical organization in neuronal functional networks during working memory tasks. In Proceedings of the 2014 International Joint Conference on Neural Networks (IJCNN), Beijing, China, 6–11 July 2014; pp. 6–11. [Google Scholar]
- Newman, M.E.J.; Girvan, M. Finding and evaluating community structure in networks. Phys. Rev. E 2004, 69, 026113. [Google Scholar] [CrossRef] [PubMed] [Green Version]
- Mahmood, A.; Small, M. Subspace based network community detection using sparse linear coding. IEEE Trans. Knowl. Data Eng. 2016, 28, 801–812. [Google Scholar] [CrossRef] [Green Version]
- Li, W.; Schuurmans, D. Modular community detection in networks. In Proceedings of the IJCAI Proceedings-International Joint Conference on Artificial Intelligence, Barcelona, Catalonia, Spain, 16–22 July 2011; Volume 22, p. 1366. [Google Scholar]
- Ruan, J.; Zhang, W. Identifying network communities with a high resolution. Phys. Rev. E 2008, 77, 016104. [Google Scholar] [CrossRef] [PubMed] [Green Version]
- Fortunato, S.; Barthélemy, M. Resolution limit in community detection. Proc. Natl. Acad. Sci. USA 2007, 104, 36–41. [Google Scholar] [CrossRef] [PubMed] [Green Version]
- Hu, L.; Hui, W. Detection of community structure in networks based on community coefficients. Phys. A Stat. Mech. Appl. 2012, 391, 6156–6164. [Google Scholar]
- Psorakis, I.; Roberts, S.; Ebden, M.; Sheldon, B. Overlapping community detection using bayesian non-negative matrix factorization. Phys. Rev. E 2011, 83, 066114. [Google Scholar] [CrossRef] [PubMed] [Green Version]
- Aicher, C.; Jacobs, A.Z.; Clauset, A. Adapting the stochastic block model to edge-weighted networks. arXiv 2013, arXiv:1305.5782. [Google Scholar]
- Langone, R.; Mall, R.; Vandewalle, J.; Suykens, J.A.K. Discovering Cluster Dynamics Using Kernel Spectral Methods//Complex Systems and Networks; Springer: Berlin/Heidelberg, Germany, 2016; pp. 1–24. [Google Scholar]
- Tian, F.; Gao, B.; Cui, Q.; Chen, E.; Liu, T.-Y. Learning Deep Representations for Graph Clustering. In Proceedings of the AAAI, Québec City, QC, Canada, 27–31 July 2014; pp. 1293–1299. [Google Scholar]
- Yang, L.; Cao, X.; He, D.; Wang, C.; Wang, X.; Zhang, W. Modularity Based Community Detection with Deep Learning. In Proceedings of the IJCAI, New York, NY, USA, 9–15 July 2016; pp. 2252–2258. [Google Scholar]
- Cao, S.; Lu, W.; Xu, Q. Deep Neural Networks for Learning Graph Representations. In Proceedings of the AAAI, Phoenix, AZ, USA, 12–17 February 2016; pp. 1145–1152. [Google Scholar]
- Bengio, Y. Learning deep architectures for AI. Found. Trends Mach. Learn. 2009, 2, 1–127. [Google Scholar] [CrossRef]
- LeCun, Y.; Bottou, L.; Bengio, Y.; Haffner, P. Gradient-based learning applied to document recognition. Proc. IEEE 1998, 86, 2278–2324. [Google Scholar] [CrossRef] [Green Version]
- Andrea, L.; Santo, F.; Filippo, R. Benchmark graphs for testing community detection algorithms. Phys. Rev. E 2008, 78, 046110. [Google Scholar]
- Le Martelot, E.; Hankin, C. Multi-scale Community Detection using Stability as Optimisation Criterion in a Greedy Algorithm. In Proceedings of the KDIR, Paris, France, 26–29 October 2011; pp. 216–225. [Google Scholar]
- Peng, X.; Feng, J.; Lu, J.; Yau, W.Y.; Yi, Z. Cascade Subspace Clustering. In Proceedings of the AAAI, San Francisco, CA, USA, 4–9 February 2017; pp. 2478–2484. [Google Scholar]
- Hu, L.; YuQing, S.; Hui, W. Multiple-Kernel Combination Fuzzy Clustering for Community Detection. Soft Comput. 2020. [Google Scholar] [CrossRef]
- Hu, L.; Saixiong, L.; Hui, W.; Juanjuan, T. Multi-kernel fuzzy clustering based on auto-encoder for fMRI functional network. Expert Syst. Appl. 2020. [Google Scholar] [CrossRef]
- Jianping, G.; Yuanyuan, Y.; Yi, Z.; Jiancheng, L.; Qirong, M.; Yongzhao, Z. Discriminative globality and locality preserving graph embedding for dimensionality reduction. Expert Syst. Appl. 2020, 144, 113079. [Google Scholar]
Figure 1.
The framework of the proposed algorithm. (a) Given a primitive network. (b) Adjacency matrix. (c) Transfer probability matrix. (d) The deep autoencoder network. (e) The new vector space. (f) K-means clustering and result. (g) The community partitioning result.
Figure 1.
The framework of the proposed algorithm. (a) Given a primitive network. (b) Adjacency matrix. (c) Transfer probability matrix. (d) The deep autoencoder network. (e) The new vector space. (f) K-means clustering and result. (g) The community partitioning result.


Table 1.
Network description used in the testing.
| Network | Node | Edge | K |
|---|---|---|---|
| GN Network | 128 | 1024 | 4 |
| LFR Network | 1000 | 7692 | 28 |
| karate | 34 | 78 | 2 |
| Dolphins | 62 | 159 | 2 |
| football | 115 | 613 | 12 |
| Polbooks | 105 | 441 | 3 |
| Polblogs | 1224 | 16752 | 2 |
Table 2.
Deep Nonlinear Reconstruction Network Structures.
| Network | Layers Configuration |
|---|---|
| GN Network | 128-64-32 |
| LFR Network | 1000-500-250 |
| karate | 34-17-8 |
| Dolphins | 62-32-16 |
| football | 115-58-30 |
| Polbooks | 105-52-16 |
| Polblogs | 1224-612-256 |
Table 3.
Normalized Mutual Information (NMI) results of different structure transformations.
| Network | This Paper | P + Kmeans | SC | PCA + Kmeans |
|---|---|---|---|---|
| GN Network | 1 | 1 | 1 | 0.8019 |
| LFR Network | 0.9157 | 0.8949 | 0.9103 | 0.8439 |
| karate | 1 | 0.8365 | 1 | 0.8365 |
| Dolphins | 1 | 1 | 0.8166 | 1 |
| football | 0.8935 | 0.8633 | 0.8887 | 0.8623 |
| Polbooks | 0.5566 | 0.5551 | 0.4366 | 0.5318 |
| Polblogs | 0.6675 | 0.6702 | 0.2402 | 0.6702 |
Table 4.
NMI results with different probability transfer matrices.
| Network | k = 2 | k = 3 | k = 4 |
|---|---|---|---|
| GN Network | 1 | 1 | 0.8293 |
| LFR Network | 0.9157 | 0.9218 | 0.9558 |
| karate | 1 | 1 | 1 |
| Dolphins | 1 | 1 | 1 |
| football | 0.8935 | 0.8666 | 0.8643 |
| Polbooks | 0.5566 | 0.5566 | 0.5629 |
| Polblogs | 0.6675 | 0.6933 | 0.6845 |
Table 5.
NMI results of different deep layers.
| Network | Layer2 | Layer3 | Layer4 |
|---|---|---|---|
| GN Network | 1 | 0.8024 | 1 |
| LFR Network | 0.9157 | 0.8957 | 0.9265 |
| karate | 1 | 0.199 | 0.08 |
| Dolphins | 1 | 0.5311 | 0.2533 |
| football | 0.8935 | 0.8781 | 0.8356 |
| Polbooks | 0.5566 | 0.3767 | 0.3852 |
| Polblogs | 0.6675 | 0.0333 | 0.5843 |
Table 6.
NMI results of different community detection methods.
| Network | THIS PAPER | NMF | SKSC | WSBM | Fastmo |
|---|---|---|---|---|---|
| GN Network | 1 | 1 | 0 | 0.0333 | 1 |
| LFR Network | 0.9157 | 0.9002 | 0.6846 | - | 1 |
| karate | 1 | 1 | 1 | 0.09 | 0.7236 |
| Dolphins | 1 | 0.8904 | 1 | 1 | 0.5029 |
| football | 0.8935 | 0.8282 | 0.8131 | 0.4811 | 0.8929 |
| Polbooks | 0.5566 | 0.5693 | 0.5566 | 0.0390 | 0.5111 |
| Polblogs | 0.6675 | 0.6924 | 0.3989 | - | 0.6416 |
© 2020 by the authors. Licensee MDPI, Basel, Switzerland. This article is an open access article distributed under the terms and conditions of the Creative Commons Attribution (CC BY) license (http://creativecommons.org/licenses/by/4.0/).
Share and Cite
MDPI and ACS Style
Geng, X.; Lu, H.; Sun, J. Network Structural Transformation-Based Community Detection with Autoencoder. Symmetry 2020, 12, 944. https://doi.org/10.3390/sym12060944
AMA Style
Geng X, Lu H, Sun J. Network Structural Transformation-Based Community Detection with Autoencoder. Symmetry. 2020; 12(6):944. https://doi.org/10.3390/sym12060944
Chicago/Turabian StyleGeng, Xia, Hu Lu, and Jun Sun. 2020. "Network Structural Transformation-Based Community Detection with Autoencoder" Symmetry 12, no. 6: 944. https://doi.org/10.3390/sym12060944
Note that from the first issue of 2016, this journal uses article numbers instead of page numbers. See further details here.