Article

Trophic Magnification of Legacy (PCB, DDT and Hg) and Emerging Pollutants (PFAS) in the Fish Community of a Small Protected Southern Alpine Lake (Lake Mergozzo, Northern Italy)

1
Department of Human Sciences and Innovation for the Territory (DISUIT), University of Insubria, Via S. Abbondio 12, 22100 Como (CO), Italy
2
Water Research Institute (IRSA)—CNR, Via del Mulino 19, 20861, Brugherio (MB), Italy
3
Water Research Institute (IRSA)—CNR, Largo Tonolli 50, 28922, Verbania Pallanza (VB), Italy
4
Department of Biosciences, University of Oslo, PO Box 1066, 0316 Oslo, Norway
*
Authors to whom correspondence should be addressed.
Water 2020, 12(6), 1591; https://doi.org/10.3390/w12061591
Submission received: 22 April 2020 / Revised: 17 May 2020 / Accepted: 2 June 2020 / Published: 3 June 2020
(This article belongs to the Special Issue Environmental Fate of Contaminants in the Aquatic Environment)

Abstract

:
The biomagnification of mercury, polychlorobiphenyls (PCBs), dichlorodiphenyltrichloroethane and its metabolites (DDTs) and perfluoroalkyl acids substances (PFASs) was evaluated in the trophic web of Lake Mergozzo, a small and deep Italian subalpine lake, which has been chosen because it is a protected environment, and discharges into the lake are mostly avoided. Carbon source and relative trophic levels were calculated by using 13C and 15N stable isotopes, respectively, and trophic magnification factors (TMFs) were derived. Zooplankton and thirteen species of fish were collected and analyzed, and the results showed the elevated level of biota contamination from both legacy and emerging pollutants, even if direct discharges were avoided. Concentrations in biota, expressed as sums of compounds, ranged from 0.4 to 60 µg kg−1 wet weight (ww) for PFASs, from 16 to 1.3 104 µg kg−1 lipid content (lw) for DDTs, from 17 to 1.5 104 µg kg−1 lw for PCBs and from 20.0 to 501 µg kg−1 ww for mercury (Hg). TMFs of this deep, cold lake, with a prevalent pelagic trophic chain, were high and clearly indicated fish biomagnification, except for PFAS. The biomagnification capability of PFAS in a fish-only food web was discussed by using the biomagnification of Hg as a benchmark for assessing their bioaccumulation potential.

Graphical Abstract

1. Introduction

Bioaccumulation is the process that leads to a higher chemical concentration in an organism due to the uptake by all exposure routes, including dietary and dermal absorption and transport across respiratory surfaces [1]. Among the different metrics to evaluate bioaccumulation, the trophic magnification factor (TMF) can be useful when diet is the major route of exposure [2,3]. TMF is the slope of the linear regression between logarithmic concentrations of a given chemical in the biota and the trophic positions: when TMF is >1, bioaccumulation exists; if not, dilution occurs [4]. However, the biomagnification and subsequent evaluation of TMFs can be affected by many factors, including chemical properties of contaminants, biological aspects of biota, spatial and geographical food web characterizations and the determination of the trophic levels [3,5,6]. Stable nitrogen and carbon isotope values provide reliable calculations of organism trophic levels. The change in δ15N or δ 13C values from prey to predator, also called trophic fractionation, provide useful information: nitrogen is more enriched in consumers’ tissues than in prey and is used to calculate the trophic positions, whereas carbon has very small variations in the same trophic web and is typically used to discriminate among the sources of dietary carbon [7,8].
Polychlorinated biphenyls (PCBs) and dichlorodiphenyltrichloroethane and metabolites (DDTs) are persistent organic pollutants (POP) extensively used in the last century for many purposes. DDTs were utilized in sanitary and agricultural fields for their insecticidal properties since the mid-1940s. PCBs had a broad range of applications because of their chemical properties—for example, as coolants in transformers, generators and capacitors, as well as hydraulic and heat exchange fluids [9]. They are persistent, bioaccumulative, subjected to long-range transport and toxic both on wildlife and humans [10,11,12,13]. They are still present in the environment in various matrices [14,15,16], especially biota, for their high affinity to adipose tissue [17,18,19]. Many studies evidenced their biomagnification in the wildlife [20,21]. The main exposure routes for humans are food and water [22]. Since 2001, they are enlisted in the Stockholm Convention and, so, banned/restricted in many countries [23].
Mercury (Hg) is a toxic trace element widely distributed in the environment and naturally present on Earth in low concentrations [24] that is released by the weathering of rocks, geothermal activity and vulcanism [25]. Extensive anthropogenic uses increased the release of mercury into the environment and resulted in the serious contamination of water, sediments and biota [24,26,27,28,29,30,31]. Mercury can also biomagnify in trophic webs [32]. Humans are exposed to Hg mainly from the ingestion of contaminated fish and seafood [33]. The outbreak of Minamata disease in Japan has shown its associated risks to the health of humans and ecosystems [24,32]. Mercury has adverse effects on the nervous system in adults and children and on respiratory, renal, immunological, endocrine and reproductive systems [33].
TMFs of organo-halogen compounds and mercury have been determined in different freshwater environments [34,35,36]. Since their TMFs are generally >1, the bioaccumulative substances can serve as benchmarks for assessing the bioaccumulation potential of other contaminants of concern that showed unclear patterns, such as perfluoroalkyl substances (PFAS) [5,37]. PFASs are chemical compounds ubiquitous in everyday products and industrial formulations and are released via point and nonpoint sources into the aquatic environment [38]. Their physicochemical properties give them persistence, capability for long-range transport and possible adverse effects on living organisms [38,39]. PFASs include thousands of chemicals; the most prominent are perfluorooctanesulfonic acid (PFOS) and perfluoroalkyl carboxylic acids (PFCA) that have been demonstrated to be bioaccumulative [40]. The biota magnification factors and TMFs have been reviewed in the scientific literature [5] demonstrating their accumulation in the aquatic and terrestrial trophic webs, which poses concerns about the risks for end-consumers, including humans. For this reason, the European Commission included PFOS in the list of priority hazardous substances to be monitored in the EU water bodies, setting an environmental quality standard (EQS) of 9.1 ng g−1 wet weight (ww) for fish. Biota monitoring has become a valuable tool for chemical status assessments, especially for substances which are prone to accumulating in organisms [41]. In this study, the evaluation of the status of a small subalpine lake (Lake Mergozzo, Northern Italy) has been carried out for the first time by investigating the presence of some widespread accumulable legacy and emerging contaminants (Hg, PCBs, DDTs and PFASs) in biota samples. The data obtained are compared to those of fish sampled in other European lakes. Lake Mergozzo has been chosen, because it is generally considered as a control site where no direct inputs of anthropogenic origin exist. The absence of direct discharges and the biodiversity richness made it an ideal area to study biomagnification in an aquatic trophic web by deriving site-specific TMFs from trophic levels calculated by the means of a stable isotopes analysis. However, being an oligotrophic and deep lake, it was difficult to sample sufficient amounts of zooplankton for multiple chemical analyses, especially during the cold season. For that reason, in this work, we tested also the possibility to calculate TMF for a fish-only food web in this environment and compare them to the results obtained by including also zooplankton. The comparison between the literature and experimentally derived TMFs provide new insights for the biomagnification processes of PFOS and other long-chain perfluoroalkyl acids.

2. Materials and Methods
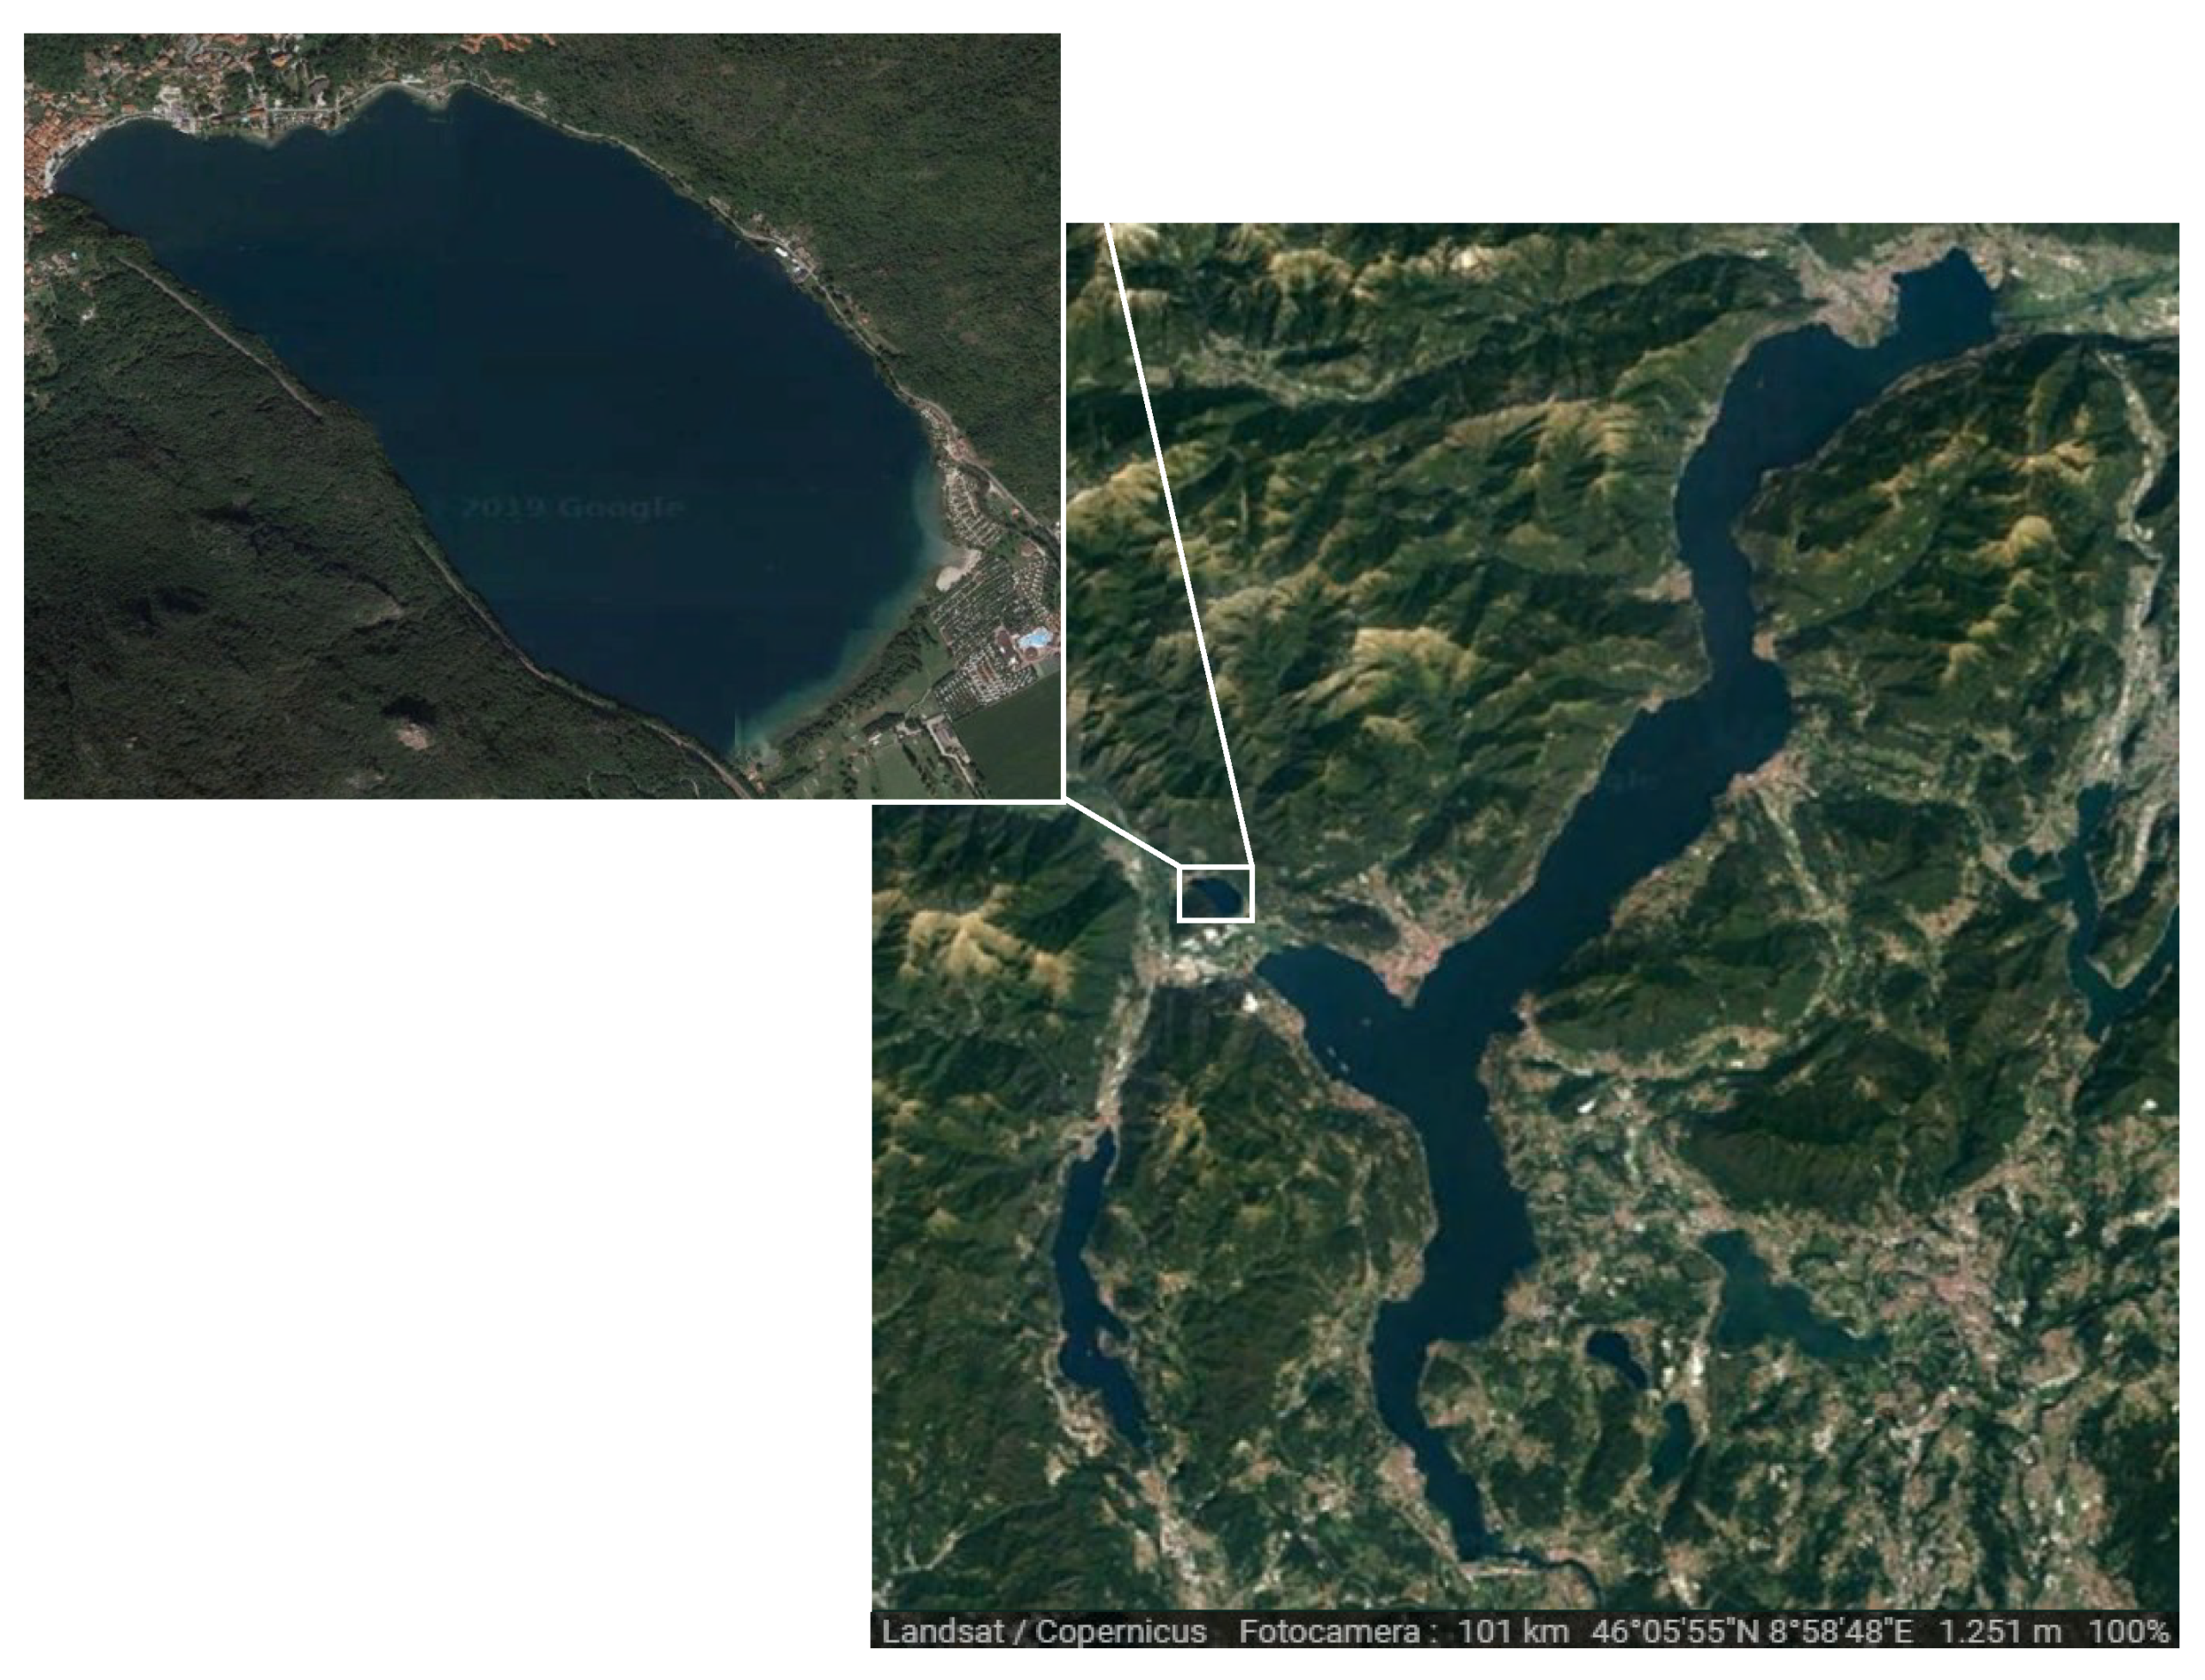
2.1. Study Area

Lake Mergozzo is a small lake located in the North-West of Italy, in the Piedmont region (45°57′ N, 8°27′ E, Figure 1 and Table S1), which belongs to the Ticino river basin. In ancient times, the lake represented the Western branch of the nearby Lake Maggiore. The two lakes were divided ca. five centuries ago by the progressive accumulation of sediments carried by River Toce. Lake Mergozzo, located at 193 m asl, a deep (maximum depth: 73 m) but relatively small (surface area: 1.83 km2) lake, is classified as a warm monomictic water body that mixes completely during one mixing period each year, and its catchment basin is mainly composed by granitic and metamorphic rocks. The littoral substrate consists mostly of sand and cobble, with a minor percentage of boulder and gravel. Submerged macrophytes are extremely scarce, while a reed bed (Phragmites australis) is found along the shoreline (Volta, unpublished data). Lake Mergozzo is fed by underwater springs and a number of mountain streams and is connected to Lake Maggiore by a canal. Usually, the water flows from Lake Mergozzo to Lake Maggiore, but in the case of severe floods, the canal flow can revert, driving Lake Maggiore waters back to Lake Mergozzo. Water residence time in Lake Mergozzo is about 6 years.
The fish community of Lake Mergozzo is quite similar to that of the nearby lakes, including littoral warm water-, sublittoral cold water- and open-water species [42,43].
Lake Mergozzo is an oligotrophic lake (ca. 4-μg L−1 total phosphorus). Since the 1980s, this condition was preserved by the diversion of domestic sewage discharges from the lake to the adjacent River Toce after treatment. Furthermore, the use of motorboats has long been forbidden. Based on the Directive 2000/60/EC, this lake has been classified in good ecological and chemical status in 2014 [44], and it was included in the protected areas of the EU Natura 2000 network according to the Habitat Directive and the Bird Directive.

2.2. Zooplankton, Benthos and Fish Sampling

Two zooplankton samples were collected in October 2016 in the deepest zone of the lake using a 58-cm-diameter zooplankton net (450-µm mesh size) hauled vertically in the layer 0–50 m 15 times in order to obtain a sufficient number of organisms necessary to perform the analyses (total volume filtered = ca. 390 m3). Zooplanktivorous fish are visual predators that choose large organisms as food. For this reason, we used a net with a large mesh size (450-µm mesh size) to avoid the capture of small body size organisms (i.e., rotifers, early developmental stages of crustacean zooplankton and large phytoplankton colonies). The first sample was divided in two parts: one part of alive organisms was frozen at −20 °C and subsequently used for a carbon (13C) and nitrogen (15N) stable isotope analysis (SIA) of the pooled organisms. The second part was divided by taxa and primary consumers (herbivores, i.e., Daphnia sp., Eubosmina longispina and Diaphanosoma brachyurum) were frozen for SIA analysis. The second sample was filtered on glass fiber filters (GF/C, 4.7 cm of diameter, pore size ca. 1.2 µm) and frozen at −20 °C and subsequently extracted as a whole sample for the contaminant analysis.
Benthos was sampled with a hand net along the shore. All the collected items were brought to the laboratory where they were individually frozen at −20 °C.
Fish were sampled by means of benthic and mesopelagic gill nets and point abundance sampling electric fishing along the shore in the first two weeks of November 2016 (see [45] for details on sampling design). All fish captured were identified at the species level, measured (total length to nearest 0.1 cm, LT) and weighed (total weight to nearest 0.1 g, WT). When more than one fish of the same species was sampled, specimens were divided in groups as follows: small-sized fish= length <30% of max theoretical total length, medium-sized fish = length comprised among 30% and 60% of the max theoretical total length and large-sized fish = length >60% of the max theoretical total length (Table S2). Fish were brought to the laboratory, and a portion of the dorsal muscle was taken and frozen at −20 °C for pollutant analyses

2.3. Stable Isotopes Analysis (SIA)

SIA was performed on the group of primary consumers and benthos organisms selected for the baseline on zooplankton-pooled samples and on fish samples (dorsal muscle tissues). Samples were oven-dried for at least 24 h at 60 °C, homogenized and transferred into tin capsules (size = 5 × 9 mm). The isotopic composition of organic carbon and nitrogen was determined by the Ján Veizer Stable Isotope Laboratory at the University of Ottawa (Ontario, Canada), following the method already described in previous studies [46,47], using a CE 1110 Elemental Analyzer (Vario EL III Elementar Analysensysteme GmbH, Hanau, Germany) and a DeltaPlus Advantage isotope ratio mass spectrometer (Delta XP Plus Advantage, Thermo Fisher Scientific, Bremen, Germany) coupled to a ConFlo III interface (ConFlo II, Thermo Fisher Scientific, Bremen, Germany). The standard deviation of the analyses (SD) based on laboratory internal standards (C-55) was <0.2 h for both 13C and 15N. Isotope ratios were expressed as the parts per thousand (‰) difference from a standard reference of PeeDee Belemnite for carbon and atmospheric N2 for nitrogen according to the equation:
13C) or (δ15N) = [(Rsample/Rstandard) − 1] × 1000,
where R is the isotopic ratio: 13C/12C or 15N/14N.
Trophic levels (TLs) obtained by SIA were compared with those available in an online available database (www.fishbase.org). TLs in the Fishbase database were derived from diet composition data mainly based on observations of the stomach contents of fish as they occur in the wild on a global scale. This approach is suggested by the Italian Guideline on Biota Monitoring, issued by the Italian Environmental Protection Agency (ISPRA) as an alternative when SIA data are not available [48].

2.4. Analysis of Contaminants

A total of 31 chemicals, including Hg, 14 PCBs, 6 DDTs and 10 PFASs congeners, were analyzed in zooplankton and fish samples.
Mercury was analyzed as total mercury at the University of Oslo (Norway). Approximately 30 mg of freeze-dried samples were weighted into quartz boats and analyzed by atomic absorption spectrometry with a Direct Mercury Analyzer (DMA-80, Milestone, Sorisole, Italy). The quantification was carried out with an external calibration curve. Analysis of blanks and certified reference material (DORM-4 fish protein and DOLT-5 dogfish liver, National Research Council Canada) were performed together with the analysis of the samples. Recoveries of the certified reference materials were within 10% of the official reported concentrations. Every type of sample was analyzed at least in duplicate to ensure precision of the measurements. The detection limit of the instrument was 0.05 ng [49].
The extraction method for DDT and PCB compounds is described extensively in [50] and in the Supplementary Materials. Summarizing, about 0.5 g of freeze-dried samples were extracted with Soxhlet equipment with n-hexane and acetone. Lipids were determined gravimetrically after repeated weighing of dried extracts. Then, the prepared samples were degraded with H2SO4 and cleaned up on a Florisil® column. DDTs and PCBs in the final extracts were analyzed by gas chromatography coupled with a 63Ni electron capture detector using an on-column injection system (Carlo Erba Instruments, Rodano, Italy). Complete extraction and analysis methods for perfluoroalkyl acids in biota samples were reported in the Supplementary Materials, as well as in [51]. Briefly, a few grams of fresh-pooled and homogenized samples were extracted by sonication with acetonitrile and MgSO4/NaCl. To remove phospholipids, extracts were filtered through special cartridges and the final extracts were injected in a liquid chromatography tandem mass spectrometry (UHPLC-MS/MS) (TSQ Quantum Access Max, Thermo Fisher Scientific, Waltham, MA, USA) coupled to a turbulent flow chromatography (TFC) (Thermo Fisher Scientific, Waltham, MA, USA) for a further on-line clean-up.

2.5. Determination of Trophic Levels and Trophic Magnification Factors

To correctly measure the trophic positions, an appropriate choice of baseline is needed. This choice is one of the most critical issues to deal with using stable isotopes for food web characterizations [8].
The two-end member-mixing model allows for the differentiation between two sources [8]. In the present study, littoral and pelagic zones in Lake Mergozzo were identified and used according to the following equation to estimate the trophic levels (TL) of zooplankton and fish [8]:
TL = λ + {δ15Nconsumer − [α × δ15Nbase1 + (1 − α) × δ15Nbase2]}/3.4,
where λ was the standard trophic level of the baseline organism. In the present study, λ was equal to 2, because zooplankton primary consumers and Corbicula were chosen as reference organisms for, respectively, pelagic and littoral signals. δ15Nbase1 and δ15Nbase2 were the average δ15N values of the littoral and pelagic baselines; 3.4 was the average increase in δ15N from a trophic level to the next one in the aquatic trophic web [8]. α was the coefficient representing the proportion of nitrogen in the consumer derived from each food source and could be estimated using carbon stable isotopes following the equation [8]:
α = (δ13Cconsumer − δ13Cbase2)/(δ13Cbase1 − δ13Cbase2).
When α was near 0, the contribution of the pelagic source was predominant; at the contrary, α near 1 indicated a strong influence of a littoral source; when α = 0, the specimen was totally pelagic. If α values were comprised between 0 and 1, the organism fed on both pelagic and benthic sources.
High lipid content of an organism may influence the δ13C values, and tissues rich in lipids are more depleted in δ13C than those rich in proteins and carbohydrates [52]. Moreover, the heterogeneity of the lipid content among samples could influence the carbon values. In aquatic organisms, a strong relationship between the lipid content and the carbon-to-nitrogen ratio (C:N) was found [53]. To obtain the lipid-corrected δ13C values, we applied a mathematical normalization proposed by [53] that used the C:N ratio as the parameter of conversion:
δ13Cnormalised = δ13Cuntreated − 3.32 + 0.99 × C:N.
We normalized all data when many samples showed C:N values above the threshold of 3.5 [53].
A linear regression between log-transformed contaminant concentrations (expressed as lipid-normalized concentrations for DDTs and PCBs, as dry weight concentrations for Hg and as wet weight concentrations for both PFASs and Hg [54]) and the trophic levels of organisms, calculated by Equation 2, was conducted.
Trophic magnification factors (TMFs) were determined as the antilog with base 10 of the slope b of the linear regression (TMF = 10b) [4]. TMFs have been derived for those substances that have more than 90% of the measured data (i.e., concentration > Limit of Quantification (LOQ)). Censored data were substituted by ½ LOQ.
The measured concentrations (concmeas) have been adjusted to the reference trophic level of 4 (concTL-adj) according to Equation (5), as reported in the European Union Guidance on Biota Monitoring [55].
concTL-adj = concmeas × TMF(4 − TL(x)).
The R statistical software (R version 3.5.1, R Core Team, 2018, Free Software Foundation, Boston, MA, USA) was used to conduct the data analysis. Statistical significance was set at p < 0.05.

3. Results and Discussion

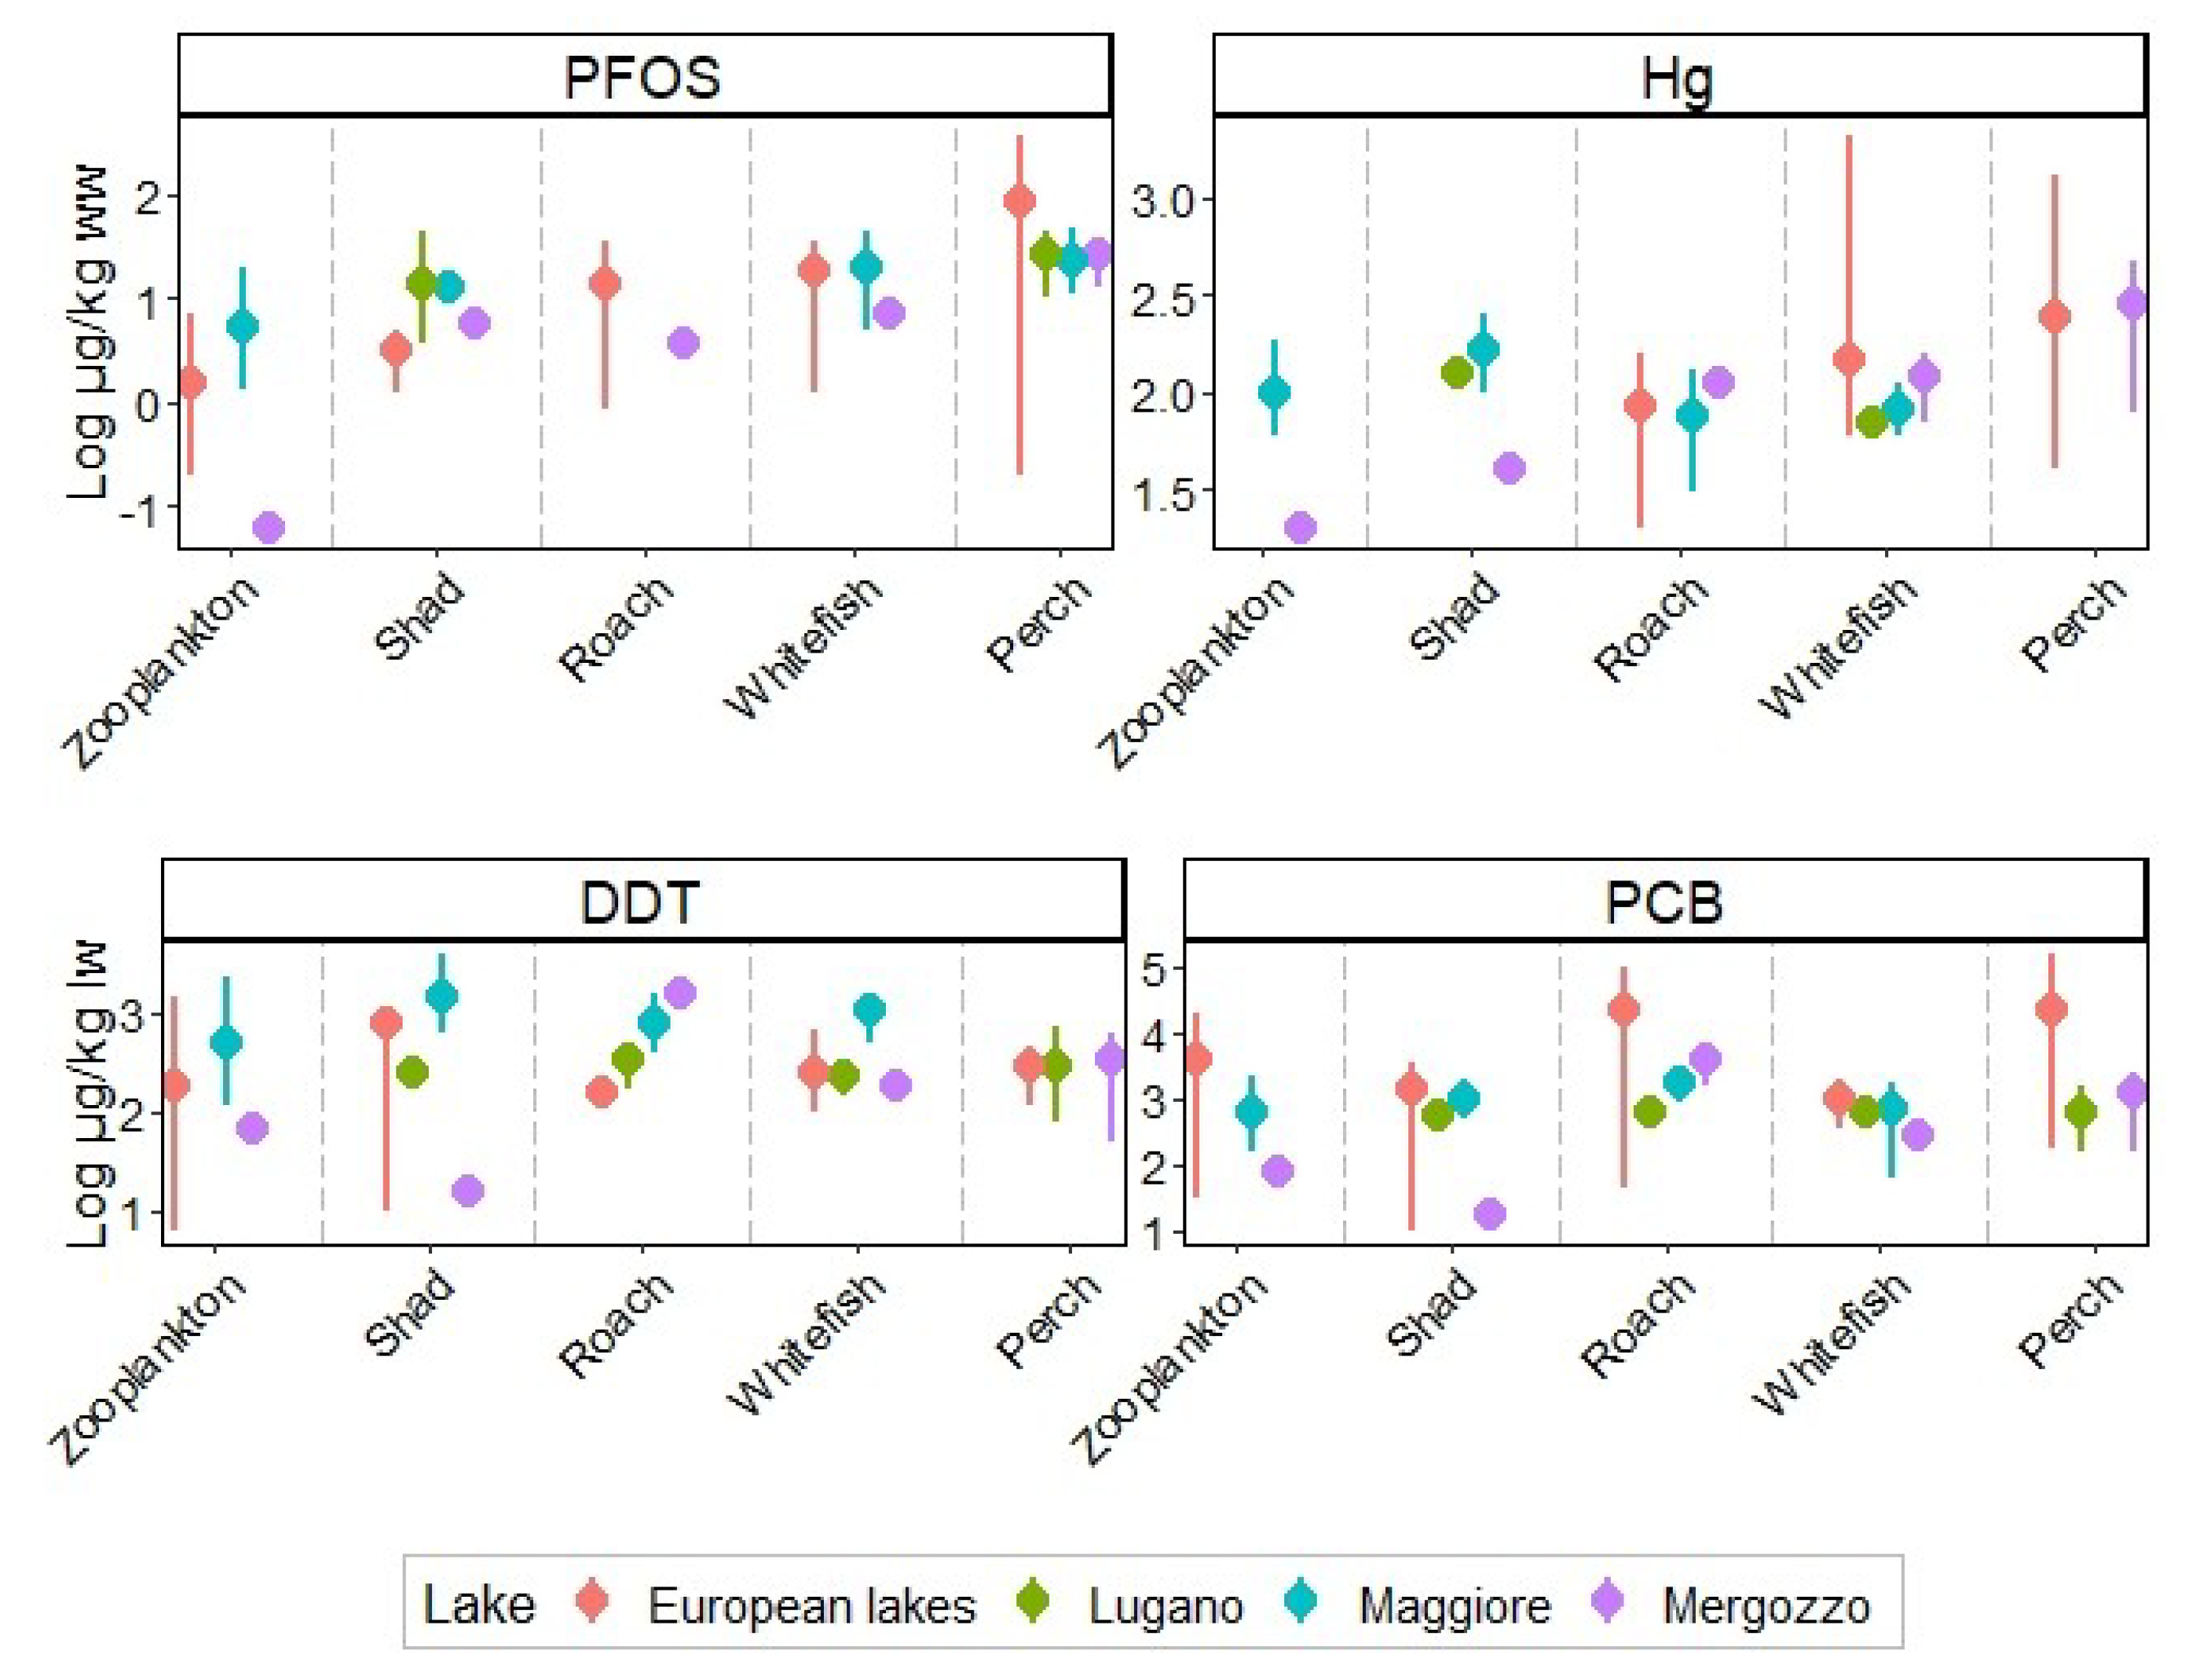
3.1. Chemicals Concentrations in Biota of Lake Mergozzo

Following the EU regulation on water monitoring (Water Framework Directive 2000/60/EC), the Regional Environmental Protection Agency of Piedmont (ARPA Piemonte) has classified Lake Mergozzo in good ecological and chemicals status [44] thanks also to some mitigation measures of avoiding nutrient and urban pollutant discharges implemented since the eighties of the last century. This lake is generally considered unpolluted even by heavy metals, so much to be used as a reference site and a clean control sample during microbial community tests on metals [56].
Based on this, the evaluation of the status of Lake Mergozzo has been carried out by means of the investigation of the presence of some widespread accumulable and persistent contaminants in biota samples. Detailed data regarding chemicals concentrations of Hg, DDTs, PCBs and PFASs in biota collected from this lake are reported in Tables S2–S5. DDTs and PCBs concentrations were normalized to the lipid content (lw), while PFASs and Hg are reported as wet weight (ww) concentrations, as requested also by EU regulations, and a brief summary is given below.
Concentrations recorded in samples from Lake Mergozzo are reported in Tables S2–S5. In particular, total Hg levels were about 20.0 µg kg−1 ww in zooplankton, while they ranged from 35.9 to 501 µg kg−1 ww in fish (Table S2). DDTs concentrations, expressed as a sum of two congeners and four respective metabolites of DDT, were between 16 and 1.3 104 µg kg−1 lw (Table S3), while PCB levels, reported as a sum of 14 congeners, ranged from 17 to 1.5 104 µg kg−1 lw (Table S4). In terms of the detection frequency (DF), p,p′-dichlorodiphenyldichloroethane (p,p′-DDD) and the dichlorodiphenyldichloroethylene (DDE) isomers have been found in the majority of samples (DF > 80%), as opposed to o,p′ DDD (DF 30%) and the parental compounds (DDT isomers DF < 45%). p,p′-DDD were the predominant DDTs in all the collected specimens, except for zooplankton and pikeperch The most frequently detected congeners among PCBs were PCB 153 and PCB 180 (DF = 100%) (Table S4). Regarding PFAS concentrations, expressed as the sum of congeners, they ranged from < LOD to 60 µg kg−1 ww (Table S5). Among this group of compounds, PFOS and C10-C12 PFCAs displayed the highest DFs (95%–100%). Perfluorononanoic acid (PFNA) was only sporadically found (DF = 30%), while C6–C8 PFCAs and perfluorohexanesulfonate (PFHxS) were always below the detection limit. When considering the composition pattern, PFOS was the predominant PFAS in the majority (84%) of fish, while perfluoroundecanoic acid (PFUnDA) was the most detected one in zooplankton.
Measured concentrations in fish can be checked against the environmental quality standards for biota (EQSbiota), which were set by the European Union in Directive 2013/39/EU for Hg (20 µg kg−1 ww referred to fish) and PFOS (9.1 µg kg−1 ww). Comparing data with these EQSbiota values, Hg concentrations ranged from two to twenty-five-fold the EQSbiota in all fish collected during this study. Differently, PFOS concentrations exceeded the EQSbiota only in 30% of samples. Moreover, the Italian legislation on priority substances also defines an EQSbiota for DDTs, setting limits at 100 µg kg−1 ww for fish with >5% lipids (Italian Decree 172/2015). Based on this, DDT concentrations never exceeded the EQSbiota, with only one exception, represented by pikeperch.
At the same time, the high variability of concentrations among the different fish species (Tables S2–S5) suggests that different statuses of classifications could also be obtained by choosing different fish species, but a normalization could be obtained by applying a correction for trophic levels, as suggested by the CIS Guidance on Biota Monitoring [55], as carried out in Section 3.4.
In order to understand the actual status of Lake Mergozzo, fish concentrations detected in the present study have been compared to concentrations reported in th literature and published in the last ten years (Table S6 and references therein). Among our samples, only shad, whitefish, roach and perch have been considered, because they are the most frequently collected species in biota monitoring programs in the European states. Figure 2 shows the comparison of concentration ranges among Lakes Mergozzo, Maggiore Lugano and other European lakes on a logarithmic scale. We presented data of Lakes Mergozzo, Maggiore and Lugano separately, considering that they belong to the same hydrographic basin and might be influenced by similar pollutions. Generally, concentrations detected in Lake Mergozzo were in the same order of magnitude as levels found in the same species caught in the other European lakes. It also can be noticed that, except for PFOS, concentrations in shad were always placed between the lowest values found in the same fish from the other European lakes. Unexpectedly, DDT concentrations measured in fish from Lake Mergozzo were not always lower than levels detected in the same species collected in Lake Maggiore, which was directly impacted by a chemical industry source. Indeed, for many decades, one of the main affluents of Lake Maggiore, River Toce, has received wastewaters from a chemical factory, which produced technical DDT by using a chlor-alkali plant with mercury cells [50,57], located in Pieve Vergonte, about 20 km from Lake Mergozzo. Currently, soils in the River Toce basin, which is bordering on the Lake Mergozzo catchment, are contaminated with DDT and p,p′-DDD by atmospheric deposition from the industrial area [49], and their run-off can represent a possible source of contamination for the water bodies in that area together with direct atmospheric transport and deposition. Alternatively, we cannot exclude that some fish species such as roach migrate from Lake Maggiore to Lake Mergozzo, exploiting a connecting stream between the two lakes.
Considering the above-mentioned evidence, Lake Mergozzo should be considered an impacted lake, despite the apparent absence of any direct pollution sources. However, it can be complicated to define the chemical status of a waterbody through biota monitoring. Indeed, the present results illustrate that the final judgment is strongly dependent on the considered species (Figure 2) and, especially, on organisms’ feeding behaviors. For this reason, it is necessary to make a more detailed analysis trying to verify whether there is a relationship between chemical bioaccumulations in the biota and their trophic levels.

3.2. Trophic Levels

Stable isotope techniques produce a continuum of trophic positions (as opposed to discrete trophic levels) of all organisms, considering the magnitude of energy and mass fluxes through different food web pathways and complex interactions such as an omnivory [58]. In lakes, the two major sources of available energy are littoral and pelagic productions, and δ13C data are particularly effective in distinguishing the two areas, because they reflect the different fractionations carried out by primary producers during the uptake of dissolved inorganic carbon [58]. As reported by previous studies [8,59], long-lived primary consumers, such as molluscs, are recommended to standardize the baseline of food webs. In this study, the bivalve Corbicula fluminea was sampled for a littoral signal, but a different type of organism was necessary for a pelagic signal. Therefore, zooplankton, i.e., Daphnia sp., Eubosmina longispina and Diaphanosoma brachyurum, were chosen as the reference group of first-consumer organisms. Daphnia has been already used as a pelagic baseline in other deep lakes with similar compositions of the zooplanktonic community [47,60,61].
As already mentioned in the Materials and Methods Section, each consumer was allocated to one or the other of these food chains through the α coefficient (Table 1).
Some of the α values were near zero, and all were less than 0.5. This implied that the pelagic source is predominant in the diet of the zooplankton community (that includes copepods and cladocera predators), as expected, but it was important also for all analyzed fish species. These results confirmed the visual observations and the previous knowledge of the morphological characteristics of Lake Mergozzo. Indeed, this lake presents a short and steep littoral area that does not allow the growth of many aquatic plants and the settlement of big populations of mollusc and long-lived primary consumers, limiting the littoral resources. Based on this, all samples were analyzed together as part of a unique food web.
Considering the enrichment factor used to calculate the trophic positions, the mean trophic fractionation of 3.4‰ suggested by Post [8] for aquatic food webs was selected. It is important to note that 3.4‰ is an approximation of the trophic fractionation, which can range between 2‰ and 5‰ [8]. Using a unique value across many trophic levels does not reflect the temporal or spatial variations of the trophic web, and it could lead to under- or overestimating the calculated TLs. Nevertheless, this value is usually adopted in the literature [41] and is proposed by the European Union regulation too [55].
Calculated trophic levels (TLs) are reported in Table 1. They ranged from 2.5 to 5.7, and the difference between the highest and the lowest trophic level was 3.2, greater than the minimum span of 2 needed for deriving the TMF [41].
By comparing experimental (SIA) and literature (Fishbase) TLs in Table 1 and Figure S1, it is evident that experimental trophic levels were systematically higher than those reported in the web-based database. A paired t-test between experimental and literature TLs confirmed that the differences are statistically significant (p < 0.001). Therefore, the use of the SIA approach is highly recommended.

3.3. Trophic Magnification Factors

Trophic magnification factors derived from measured trophic levels for mercury, legacy organochlorine compounds and perfluoroalkyl acids are presented in Table 2.
The regression slope of Hg was significant (p-value < 0.001) both for dry weight and wet weight concentrations, with values of 2.3 and 2.4, respectively. These data were consistent with the worldwide data analysis of Lavoie et al. [32], who calculated a mean TMF value for freshwater sites of 4.3 ± 4.8. The normalization of Hg concentrations to dry weight provides more information, because it is probably more correlated with the tissue protein content; however, the wet weight–based TMF and the dry weight–normalized TMF were not statistically different, as reported in other studies [41,62].
The TMF of PCBs and DDTs were in the upper range or even higher than the literature data collected and reviewed by Walters [63] (6 ± 7 for PCB 153, 1.8 ± 0.6 for DDD and 1.6 ± 0.4 DDT). The largest difference was obtained for p,p′-DDD, which reached extremely high concentrations in some fish species. It was observed that oligotrophic lakes showed higher TMF values for organochlorine substances [36], and their biomagnification in food webs of the deep lakes was greater when trophic nets were more dependent on pelagic carbon sources [3]. Both of these two concurring factors might explain the higher TMF measured in Lake Mergozzo (which is deep and small) for PCBs and DDTs.
In the case of perfluoroalkyl acids, TMF could be derived only for PFOS and long-chain PFCAs from 10 to 12 carbon atoms, because their detection frequency is close to 100%. Interpolated TMFs were significant for short-chain PFOS but not for long-chain PFCAs. The PFOS values (TMF = 3.0) were included in the wide range (1.0–19.6) of literature TMFs derived in different trophic webs around the world [5]. It is interesting to highlight that most of these TMFs were derived in trophic webs that included top predators such as birds and mammals, while, in our case, only different fish species and one sample of zooplankton was included.
In fact, the numerical disproportion between fish and invertebrate data in Lake Mergozzo exists because it is an oligotrophic and deep lake where a greater sampling effort is needed to obtain a zooplanktonic biomass for multiple chemical analyses, especially during the cold season. Moreover, it is not possible to efficiently separate zooplankton at the species level, and the derived TL (Table 1) results in an average of TLs of different species with different feeding behaviors.
Thus, the effect of the elimination of zooplankton on TMF regressions was tested in order to understand if a significant TMF could be derived also for a fish-only food web (Table 3).
After the zooplankton elimination, the dataset was composed by 19 samples of 13 different fish species, with TL spanning from 4.1 to 5.7 (range = 1.6). According to literature reviews, it is important to “benchmark” the results for the study design against a substance universally recognized to be prone to biomagnification for the evaluation of the biomagnification potential for other chemicals [3,5]. In our experimental project, we included Hg as the positive control. In fact, as shown in Table 3 and Figure S2, the TMF for Hg was still significant even if derived for a fish-only food web, and the values (2.9–3.0) were still consistent with the available literature data [32]. In the case of PCBs and DDTs, their TMFs were still high, even if the reduction of the TLs’ range led to a loss in statistical significance (Table 3).
The greatest impact of the elimination of zooplankton data was observed for PFOS, whose TMF became not significant (Table 3 and Figure S3), as in the case of the other long-chain PFCAs. The significance of this result, which might imply that the biomagnification is not an effective process for PFAS in fish in this environment, should be assessed with a larger dataset [3], studying also the role of water bioconcentration and elimination. Nevertheless, we discussed the results, because the fish biomagnification for Hg is still significant in the fish-only trophic web, and the literature data about the biomagnification potency of PFOS in freshwater are controversial [5]. In fact, Kelly et al. [37], analyzing a narrower TL range for a pure piscivorous part of the food web, obtained results similar to ours for PFOS (TMF = 0.5) and for C10-C12 PFCA (TMFs from 0.6 to 1.1). For what concerns freshwater lentic environments, negative relationships were found between PFAS concentrations in fish and their δ15N in some remote lakes [64], suggesting that no biomagnification of PFASs occurred through these food webs and the carbon source or the trophic position, affected PFAS concentrations in fish in the studied environments [65]. TMFs for any PFASs, including PFOS, were not significant in Baiyangdian Lake, China [66]; on the contrary, Fang et al. [67] measured TMFs ranging from 2.3 to 2.6 for long-chain PFCAs and 3.74 for PFOS, analyzing only fish species in the shallow Lake Taihu, China. It is interesting to note that, in the Gironde estuarine environment, TMFs in demersal food webs were in the range of 0.2–1.5, with a TMF of 0.9 for the linear PFOS, while derived TMF for PFOS in benthic food webs was 2.5 [68]. The reanalysis of the same dataset with advanced statistical techniques showed that none of the investigate PFASs could be considered to biomagnify in the whole estuarine food web [69].
The lack of significance for PFOS biomagnification in our fish-only food web can be explained by the high pelagic character of this food web due to an almost absence of degrading littoral areas and the significant contribution of bioconcentrations from water, which should be studied by its analyses. It is supposed that fish concentrations are more regulated by the concentrations of specific binding proteins [70] or membrane phospholipids [71] in the bioconcentration process than by the trophic position of different fish species.
Another confounding factor leading to the overestimation of PFOS TMFs at some sites might be the occurrence of unidentified precursors and their enhanced biotransformations in fish compared to invertebrates [72]. Unfortunately, no data on PFASs precursors are currently available for Lake Mergozzo, but the absence of direct discharges makes probable that a significant PFAS source is the deposition of air-born perfluorinated precursors [73].

3.4. Adjusting Monitoring Data for the Trophic Level for Comparison with the Established EQSbiota

As said before, the chemical status classification of a water body is strongly dependent on the choice of biota species to monitor. Among the analyzed compounds, EQSbiota are established at the European level only for Hg (20 µg kg−1 ww) and PFOS (9.1 µg kg−1 ww). These quality standards have been derived for a reference fish of TL = 4, and site-specific TMFs can be used to normalize monitoring data for the trophic level by applying Equation 5 (Section 2.5) when different biota species are monitored for chemical status classification [55]. Site-specific TMFs for Hg (2.3) and for PFOS (3.0) were derived from the trophic chain, including zooplankton (Table 2). The results (Table 4) showed that, for Hg, there was an effect of normalizing (reducing data range), but all the data, apart from Arctic char, still exceeded EQSbiota. On the contrary, for PFOS, the exceedances were reduced from 30% to 5% of the samples.
Following the European Union guidelines [55], the geometric means of the whole dataset should be used for compliance checking with the EQS after normalization by the TLs. For Hg, the geometric mean after the TL correction is 54.7 µg kg−1 ww, which is more than two times the EQS. For PFOS, the geometric mean is 1.6, which is significantly lower than the EQS (Table 4). According to the EQS Directive 2013/39/EU, Lake Mergozzo failed to achieve a good surface water chemical status because of the accumulation of Hg in the biota.
Nevertheless, we have to underline that the 95% confidence bands of the TMF values were not negligible and wider for PFOS (1.17–7.71) than for Hg (1.45–3.55) (Table 2). This fact significantly increased the uncertainties in the chemical status classification, as discussed in [41].

4. Conclusions

Although Lake Mergozzo does not receive direct inputs of contaminants and is classified in a good chemical ecological status, the monitoring of persistent and accumulable compounds in the biota shows a different picture. Most sampled fish exceed the EQSbiota for Hg and PFOS, and some species, such as roach, bioaccumulate DDTs and PCBs at the same level or even higher than Lake Maggiore, which is known for its significant DDT pollution. The chemical status assessment of the investigated lake is highly variable, depending on the species and the organism’s feeding behavior. The TMF data derived in Lake Mergozzo showed clearly that biomagnification occurs for Hg and organochlorines, with TMFs always greater than 2. On the contrary, in a fish-only food web, TMFs for all PFASs compounds, including PFOS, are not significant and lower than 1. Even if a low sample size and low TL range hampered the possibility to demonstrate our conclusions, we hypothesize that biomagnification is not the main process for PFAS bioaccumulation for fish in this environment, but further studies with a wider dataset are necessary for a better understanding of this process.
In deriving TMFs from real samples, it seems important to include compounds such as Hg and PCB 153, since they are benchmarks for assessing the bioaccumulation potential of other contaminants of concern that showed unclear patterns, such as PFASs.

Supplementary Materials

The following are available online at https://www.mdpi.com/2073-4441/12/6/1591/s1: Figure S1. Comparison between Fishbase TLs and measured TLs. Figure S2. Derived TMFs of Hg for lake food web, including zooplankton, (left) and for fish-only food web (right). Confidence band (95%) is represented in grey. Figure S3. Derived TMFs of PFOS for lake food web, including zooplankton, (left) and for fish-only food web (right). Confidence band (95%) is represented in grey. Table S1. Lake Mergozzo morphometric characteristics. Table S2. Hg concentrations (µg kg−1 ww) in samples. Table S3. DDT concentrations (µg kg−1 lw) in samples. Table S4. PCB concentrations (µg kg−1 lw) in samples. Table S5. PFAS concentrations (µg kg−1 ww) in samples. Table S6. Data comparison among results of this study and fish concentrations in European lakes. Concentrations are expressed in µg kg−1 lw for DDTs and PCBs and in µg kg−1 ww for PFAS and for Hg. For each species, mean, minimum and maximum (in brackets) values are reported.

Author Contributions

Conceptualization, M.M., R.B., S.V. and S.P.; sampling and SIA analysis, R.P., D.C. and P.V.; chemical analysis, M.M. and C.F.; writing—original draft preparation, M.M., S.P. and C.F. and review, R.B, S.V., P.V, R.P. and K.B. All authors have read and agreed to the published version of the manuscript.

Funding

This research was partially funded by the European Union project Life-Natura IdroLIFE grant number LIFE15NAT/IT/000823.

Acknowledgments

The authors warmly thank R. Perna and S. Regazzoni for their invaluable help for PCB and DDT analyses and D. Hitchcock for his precious help in the Hg analysis.

Conflicts of Interest

The authors declare no conflicts of interest.

References

  1. Mackay, D.; Fraser, A. Bioaccumulation of persistent organic chemicals: Mechanisms and models. Environ. Pollut. 2000, 110, 375–391. [Google Scholar] [CrossRef]
  2. Conder, J.M.; Gobas, F.A.P.C.; Borgå, K.; Muir, D.C.G.; Powell, D.E. Use of trophic magnification factors and related measures to characterize bioaccumulation potential of chemicals. Integr. Environ. Assess. Manag. 2012, 8, 85–97. [Google Scholar] [CrossRef] [PubMed]
  3. Borgå, K.; Kidd, K.A.; Muir, D.C.G.; Berglund, O.; Conder, J.M.; Gobas, F.A.P.C.; Kucklick, J.; Malm, O.; Powell, D.E. Trophic magnification factors: Considerations of ecology, ecosystems, and study design. Integr. Environ. Assess. Manag. 2012, 8, 64–84. [Google Scholar] [CrossRef] [PubMed]
  4. Gobas, F.A.P.C.; de Wolf, W.; Burkhard, L.P.; Verbruggen, E.; Plotzke, K. Revisiting bioaccumulation criteria for POPs and PBT assessments. Integr. Environ. Assess. Manag. 2009, 5, 624–637. [Google Scholar] [CrossRef] [PubMed]
  5. Franklin, J. How reliable are field-derived biomagnification factors and trophic magnification factors as indicators of bioaccumulation potential? Conclusions from a case study on per- and polyfluoroalkyl substances. Integr. Environ. Assess. Manag. 2016, 12, 6–20. [Google Scholar] [CrossRef] [PubMed]
  6. Won, E.J.; Choi, B.; Hong, S.; Khim, J.S.; Shin, K.H. Importance of accurate trophic level determination by nitrogen isotope of amino acids for trophic magnification studies: A review. Environ. Pollut. 2018, 238, 677–690. [Google Scholar] [CrossRef]
  7. Jardine, T.D.; Kidd, K.A.; Fisk, A.T. Applications, considerations, and sources of uncertainty when using stable isotope analysis in ecotoxicology. Environ. Sci. Technol. 2006, 40, 7501–7511. [Google Scholar] [CrossRef]
  8. Post, D.M. Using stable isotopes to estimate trophic position: Models, methods, and assumptions. Ecology 2002, 83, 703–718. [Google Scholar]
  9. Gioia, R.; Akindele, A.J.; Adebusoye, S.A.; Asante, K.A.; Tanabe, S.; Buekens, A.; Sasco, A.J. Polychlorinated biphenyls (PCBs) in Africa: A review of environmental levels. Environ. Sci. Pollut. Res. 2014, 21, 6278–6289. [Google Scholar] [CrossRef]
  10. Jones, K.C.; de Voogt, P. Persistent organic pollutants (POPs): State of the science. Environ. Pollut. 1999, 100, 209–221. [Google Scholar] [CrossRef]
  11. Ribeiro, E.; Ladeira, C.; Viegas, S. EDCs mixtures: A stealthy hazard for human health? Toxics 2017, 5, 5. [Google Scholar] [CrossRef] [PubMed] [Green Version]
  12. Ruzzin, J. Public health concern behind the exposure to persistent organic pollutants and the risk of metabolic diseases. BMC Public Health 2012, 12, 1. [Google Scholar] [CrossRef] [PubMed] [Green Version]
  13. Sijm, D.T.H.M.; Rikken, M.G.J.; Rorije, E.; Traas, T.P.; McLachan, M.S.; Peijnenburg, W.J.G.M. Transport, accumulation and transformation processes. In Risk Assessment of Chemicals: An Introduction; Leeuwen, C.J., van Vermeire, T.G., Eds.; Springer: Dordrecht, The Netherlands, 2007; pp. 73–158. ISBN 978-1-4020-6102-8. [Google Scholar]
  14. Mitra, S.; Corsolini, S.; Pozo, K.; Audy, O.; Sarkar, S.K.; Biswas, J.K. Characterization, source identification and risk associated with polyaromatic and chlorinated organic contaminants (PAHs, PCBs, PCBs and OCPs) in the surface sediments of Hooghly estuary, India. Chemosphere 2019, 221, 154–165. [Google Scholar] [CrossRef] [PubMed]
  15. Olatunji, O.S. Evaluation of selected polychlorinated biphenyls (PCBs) congeners and dichlorodiphenyltrichloroethane (DDT) in fresh root and leafy vegetables using GC-MS. Sci. Rep. 2019, 9, 1–10. [Google Scholar] [CrossRef] [Green Version]
  16. Yang, J.; Qadeer, A.; Liu, M.; Zhu, J.M.; Huang, Y.P.; Du, W.N.; Wei, X.Y. Occurrence, source, and partition of PAHs, PCBs, and OCPs in the multiphase system of an urban lake, Shanghai. Appl. Geochem. 2019, 106, 17–25. [Google Scholar] [CrossRef]
  17. Atmaca, E.; Das, Y.K.; Yavuz, O.; Aksoy, A. An evaluation of the levels of organochlorine compounds (OCPs and PCBs) in cultured freshwater and wild sea fish eggs as an exposure biomarker for environmental contamination. Environ. Sci. Pollut. Res. 2019, 26, 7005–7012. [Google Scholar] [CrossRef]
  18. Rigét, F.; Bignert, A.; Braune, B.; Dam, M.; Dietz, R.; Evans, M.; Green, N.; Gunnlaugsdóttir, H.; Hoydal, K.S.; Kucklick, J.; et al. Temporal trends of persistent organic pollutants in Arctic marine and freshwater biota. Sci. Total Environ. 2019, 649, 99–110. [Google Scholar] [CrossRef]
  19. Robinson, T.; Ali, U.; Mahmood, A.; Chaudhry, M.J.I.; Li, J.; Zhang, G.; Jones, K.C.; Malik, R.N. Concentrations and patterns of organochlorines (OCs) in various fish species from the Indus River, Pakistan: A human health risk assessment. Sci. Total Environ. 2016, 541, 1232–1242. [Google Scholar] [CrossRef]
  20. Corsolini, S.; Sarà, G. The trophic transfer of persistent pollutants (HCB, DDTs, PCBs) within polar marine food webs. Chemosphere 2019, 177, 189–199. [Google Scholar] [CrossRef]
  21. Zhang, H.; Teng, Y.; Doan, T.T.T.; Yat, Y.W.; Chan, S.H.; Kelly, B.C. Stable nitrogen and carbon isotopes in sediments and biota from three tropical marine food webs: Application to chemical bioaccumulation assessment. Environ. Toxicol. Chem. 2017, 36, 2521–2532. [Google Scholar] [CrossRef]
  22. Helou, K.; Harmouche-karaki, M.; Karake, S.; Narbonne, J. A review of organochlorine pesticides and polychlorinated biphenyls in Lebanon: Environmental and human contaminants. Chemosphere 2019, 231, 357–368. [Google Scholar] [CrossRef] [PubMed]
  23. UNEP Stockholm convention on persistent organic pollutants (POPs). Geneva, 2001. Available online: http://chm.pops.int/Portals/0/Repository/convention_text/UNEP-POPS-COP-CONVTEXT-FULL.English.PDF (accessed on 3 June 2020).
  24. Driscoll, C.T.; Mason, R.P.; Chan, H.M.; Jacob, D.J.; Pirrone, N. Mercury as a global pollutant: Sources, pathways, and effects. Environ. Sci. Technol. 2013, 47, 4967–4983. [Google Scholar] [CrossRef]
  25. Streets, D.G.; Horowitz, H.M.; Lu, Z.; Levin, L.; Thackray, C.P.; Sunderland, E.M. Five hundred years of anthropogenic mercury: Spatial and temporal release profiles. Environ. Res. Lett. 2019, 14, 084004. [Google Scholar] [CrossRef] [Green Version]
  26. Azad, A.M.; Frantzen, S.; Bank, M.S.; Johnsen, I.A.; Tessier, E.; Amouroux, D.; Madsen, L.; Maage, A. Spatial distribution of mercury in seawater, sediment, and seafood from the Hardangerfjord ecosystem, Norway. Sci. Total Environ. 2019, 667, 622–637. [Google Scholar] [CrossRef] [PubMed]
  27. Vardè, M.; Servidio, A.; Vespasiano, G.; Pasti, L.; Cavazzini, A.; Di Traglia, M.; Rosselli, A.; Cofone, F.; Apollaro, C.; Cairns, W.R.L.; et al. Ultra-trace determination of total mercury in Italian bottled waters. Chemosphere 2019, 219, 896–913. [Google Scholar] [CrossRef] [PubMed]
  28. Wang, Y.L.; Der Fang, M.; Chien, L.C.; Lin, C.C.; Hsi, H.C. Distribution of mercury and methylmercury in surface water and surface sediment of river, irrigation canal, reservoir, and wetland in Taiwan. Environ. Sci. Pollut. Res. 2019, 26, 17762–17773. [Google Scholar] [CrossRef] [PubMed]
  29. Bargagli, R. Moss and lichen biomonitoring of atmospheric mercury: A review. Sci. Total Environ. 2016, 572, 216–231. [Google Scholar] [CrossRef]
  30. Lin, Y.; Vogt, R.; Larssen, T. Environmental mercury in China: A review. Environ. Toxicol. Chem. 2012, 31, 431–2444. [Google Scholar] [CrossRef] [Green Version]
  31. Rigét, F.; Braune, B.; Bignert, A.; Wilson, S.; Aars, J.; Born, E.; Dam, M.; Dietz, R.; Evans, M.; Evans, T.; et al. Temporal trends of Hg in Arctic biota, an update. Sci. Total Environ. 2011, 409, 3520–3526. [Google Scholar] [CrossRef]
  32. Lavoie, R.A.; Jardine, T.D.; Chumchal, M.M.; Kidd, K.A.; Campbell, L.M. Biomagnification of mercury in aquatic food webs: A worldwide meta-analysis. Environ. Sci. Technol. 2013, 47, 13385–13394. [Google Scholar] [CrossRef]
  33. Rice, K.M.; Walker, E.M.; Wu, M.; Gillette, C.; Blough, E.R. Environmental mercury and its toxic effects. J. Prev. Med. Public Health 2014, 47, 74–83. [Google Scholar] [CrossRef] [PubMed]
  34. Gantner, N.; Power, M.; Iqaluk, D.; Meili, M.; Borg, H.; Sundbom, M.; Solomon, K.R.; Lawson, G.; Muir, D.C.G. Mercury concentrations in landlocked arctic char (Salvelinus alpinus) from the Canadian arctic. Part I: Insights from trophic relationships in 18 lakes. Environ. Toxicol. Chem. 2010, 29, 621–632. [Google Scholar] [CrossRef] [PubMed]
  35. Kidd, K.A.; Bootsma, H.A.; Hesslein, R.H.; Muir, D.C.G.; Hecky, R.E. Biomagnification of DDT through the benthic and pelagic food webs of Lake Malawi, East Africa: Importance of trophic level and carbon source. Environ. Sci. Technol. 2001, 35, 14–20. [Google Scholar] [CrossRef] [PubMed]
  36. Houde, M.; Muir, D.C.G.; Kidd, K.A.; Guildford, S.; Drouillard, K.; Evans, M.S.; Wang, X.; Whittle, D.M.; Haffner, D.; Kling, H. Influence of lake characteristics on the biomagnification of persistent organic pollutants in lake trout food webs. Environ. Toxicol. Chem. 2008, 27, 2169–2178. [Google Scholar] [CrossRef]
  37. Kelly, B.C.; Ikonomou, M.G.; Blair, J.D.; Surridge, B.; Hoover, D.; Grace, R.; Gobas, F.A.P.C. Perfluoroalkyl contaminants in an arctic marine food web: Trophic magnification and wildlife exposure. Environ. Sci. Technol. 2009, 43, 4037–4043. [Google Scholar] [CrossRef]
  38. Ahrens, L.; Bundschuh, M. Fate and effects of poly- and perfluoroalkyl substances in the aquatic environment: A review. Environ. Toxicol. Chem. 2014, 33, 1921–1929. [Google Scholar] [CrossRef]
  39. Lau, C.; Anitole, K.; Hodes, C.; Lai, D.; Pfahles-Hutchens, A.; Seed, J. Perfluoroalkyl acids: A review of monitoring and toxicological findings. Toxicol. Sci. 2007, 99, 366–394. [Google Scholar] [CrossRef] [Green Version]
  40. Houde, M.; De Silva, A.O.; Muir, D.C.G.; Letcher, R.J. Monitoring of Perfluorinated Compounds in Aquatic Biota: An Updated Review. Environ. Sci. Technol. 2011, 45, 7962–7973. [Google Scholar] [CrossRef]
  41. Kidd, K.A.; Burkhard, L.P.; Babut, M.; Borgå, K.; Muir, D.C.G.; Perceval, O.; Ruedel, H.; Woodburn, K.; Embry, M.R. Practical advice for selecting or determining trophic magnification factors for application under the European Union Water Framework Directive. Integr. Environ. Assess. Manag. 2019, 15, 266–277. [Google Scholar] [CrossRef]
  42. Volta, P.; Jeppesen, E.; Campi, B.; Sala, P.; Emmrich, M.; Winfield, I.J. The population biology and life history traits of Eurasian ruffe [Gymnocephalus cernuus (L.), Pisces: Percidae] introduced into eutrophic and oligotrophic lakes in Northern Italy. J. Limnol. 2013, 72, 280–290. [Google Scholar] [CrossRef] [Green Version]
  43. Volta, P.; Yan, N.D.; Gunn, J.M. Past, present and future of the fish community of Lake Orta (Italy), one of the world’s largest acidified lakes. J. Limnol. 2016, 75, 131–141. [Google Scholar] [CrossRef] [Green Version]
  44. ARPA Piemonte Attività Arpa nella gestione delle reti di monitoraggio regionale delle acque superficiali—Corsi d’ acqua e laghi. Relazione monitoraggio anno 2016. 2017. Available online: http://www.arpa.piemonte.it/approfondimenti/temi-ambientali/acqua/acque-superficiali-corsi-dacqua/documentazione-e-dati/relazioni-tecniche-fiumi-e-laghi-2016 (accessed on 3 June 2020).
  45. Volta, P.; Jeppesen, E.; Sala, P.; Galafassi, S.; Foglini, C.; Puzzi, C.; Winfield, I.J. Fish assemblages in deep Italian subalpine lakes: History and present status with an emphasis on non-native species. Hydrobiologia 2018, 824, 255–270. [Google Scholar] [CrossRef]
  46. Visconti, A.; Caroni, R.; Rawcliffe, R.; Fadda, A.; Piscia, R.; Manca, M. Defining seasonal functional traits of a freshwater zooplankton community using δ13C and δ15N stable isotope analysis. Water (Switzerland) 2018, 10, 108. [Google Scholar] [CrossRef] [Green Version]
  47. Visconti, A.; Manca, M. Seasonal changes in the δ13C and δ15N signatures of the Lago Maggiore pelagic food web. J. Limnol. 2011, 70, 263–271. [Google Scholar] [CrossRef] [Green Version]
  48. ISPRA. Linea guida per il monitoraggio delle sostanze prioritarie (secondo D.Lgs. 172/2015); ISPRA Manuali e linee guida 143/2016; ISPRA: Roma, Italy, 2016; ISBN 978-88-448-0795-5.
  49. Hitchcock, D.J.; Andersen, T.; Varpe, Ø.; Loonen, M.J.J.E.; Warner, N.A.; Herzke, D.; Tombre, I.M.; Griffin, L.R.; Shimmings, P.; Borgå, K. Potential Effect of Migration Strategy on Pollutant Occurrence in Eggs of Arctic Breeding Barnacle Geese (Branta leucopsis). Environ. Sci. Technol. 2019, 53, 5427–5435. [Google Scholar] [CrossRef] [PubMed]
  50. Bettinetti, R.; Quadroni, S.; Manca, M.; Piscia, R.; Volta, P.; Guzzella, L.; Roscioli, C.; Galassi, S. Seasonal fluctuations of DDTs and PCBs in zooplankton and fish of Lake Maggiore (Northern Italy). Chemosphere 2012, 88, 344–351. [Google Scholar] [CrossRef] [PubMed]
  51. Mazzoni, M.; Polesello, S.; Rusconi, M.; Valsecchi, S. Liquid chromatography mass spectrometry determination of perfluoroalkyl acids in environmental solid extracts after phospholipid removal and on-line turbulent flow chromatography purification. J. Chromatogr. A 2016, 1453, 62–70. [Google Scholar] [CrossRef]
  52. McConnaughey, T.; McRoy, C.P. Food-Web structure and the fractionation of Carbon isotopes in the Bering sea. Mar. Biol. 1979, 53, 257–262. [Google Scholar] [CrossRef]
  53. Post, D.M.; Layman, C.A.; Arrington, D.A.; Takimoto, G.; Quattrochi, J.; Montaña, C.G. Getting to the fat of the matter: Models, methods and assumptions for dealing with lipids in stable isotope analyses. Oecologia 2007, 152, 179–189. [Google Scholar] [CrossRef]
  54. Fliedner, A.; Rüdel, H.; Lohmann, N.; Buchmeier, G.; Koschorreck, J. Biota monitoring under the Water Framework Directive: On tissue choice and fish species selection. Environ. Pollut. 2018, 235, 129–140. [Google Scholar] [CrossRef]
  55. European Union. CIS-WFD Guidance Document No. 32 On biota monitoring (the implementation of EQSbiota) under the Water Framework Directive Technical Report 2014-083; Office for Official Publications of the European Communities: Luxembourg, 2014; ISBN 9789279446344. [Google Scholar]
  56. Di Cesare, A.; Eckert, E.M.; Corno, G. Co-selection of antibiotic and heavy metal resistance in freshwater bacteria. J. Limnol. 2016, 75, 59–66. [Google Scholar] [CrossRef] [Green Version]
  57. Pisanello, F.; Marziali, L.; Rosignoli, F.; Poma, G.; Roscioli, C.; Pozzoni, F.; Guzzella, L. In situ bioavailability of DDT and Hg in sediments of the Toce River (Lake Maggiore basin, Northern Italy): Accumulation in benthic invertebrates and passive samplers. Environ. Sci. Pollut. Res. 2016, 23, 10542–10555. [Google Scholar] [CrossRef] [PubMed]
  58. Post, D.M.; Pace, M.L.; Halrston, N.G. Ecosystem size determines food-chain length in lakes. Nature 2000, 405, 1047–1049. [Google Scholar] [CrossRef] [PubMed]
  59. Vander Zanden, M.J.; Rasmussen, J.B. Variation in δ15N and δ13C trophic fractionation: Implications for aquatic food web studies. Limnol. Oceanogr. 2001, 46, 2061–2066. [Google Scholar] [CrossRef]
  60. Leoni, B. Zooplankton predators and preys: Body size and stable isotope to investigate the pelagic food web in a deep lake (Lake Iseo, Northern Italy). J. Limnol. 2017, 76, 85–93. [Google Scholar] [CrossRef] [Green Version]
  61. Perga, M.-E.; Gerdeaux, D. Seasonal variability in the δ13C and δ15N values of the zooplankton taxa in two alpine lakes. Acta Oecologica 2006, 30, 69–77. [Google Scholar] [CrossRef]
  62. Wyn, B.; Kidd, K.A.; Burgess, N.M.; Curry, R.A. Mercury biomagnification in the food webs of acidic lakes in Kejimkujik National Park and National Historic Site, Nova Scotia. Can. J. Fish. Aquat. Sci. 2009, 66, 1532–1545. [Google Scholar] [CrossRef]
  63. Walters, D.M.; Jardine, T.D.; Cade, B.S.; Kidd, K.A.; Muir, D.C.G.; Leipzig-Scott, P. Trophic Magnification of Organic Chemicals: A Global Synthesis. Environ. Sci. Technol. 2016, 50, 4650–4658. [Google Scholar] [CrossRef]
  64. Åkerblom, S.; Negm, N.; Wu, P.; Bishop, K.; Ahrens, L. Variation and accumulation patterns of poly- and perfluoroalkyl substances (PFAS) in European perch (Perca fluviatilis) across a gradient of pristine Swedish lakes. Sci. Total Environ. 2017, 599-600, 1685–1692. [Google Scholar] [CrossRef]
  65. Lescord, G.L.; Kidd, K.A.; De Silva, A.O.; Williamson, M.; Spencer, C.; Wang, X.; Muir, D.C.G. Perfluorinated and polyfluorinated compounds in lake food webs from the Canadian High Arctic. Environ. Sci. Technol. 2015, 49, 2694–2702. [Google Scholar] [CrossRef]
  66. Zhou, Z.; Shi, Y.; Li, W.; Xu, L.; Cai, Y. Perfluorinated compounds in surface water and organisms from Baiyangdian Lake in North China: Source profiles, bioaccumulation and potential risk. Bull. Environ. Contam. Toxicol. 2012, 89, 519–524. [Google Scholar] [CrossRef] [PubMed]
  67. Fang, S.; Chen, X.; Zhao, S.; Zhang, Y.; Jiang, W.; Yang, L.; Zhu, L. Trophic magnification and isomer fractionation of perfluoroalkyl substances in the food web of Taihu Lake, China. Environ. Sci. Technol. 2014, 48, 2173–2182. [Google Scholar] [CrossRef] [PubMed]
  68. Munoz, G.; Budzinski, H.; Babut, M.; Drouineau, H.; Lauzent, M.; Le Menach, K.; Lobry, J.; Selleslagh, J.; Simonnet-Laprade, C.; Labadie, P. Evidence for the Trophic Transfer of Perfluoroalkylated Substances in a Temperate Macrotidal Estuary. Environ. Sci. Technol. 2017, 51, 8450–8459. [Google Scholar] [CrossRef] [PubMed]
  69. Ballutaud, M.; Drouineau, H.; Carassou, L.; Munoz, G.; Chevillot, X.; Labadie, P.; Budzinski, H.; Lobry, J. EStimating Contaminants tRansfers Over Complex food webs (ESCROC): An innovative Bayesian method for estimating POP’s biomagnification in aquatic food webs. Sci. Total Environ. 2019, 658, 638–649. [Google Scholar] [CrossRef] [PubMed]
  70. Ng, C.A.; Hungerbühler, K. Bioconcentration of perfluorinated alkyl acids: How important is specific binding? Environ. Sci. Technol. 2013, 47, 7214–7223. [Google Scholar] [CrossRef] [PubMed]
  71. Armitage, J.M.; Arnot, J.A.; Wania, F.; Mackay, D. Development and evaluation of a mechanistic bioconcentration model for ionogenic organic chemicals in fish. Environ. Toxicol. Chem. 2013, 32, 115–128. [Google Scholar] [CrossRef]
  72. Simmonet-Laprade, C.; Budzinski, H.; Babut, M.; Le Menach, K.; Munoz, G.; Lauzent, M.; Ferrari, B.J.D.; Labadie, P. Investigation of the spatial variability of poly- and perfluoroalkyl substance trophic magnification in selected riverine ecosystems. Sci. Total Environ. 2019, 686, 393–401. [Google Scholar] [CrossRef]
  73. Gebbink, W.A.; Bignert, A.; Berger, U. Perfluoroalkyl Acids (PFAAs) and Selected Precursors in the Baltic Sea Environment: Do Precursors Play a Role in Food Web Accumulation of PFAAs? Environ. Sci. Technol. 2016, 50, 6354–6362. [Google Scholar] [CrossRef]
Figure 1. Lake Mergozzo satellite view (from Google Earth).
Water 12 01591 g001
Figure 2. Data comparison among the results of this study (in violet) and chemicals concentrations recorded in European lakes (in red), Lake Lugano (in green) and Lake Maggiore (in blue). Concentrations are expressed in logarithmic concentrations. Filled dots and bars represent average value and range, respectively. Detailed data are reported in Table S6. PFOS: perfluorooctanesulfonate, Hg: mercury, DDT: dichlorodiphenyltrichloroethane and metabolites and PCB: polychlorinated biphenyls.
Water 12 01591 g002
Table 1. α values and trophic levels (TL) calculated by stable isotope analysis (SIA) and derived by a literature database (www.fishbase.org) of sampled organisms.
Species Common NameSpecies Scientific NameSizeαTL (SIA)TL (Fishbase)
Zooplankton >450 µm0.02.5
ShadAlosa agone 0.34.13.0
Roach1Rutilus rutilussmall and medium0.44.43.0
ChubSqualius squalus 0.34.52.7
Rudd1Scardinius hesperidicusmedium0.34.62.9
Perch1Perca fluviatilismedium0.54.74.4
PumpkinseedLepomis gibbosus 0.54.73.3
Rudd2Scardinius hesperidicuslarge0.44.72.9
European whitefish1Coregonus lavaretusmedium0.24.83.1
Roach2Rutilus rutiluslarge0.44.83.0
European whitefish2Coregonus lavaretuslarge0.15.03.1
RuffeGymnocephalus cernuus 0.35.03.3
Largemouth bass1Micropterus salmoideslarge0.45.13.8
PikeperchSander lucioperca 0.45.14.0
Largemouth bass2Micropterus salmoidesmedium0.55.23.8
Perch2Perca fluviatilislarge0.35.24.4
Largemouth bass3Micropterus salmoidesmedium0.45.33.8
PikeEsox cisalpinus 0.45.34.1
BurbotLota lota 0.05.53.8
CharSalvelinus alpinus 0.05.74.4
Table 2. Derived trophic magnification factors (TMFs) of selected chemicals for the lake food web, including zooplankton (in bold, significant p-values < 0.05). dw: dry weight, ww: wet weight and lw: lipid content. (PCB 153: polychlorobiphenyl 153; Penta-CB: pentachlorobiphenyl; Hexa-CB: hexachlorobiphenyl; Hepta-CB: heptachlorobiphenyl; p,p′DDD: p,p′ dichlorodiphenyldichloroethane; p,p′DDT: p,p′- dichlorodiphenyltrichloroethane; PFOS: perfluorooctanesulfonate; PFDA: perfluorodecanoic acid; PFUnDA: perfluoroundecanoic acid; PFDoDA: perfluorododecanoic acid)
ChemicalSlopeTMF(95%)R2p-Value
Hg (mg kg−1 dw)0.362.3(1.45; 3.55)0.420.001
Hg (mg kg−1 ww)0.382.4(1.57; 3.61)0.490.000
PCB 153 (µg kg−1 lw)1.0010.0(3.55; 28.27)0.520.000
Penta-CB (µg kg−1 lw)0.999.7(1.05; 88.76)0.160.045
Hexa-CB (µg kg−1 lw)1.1012.5(4.14; 37.67)0.540.000
Hepta-CB (µg kg−1 lw)0.694.9(1.68; 14.36)0.320.006
p,p′-DDD (µg kg−1 lw)1.1514.1(4.78; 41.56)0.570.000
p,p′-DDT tot (µg kg−1 lw)0.472.9(1.05; 8.13)0.170.042
PFOS (µg kg−1 ww)0.483.0(1.17; 7.71)0.210.025
PFDA (µg kg−1 ww) 0.094
PFUnDA (µg kg−1 ww) 0.631
PFDoDA (µg kg−1 ww) 0.515
Table 3. Derived TMFs for a fish-only food web (in bold, significant p-values < 0.05).
ChemicalSlopeTMF(95%)R2p-Value
Hg (mg kg−1 dw)0.462.9(1.33; 6.13)0.290.01
Hg (mg kg−1 ww)0.483.0(1.47; 6.06)0.350.00
PCB 153 (µg kg−1 lw) 0.10
Penta-CB (µg kg−1 lw) 0.10
Hexa-CB (µg kg−1 lw) 0.08
Hepta-CB (µg kg−1 lw)0.877.5(1.17; 47.24)0.190.03
p,p′-DDD (µg kg−1 lw) 0.10
p,p′-DDT tot (µg kg−1 lw) 0.11
PFOS (µg kg−1 ww) 0.75
PFDA (µg kg−1 ww) 0.82
PFUnDA (µg kg−1 ww) 0.83
PFDoDA (µg kg−1 ww) 0.88
Table 4. Comparison of PFOS and Hg concentrations in fish measured and adjusted to the trophic levels (TL) by using the following TMFs: PFOS 3.0 and Hg 2.3. EQS: environmental quality standard.
Common Name TLPFOS
Measured
PFOS
TL-Adjusted
Hg
Measured
Hg
TL-Adjusted
µg kg−1 wwµg kg−1 wwµg kg−1 wwµg kg−1 ww
Zooplankton2.50.10.320.073.2
Shad 4.15.75.135.932.8
Roach14.43.42.211178.2
Chub4.52.41.554.936.7
Rudd14.60.90.568.742.4
Perch14.712.96.184.446.7
Pumpkinseed4.73.71.773.039.6
Rudd24.713.76.610357.9
European whitefish14.88.13.270.934.0
Roach24.83.81.610754.7
European whitefish25.05.41.716065.0
Ruffe5.03.61.250.120.8
Largemouth bass15.113.73.921378.6
Pikeperch5.113.33.9501191
Largemouth bass25.26.21.714350.1
Perch25.238.410.0472163
Largemouth bass35.313.83.222270.3
Northern pike5.32.90.718861.6
Burbot5.50.30.126068.2
Char5.71.70.387.619.8
Min 0.10.120.019.8
Max 38.410.0501191
Geometric Mean 3.91.611154.6
EQS 9.19.12020
N samples 20202020
N > EQS 611919
% Exceedance 3059595

