Fatigue Design of Dental Implant Assemblies: A Nominal Stress Approach


1
Mechanical Engineering Department, University of the Basque Country, 48013 Bilbao, Spain
2
R & D Department, Biotechnology Institute I mas D S.L., 01510 Miñano, Spain
*
Author to whom correspondence should be addressed.
Metals 2020, 10(6), 744; https://doi.org/10.3390/met10060744
Submission received: 3 May 2020
/
Revised: 25 May 2020
/
Accepted: 27 May 2020
/
Published: 3 June 2020
(This article belongs to the Special Issue Fatigue Limit of Metals)
Abstract
:Fatigue is the most common mechanical failure type in dental implants. ISO 14801 standardizes fatigue testing of dental implants, providing the load-life curve which is most useful for comparing the fatigue behavior of different dental implant designs. Based on it, many works were published in the dental implant literature, comparing different materials, component geometries, connection types, surface treatments, etc. These works are useful for clinicians in order to identify the best options available in the market. The present work is intended not for clinicians but for dental implant manufacturers, developing a design tool that combines Finite Element Analysis, fatigue formulation and ISO 14801 experimental tests. For that purpose, 46 experimental tests were performed on BTI INTERNA® IIPSCA4513 implants joined with INPPTU44 abutments by means of INTTUH prosthetic screws under three different tightening torque magnitudes. Then, the load case was reproduced in a FE model from where the nominal stress state in the fatigue critical section was worked out. Finally, Walker criterion was used to represent accurately the effects of mean stress and predict fatigue life of the studied dental implant assembly, which can be extended to most of the products of BTI manufacturer. By means of this tool, dental implant manufacturers will be able to identify the critical design and assembly parameters in terms of fatigue behavior, evaluate their influence in preliminary design stages and consequently design dental implants with significantly better fatigue response which in turn will reduce future clinical incidences.
1. Introduction
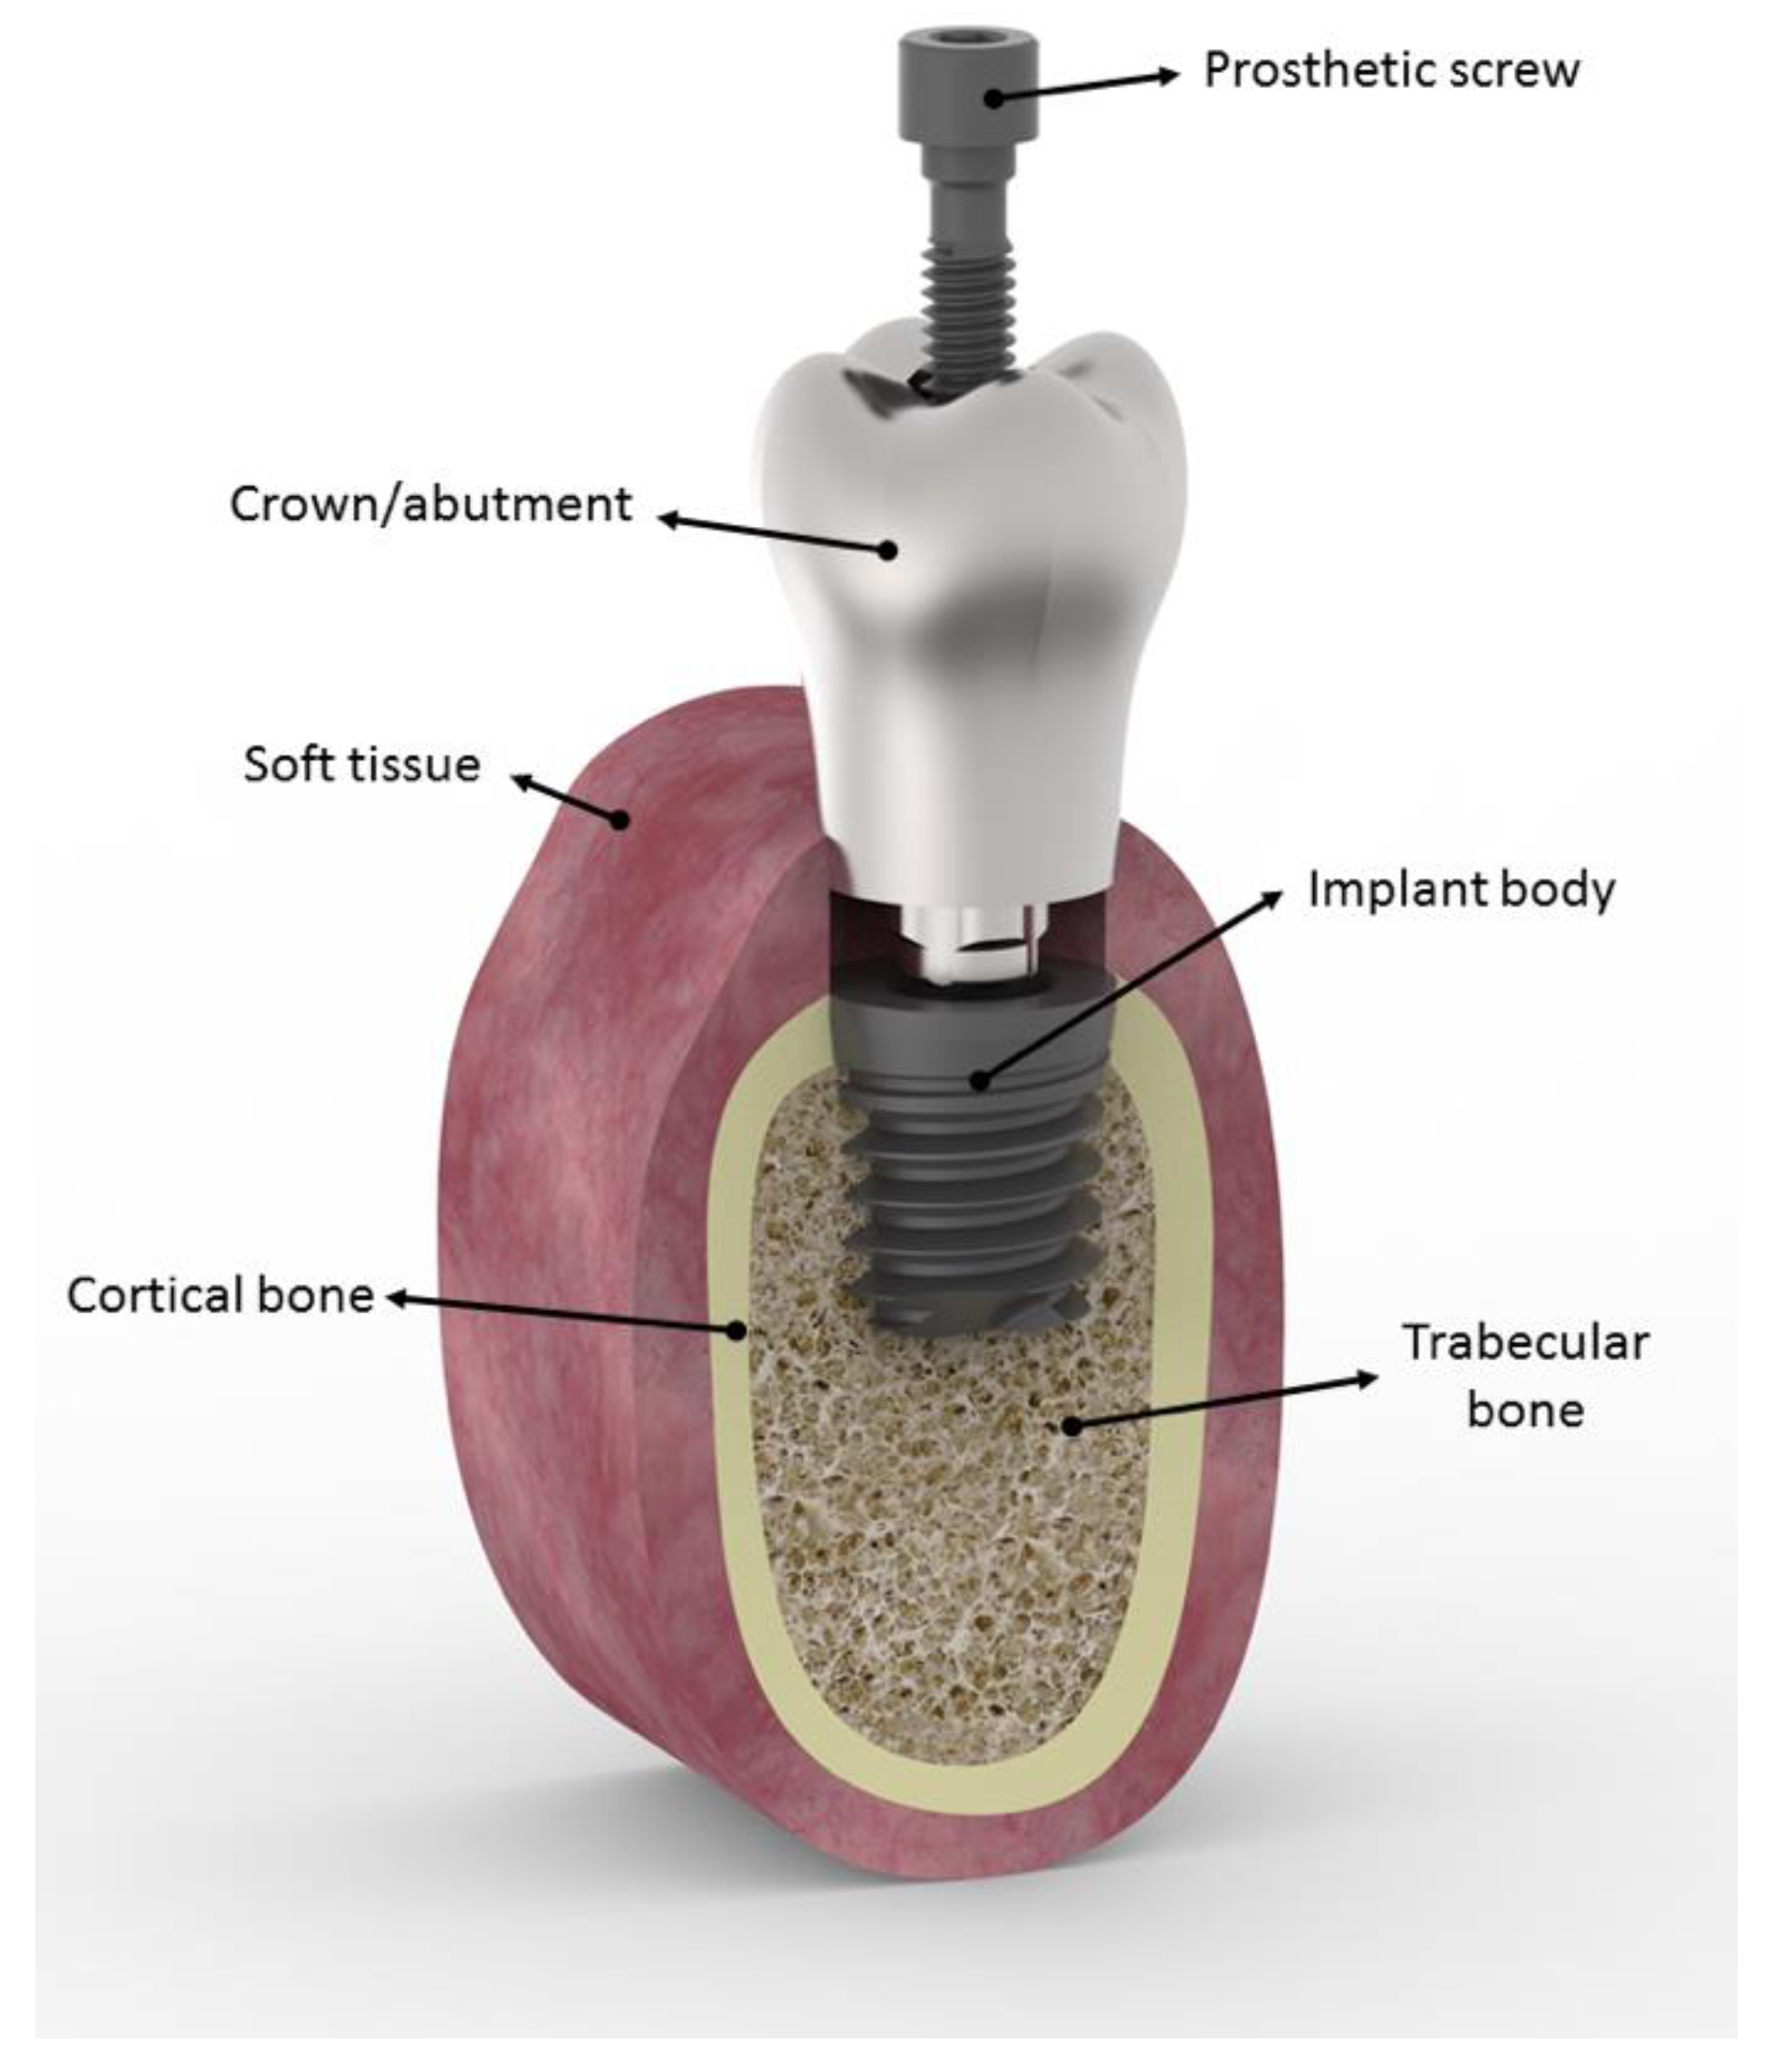
Dental implants are used to restore completely edentulous jaws as well as single missing tooth [1]. Single restorations are usually formed by a dental implant along with a prosthetic abutment, and both components are joined by means of a prosthetic screw as illustrated in Figure 1 [2]. The structural integrity of the assembly is achieved by preloading the prosthetic screw [3] with a tightening torque [4,5,6].
Dental implants are subjected to variable loads during their life span due to mastication or other reasons, as bruxism for example, which may lead to structural failure due to fatigue [7]. In fact, clinical studies report that the vast majority of implant restoration mechanical failures are caused by fatigue [8]. These failures can take place in the abutment, in the implant body or in the prosthetic screw depending on implant diameter, load case, implant position, etc. Nevertheless, screw failures are most common, being abutment or implant failures less common [9,10]. The failure section of a prosthetic screw is typically located at the root of the first engaged thread due to the stress concentration [11]. ISO 14801 Standard [12] establishes the testing conditions for dental implant fatigue tests. According to it, a cyclic load must be applied to the dental implant assembly in a direct stress fatigue test bench. The implant shall be fixed in a rigid clamping device letting the implant stick out 3 mm from that specimen holder. The load is applied with an inclination of 30° with respect to the implant axis and must vary sinusoidally between the testing load and 10% of this value (R0.1) with a frequency not higher than 15 Hz. As a result, a F-N curve that relates the applied force F with the number of cycles to failure N is obtained. As the Standard remarks, these tests do not simulate realistic in vivo conditions, where load and boundary conditions may significantly vary for each patient. Hence, F-N curves are not useful for predicting the in vivo performance of a dental implant, but for comparing dental implants of different designs, sizes, or assembly conditions in terms of fatigue response. In fact, tests performed by dental implant manufacturing companies are generally kept for design purposes, and they are seldom issued for regulatory affairs.
Based on ISO 14801 Standard tests, many publications compare the effect of different dental implant design aspects such as materials, dimensions, implant-abutment connection designs, machining processes, surface finishes, loading and tightening conditions, etc. Complementarily, some authors reproduce the tests with Finite Element models, aiming to correlate the breakage section in the experimental tests with the most stressed point in the model under maximum load; furthermore, they try to correlate the magnitude of that stress with the fatigue life obtained experimentally.
In this line, most important dental implant design aspects were analyzed. Machining processes and coatings have a major influence in fatigue behavior of dental implants and prosthetic components. Darshith et al. stated that rolled threads provide higher fatigue resistance than cut threads [13]. Gil et al. studied the effects of shot blasting on fatigue behavior of CP Titanium, concluding that this treatment leaves a layer of compressive residual stress that improves fatigue life [14]. Park et al. studied the effect of tungsten carbide carbon coating of prosthetic screws on implant preload obtaining, experimentally, higher preloads than in non-coated screws [15]. Higher preloads affect positively fatigue behavior of dental implants as stated in [16,17,18].
Implant-abutment connections have been widely studied. It is a consensus that internal connections behave better than external ones [19]. Yamaguchi et al. noticed greater fatigue reliability in internal than in external connections in their experimental and Finite Element Analyses (FEA) [20]. Khraisat et al. stated that fatigue strength was higher in internal connections compared to the external ones [21]. Bicudo et al. noticed better fatigue performance in taper implant systems than external ones via experimental tests and FEA [22].
Lee et al. analyzed in their review the effect of size and shape on implant success rates concluding that from a mechanical point of view, wider implants have a higher resistance to fracture. Nevertheless, the relationship between implant length and success may not exist, especially over 13 mm [23]. Shemtov-Yona et al. and Fan et al. also emphasized the importance of implant diameter on fatigue behavior [24,25].
Dental implants are commonly made of titanium alloys. In this sense, several publications characterize experimentally the endurance limit [26], the effect of the mean stress [27,28] and the effect of notches [29,30,31,32,33]. Other materials used in dental implants such as zirconia, cobalt alloys or stainless steel were also studied [34,35,36].
Some publications study dental implant fatigue from a probabilistic approach [11,37,38], considering the randomness of some variables such as defects in dental implant and different load conditions that vary depending on the patient. Nevertheless, no publications were found developing a design tool to evaluate the effect of different dental implant design aspects at same loading conditions (ISO 14801) using deterministic classical fatigue analysis methods.
As mentioned above, papers in specialized literature generally provide straightforward clinical conclusions obtained from either experimental tests or, less commonly, FEA. Of course, this information is very useful for clinicians (implant users), as it provides them guidelines in order to choose the best products in terms of materials, geometries, surface treatments, etcetera, available in the market to reduce clinical incidences related to fatigue failure. However, dental implant manufacturers are interested in works that study and explain fatigue failure in dental implants from a mechanical engineering rather than clinical point of view. In this sense, this work presents a methodology, based on Finite Element Analysis, classical fatigue formulation and experimental tests, to characterize the fatigue behavior of the prosthetic screw in dental implants.
2. Materials and Methods
As mentioned in the introduction, the proposed methodology combines FEA, classical fatigue formulation, and experimental tests. Experimental tests according to ISO Standard provided the relationship between the applied load and the number of cycles to failure. Then, the load case is reproduced in a Finite Element model of the dental implant, in order to obtain the variable forces acting on the prosthetic screw during the test, from where the nominal stress state of the critical section will be calculated. Finally, using classical fatigue formulation, and combining the numerical (FE) and experimental results, the fatigue behavior of the screw will be conveniently deducted. In this section, the experimental tests and the FE model are described.
2.1. Experimental Tests
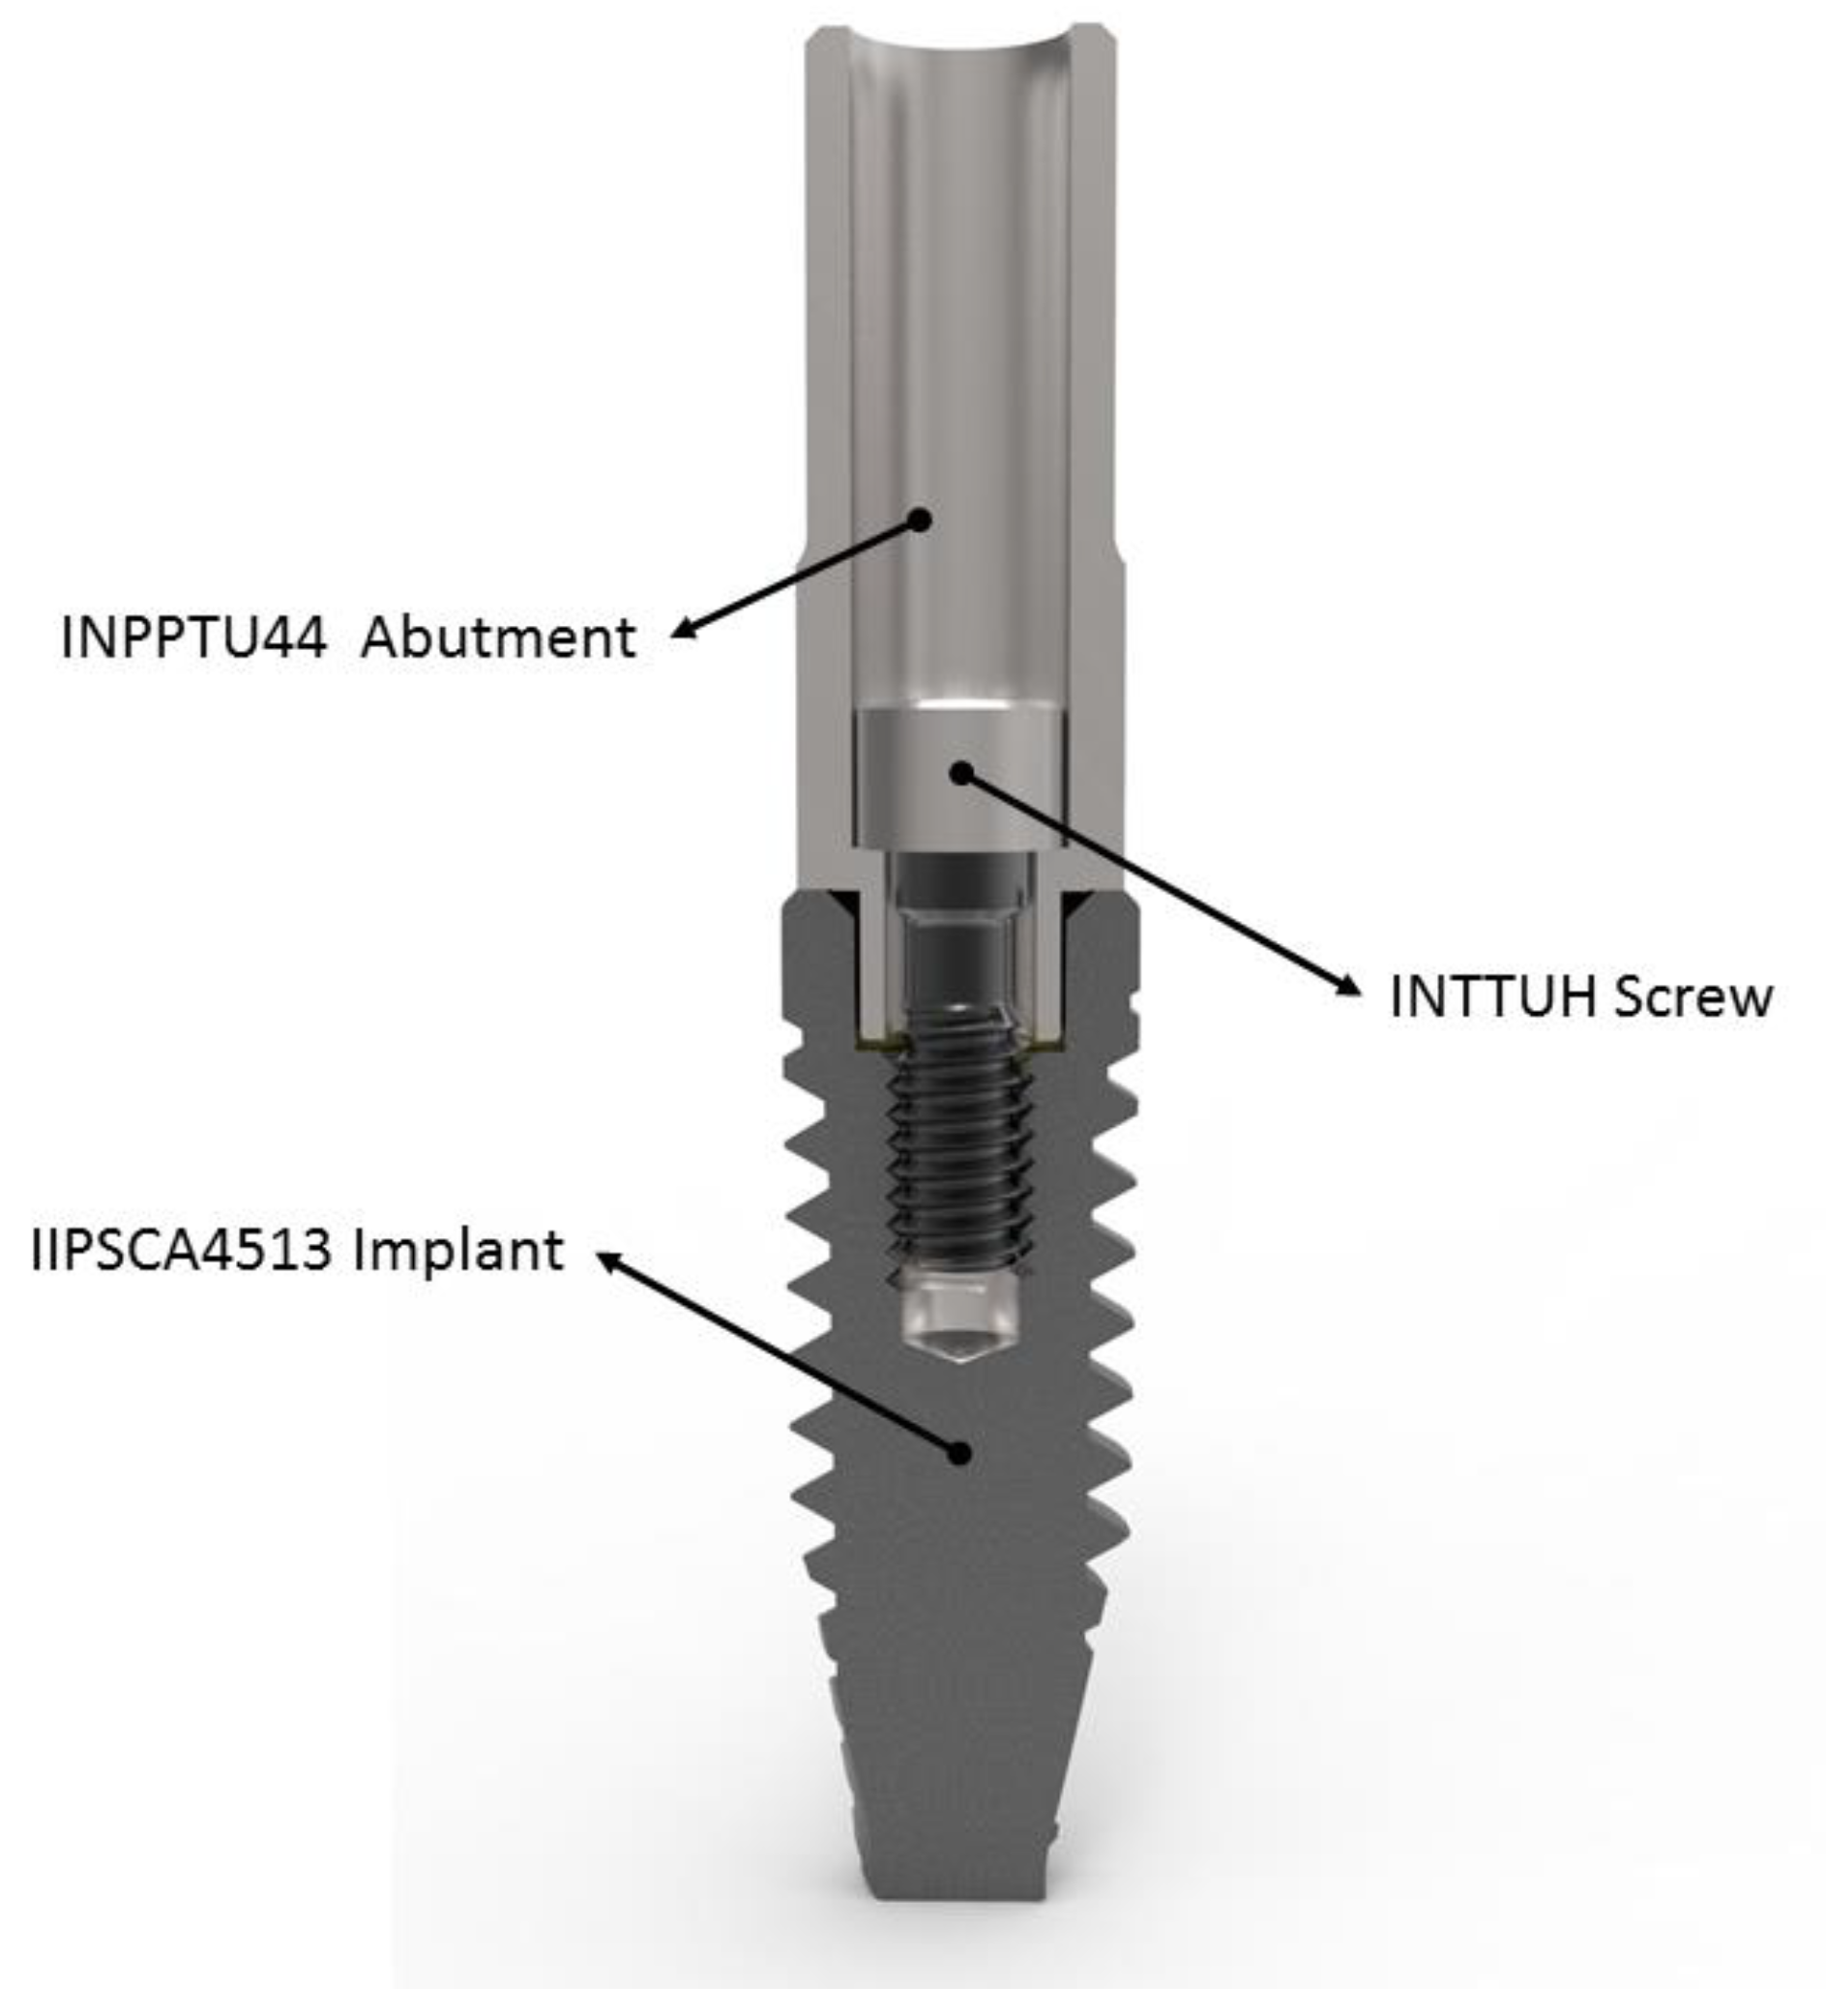
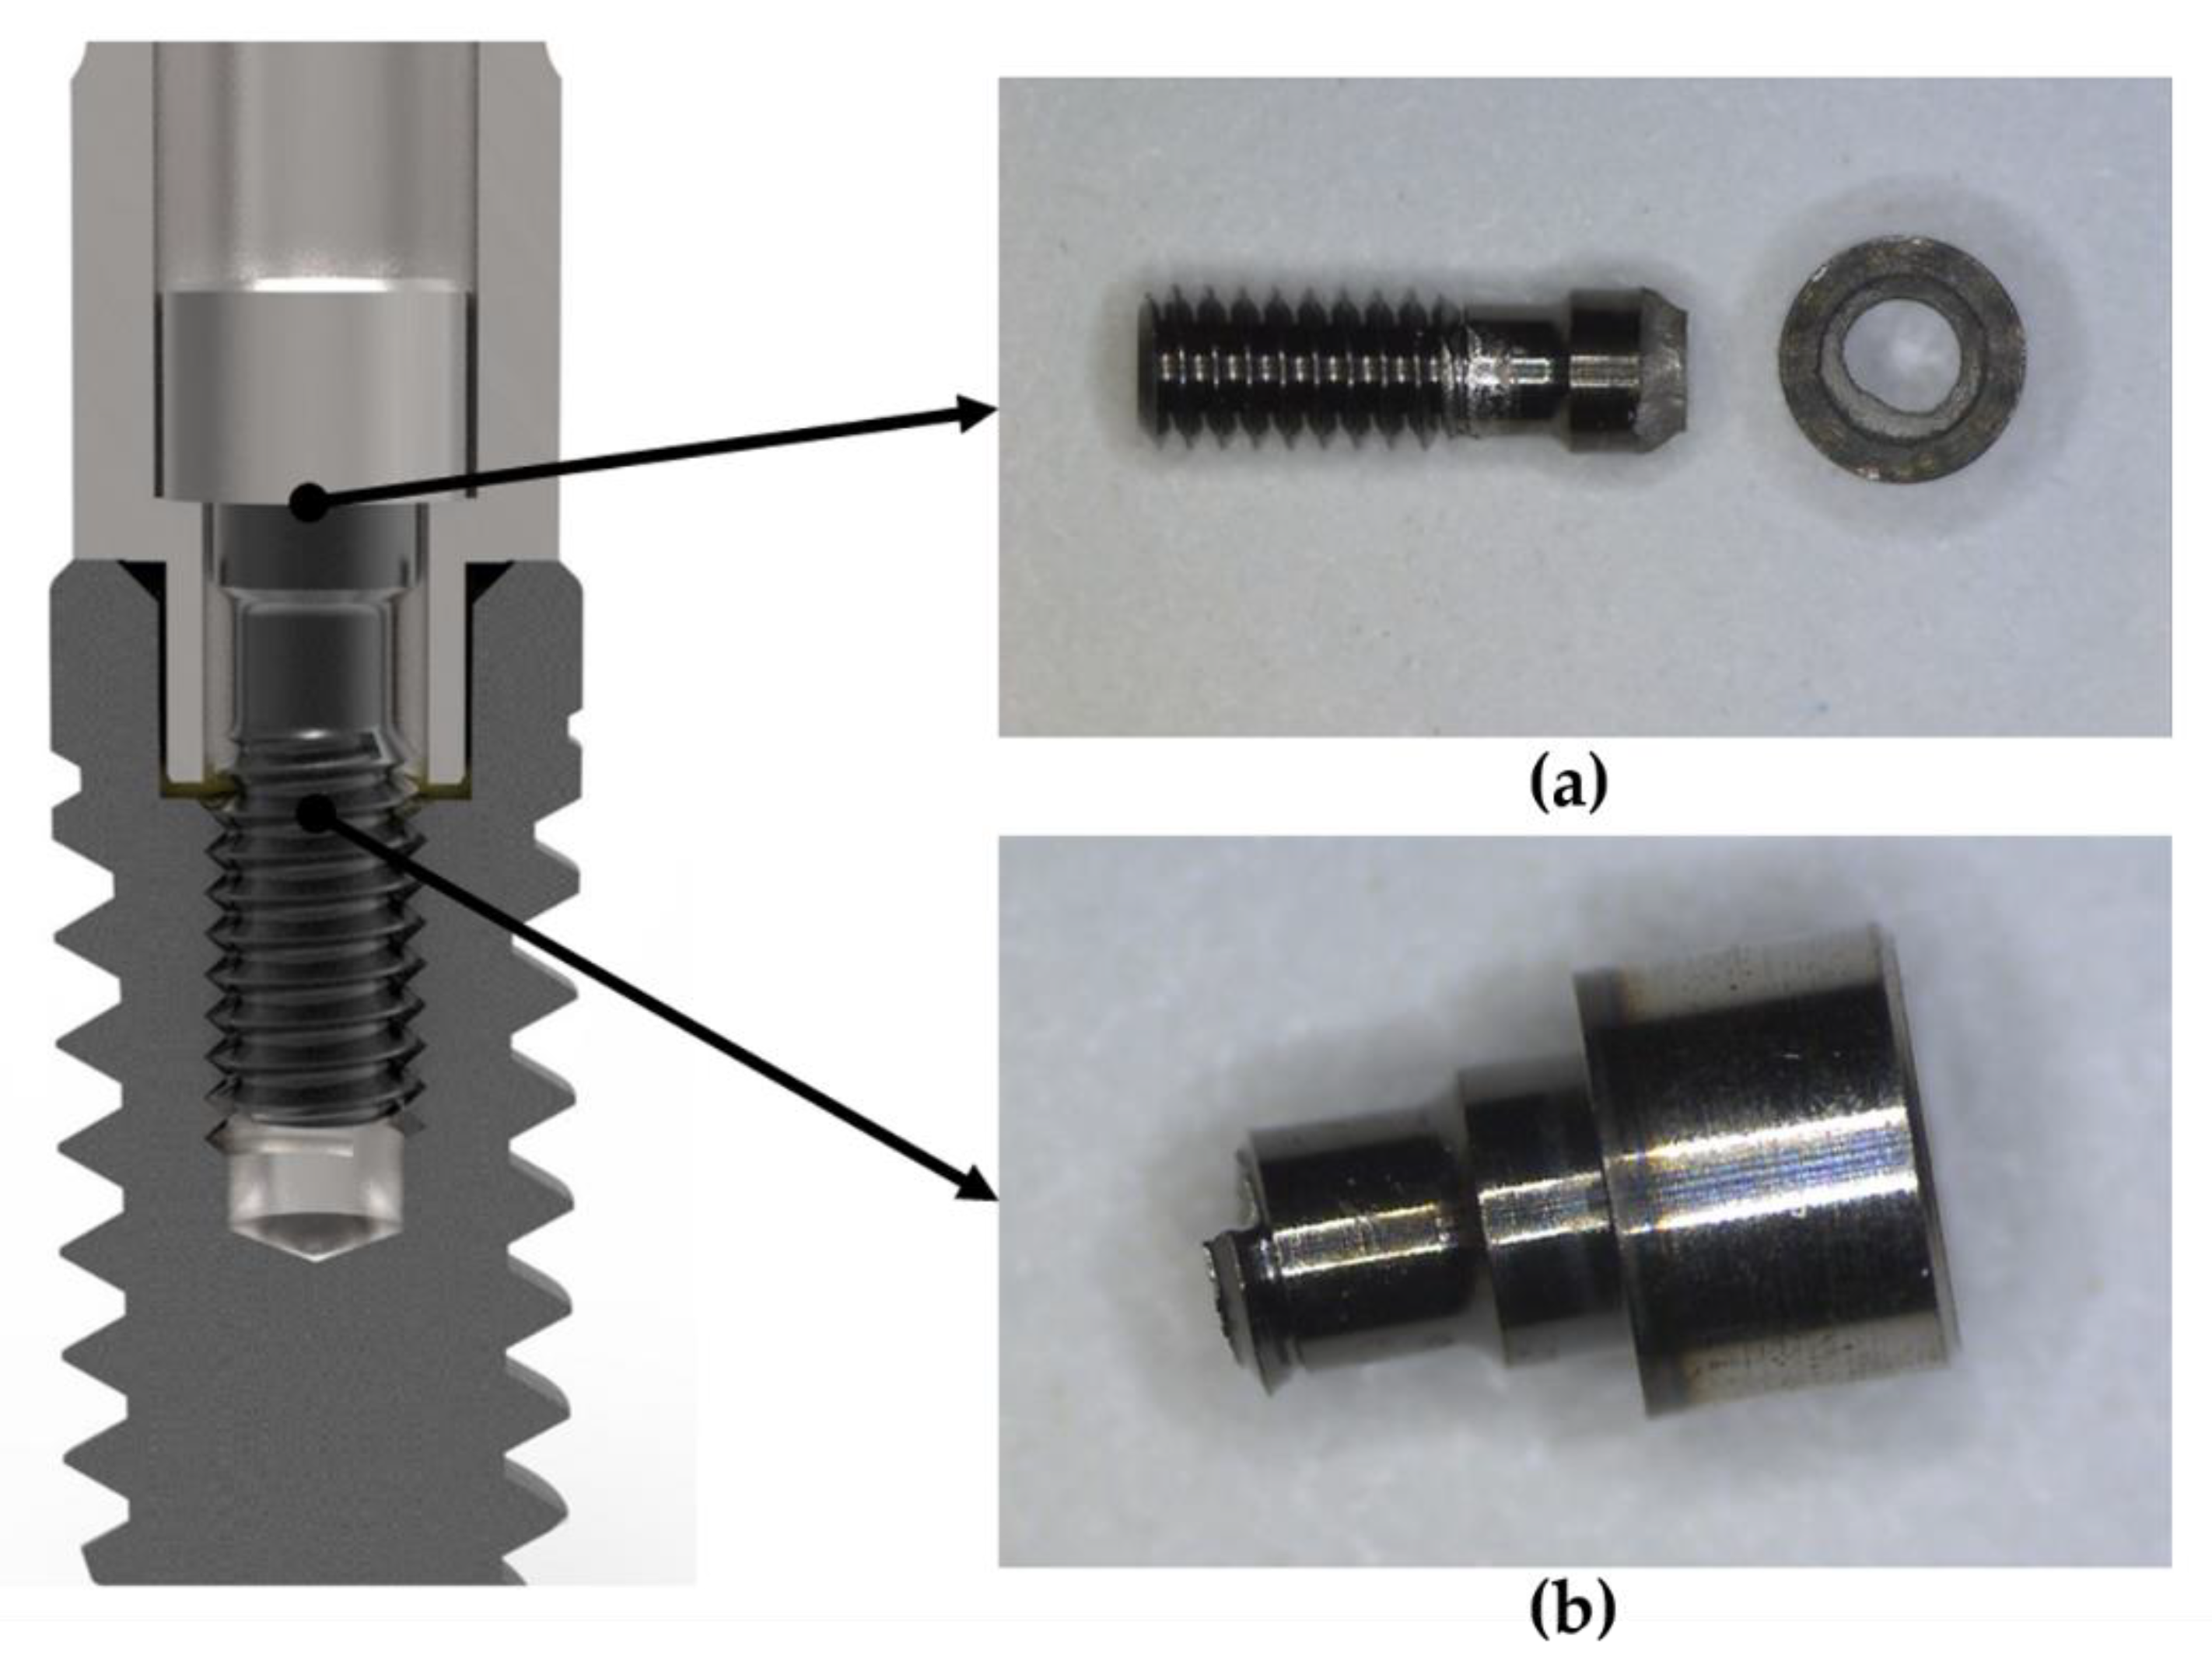
A BTI INTERNA® IIPSCA4513 implant was joined with a INPPTU44 abutment by means of a INTTUH prosthetic screw (see Figure 2), all of them from the product catalog of BTI (Biotechnology Institute S.L., Vitoria, Spain). Three different screw tightening torque magnitudes were tested: 150, 250 and 350 Nmm, being the last one the value recommended by the manufacturer (BTI). The tests were carried out in a direct stress fatigue test bench E 3000 Electroplus (Instron, Barcelona, Spain) (see Figure 3) measuring the applied force with a DYNACELLTM 2527-153 load cell (±5 kN load range) and following the ISO 14801 Standard requirements described in the introduction section: load (F) inclination of 30°, load ratio R0.1, and maximum frequency of 15 Hz. As a result, the curve that relates the applied force F with the number of cycles to failure N was obtained (from now on, F-N curve) for each tightening torque, from a total of 46 experimental tests, as it will be later described.
2.2. Finite Element Model
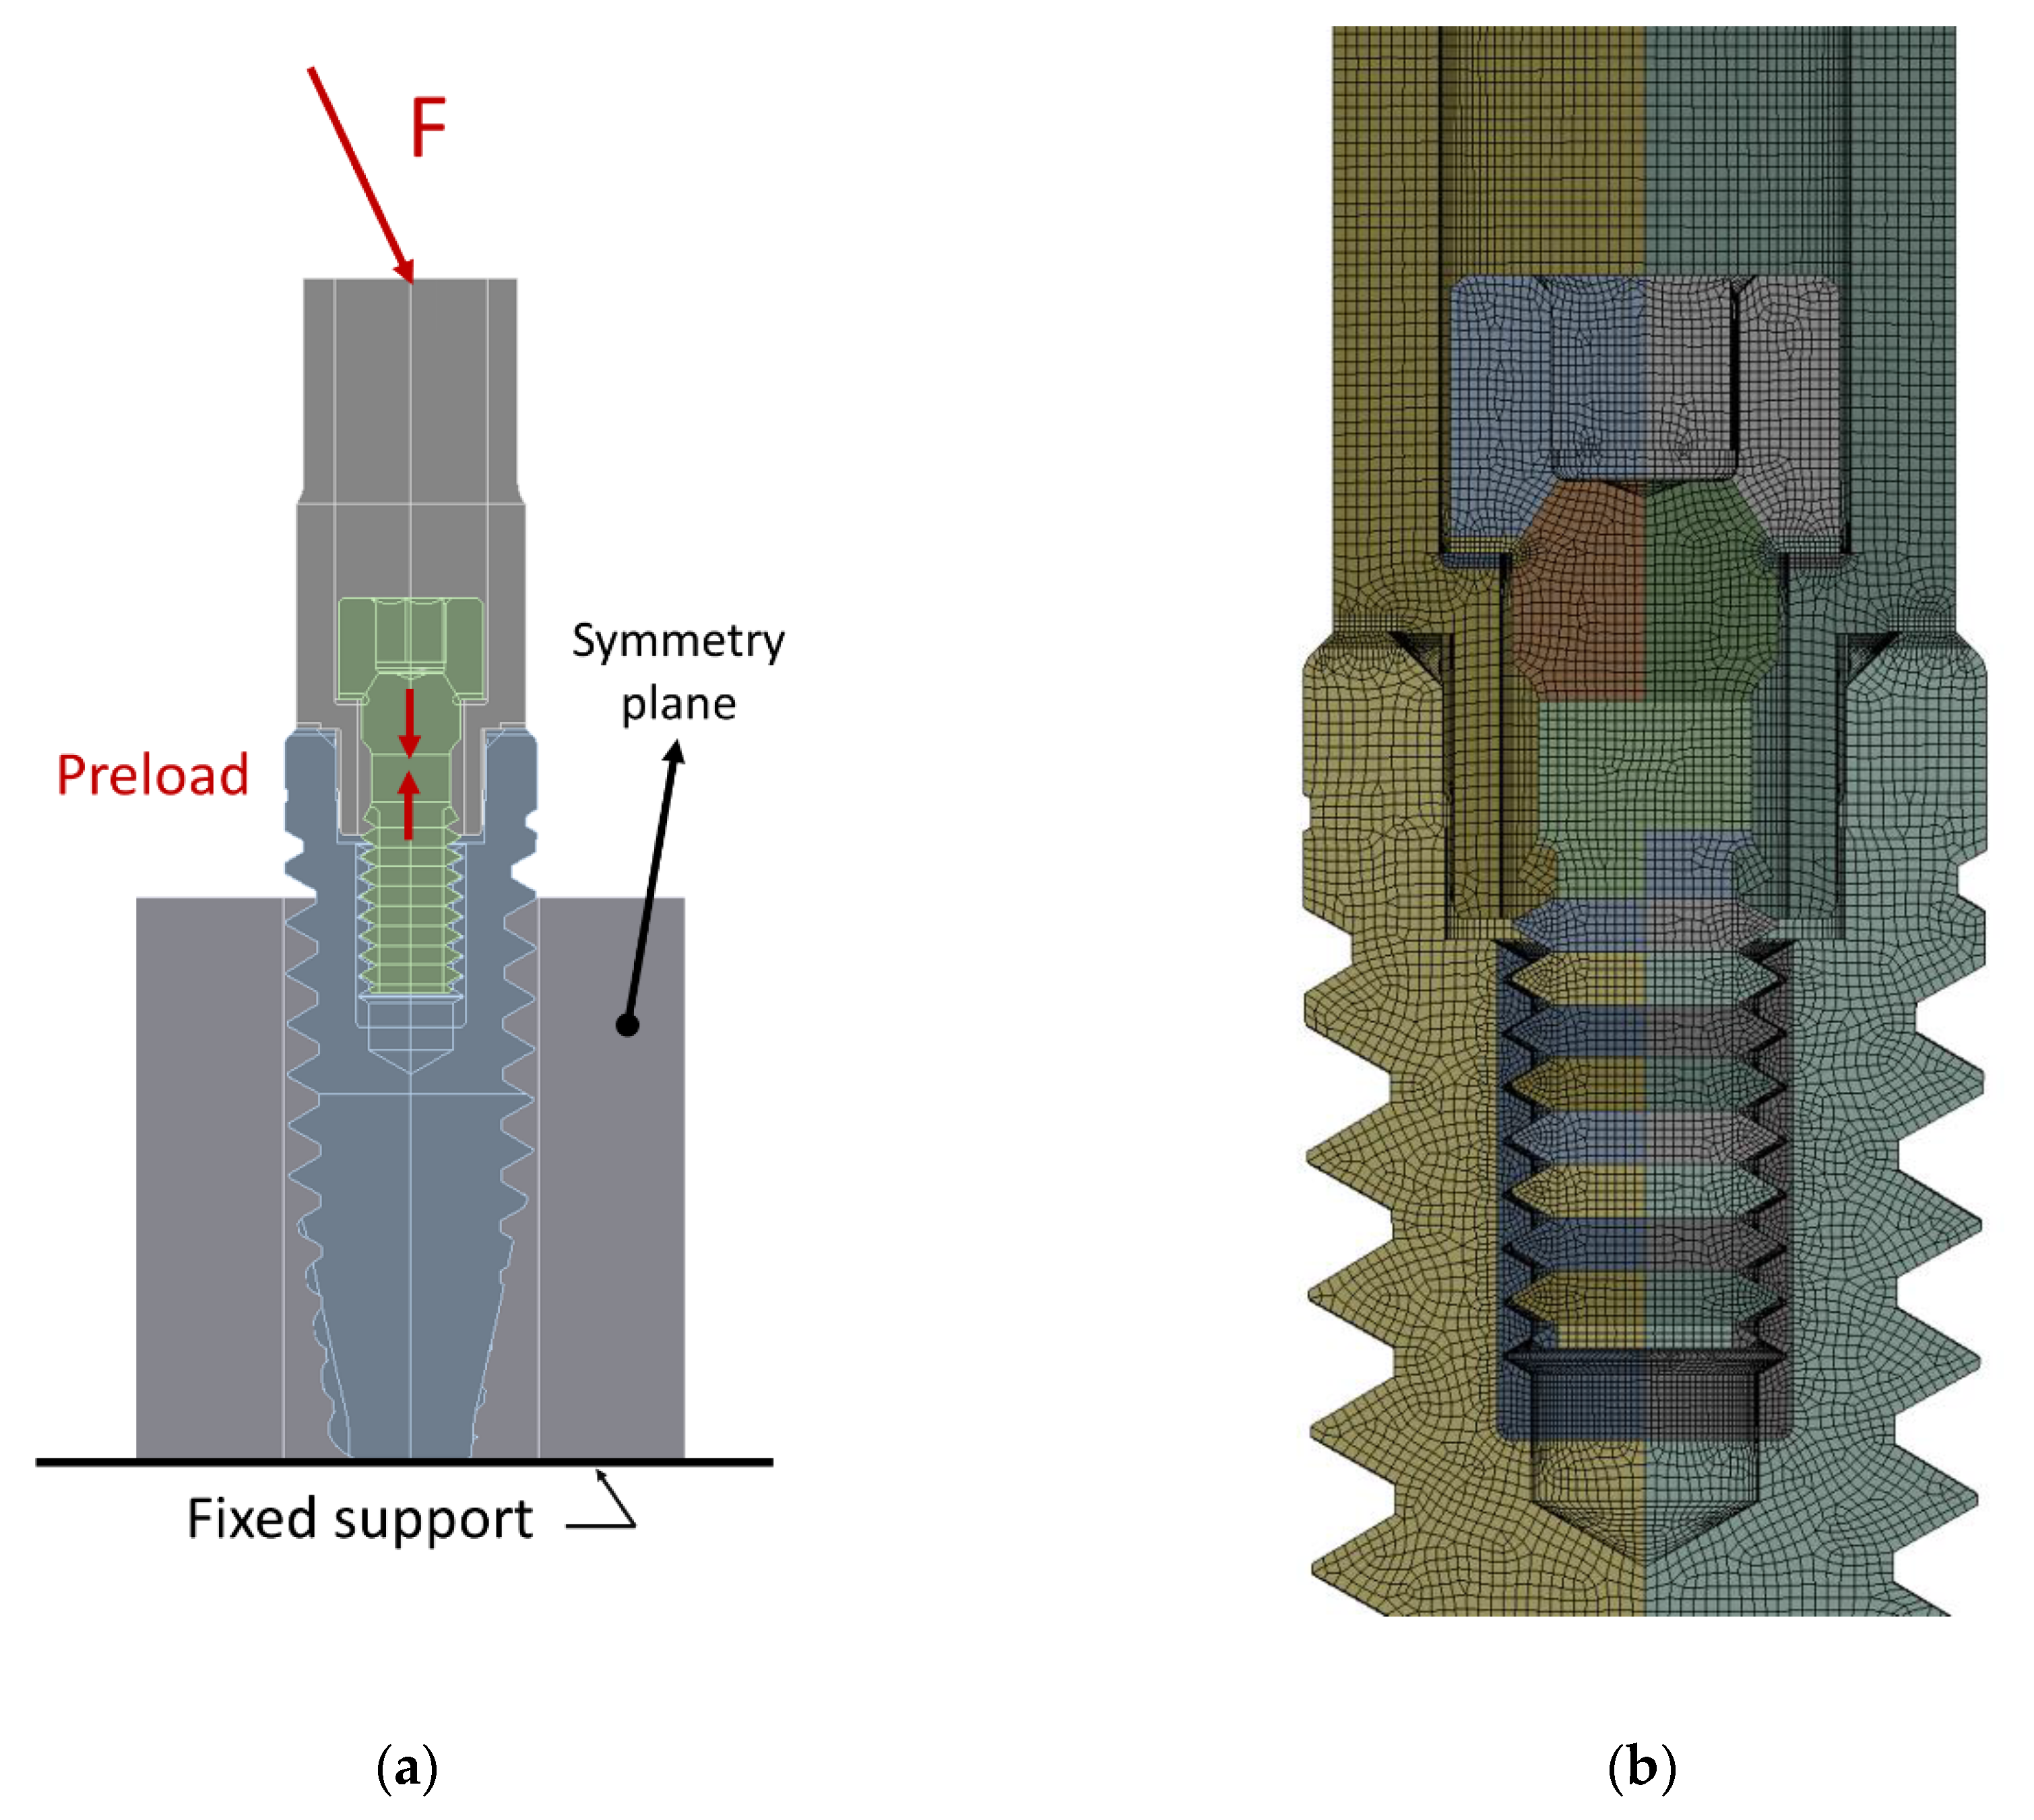
Figure 4a shows the FE model of the dental implant under study (Figure 2), built in Ansys Workbench® 19 R1 (Ansys Iberia S.L., Madrid, Spain). To reproduce the experimental test conditions, the load F was applied with 30° of inclination at 8mm from the implant-abutment contact surface, while the implant was held in a specimen holder. Taking advantage of the symmetry, only half dental implant assembly was modeled, and accordingly half the preload and the external load were applied to the model. Even though the screw thread is helical, comparing the variable forces in the screw it was verified that the screw response was almost identical using cilindrical threads (the error between the forces of both models was smaller than 3.5%). Figure 4b illustrates the mesh of the model, with a total of 1.6M DoF. Implant and abutment are made of grade 4 commercially pure titanium (Ti CP4) and the prosthetic screw is made of Ti6Al4V ELI (Ti Gr5). Chemical composition of both materials is described in Table 1. Both materials were modeled as linear elastic, with E = 103 GPa, ν = 0.35 for CP4 and ν = 0.31 for GR5.
FE analyses were composed of two load steps. First, the screw is tightened to the axial preload force that corresponds to its tightening torque by means of a pretension section; as mentioned, three different torque values were tested: 150, 250 and 350 Nmm. The preload values that correspond to these tightening torques were obtained from Motosh equation [3,39]:
where Fp is the screw preload, TT is the screw tightening torque, μh and μt are respectively the friction coefficients of the screw head and thread contacts, α is the half-angle of the thread profile, β is the helix angle, and finally rh and rt are respectively the screw head and thread mean contact radii. For the screw under study, α = 30°, β = 5.75°, rh = 1.115 mm, rt = 0.81 mm. The friction coefficients μh and μt were experimentally measured in a tribometer, as explained in the following section. These friction coefficient values are necessary not only as input data of Equation (1), but also to define the frictional contacts in the FE model. Apart from these two parameters (screw head-abutment with μh and screw thread-implant with μt), a third value was measured to simulate the implant-abutment contact in the FE model.
In the second load step, the load F with an inclination of 30° was applied to the abutment. As a result of this load, the axial load of the screw varies, and transverse and bending forces appear. These forces in the screw will be obtained as the contact reactions in the screw-abutment contact surface (see Figure 4), using the force reaction tool of Ansys Workbench R19®. Later, they will be used to calculate the nominal variable stresses in the first engaged thread, needed to perform the subsequent fatigue analysis in the critical section of the screw.
2.3. Measurement of the Friction Coefficients
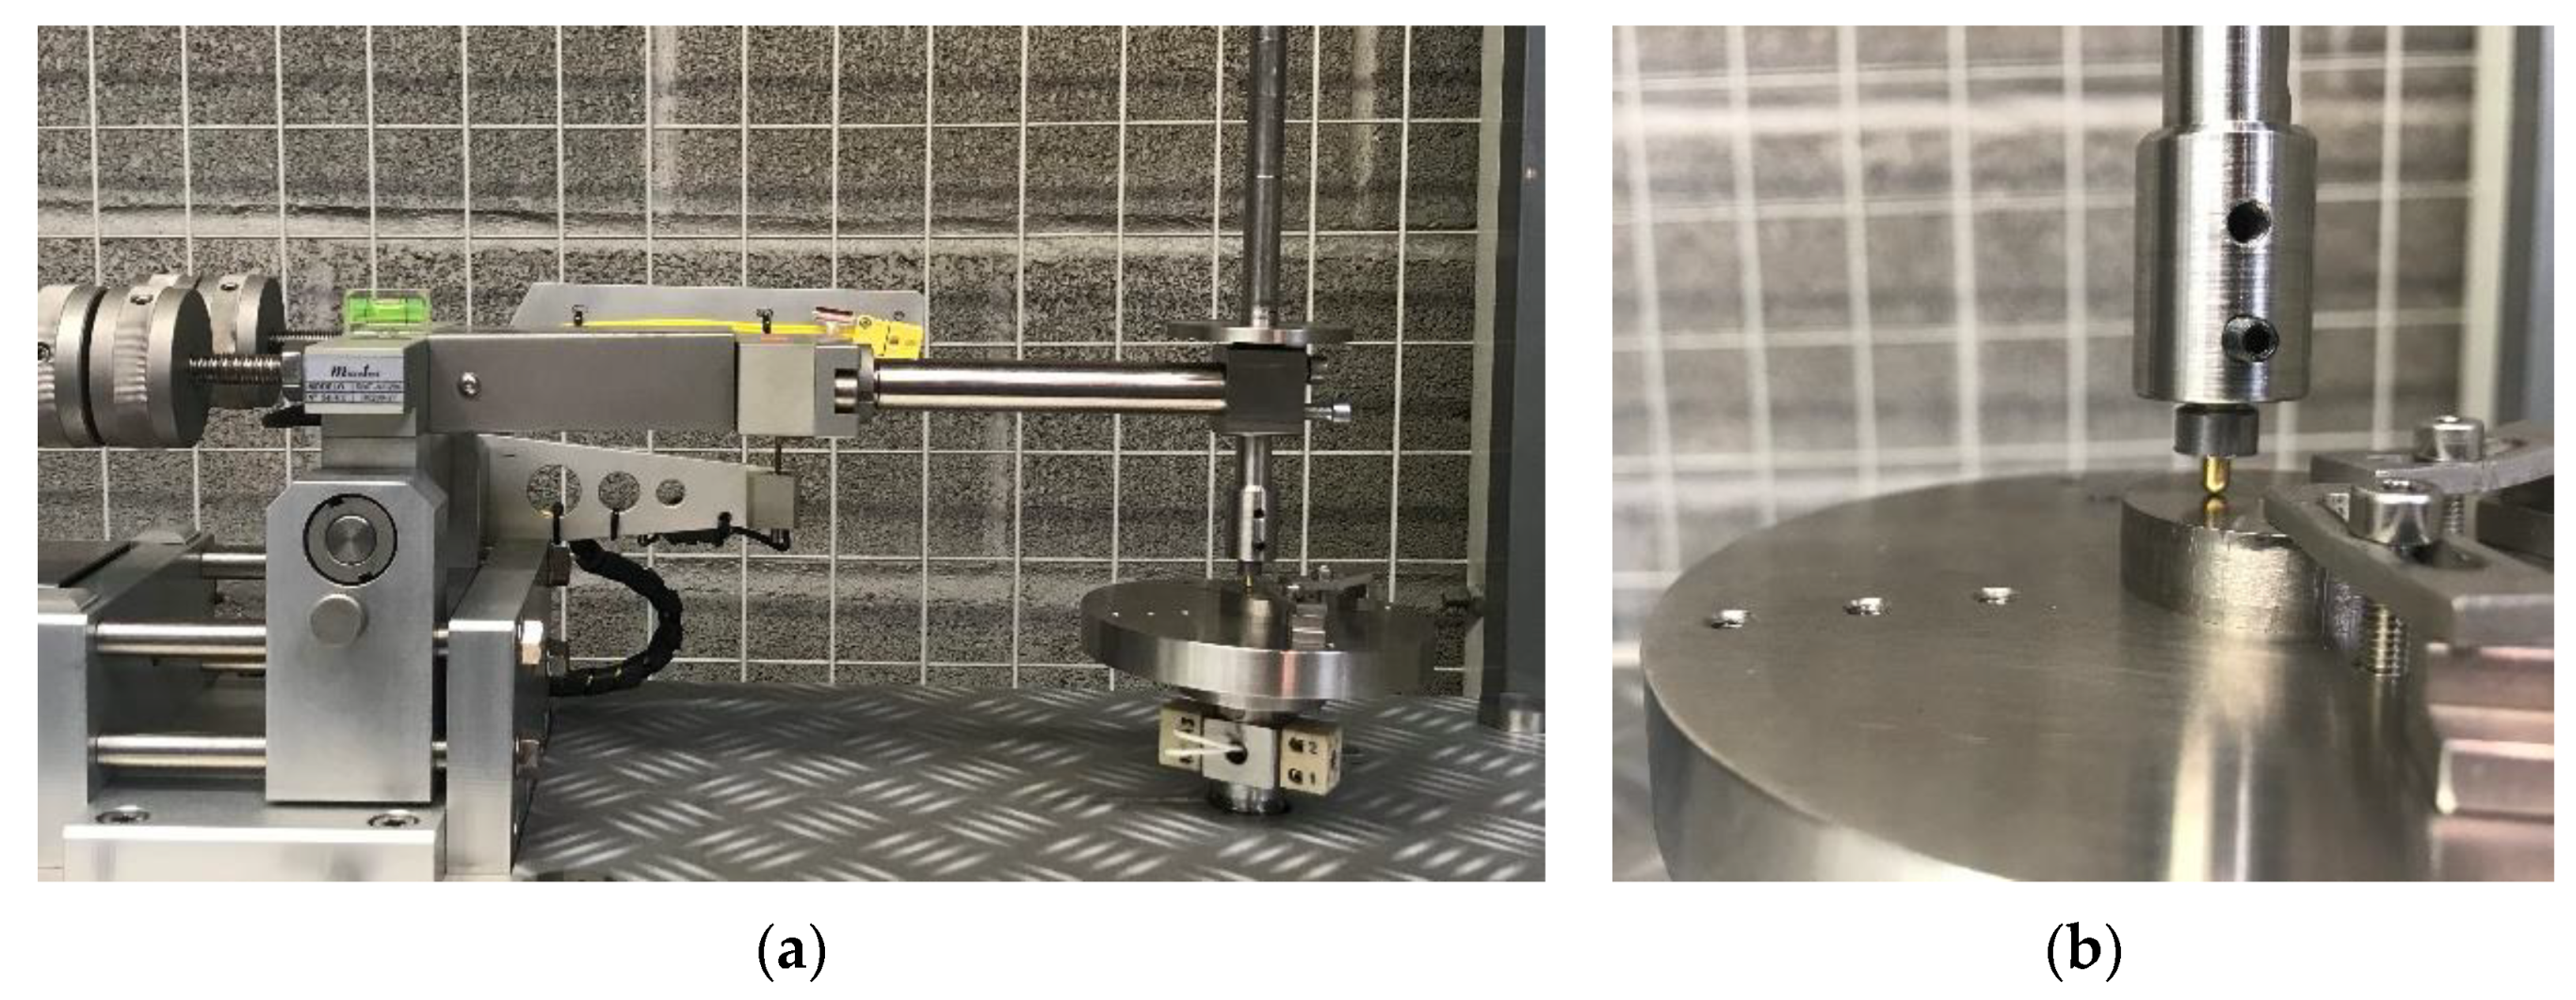
The values for the friction coefficients μh and μt defined in the previous section were measured in a MicroTest SMT-A/0200 pin-on-disk tribometer (Microtest S.A., Madrid, Spain), shown in Figure 5a. In addition to the contact between the prosthetic screw and the implant, friction coefficient between the abutment and the implant was also measured. As shown in Figure 5b, the end of the pin used is rounded (3 mm diameter). 1 N load was applied on the pin in order to obtain a pressure magnitude (according to formulation in [40]) similar to the one that the prostethic components suffer according to the FE results obtained in this work. Finally, 1 rpm rotating speed was set in the test because low friction speed is expected in dental implant assemblies during assembly and chewing processes.
3. Results and Discussion
A total of 46 experimental fatigue tests of dental implants were carried out using three different screw tightening torques: 150, 250 and 350 Nmm. The last one is the value recommended by the manufacturer (BTI), whereas the other two values would correspond to insufficient tightening torques.
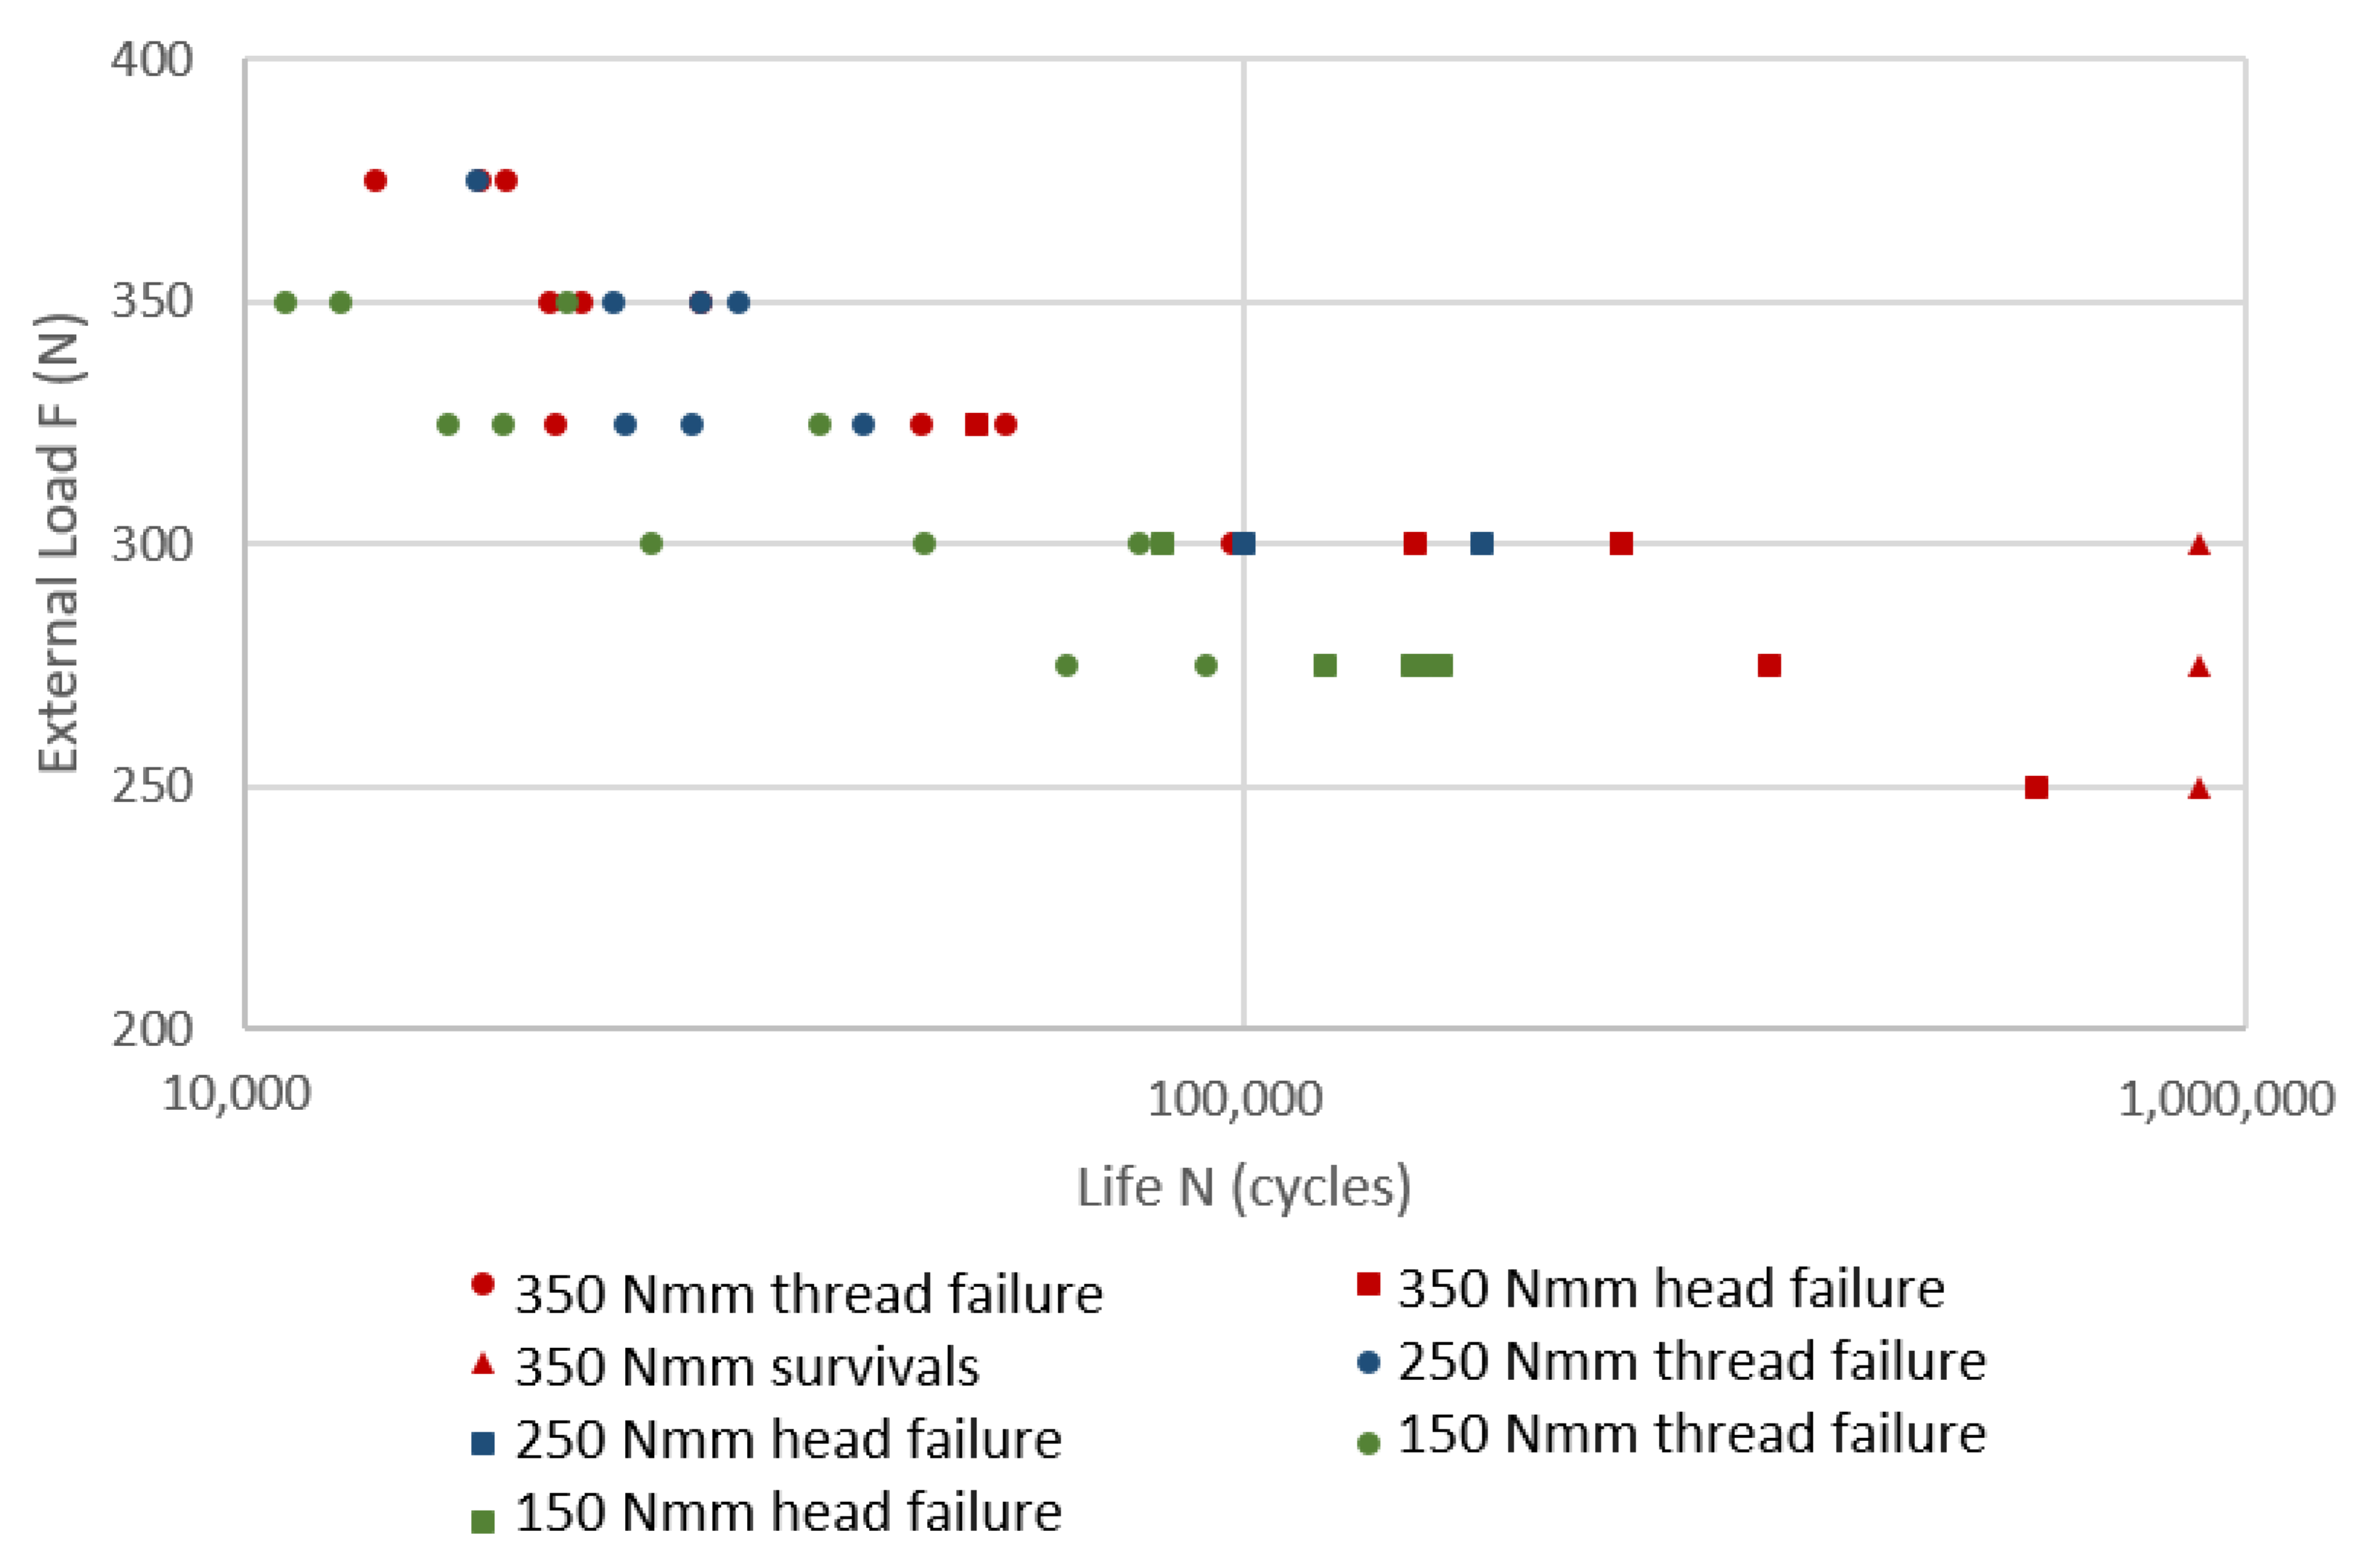
Figure 6 shows the F-N results of these tests, showing the number of cycles to fatigue failure N of the dental implants under different load magnitudes F. It can be appreciated that 30 failures took place in the screw thread section, 13 in the screw head and three survivals (run-out of five million cycles). Figure 7 shows both failure sections, in the threads and in the head. It was observed that the failures in the screw head started in the hole where the torque wrench is inserted to apply the tightening torque. Nevertheless, presently the manufacturing company uses an alternative manufacturing process (not used in the screws tested in this work) with which fatigue failures in this screw head section seldom occur. Thus, screw head failures can be easily avoidable (in design or manufacturing stages) and therefore are much less common than screw thread failures as dental implant literature points out, so this work will focus exclusively on the fatigue failure of the screw thread section. Additionally, the runouts indicate that the tested load level is not far from the fatigue limit, so it may be considered that the experimental tests are representative of the finite life of the screw, and consequently of the whole dental implant assembly under study.
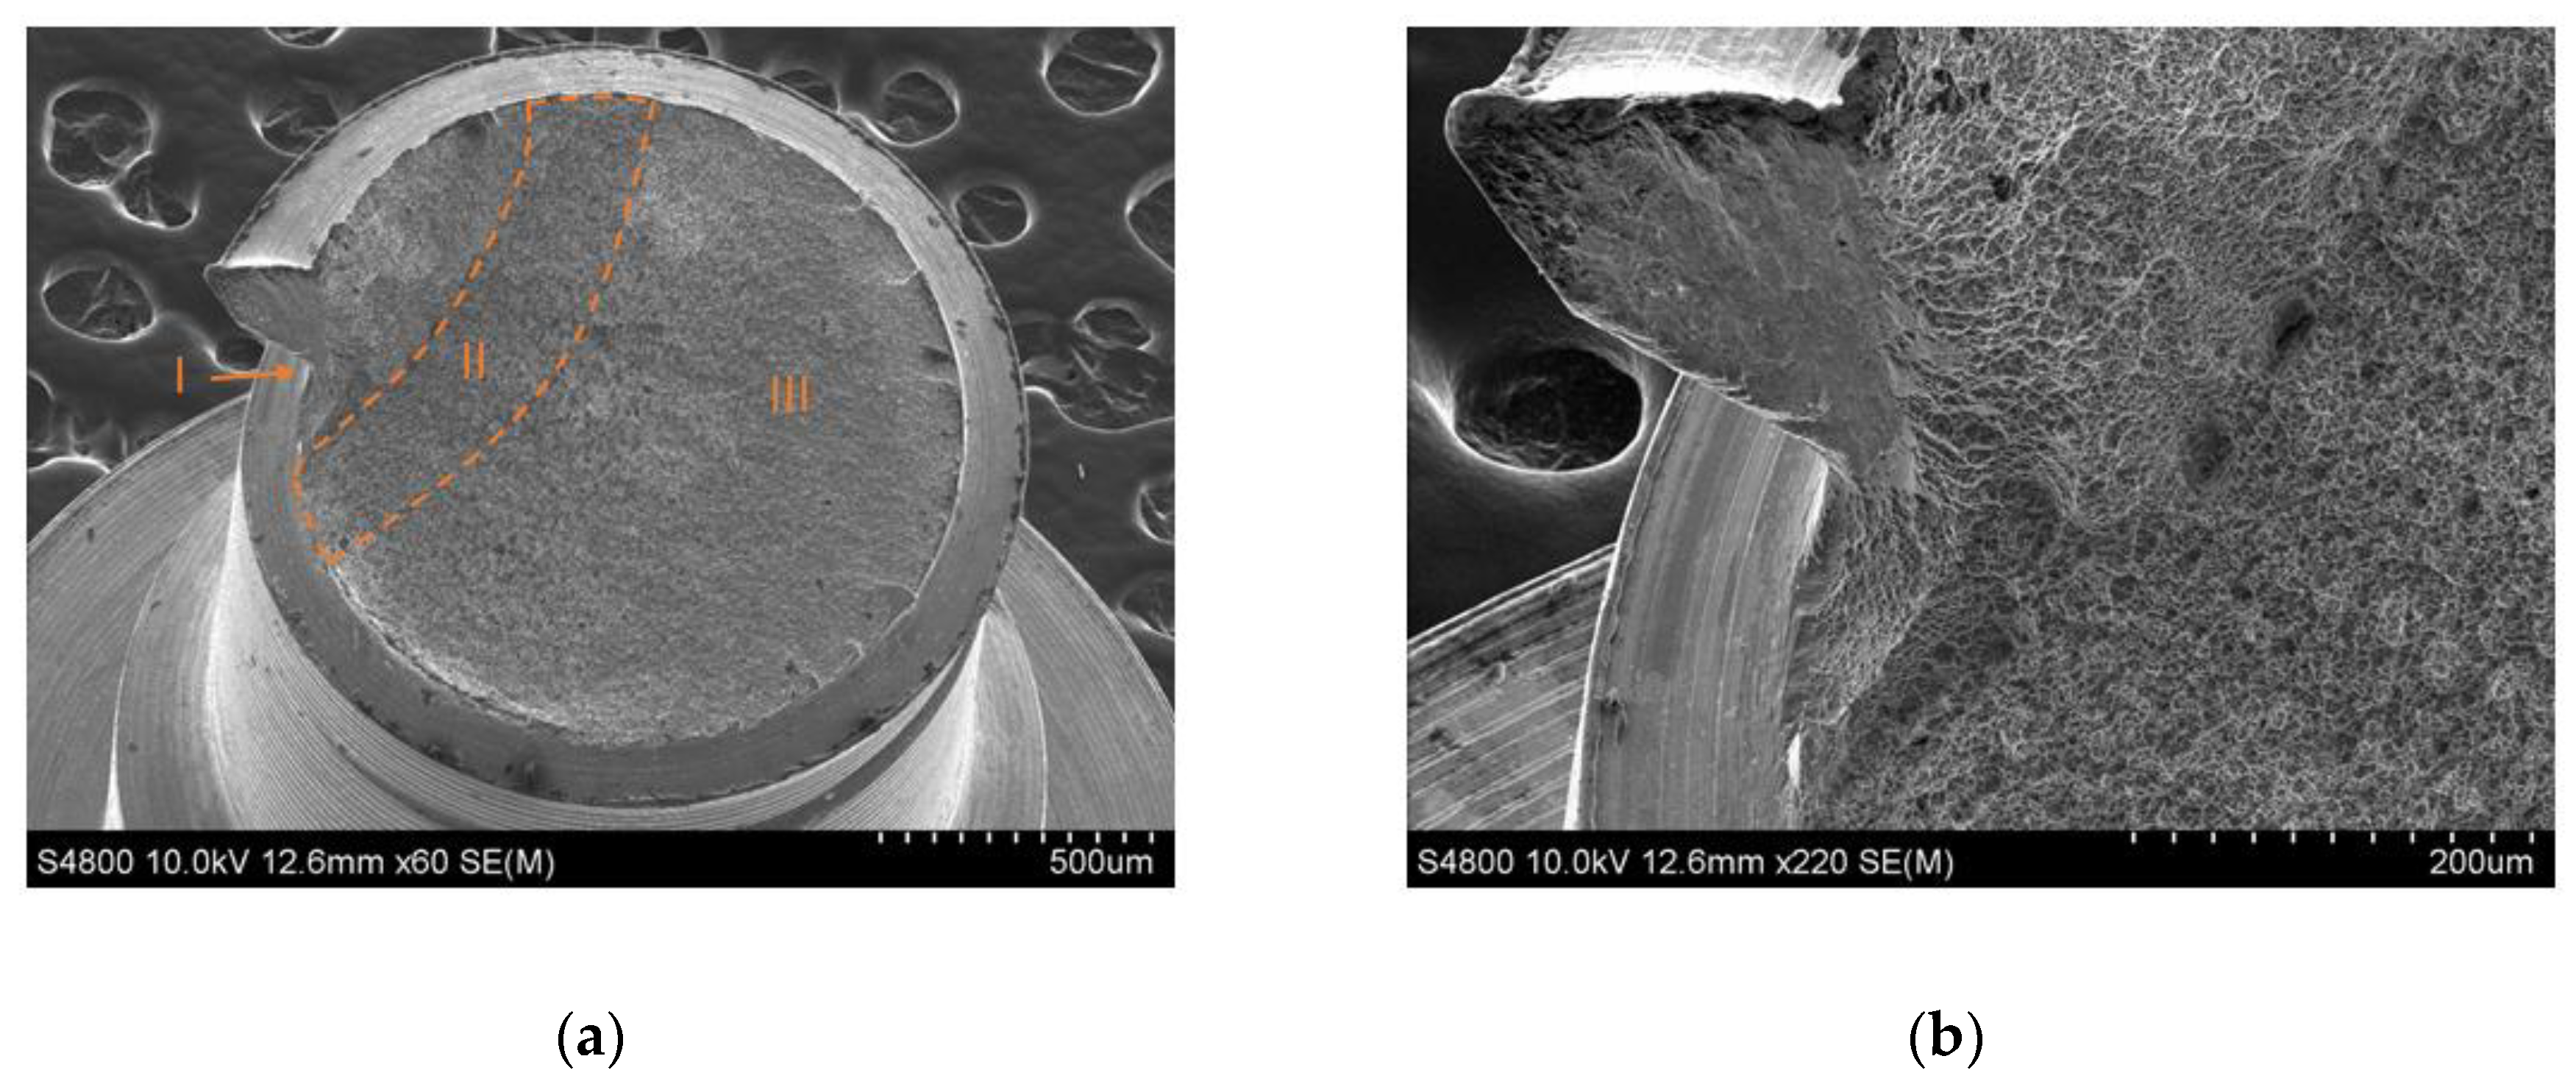
Thus, focusing on the screw thread section, Figure 8 shows the breakage section of one specimen. Different fractographic zones may be appreciated in Figure 8a. It may be appreciated that cracks are initiated at the thread valley (zone I) due to stress concentration. Cracks propagate in zone II until the remaining section cannot statically support the loads leading to static failure (zone III). In all the experimental tests, breakage section was placed at the first thread of the screw, at 2.185 mm ± 0.175 mm from the screw head obtained. That distance was obtained from 27 measurements made with a Mitutoyo AOS Absolute Digimatic CD-15AX Caliper. The dispersion was attributed to the fact that the angular position of the screw with respect to the external loading direction is random in the experimental tests, and additionally a larger tightening torque involves a larger penetration of the threaded part of the screw into the implant because a larger rotation must be applied to the screw.
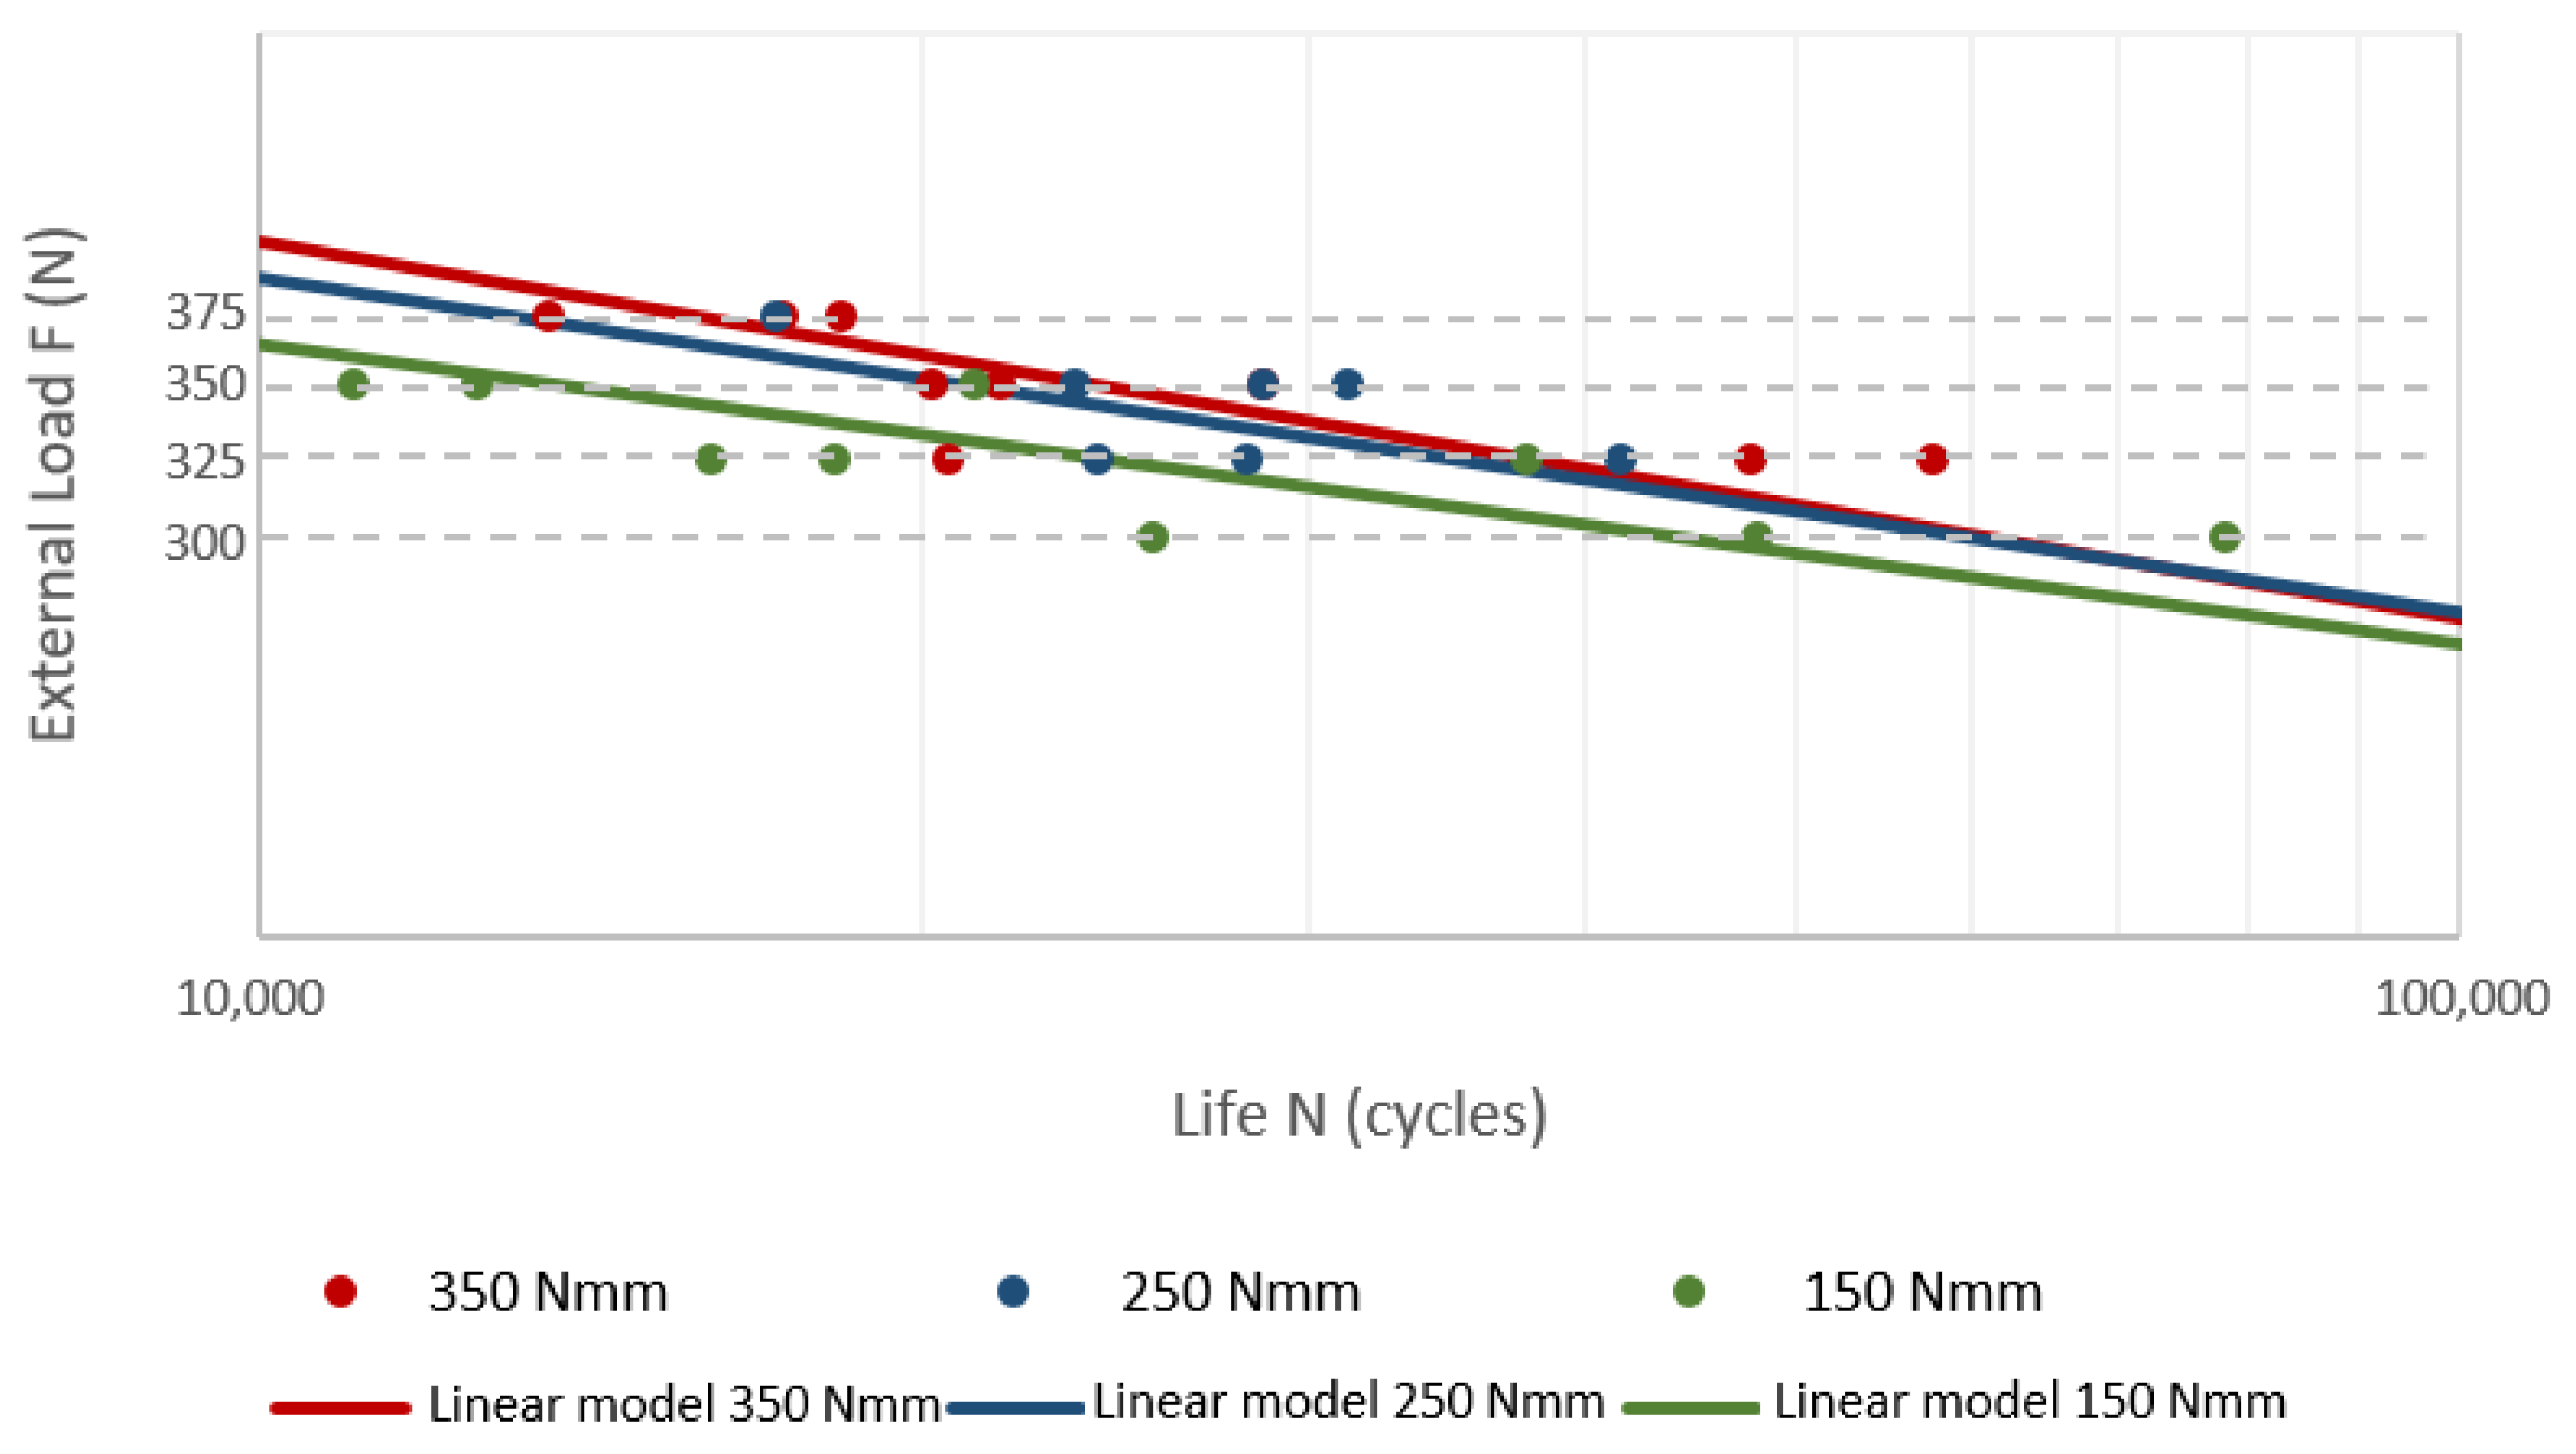
Figure 9 shows the F-N curves for the three different tightening torques tested considering only the screw thread failures of Figure 6, i.e., excluding screw head failures and survivals. Along with the experimental points, the linear models calculated according ASTM E-739 Standard [41] are also plotted. Least squares method were used to fit experimental data and the corresponding coefficients of determination (R2) for the F-N semilog curves are: 0.61 (150 Nmm), 0.64 (250 Nmm) and 0.60 (350 Nmm). The straightforward implication of these F-N results is that an insufficient tightening torque is harmful in terms of dental implant fatigue life, as it was also concluded by [16,17,18].
Additionally, as previously explained, FE analyses were performed to assess force and moment reactions in the screw head. For such purpose, Table 2 shows the friction coefficients experimentally measured in the tribometer of Figure 5 being 0.17 the friction coefficient for the screw-implant and screw-abutment contacts (μh = μt = 0.17), and 0.21 for the implant-abutment contact surface. The values are smaller than those found in the literature [42] because in this case the prosthetic screw is coated with a tungsten carbide coating and the platform of the implant is anodized. With these values of μh and μt, Equation (1) provides the preload values Fp listed in Table 3 for each tightening torque . After introducing these values as input data in the FE model, the analyses are carried out as explained in the Materials and Methods section.
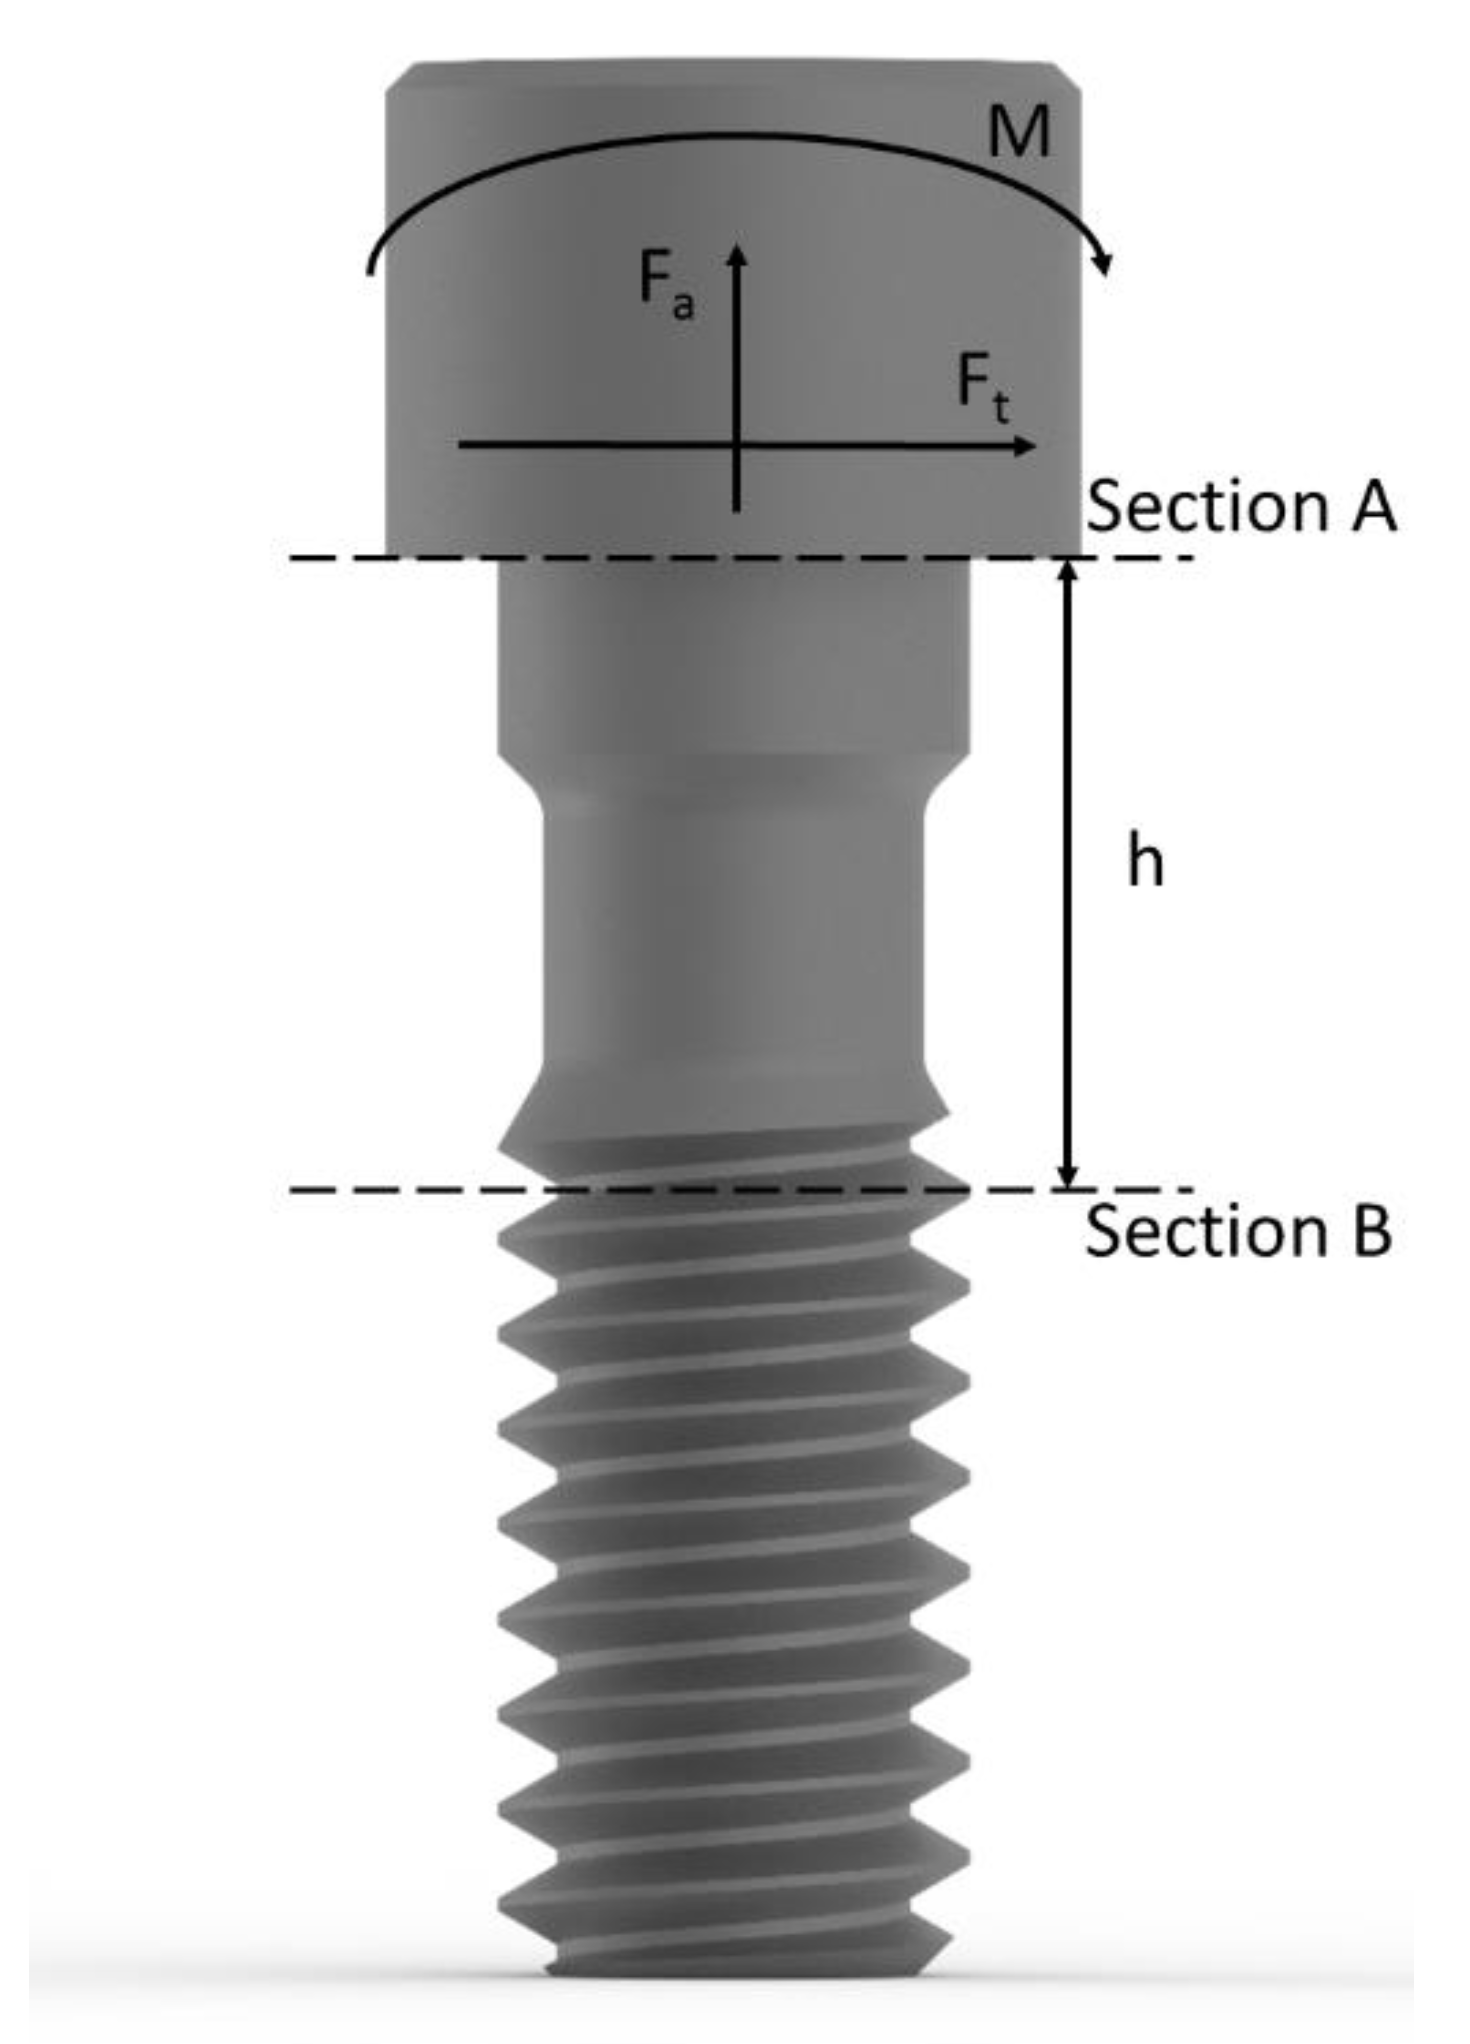
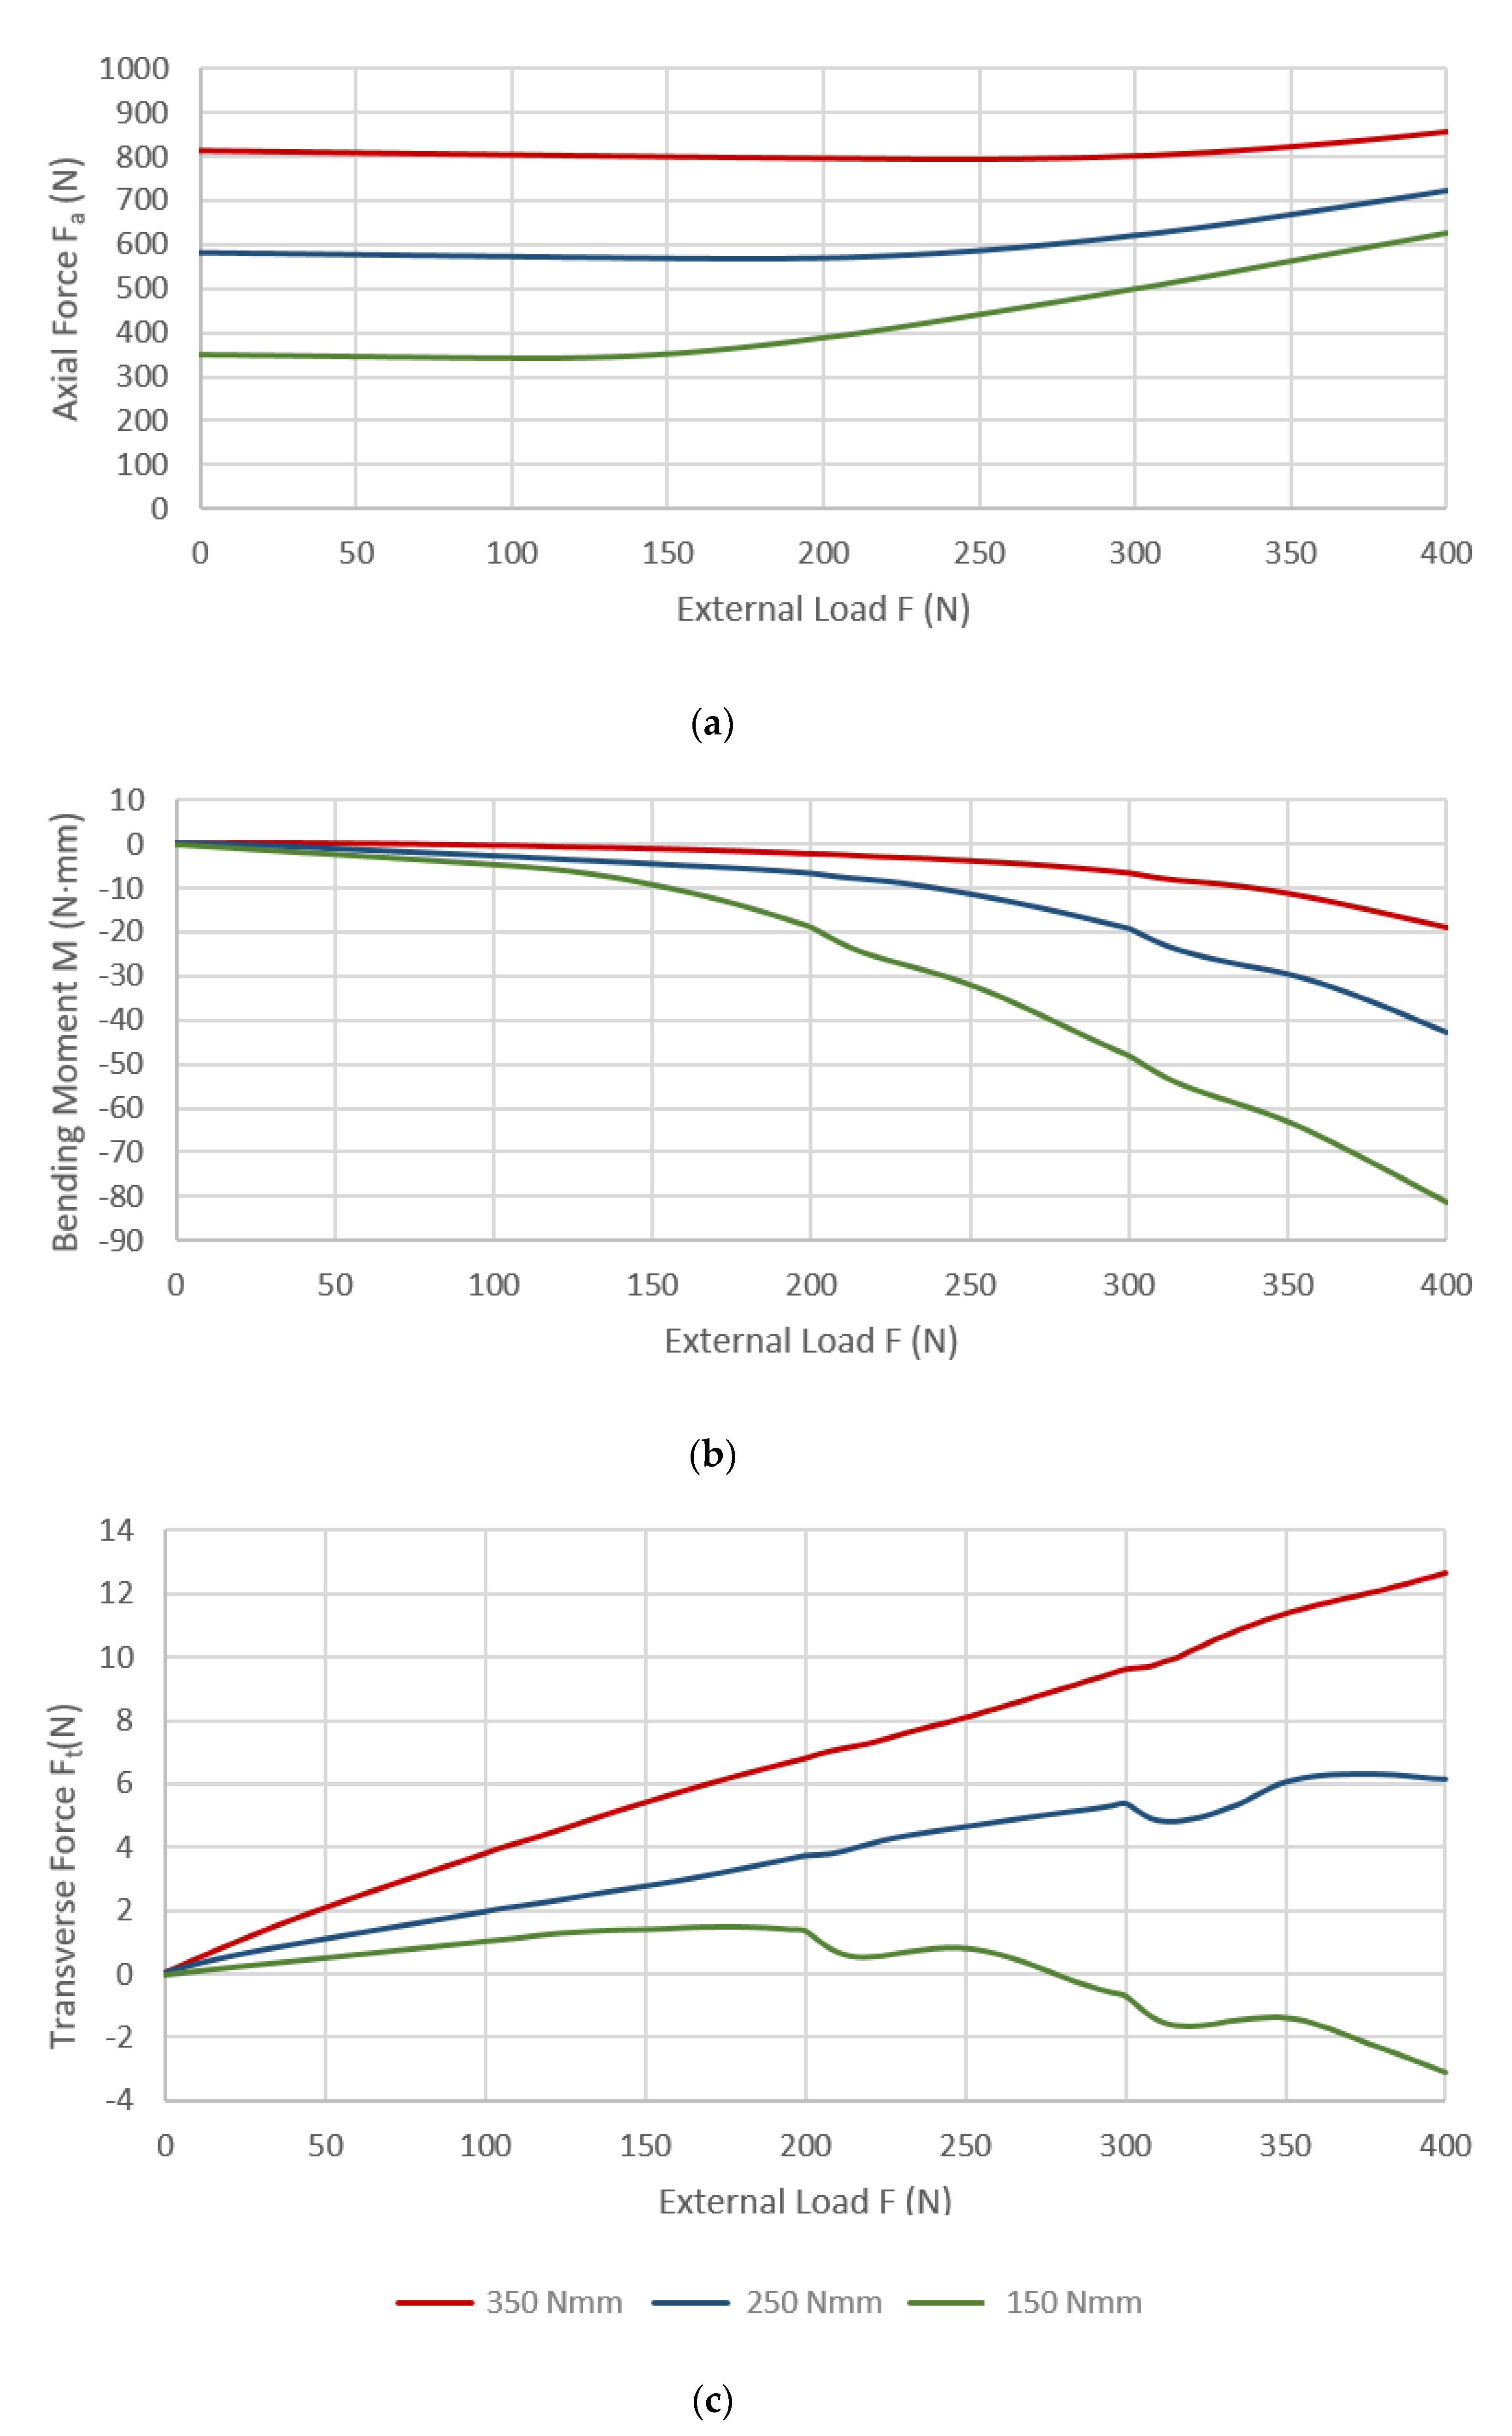
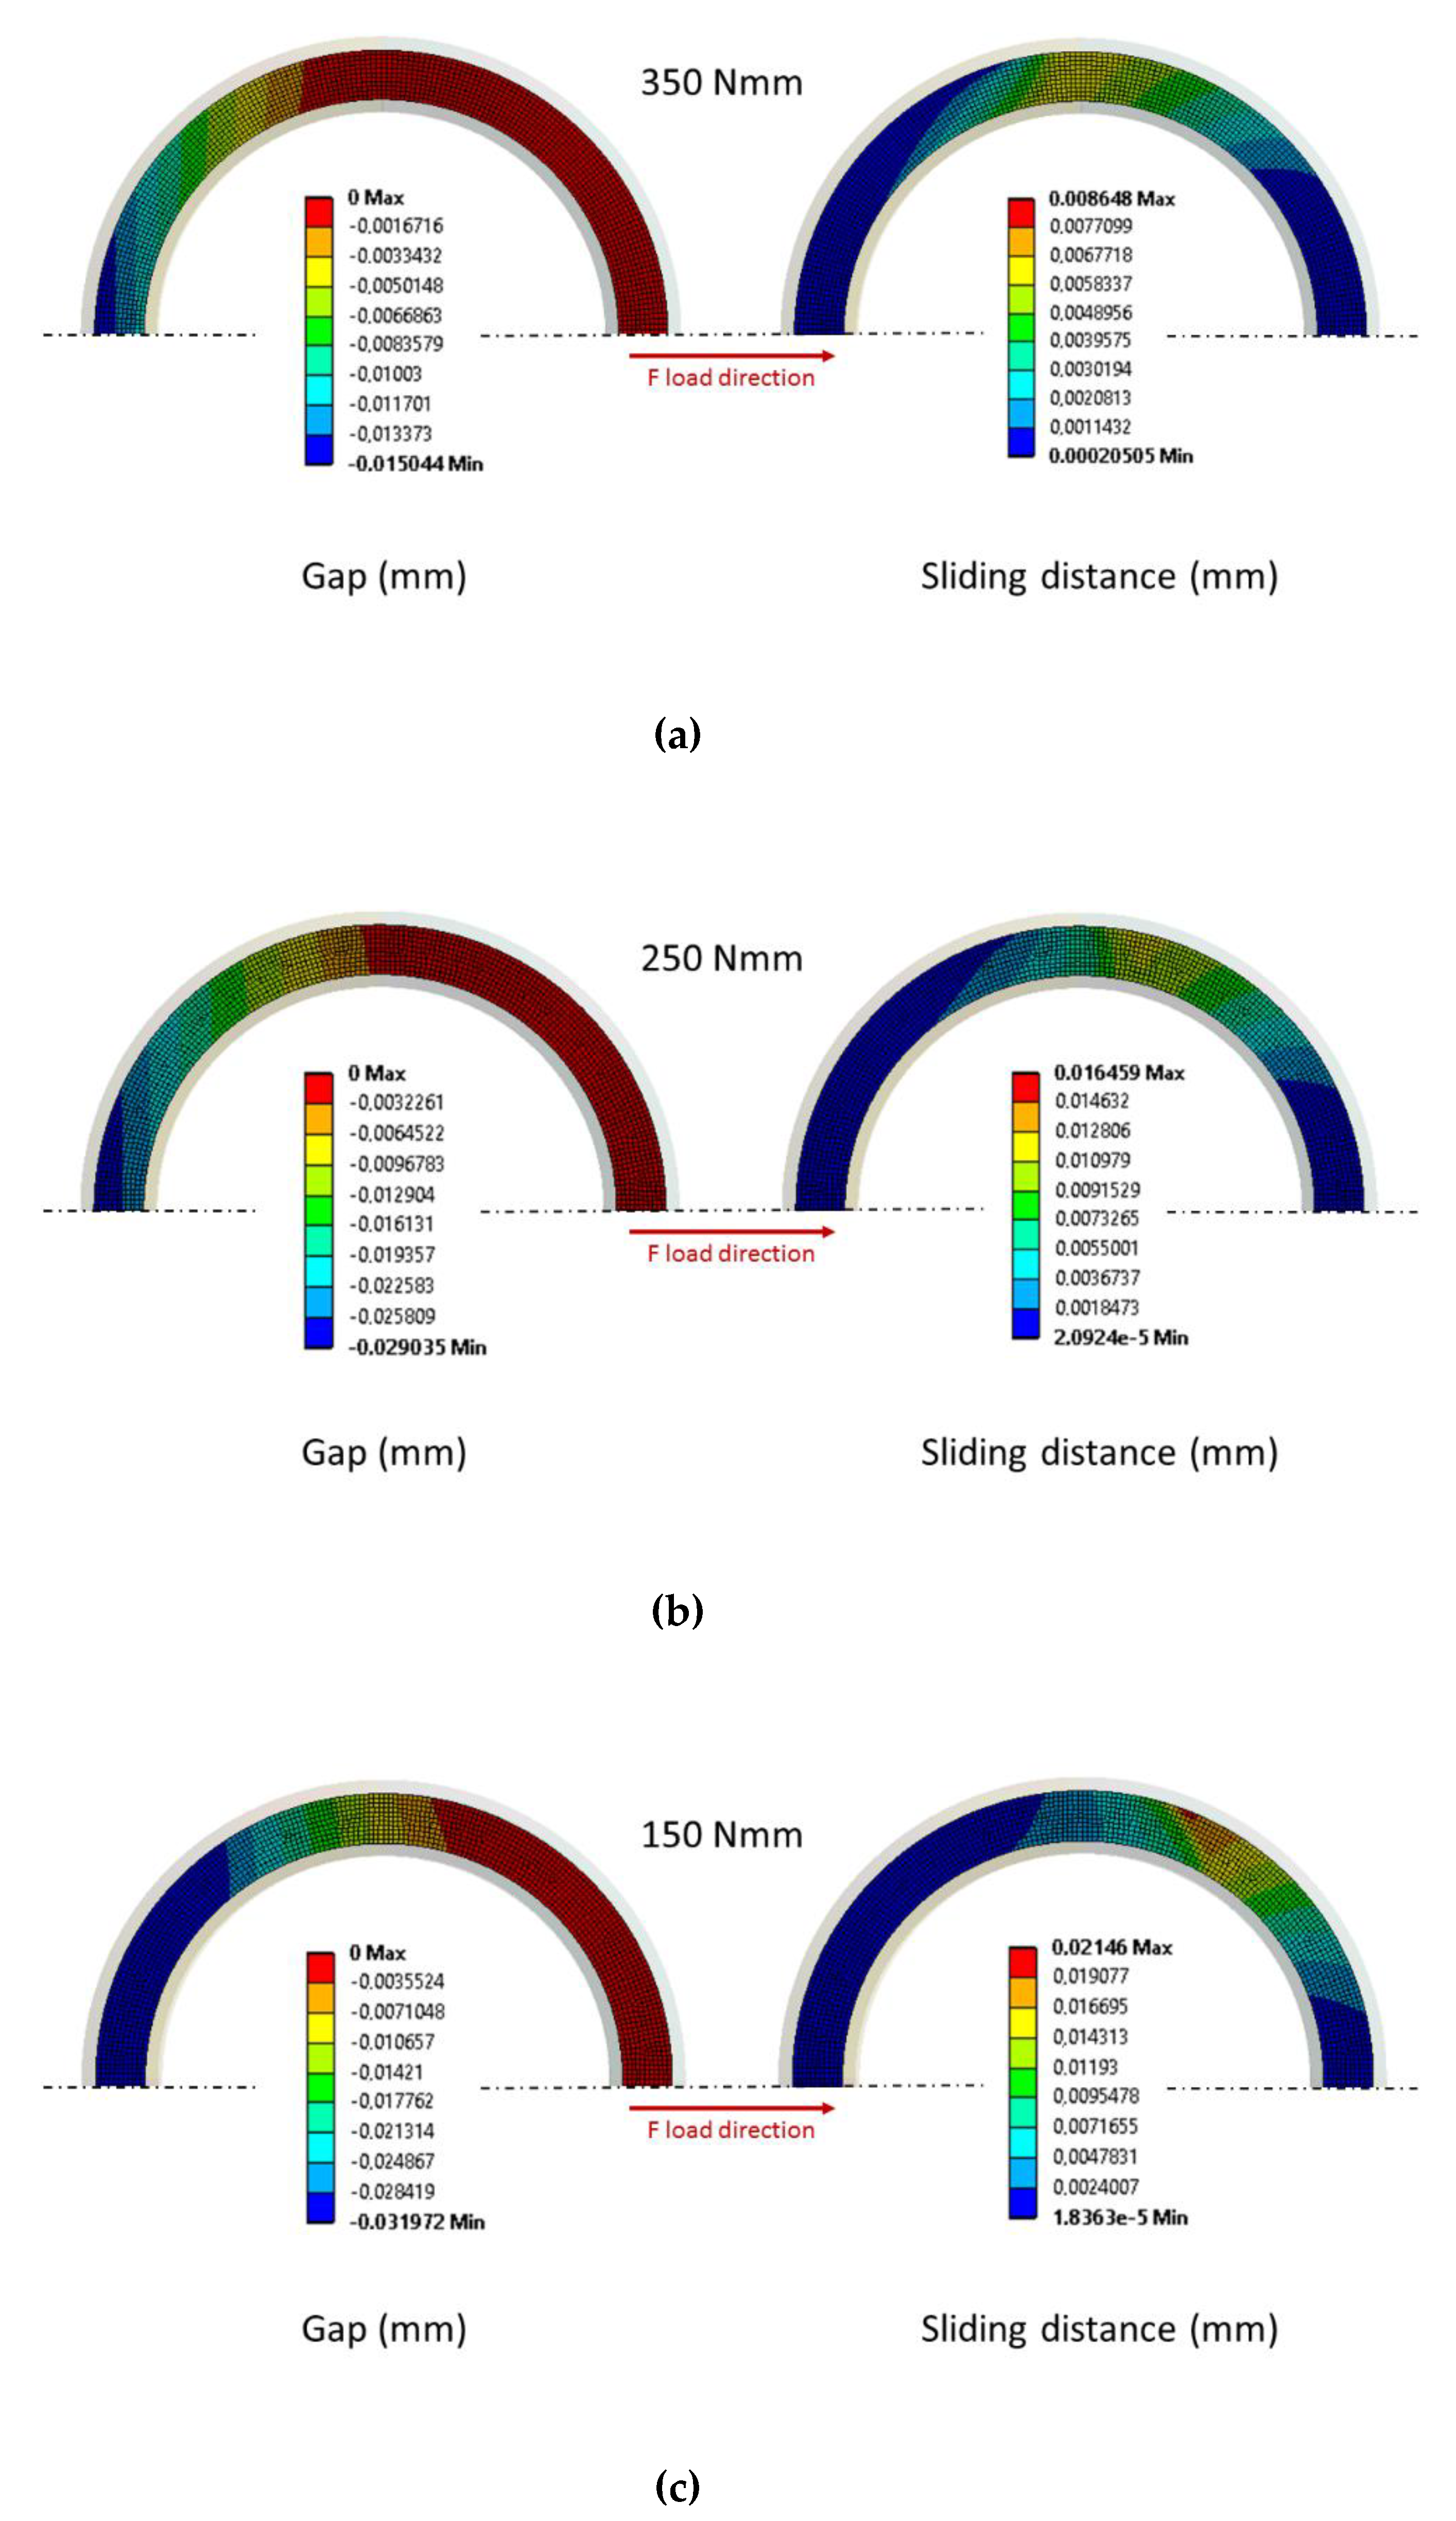
Figure 10 represents the contact forces in the abutment screw head contact surface (section A), where Fa is the axial force, the transverse force and the bending moment. These forces are directly obtained from the FE results as contact reactions using the force reaction tool of Ansys Workbench R19®. Thus, Figure 11 shows their values for different external loads for the three tightening torques. As mentioned, only one half of the dental implant was modeled taking advantage of the symmetry, and accordingly only half of the preload and the external load were applied to the model, so obviously the values reported in Figure 11 are twice the values obtained from the FE model. Please note that the values for = 0 correspond to the condition after tightening the screw, where the screw axial force is equal to the preload value indicated in Table 3, and the transverse and bending loads are null. It may also be observed that the axial force remains nearly constant until it changes its tendency at a certain value, and something similar happens with the bending moment . FE results show that this occurs when the implant-abutment contact starts to open due to the bending of the abutment, which takes place at a value that increases with the screw tightening torque. Figure 12 shows the implant-abutment contact gap and sliding distance under an external load = 400 N. As it can be appreciated, for low tightening torque values, the gap and the sliding distance are larger because the implant-abutment assembly is weaker due to a lower screw preload, thus leading to higher forces in the screw head contact surface.
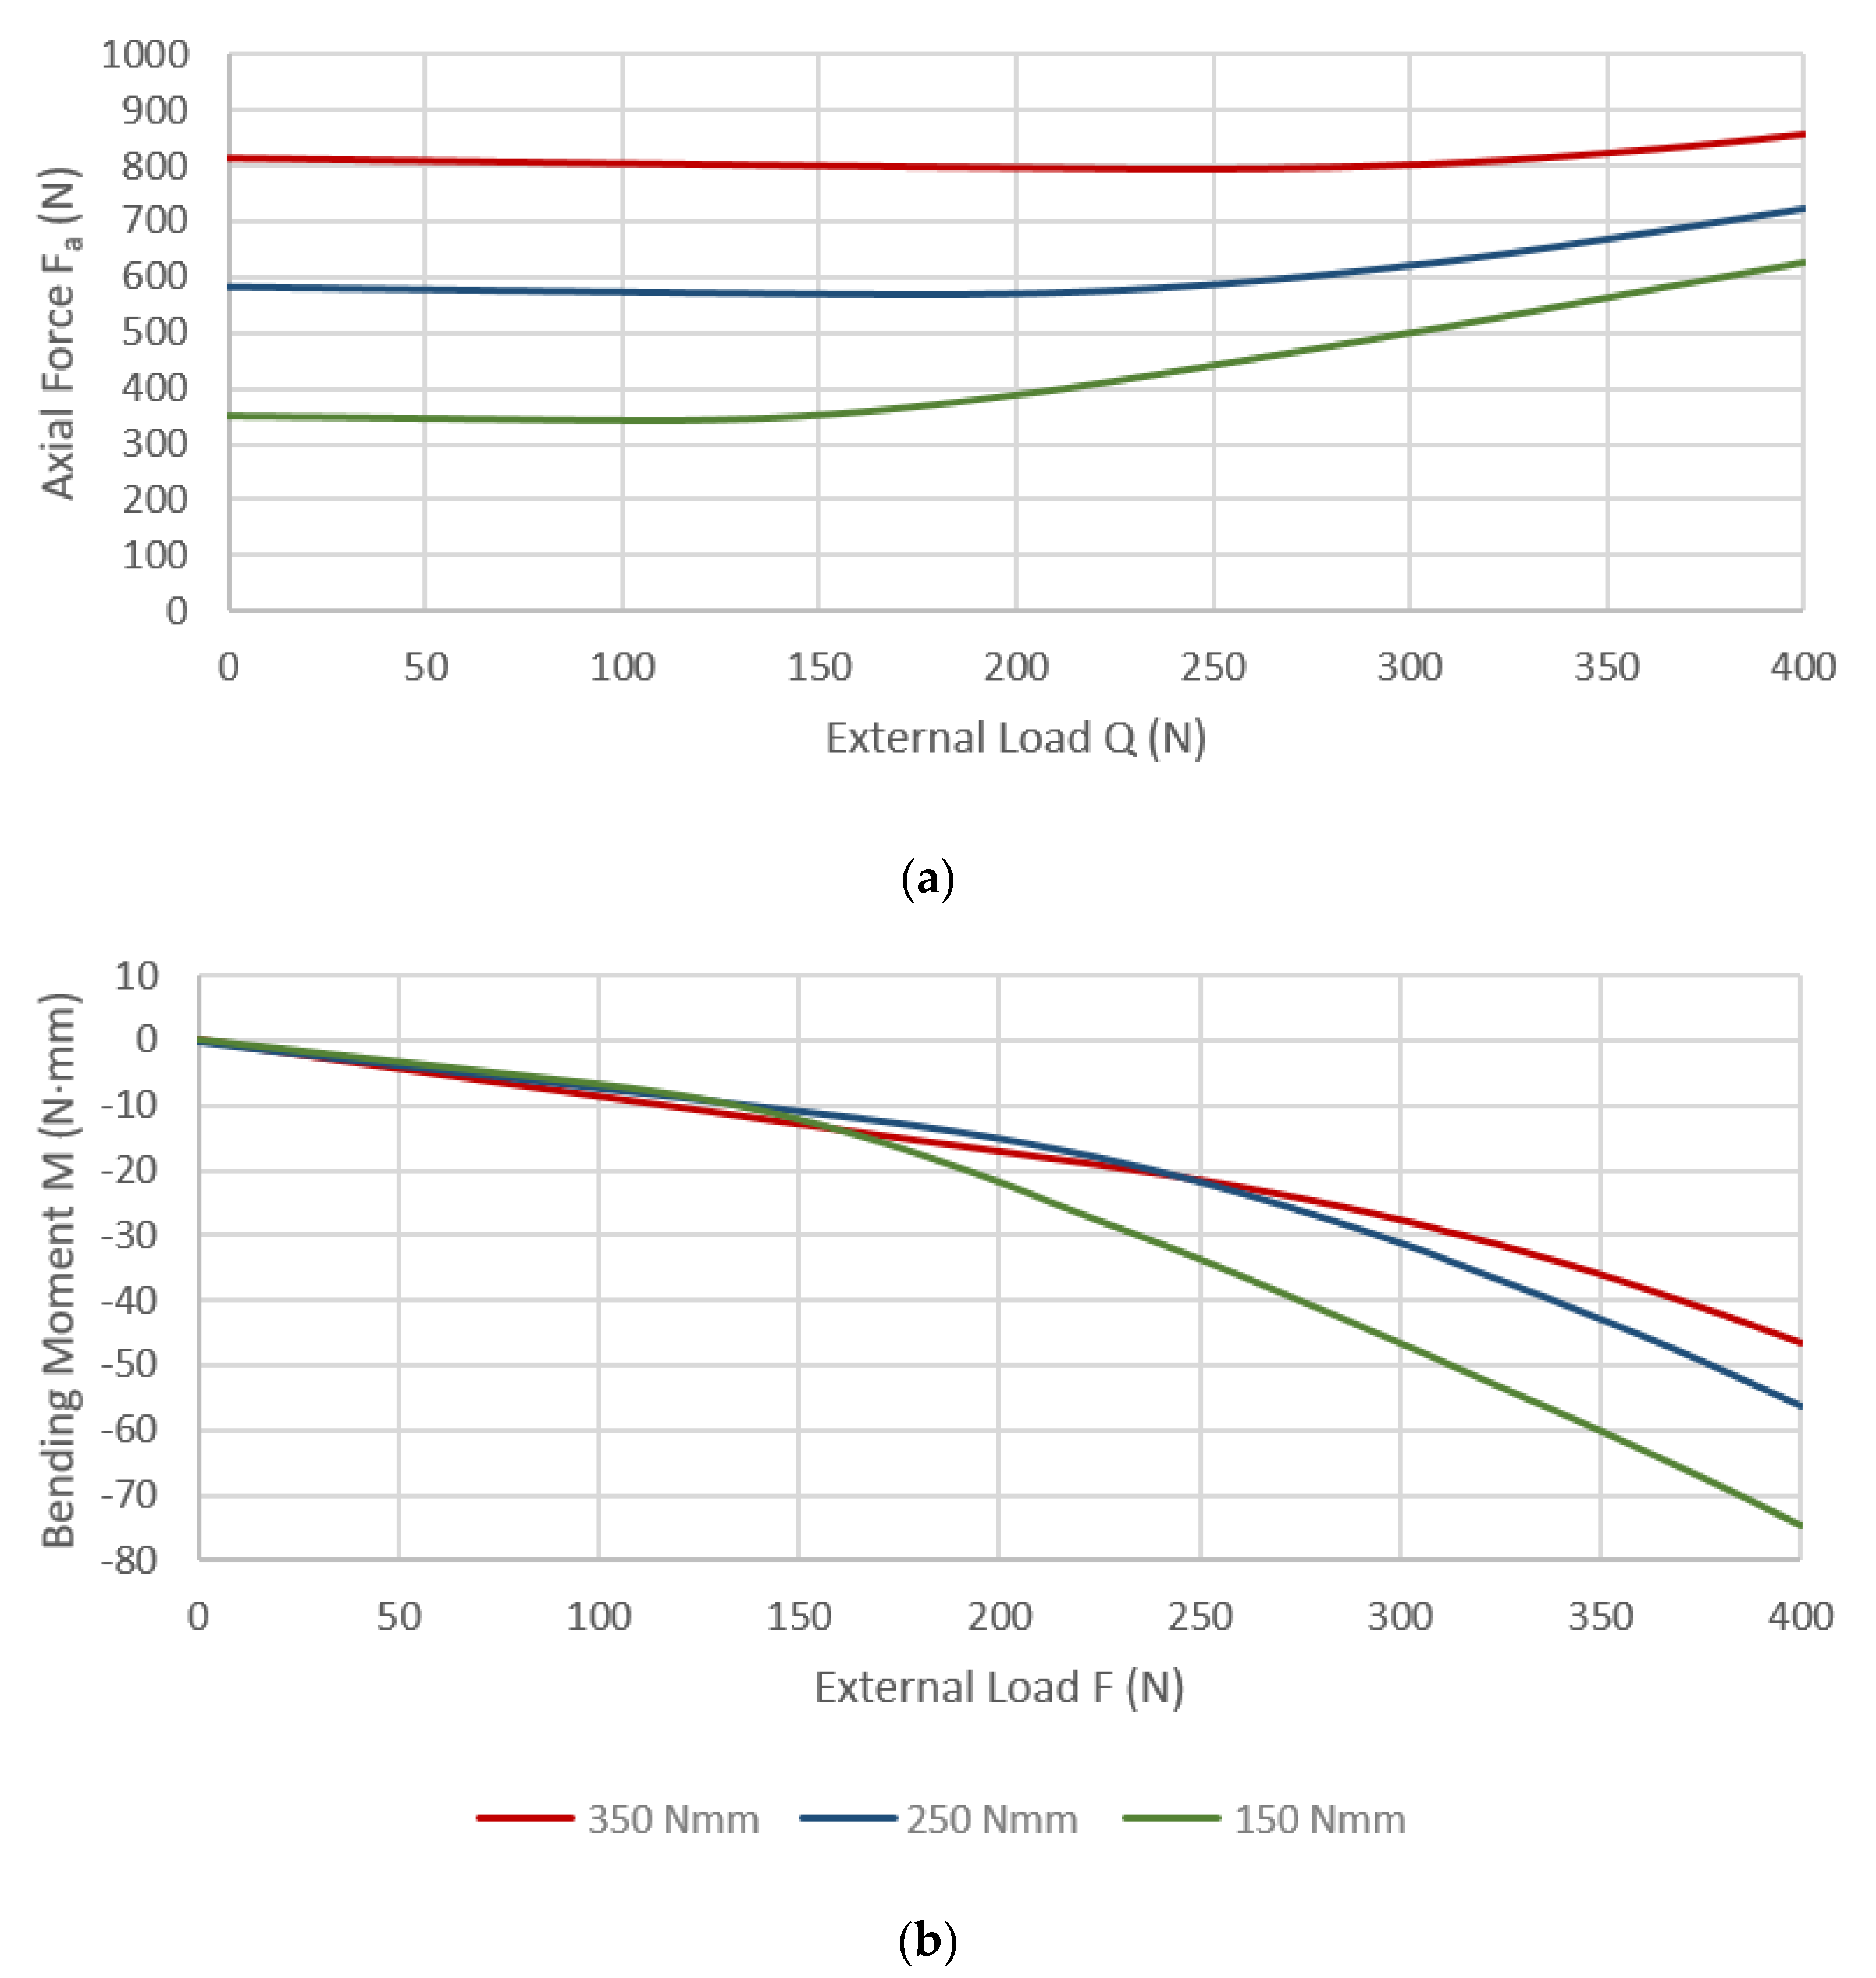
Fatigue failure takes place in the thread section (section B in Figure 10), at a distance of h = 2.185 mm from the screw head, as previously mentioned. Therefore, the forces of Figure 11 (corresponding to section A in Figure 10) must be transferred to that critical section B in Figure 10. Figure 13 shows the axial and bending moment in that critical section (the transverse load is not considered because the resulting shear stress is negligible): the axial load remains the same as in the screw head contact, while the bending moment is larger due to the additional moment caused by the transverse load.
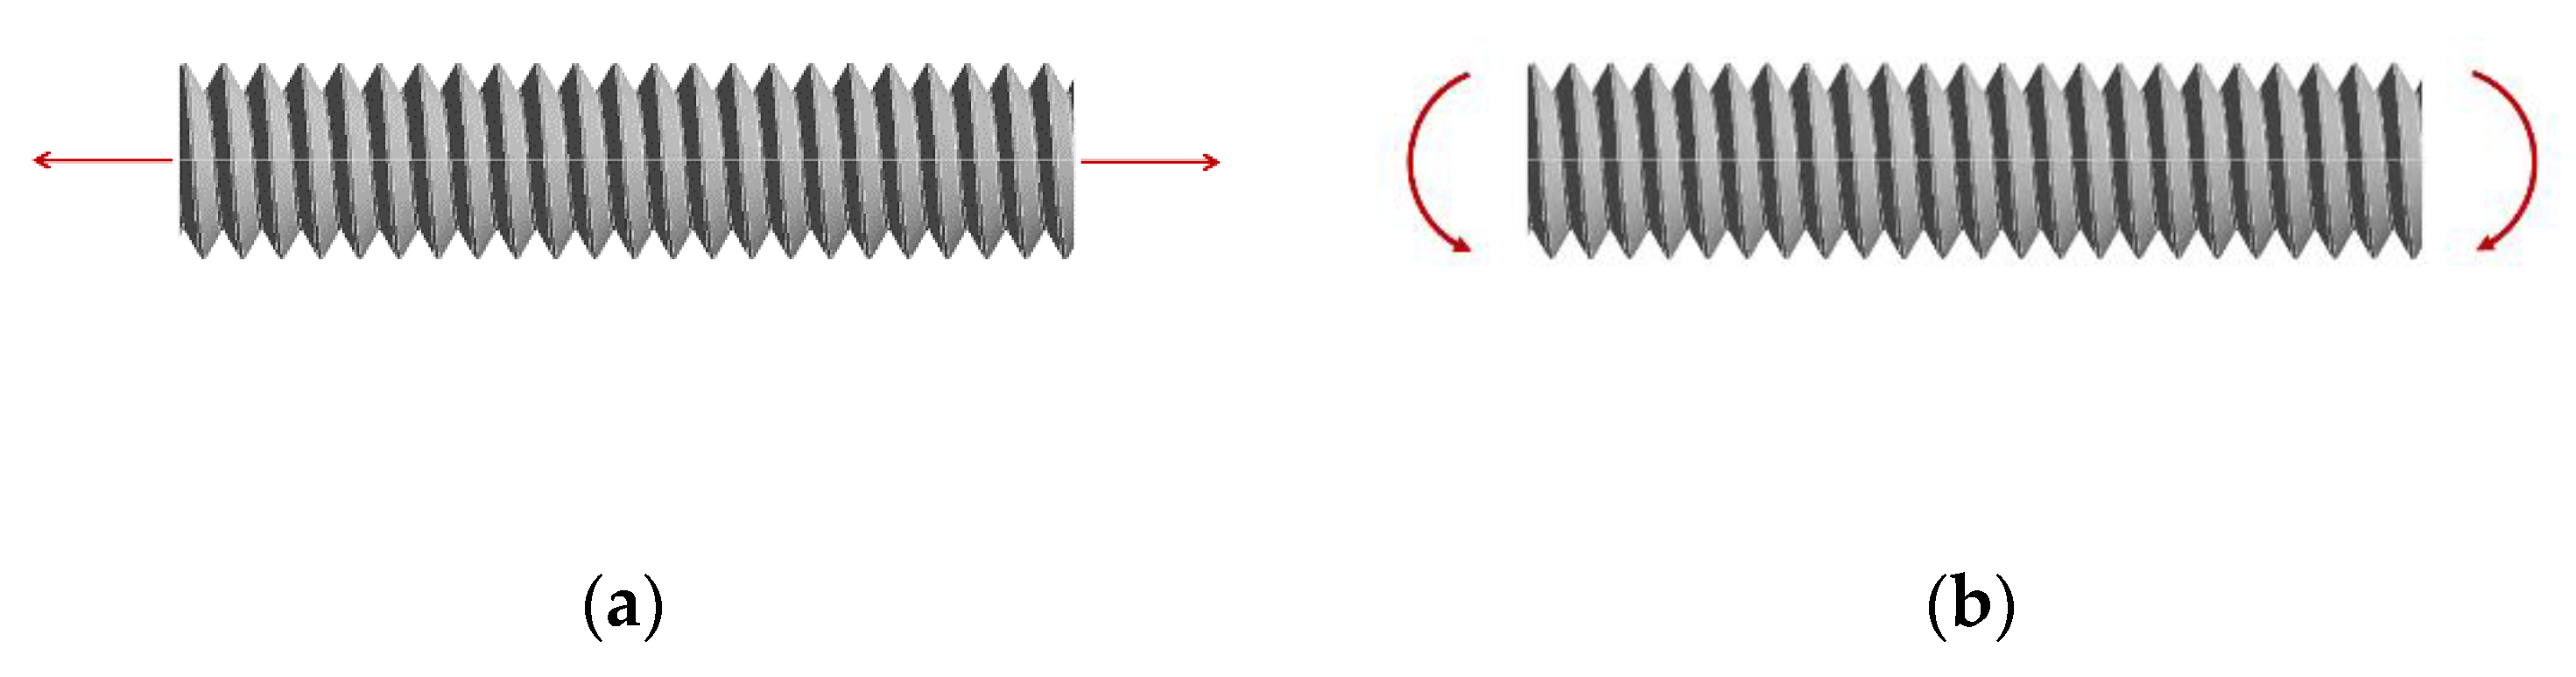
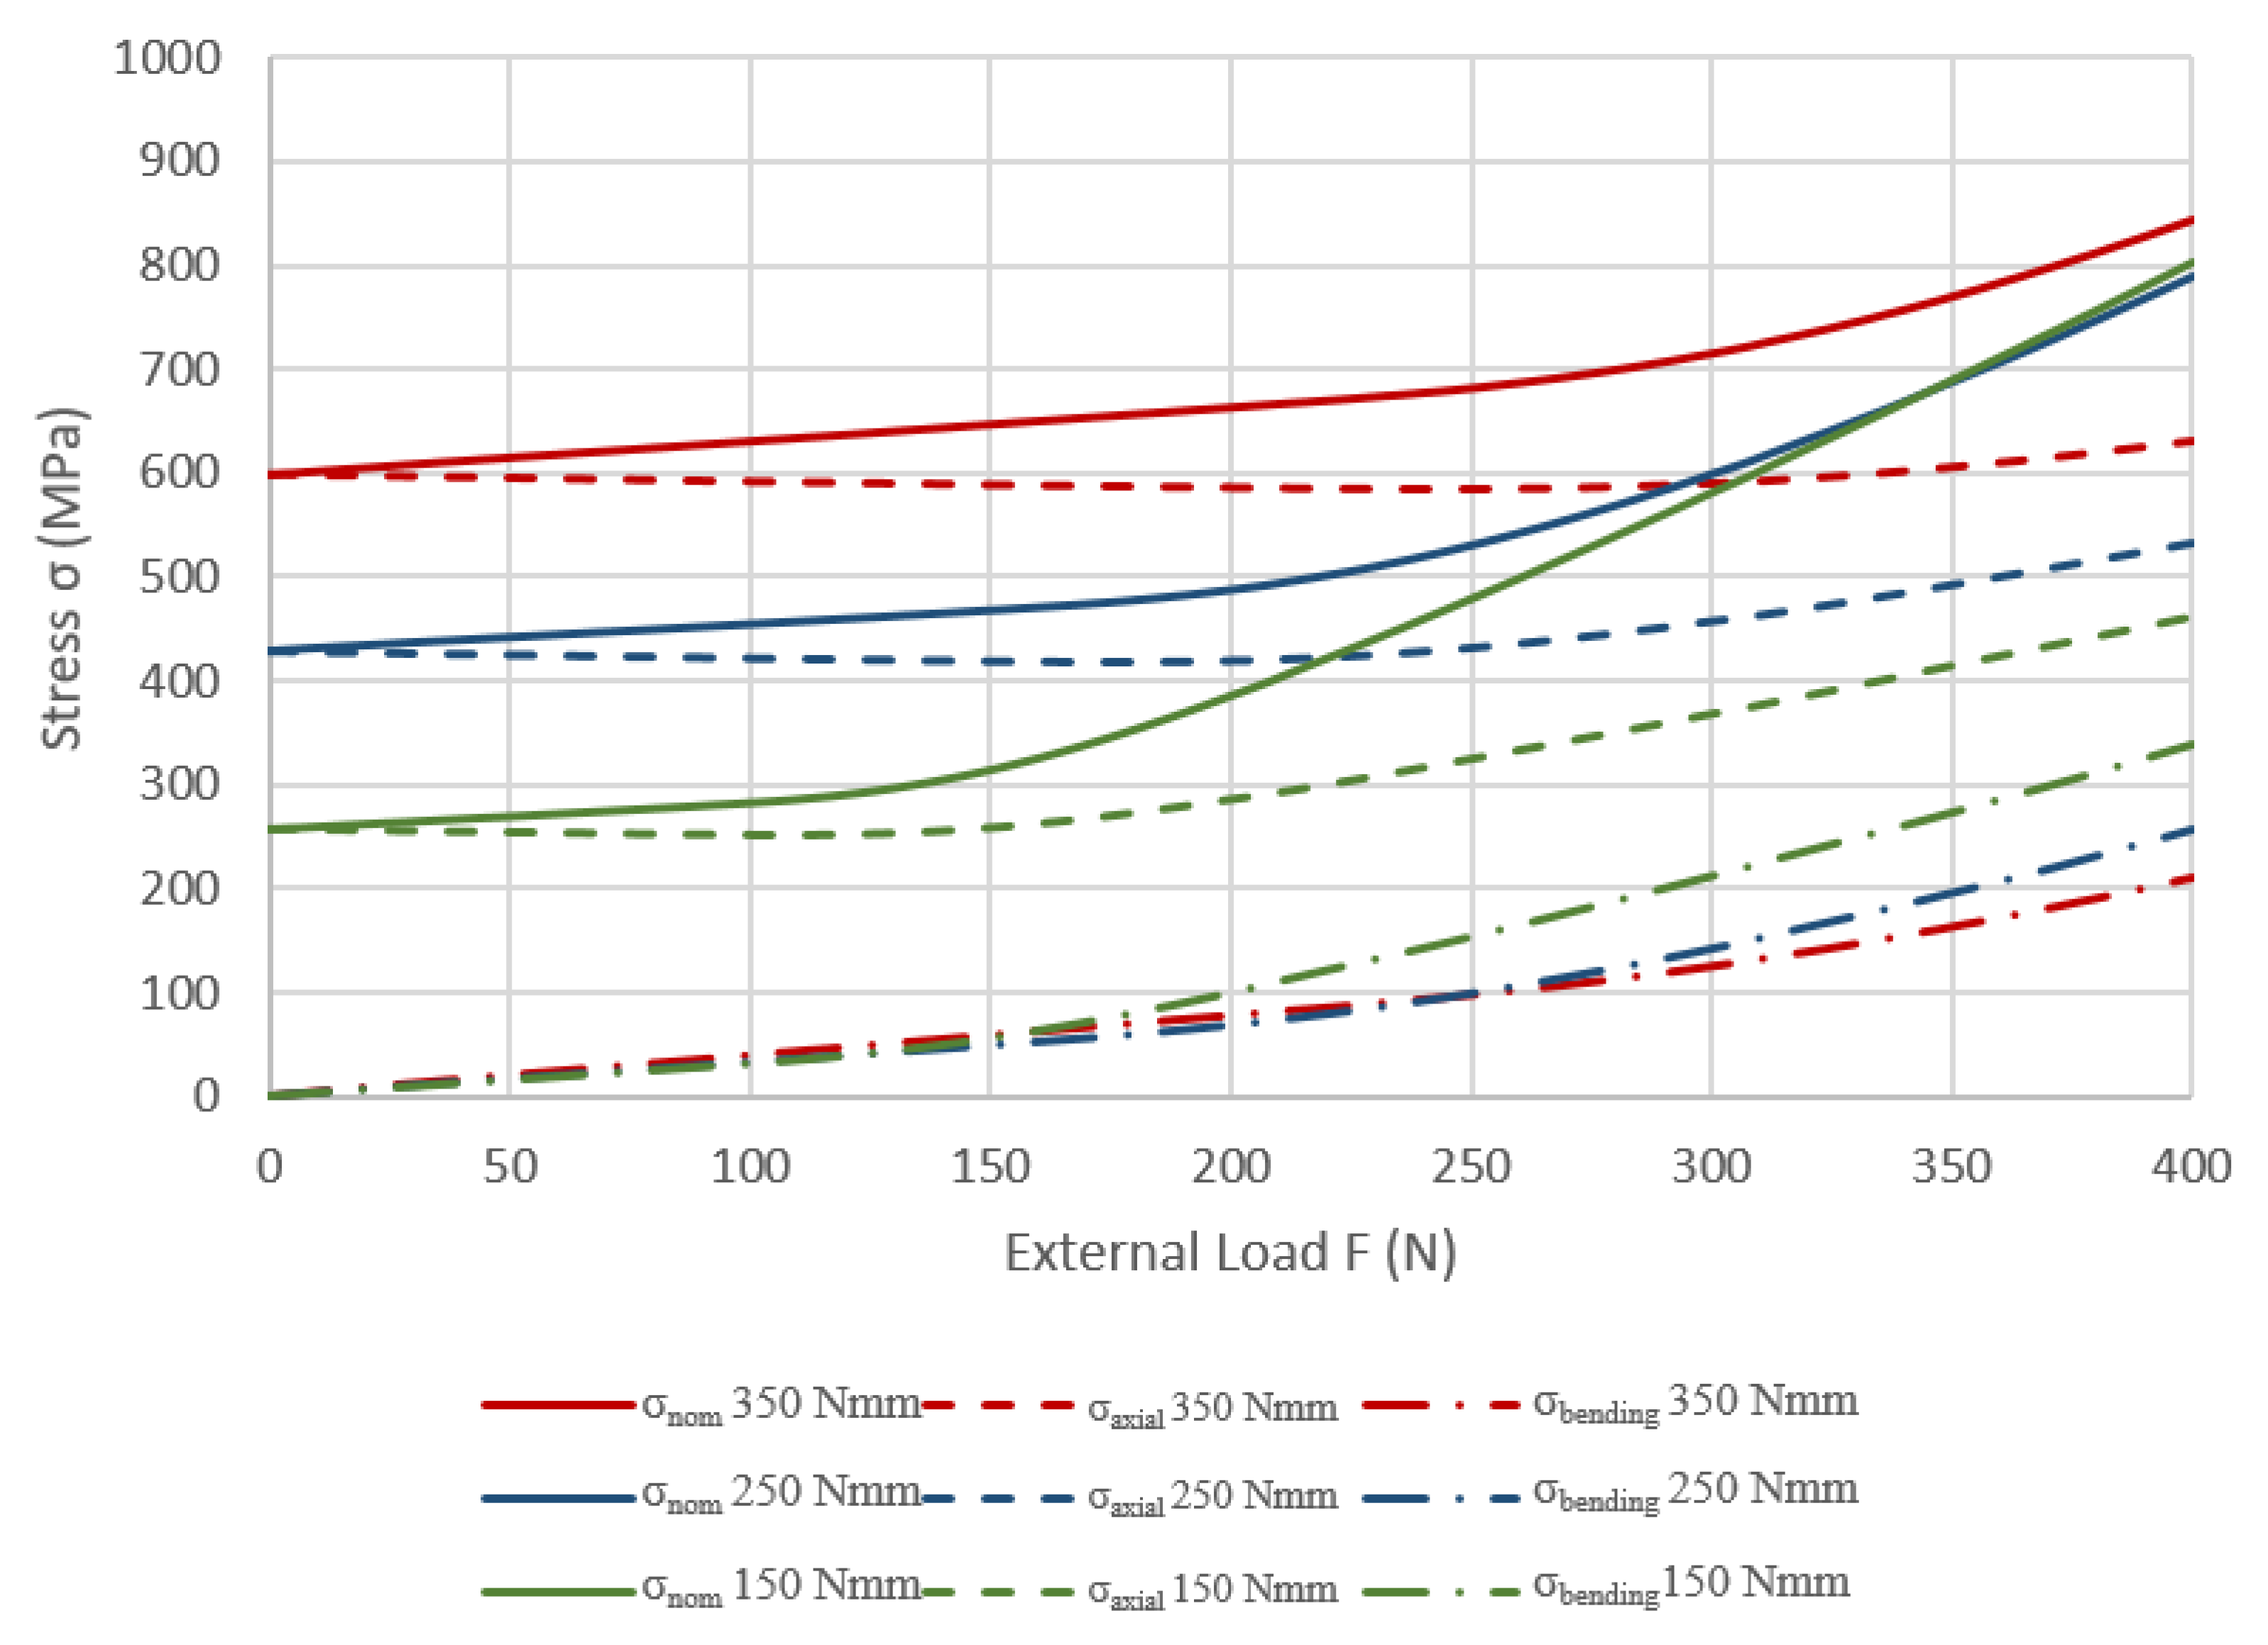
From these FE results, the nominal normal stress is calculated in that section using the expressions from the Theory of Elasticity:
where the first term corresponds to the axial stress () and the second one to the bending stress (), being Fa and M the axial force and bending moment in Figure 13. Obviously, as and M depend on F, so does the nominal stress. To calculate the equivalent area A and inertia I of the thread section, two simple FE analyses (Figure 14) were performed under an axial load and a bending moment, respectively (with the same geometry as the thread section under study). Combining classical equations of Theory of Elasticity with FE deformation results, the values A = 1.36 mm2 and I = 0.14 mm4 were obtained, which correspond to a radius r = 0.65 mm. Using these values in Equation (2), the stresses of Figure 15 were obtained.
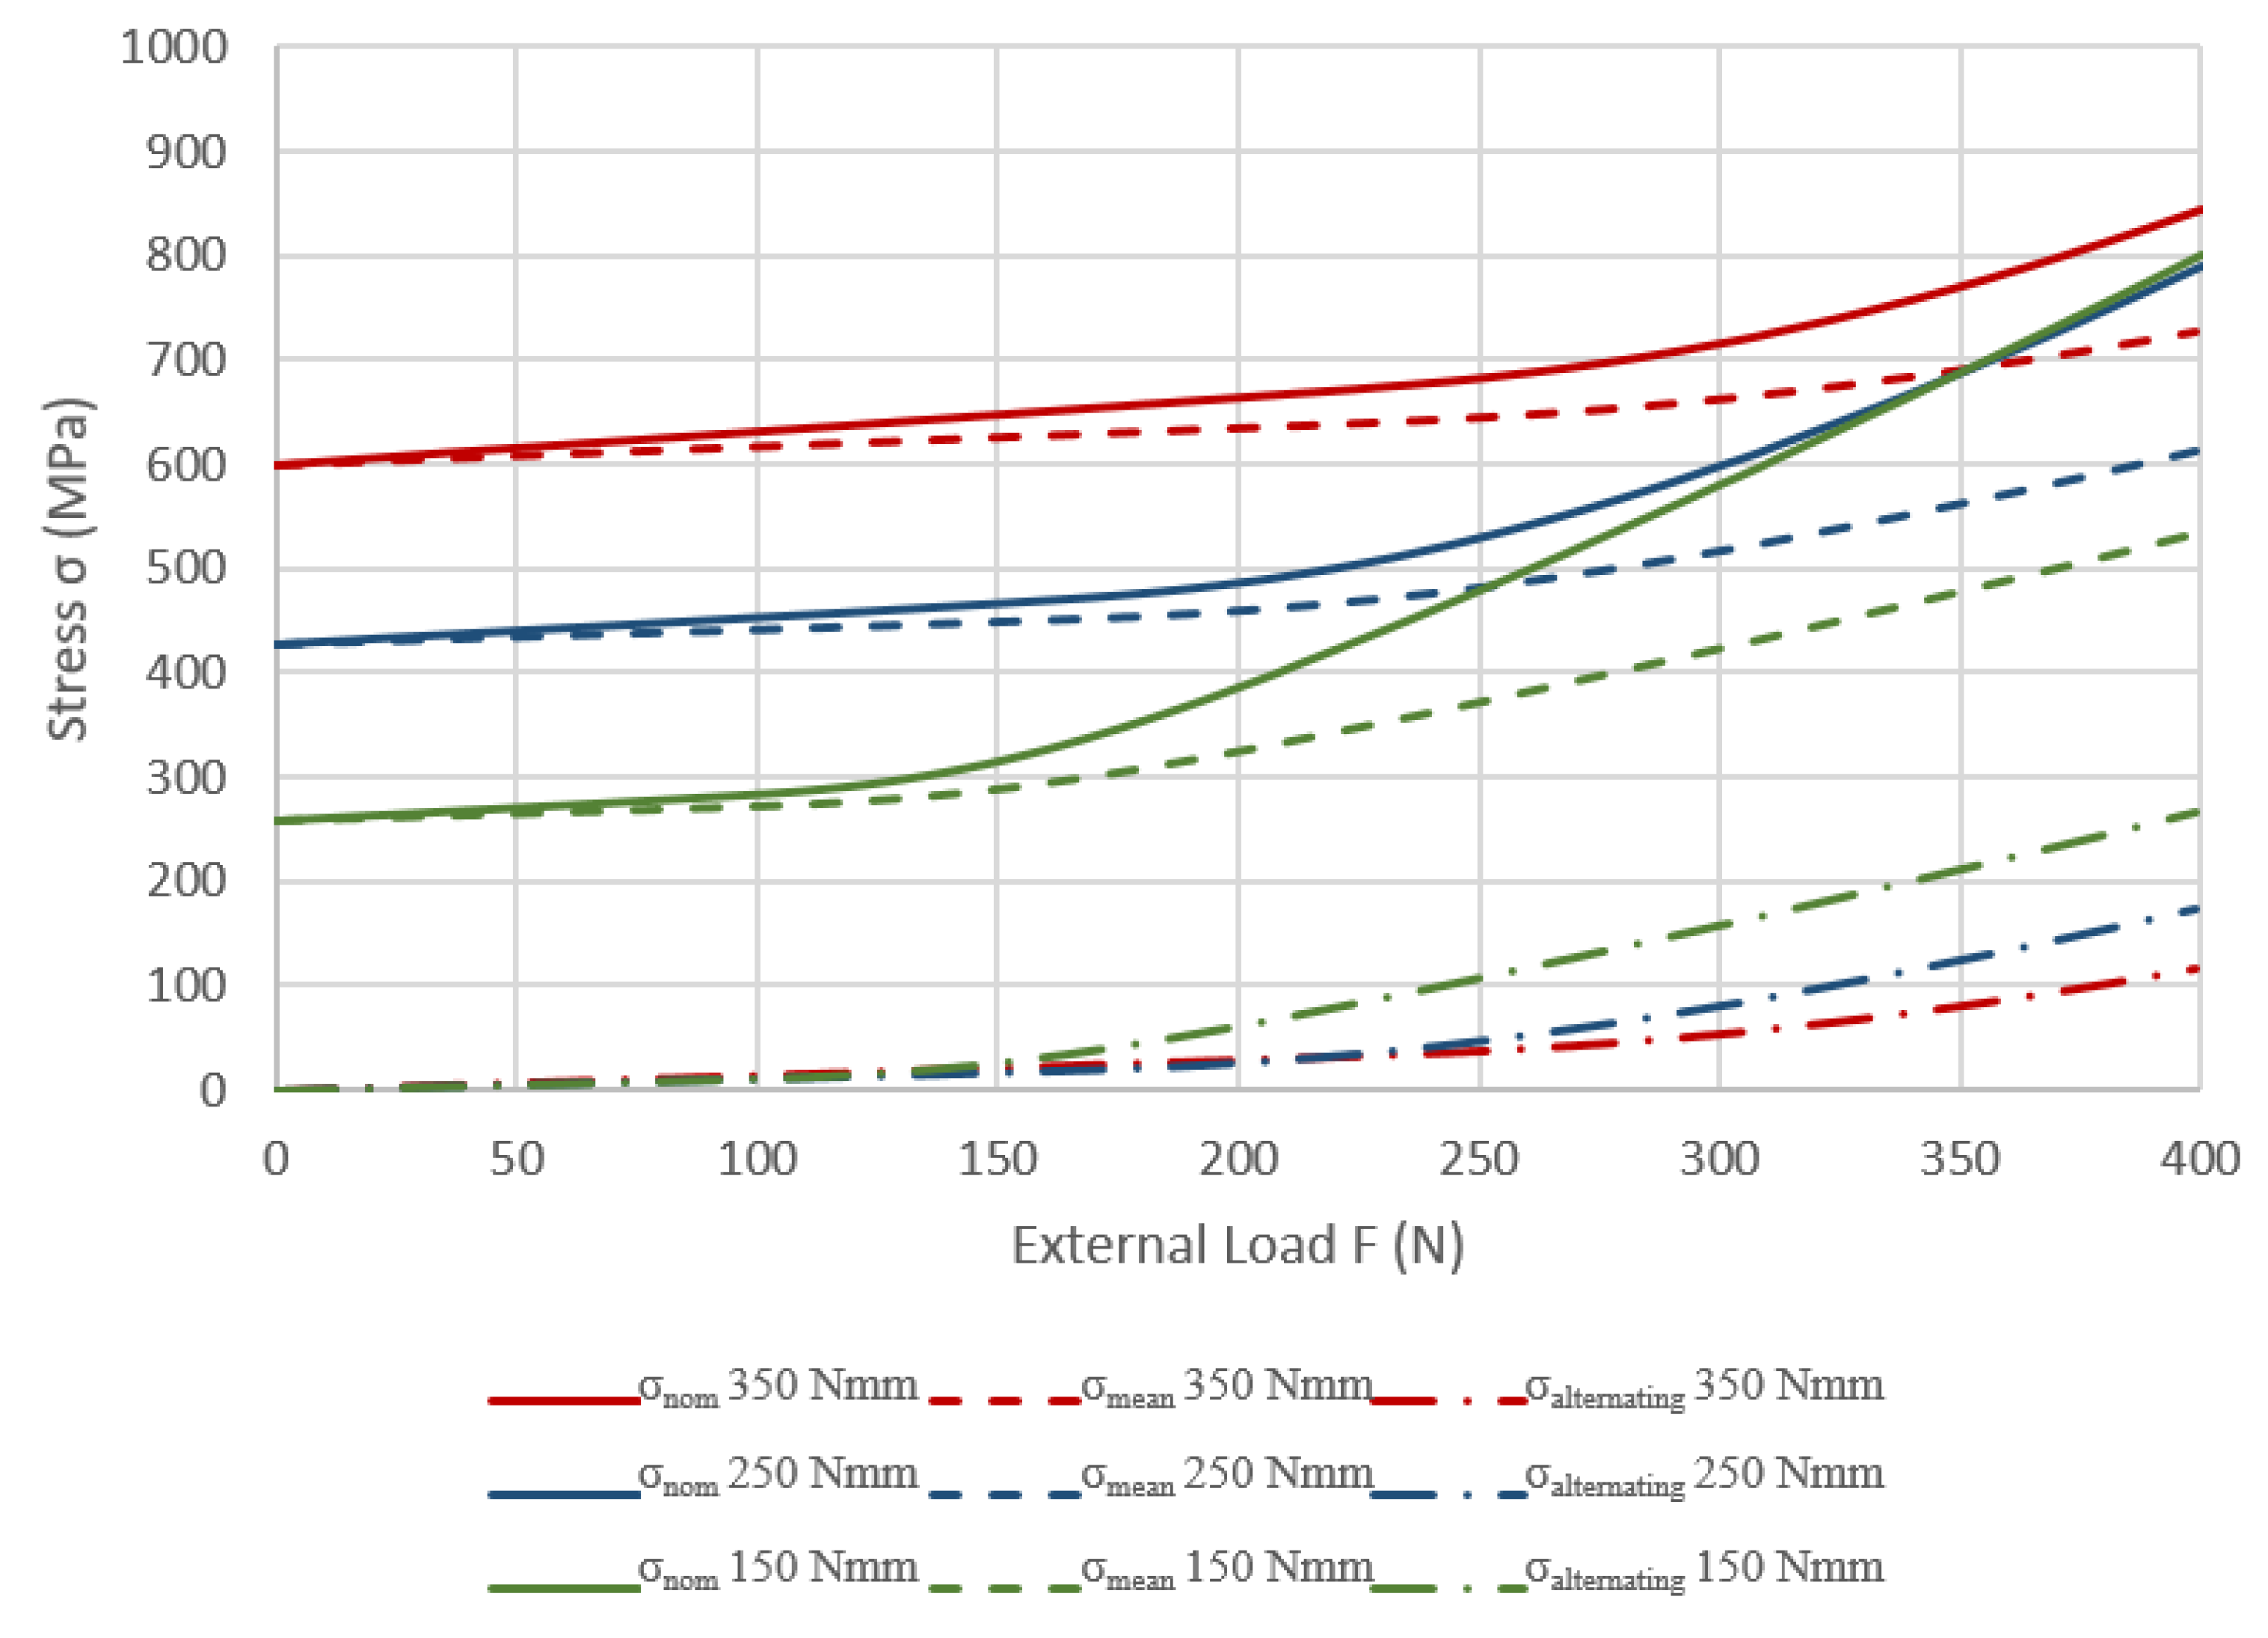
Alternating and mean components of the stress shown in Figure 16 were calculated from nominal stresses plotted in Figure 15.
So far, on the one hand FEA enabled relating the applied load F with the mean and alternating nominal stress values in the threaded section. On the other hand, experimental tests provided the F-N curves that relate the load F with the number of cycles N. Combining both the numerical and the experimental results, the Haigh diagram in Figure 17 was plotted, which relates stress with cycles. As it can be observed, Walker criterion [43] proved to fit well the results with the parameters indicated in Equation (3), fitted according to the procedure described in Dowling et al. [44], giving place to the following expression:
Please note that the characterization was focused on 0 < R < 1 zone of Figure 17 representing properly the actual workspace of the screw since screws always work under tension loads. This, in addition to the aforementioned fact that the experimental tests cover the finite life cycles of the dental implant, involves that the curves in Figure 17 or the corresponding Equation (3), characterize the fatigue behavior of the critical thread section of the INTTUH prosthetic screw under study. Thus, curves in Figure 17 can further be used to evaluate different design alternatives such as different geometries, implant-abutment connections, friction coefficients, tightening torques, etc., as far as the screw thread has similar surface finish and geometry.
4. Conclusions
Fatigue failure is a major mechanical problem in dental implants, where the screw thread section is the most common failure section according to specialized literature. This work proposes a methodology for fatigue design of dental implants, combining ISO 14801 experimental tests, FEA and classical fatigue formulation. On one hand, experimental tests provide the load-life curve of the dental implant. On the other hand, reproducing the test in a FE model, the mean and alternating stresses in the failure section are calculated, combining both the plotted Haigh diagram and the results fitted in this case by means of Walker criterion. This criterion was found to characterize the fatigue behavior not only of the particular dental implant under study, but also of the majority of the dental implants in the catalog of the manufacturer (as the screw is the same, setting aside small variations in the metric size). Consequently, the authors believe that this methodology can be used by dental implant manufacturers to evaluate different design and assembly alternatives in preliminary design stages in a cost-effective way, enabling them to build better products that will reduce future clinical incidences regarding fatigue failure.
Author Contributions
Conceptualization, M.A. (Mikel Abasolo); methodology, M.A. (Mikel Armentia); software, I.C.; validation, M.A. (Mikel Armentia); formal analysis, I.C.; investigation, M.A. (Mikel Abasolo).; resources, M.A. (Mikel Abasolo); data curation, M.A. (Mikel Armentia).; writing—original draft preparation, M.A. (Mikel Armentia); writing—review and editing, M.A. (Mikel Armentia); visualization, I.C.; supervision, J.A.; project administration, M.A. (Mikel Abasolo).; funding acquisition, M.A. (Mikel Abasolo) All authors have read and agreed to the published version of the manuscript.
Funding
This work has received financial support of the Basque Government [grant number IT947-16].
Acknowledgments
The authors are very grateful to Raúl Cosgaya for the valuable assistance provided in the experimental tests performed for this work.
Conflicts of Interest
The authors declare no conflict of interest.
References
- Warreth, A.; Fesharaki, H.; McConville, R.; McReynolds, D. An introduction to single implant abutments. Dent. Update 2013, 40, 7–17. [Google Scholar] [CrossRef] [PubMed]
- Patterson, E.A.; Johns, R.B. Theoretical analysis of the fatigue life of fixture screws in osseointegrated dental implants. Int. J. Oral Maxillofac. Implant. 1992, 7, 26–33. [Google Scholar]
- Bickford, J.H. Introduction to the Design and Behavior of Bolted Joints. In Introduction to the Design and Behavior of Bolted Joints; CRC Press: New York, NY, USA, 2008; pp. 1–14. [Google Scholar]
- Stüker, R.A.; Teixeira, E.R.; Beck, J.C.P.; Da Costa, N.P. Preload and torque removal evaluation of three different abutment screws for single standing implant restorations. J. Appl. Oral Sci. 2008, 16, 55–58. [Google Scholar] [CrossRef] [PubMed] [Green Version]
- Lang, L.A.; Kang, B.; Wang, R.F.; Lang, B.R. Finite element analysis to determine implant preload. J. Prosthet. Dent. 2003, 90, 539–546. [Google Scholar] [CrossRef] [PubMed]
- Barbosa, G.S.; da Silva-Neto, J.P.; Simamoto-Júnior, P.C.; das Neves, F.D.; da Gloria, C.; de Mattos, M.; Ribeiro, R.F. Evaluation of screw loosening on new abutment screws and after successive tightening. Braz. Dent. J. 2011, 22, 51–55. [Google Scholar] [CrossRef] [Green Version]
- Budynas, R.; Nisbett, J.K. Shigley’s Mechanical Engineering Design; McGraw-Hill: New York, NY, USA, 2015; ISBN 9780070568990. [Google Scholar]
- Shemtov-Yona, K.; Rittel, D. Fatigue of Dental Implants: Facts and Fallacies. Dent. J. 2016, 4, 16. [Google Scholar] [CrossRef] [Green Version]
- Pjetursson, B.; Asgeirsson, A.; Zwahlen, M.; Sailer, I. Improvements in Implant Dentistry over the Last Decade: Comparison of Survival and Complication Rates in Older and Newer Publications. Int. J. Oral Maxillofac. Implant. 2014, 29, 308–324. [Google Scholar] [CrossRef] [Green Version]
- Dhima, M.; Paulusova, V.; Lohse, C.; Salinas, T.J.; Carr, A.B. Practice-based evidence from 29-year outcome analysis of management of the edentulous jaw using osseointegrated dental implants. J. Prosthodont. 2014, 23, 173–181. [Google Scholar] [CrossRef]
- Pérez, M.A. Life prediction of different commercial dental implants as influence by uncertainties in their fatigue material properties and loading conditions. Comput. Methods Programs Biomed. 2012, 108, 1277–1286. [Google Scholar] [CrossRef]
- International Organization for Standardization. ISO 14801:2007 Dentistry. Implants. Dynamic fatigue test for endosseous dental implants; ISO: Geneva, Switzerland, 2007. [Google Scholar]
- Darshith, R.B.K.; Manjunath, S.S. Comprehensive Study of Cut and Roll Threads. IOSR J. Mech. Civ. Eng. 2014, 11, 91–96. [Google Scholar]
- Javier Gil, F.; Planell, J.A.; Padrós, A.; Aparicio, C. The effect of shot blasting and heat treatment on the fatigue behavior of titanium for dental implant applications. Dent. Mater. 2007, 23, 486–491. [Google Scholar] [CrossRef] [PubMed]
- Park, J.K.; Choi, J.U.; Jeon, Y.C.; Choi, K.S.; Jeong, C.M. Effects of abutment screw coating on implant preload. J. Prosthodont. 2010, 19, 458–464. [Google Scholar] [CrossRef]
- Jeng, M.D.; Liu, P.Y.; Kuo, J.H.; Lin, C.L. Load fatigue performance evaluation on two internal tapered abutment-implant connection implants under different screw tightening torques. J. Oral Implantol. 2017, 43, 107–113. [Google Scholar] [CrossRef] [PubMed]
- Quek, H.; Tan, K.; Nicholls, J. Load fatigue performance of four implant-abutment interface designs: Effect of torque level and implant system. J. Prosthet. Dent. 2008, 23, 253–262. [Google Scholar]
- Xia, D.; Lin, H.; Yuan, S.; Bai, W.; Zheng, G. Dynamic fatigue performance of implantabutment assemblies with different tightening torque values. Biomed. Mater. Eng. 2014, 24, 2143–2149. [Google Scholar]
- Yao, K.T.; Kao, H.C.; Cheng, C.K.; Fang, H.W.; Yip, S.W.; Hsu, M.L. The effect of clockwise and counterclockwise twisting moments on abutment screw loosening. Clin. Oral Implant. Res. 2012, 23, 1181–1186. [Google Scholar] [CrossRef]
- Yamaguchi, S.; Yamanishi, Y.; Machado, L.S.; Matsumoto, S.; Tovar, N.; Coelho, P.G.; Thompson, V.P.; Imazato, S. In vitro fatigue tests and in silico finite element analysis of dental implants with different fixture/abutment joint types using computer-aided design models. J. Prosthodont. Res. 2018, 62, 24–30. [Google Scholar] [CrossRef]
- Khraisat, A.; Stegaroiu, R.; Nomura, S.; Miyakawa, O. Fatigue resistance of two implant/abutment joint designs. J. Prosthet. Dent. 2002, 88, 604–610. [Google Scholar] [CrossRef]
- Bicudo, P.; Reis, J.; Deus, A.M.; Reis, L.; Vaz, M.F. Performance evaluation of dental implants: An experimental and numerical simulation study. Theor. Appl. Fract. Mech. 2016, 85, 74–83. [Google Scholar] [CrossRef]
- Lee, J.H.; Frias, V.; Lee, K.W.; Wright, R.F. Effect of implant size and shape on implant success rates: A literature review. J. Prosthet. Dent. 2005, 94, 377–381. [Google Scholar] [CrossRef]
- Shemtov-Yona, K.; Rittel, D.; Levin, L.; Machtei, E.E. Effect of dental implant diameter on fatigue performance. Part I: Mechanical behavior. Clin. Implant Dent. Relat. Res. 2014, 16, 172–177. [Google Scholar] [CrossRef] [PubMed]
- Fan, H.; Gan, X.; Zhu, Z. Evaluation of dental implant fatigue performance under loading conditions in two kinds of physiological environment. Int. J. Clin. Exp. Med. 2017, 10, 6369–6377. [Google Scholar]
- Janeček, M.; Nový, F.; Harcuba, P.; Stráský, J.; Trško, L.; Mhaede, M.; Wagner, L. The very high cycle fatigue behaviour of Ti-6Al-4V alloy. Acta Phys. Pol. A 2015, 128, 497–503. [Google Scholar] [CrossRef]
- Carrion, P.E.; Shamsaei, N.; Daniewicz, S.R.; Moser, R.D. Fatigue behavior of Ti-6Al-4V ELI including mean stress effects. Int. J. Fatigue 2017, 99, 87–100. [Google Scholar] [CrossRef] [Green Version]
- Carrion, P.E.; Shamsaei, N. Strain-based fatigue data for Ti-6Al-4V ELI under fully-reversed and mean strain loads. Data Br. 2016, 7, 12–15. [Google Scholar] [CrossRef] [Green Version]
- Baragetti, S. Notch corrosion fatigue behavior of Ti-6Al-4V. Materials (Basel) 2014, 7, 4349–4366. [Google Scholar] [CrossRef] [PubMed] [Green Version]
- Hosseini, S.; Limooei, M.B. Investigation of fatigue behaviour and notch sensitivity of Ti-6Al-4V. Appl. Mech. Mater. 2011, 80–81, 7–12. [Google Scholar] [CrossRef]
- Susmel, L. The theory of critical distances: A review of its applications in fatigue. Eng. Fract. Mech. 2008, 75, 1706–1724. [Google Scholar] [CrossRef]
- Lanning, D.B.; Nicholas, T.; Palazotto, A. The effect of notch geometry on critical distance high cycle fatigue predictions. Int. J. Fatigue 2005, 27, 10–12. [Google Scholar] [CrossRef]
- Yamashita, Y.; Ueda, Y.; Kuroki, H.; Shinozaki, M. Fatigue life prediction of small notched Ti-6Al-4V specimens using critical distance. Eng. Fract. Mech. 2010, 77, 1439–1453. [Google Scholar] [CrossRef]
- Sivaraman, K.; Chopra, A.; Narayan, A.I.; Balakrishnan, D. Is zirconia a viable alternative to titanium for oral implant? A critical review. J. Prosthodont. Res. 2018, 62, 121–133. [Google Scholar] [CrossRef]
- Niinomi, M. Fatigue characteristics of metallic biomaterials. Int. J. Fatigue 2007, 29, 992–1000. [Google Scholar] [CrossRef]
- Gehrke, S.A.; da Silva, P.M.P.; Guirado, J.L.C.; Delgado-Ruiz, R.A.; Dedavid, B.A.; Nagasawa, M.A.; Shibli, J.A. Mechanical behavior of zirconia and titanium abutments before and after cyclic load application. J. Prosthet. Dent. 2016, 116, 529–535. [Google Scholar] [CrossRef] [PubMed]
- Prados-Privado, M.; Bea, J.A.; Rojo, R.; Gehrke, S.A.; Calvo-Guirado, J.L.; Prados-Frutos, J.C. A New Model to Study Fatigue in Dental Implants Based on Probabilistic Finite Elements and Cumulative Damage Model. Appl. Bionics Biomech. 2017, 2017, 3726361. [Google Scholar] [CrossRef] [PubMed]
- Prados-Privado, M.; Prados-Frutos, J.C.; Manchón, Á.; Rojo, R.; Felice, P.; Bea, J.A. Dental implants fatigue as a possible failure of implantologic treatment: The importance of randomness in fatigue behaviour. Biomed Res. Int. 2015, 2015, 825402. [Google Scholar] [CrossRef] [PubMed] [Green Version]
- Motosh, N. Development of design charts for bolts preloaded up to the plastic range. J. Manuf. Sci. Eng. Trans. ASME 1976, 98, 849–951. [Google Scholar] [CrossRef]
- Houpert, L. An engineering approach to hertzian contact elasticity-part I. J. Tribol. 2001, 123, 582–588. [Google Scholar] [CrossRef]
- ASTM International ASTM E739-91. Standard Practice for Statistical Analysis of Linear or Linearized Stress-Life (S–N) and Strain-Life (e–N) Fatigue Data; ASTM: West Conshohocken, PA, USA, 2004. [Google Scholar]
- Budinski, K.G. Tribological properties of titanium alloys. Wear 1991, 151, 203–217. [Google Scholar] [CrossRef]
- Walker, K. The Effect of Stress Ratio During Crack Propagation and Fatigue for 2024-T3 and 7075-T6 Aluminum. In Effects of Environment and Complex Load History on Fatigue Life; ASTM: West Conshohocken, PA, USA, 1970. [Google Scholar]
- Dowling, N.E.; Calhoun, C.A.; Arcari, A. Mean stress effects in stress-life fatigue and the Walker equation. Fatigue Fract. Eng. Mater. Struct. 2009, 32, 163–179. [Google Scholar] [CrossRef]
Figure 1.
Assembly of a single dental implant restoration.

Figure 2.
Dental implant assembly composed by implant body, prosthetic screw and abutment.

Figure 3.
(a) Direct stress fatigue test bench INSTRON E 3000 Electroplus with a generic set-up (b) set-up for dental implant testing according to ISO 14801 [12].
Figure 3.
(a) Direct stress fatigue test bench INSTRON E 3000 Electroplus with a generic set-up (b) set-up for dental implant testing according to ISO 14801 [12].

Figure 4.
Finite Element model: (a) geometry, loads and boundary conditions (b) Mesh.

Figure 5.
Pin-on-disk test: (a) pin-on-disk tribometer MicroTest SMT-A/0200 (b) Detail view.

Figure 6.
F-N results of all experimental tests performed.

Figure 7.
Fatigue failure sections in the prosthetic screw: head failure (a) and thread failure (b).
Figure 7.
Fatigue failure sections in the prosthetic screw: head failure (a) and thread failure (b).

Figure 8.
(a) Crack section of the screw thread obtained through SEM (b) Detail of crack initiation.
Figure 8.
(a) Crack section of the screw thread obtained through SEM (b) Detail of crack initiation.

Figure 9.
F-N curves for the dental implants (screw thread failures) for the three tightening torques tested.
Figure 9.
F-N curves for the dental implants (screw thread failures) for the three tightening torques tested.

Figure 10.
Contact reactions in the screw head contact surface (section A) and fatigue failure section (section B).
Figure 10.
Contact reactions in the screw head contact surface (section A) and fatigue failure section (section B).

Figure 11.
Screw head contact forces (section A): (a) Axial force Fa (b) Transverse force Ft (c) Bending moment M.
Figure 11.
Screw head contact forces (section A): (a) Axial force Fa (b) Transverse force Ft (c) Bending moment M.

Figure 12.
Gap and sliding distance in the implant-abutment contact under F = 400 N for a preload of: (a) 350 Nmm (b), 250 Nmm (c) 150 Nmm.
Figure 12.
Gap and sliding distance in the implant-abutment contact under F = 400 N for a preload of: (a) 350 Nmm (b), 250 Nmm (c) 150 Nmm.

Figure 13.
Forces in the screw thread section (section B): (a) Axial force Fa (b) Bending moment M.

Figure 14.
FE analyses to assess the parameters in Equation (2): (a) Axial case to calculate A; (b) Bending case to calculate I.
Figure 14.
FE analyses to assess the parameters in Equation (2): (a) Axial case to calculate A; (b) Bending case to calculate I.

Figure 15.
Nominal normal stress (with axial and bending components) in the screw thread according to Equation (2).
Figure 15.
Nominal normal stress (with axial and bending components) in the screw thread according to Equation (2).

Figure 16.
Mean and alternating components of the nominal stress in the screw thread according to Equation (2).
Figure 16.
Mean and alternating components of the nominal stress in the screw thread according to Equation (2).

Figure 17.
Haigh diagram and Walker fitting curves.


Table 1.
Chemical composition of materials used in implant and prosthetic component manufacturing process.
Table 1.
Chemical composition of materials used in implant and prosthetic component manufacturing process.
| Ti 6Al 4V ELI (TI GR5) | TI CP4 | ||
|---|---|---|---|
| Composition | Wt. % | Composition | Wt. % |
| Al | 5.5–6.5 | N(max) | 0.05 |
| V | 3.5–4.5 | C(max) | 0.08 |
| Fe(max) | 0.25 | Fe(max) | 0.5 |
| O(max) | 0.13 | O(max) | 0.4 |
| C(max) | 0.08 | H(max) | 0.0125 |
| N(max) | 0.05 | - | - |
| H(max) | 0.012 | - | - |
Table 2.
Values of friction coefficients measured in the pin-on-disk test.
| Friction Coef. in Implant-Abutment | Friction Coef. in Screw | ||
|---|---|---|---|
| Test Number | Friction Coefficient | Test Number | Friction Coefficient |
| 1 | 0.220 | 1 | 0.162 |
| 2 | 0.208 | 2 | 0.237 |
| 3 | 0.237 | 3 | 0.151 |
| 4 | 0.189 | 4 | 0.134 |
| 5 | 0.196 | 5 | 0.175 |
| 6 | 0.197 | 6 | 0.162 |
| 7 | 0.201 | 7 | 0.237 |
| 8 | 0.224 | - | - |
| 9 | 0.181 | - | - |
| Mean value: | 0.21 | Mean value: | 0.17 |
| Std Dev: | 0.02 | Std Dev: | 0.04 |
Table 3.
Screw tightening torque preload relationships according to Equation (1).
| Screw Tightening Torque TT | Screw Preload Fp |
|---|---|
| 350 Nmm | 814 N |
| 250 Nmm | 581 N |
| 150 Nmm | 349 N |
© 2020 by the authors. Licensee MDPI, Basel, Switzerland. This article is an open access article distributed under the terms and conditions of the Creative Commons Attribution (CC BY) license (http://creativecommons.org/licenses/by/4.0/).
Share and Cite
MDPI and ACS Style
Armentia, M.; Abasolo, M.; Coria, I.; Albizuri, J. Fatigue Design of Dental Implant Assemblies: A Nominal Stress Approach. Metals 2020, 10, 744. https://doi.org/10.3390/met10060744
AMA Style
Armentia M, Abasolo M, Coria I, Albizuri J. Fatigue Design of Dental Implant Assemblies: A Nominal Stress Approach. Metals. 2020; 10(6):744. https://doi.org/10.3390/met10060744
Chicago/Turabian StyleArmentia, Mikel, Mikel Abasolo, Ibai Coria, and Joseba Albizuri. 2020. "Fatigue Design of Dental Implant Assemblies: A Nominal Stress Approach" Metals 10, no. 6: 744. https://doi.org/10.3390/met10060744
Note that from the first issue of 2016, this journal uses article numbers instead of page numbers. See further details here.