Article

Spatial-Monthly Variations and Influencing Factors of Dissolved Oxygen in Surface Water of Zhanjiang Bay, China

1
College of Ocean and Meteorology, Guangdong Ocean University, Zhanjiang 524088, China
2
Guangdong Province Key Laboratory for Coastal Ocean Variation and Disaster Prediction, Guangdong Ocean University, Zhanjiang 524088, China
3
Marine Environmental Monitoring Center of Beihai, State Oceanic Administration, Beihai 536000, China
4
Institute of Marine Science, Shantou University, Shantou 515063, China
*
Author to whom correspondence should be addressed.
J. Mar. Sci. Eng. 2020, 8(6), 403; https://doi.org/10.3390/jmse8060403
Submission received: 9 May 2020 / Revised: 30 May 2020 / Accepted: 31 May 2020 / Published: 2 June 2020
(This article belongs to the Special Issue Marine Observation and Monitoring towards an Ecosystem Approach)

Abstract

:
Dissolved oxygen (DO) is one of the most important factors for maintaining a healthy marine ecosystem. The information of DO in large estuaries or bays with large entrances has been widely studied, while it is relatively limited for a bay with a narrow entrance which is vulnerable to human activities. The Zhanjiang Bay, located in the northwestern South China Sea, has a very narrow entrance and suffers from strong anthropogenic activities and obvious seasonal variations in environmental parameters. In this study, we analyzed the spatial and monthly variations of DO, apparent oxygen utilization (AOU), percent oxygen saturation (DO-saturation), and related environmental parameters in the surface water of Zhanjiang Bay to find out the factors controlling the dynamics of DO. Different from many other coastal ecosystems, DO concentrations in the Zhanjiang Bay reached minimum values in late spring and early autumn. The phytoplankton bloom in summer months, which was related to the high concentrations of nutrients brought by rainfall-induced terrestrial inputs, contributed to that phenomenon. Though high chlorophyll a (Chl a) concentrations were observed in both the summer months and December, the DO-saturation values were relatively low and AOU values were relatively high in summer months. Rainfall-induced terrestrial discharge in summer months, which had high concentrations of chemical oxygen demand, contributed much to that phenomenon. The average DO concentrations and DO-saturation values in a hydrological year decreased seaward, and AOU values increased seaward, indicating the anthropogenic influence from terrestrial input. The highest annual average Chl a concentration, relatively high annual average DO-saturation value and relatively low annual AOU value were observed near the Donghai Dam. This indicated that the construction of Donghai Dam has significant influences on the environment of Zhanjiang Bay.

1. Introduction

Dissolved oxygen (DO) is essential for the survival of almost all aquatic organisms. It is one of the most important factors for maintaining a healthy marine ecosystem [1,2]. The seasonal variations of DO are important for environment management [3]. DO depletion has seasonal variation characteristics, which depends on the interplay of different DO drivers [4,5]. In the open sea, the variations of DO are mainly controlled by the interactions of phytoplankton primary production, organic matter degradation, water temperature, as well as the dissolution of oxygen from the air. In the coastal areas, the influencing factors of DO are more complex. Besides the influencing factors of DO for the open sea, river discharge, anthropogenic activities, geomorphologic features and environment changes make the variations of DO in coastal waters more complex [3,4,6]. In the Deep Bay, Hong Kong, low DO concentrations were observed in summer when the water temperature was high [7]. This is because high water temperature can decrease the solubility of DO and elevate bacterial respiration rates [7]. The DO concentrations for the water of Sanya Bay, Hainan showed a different seasonal variation pattern from that of the Deep Bay [6]. Xu et al. [6] found that the lowest DO concentration in the Sanya Bay appeared in autumn, which was related to the upwelling in this area.
The information of DO in large estuaries or bays with large entrances has been widely studied [3,6]. However, the investigations on the spatial and temporal variation of DO in the bay with a narrow entrance which is vulnerable to human activities are rare. We think this issue is of primary importance for marine ecosystem studies. The Zhanjiang Bay (ZJB) is a semi-enclosed bay with a very narrow entrance (less than 2 km). It suffers strong influences of anthropogenic activities such as sewage input, mariculture activities and dredging [8,9]. Sewage input and mariculture activities may bring large amounts of organic matter into ZJB, which may consume much oxygen through decomposition. Besides, ZJB has obvious seasonal variations in environmental parameters such as rainfall, chlorophyll a (Chl a) and water temperature [10,11]. The study of DO in ZJB can benefit the understanding of the combined effects of anthropogenic activities, environmental changes and geomorphologic features on the dynamics of DO in this area.
In this study, we report the spatial-monthly variations of DO in the surface water of ZJB. This study aims to analyze the dynamics of DO and related parameters such as rainfall, water temperature, salinity, chemical oxygen demand (COD), nutrients and Chl a, and try to understand the effects of anthropogenic activities, environmental changes and geomorphologic features on the dynamics of DO in ZJB for future management.

2. Materials and Methods
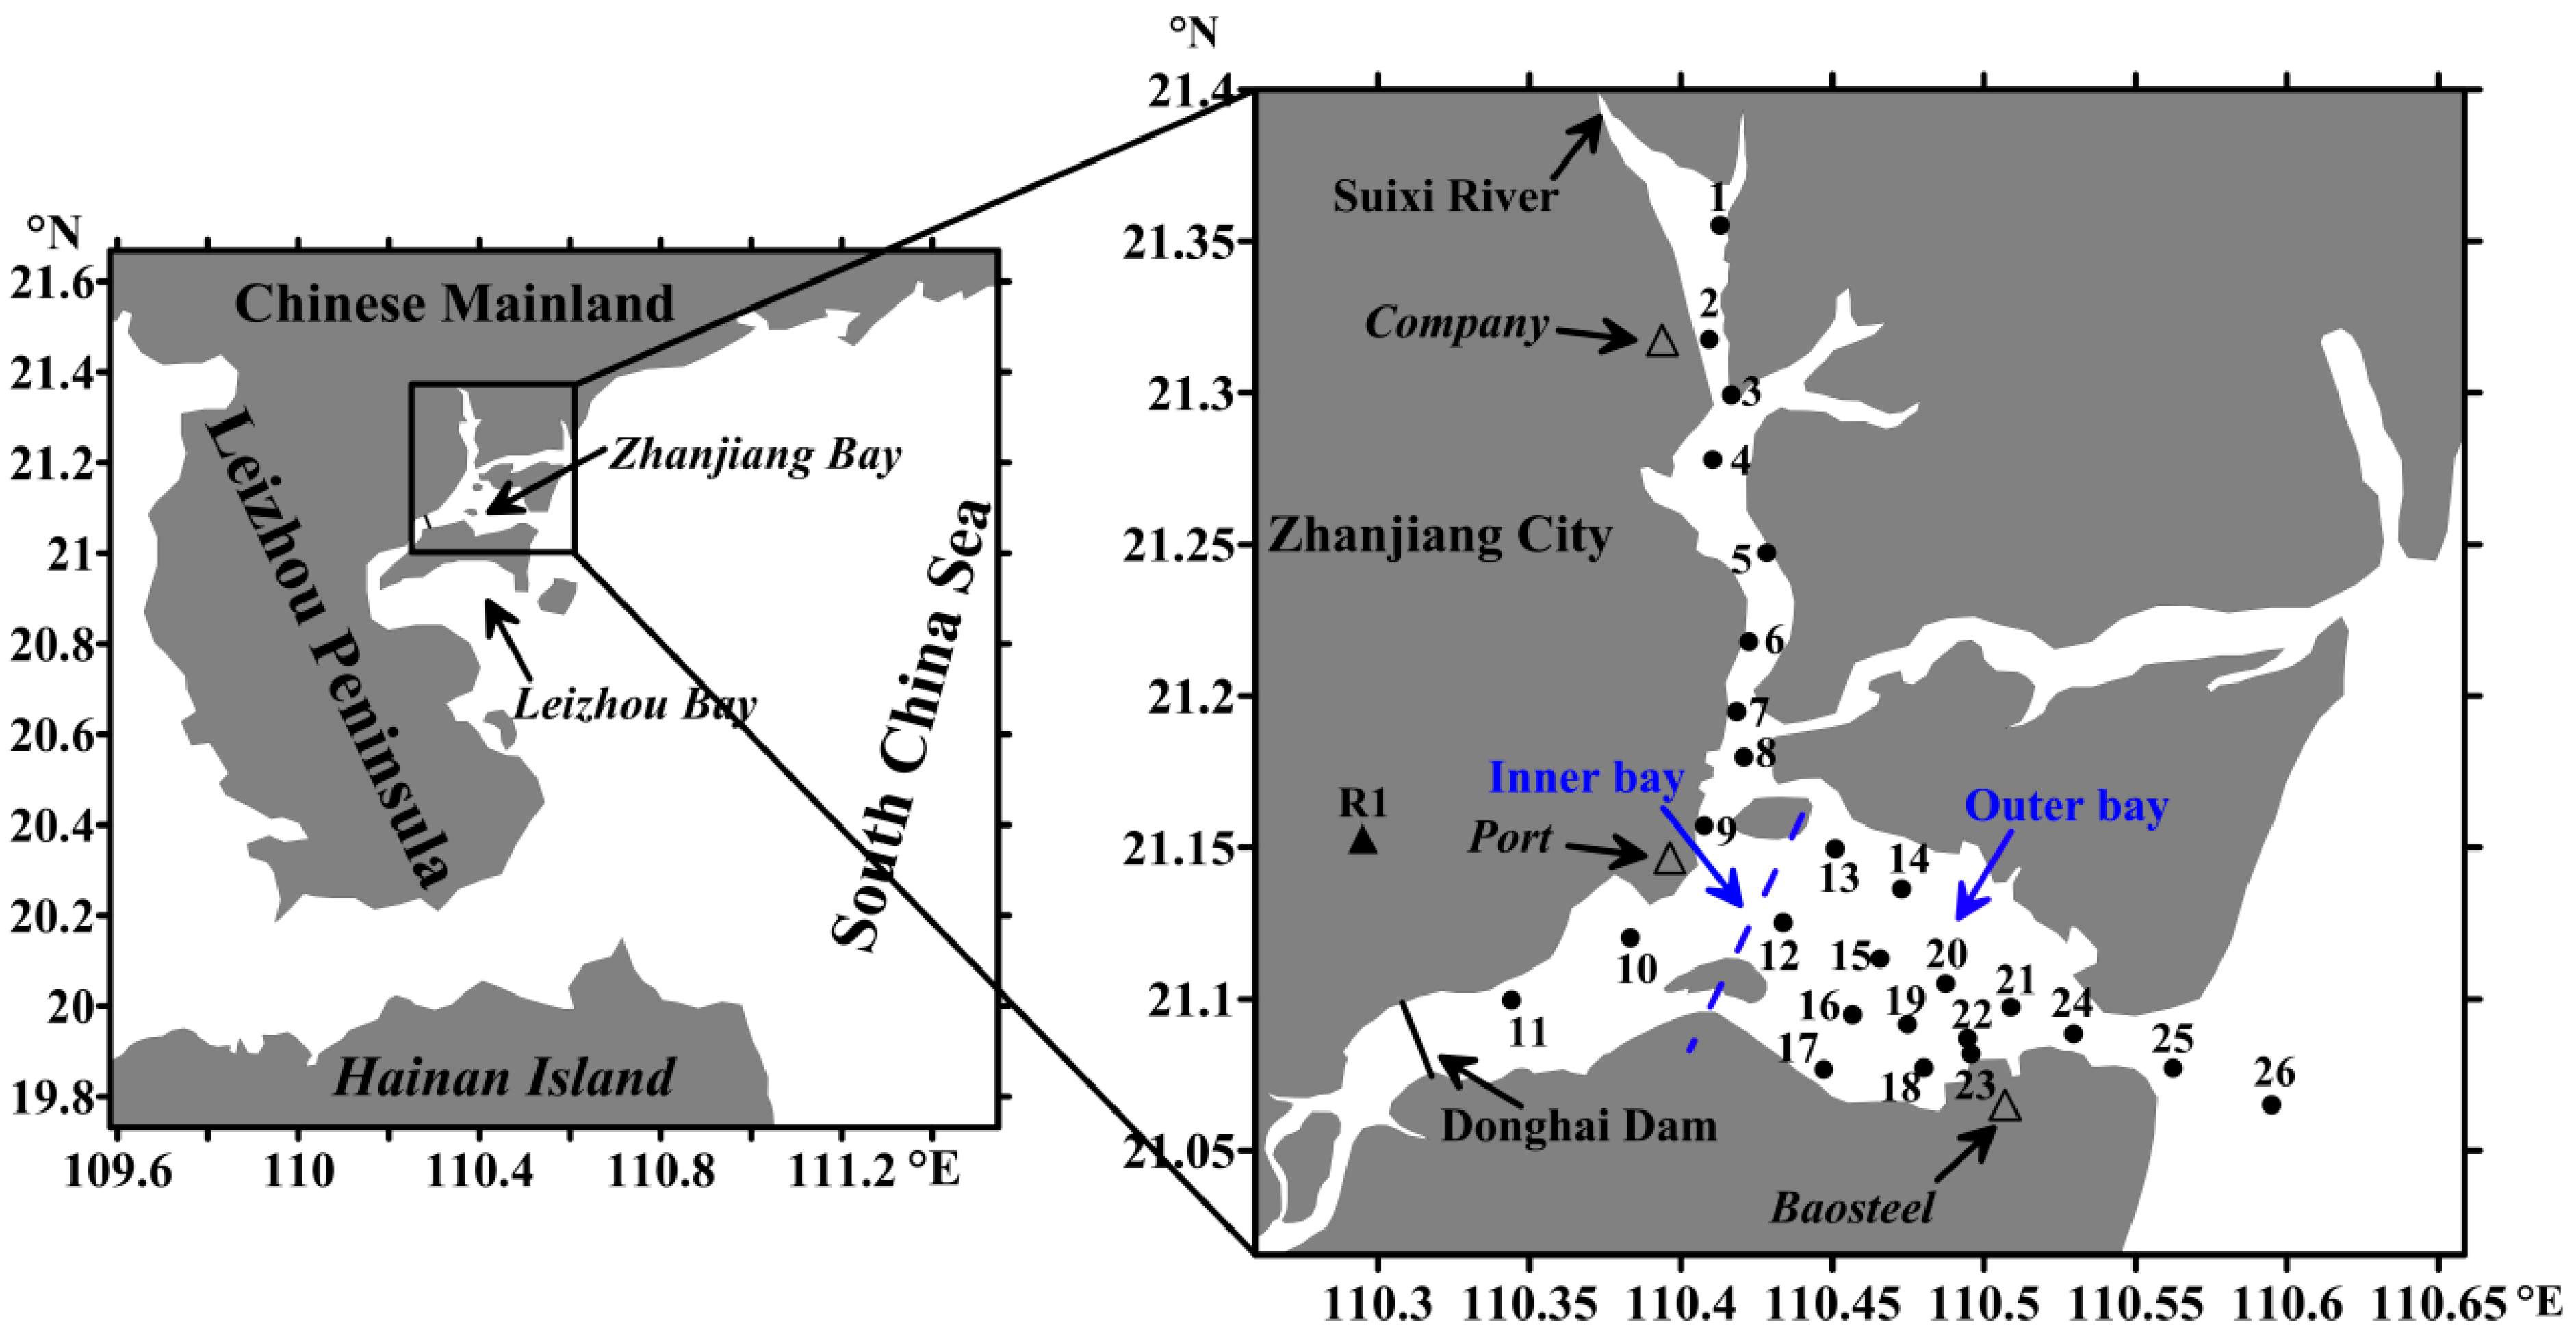
2.1. Study Area

ZJB is located in the northwestern South China Sea (Figure 1). It is a semi-closed bay with a narrow entrance (< 2 km). The water depth in ZJB is generally less than 50 m. The Suixi River is the main river that discharges into ZJB (Figure 1). Zhanjiang City, located at the northwestern coast of ZJB (Figure 1), has a population of 7.3 million. ZJB has a subtropical oceanic monsoon climate. Rainfall in this area is higher in summer and lower in winter. The water temperature of ZJB varies seasonally, with an average of 29 °C in spring and 31 °C in summer [11]. The annual average tidal range of ZJB is 3.12 m. Before 1958, ZJB and Leizhou Bay were connected. After the construction of the Donghai dam (Figure 1), the connection of ZJB and Leizhou Bay was cut off (Figure 1). The study of Li [12] indicated that the construction of the Donghai Dam created sluggish water circulation in the northwestern region of ZJB.

2.2. Sample Collection and Analysis

Monthly sampling was conducted in ZJB during 2017. Figure 1 shows the sampling stations in the ZJB. The stations were grouped into two sections: the inner bay (Stations 1–11) and the outer bay (Stations 12–26) (Figure 1). The year was divided into four seasons: winter (December, January and February), spring (March to May), summer (June to August), and autumn (September to November). Water samples were collected at the surface (1 m below the surface) at each station using a plexiglass water sampler. Water samples were accomplished by sequentially sampling water as it moved downstream every month. Water temperature and salinity were measured by a conductivity-temperature-depth (CTD) meter (SBE911, Seabird). Water samples were collected for the measurements of DO, inorganic nutrients (NO3-N, NO2-N, NH4-N, PO4-P and SiO3-Si), COD and Chl a.
DO was determined by the Winkler method [13]. The water samples for DO analysis were collected first. Water from the plexiglass water sampler was slowly drained into brown glass bottles and allowed to overflow for several minutes. Manganous sulphate and alkaline iodide solutions were then added. Titration was conducted in laboratory within 24 h after taking the sample. Water samples for Chl a analysis were filtered by glass-fiber filters (Whatman, 0.7 μm, GF/F) immediately after collection. The filters were then stored at −20 °C before laboratory analysis. In laboratory, Chl a was extracted with 90% acetone and measured using a Turner fluorometer [14]. Water samples for nutrient analysis were immediately filtered through acid cleaned 0.45-μm acetate cellulose filters. The filtrates were collected in pre-cleaned polyethylene bottles and stored at −20 °C until laboratory analysis. Nutrients were determined using the Skalar San++ continuous flow analyzer. COD concentration was measured by alkalic potassium permanganate [13].
Rainfall for the ZJB in 2017 was measured at the coastal area of the bay. The sampling site R1 (Figure 1) was located on the roof of a building, which has a linear distance of approximately 4 km to the nearest coastline of ZJB. Almost all the rain events were considered except the case when the rainfall amount was <0.5 mm. In all, 77 atmospheric wet deposition samples were collected from January to December 2017.

2.3. Statistical Analysis

The relationships among DO and related data were analyzed by Pearson’s correlation analysis and principal component analysis. Apparent oxygen utilization (AOU) and percent oxygen saturation (DO-saturation) are also the measures of the change in DO concentrations. AOU is calculated as the difference between the saturated DO concentration and the observed DO concentration. DO-saturation is calculated by dividing the saturated DO concentration by observed DO concentration. The saturated DO concentration is calculated according to Benson and Krause [15].

3. Results

Due to the logistics problems, some data related to salinity, water temperature, Chl a and DO were not available in January, February and March. The information related to these data is not discussed in the following section.

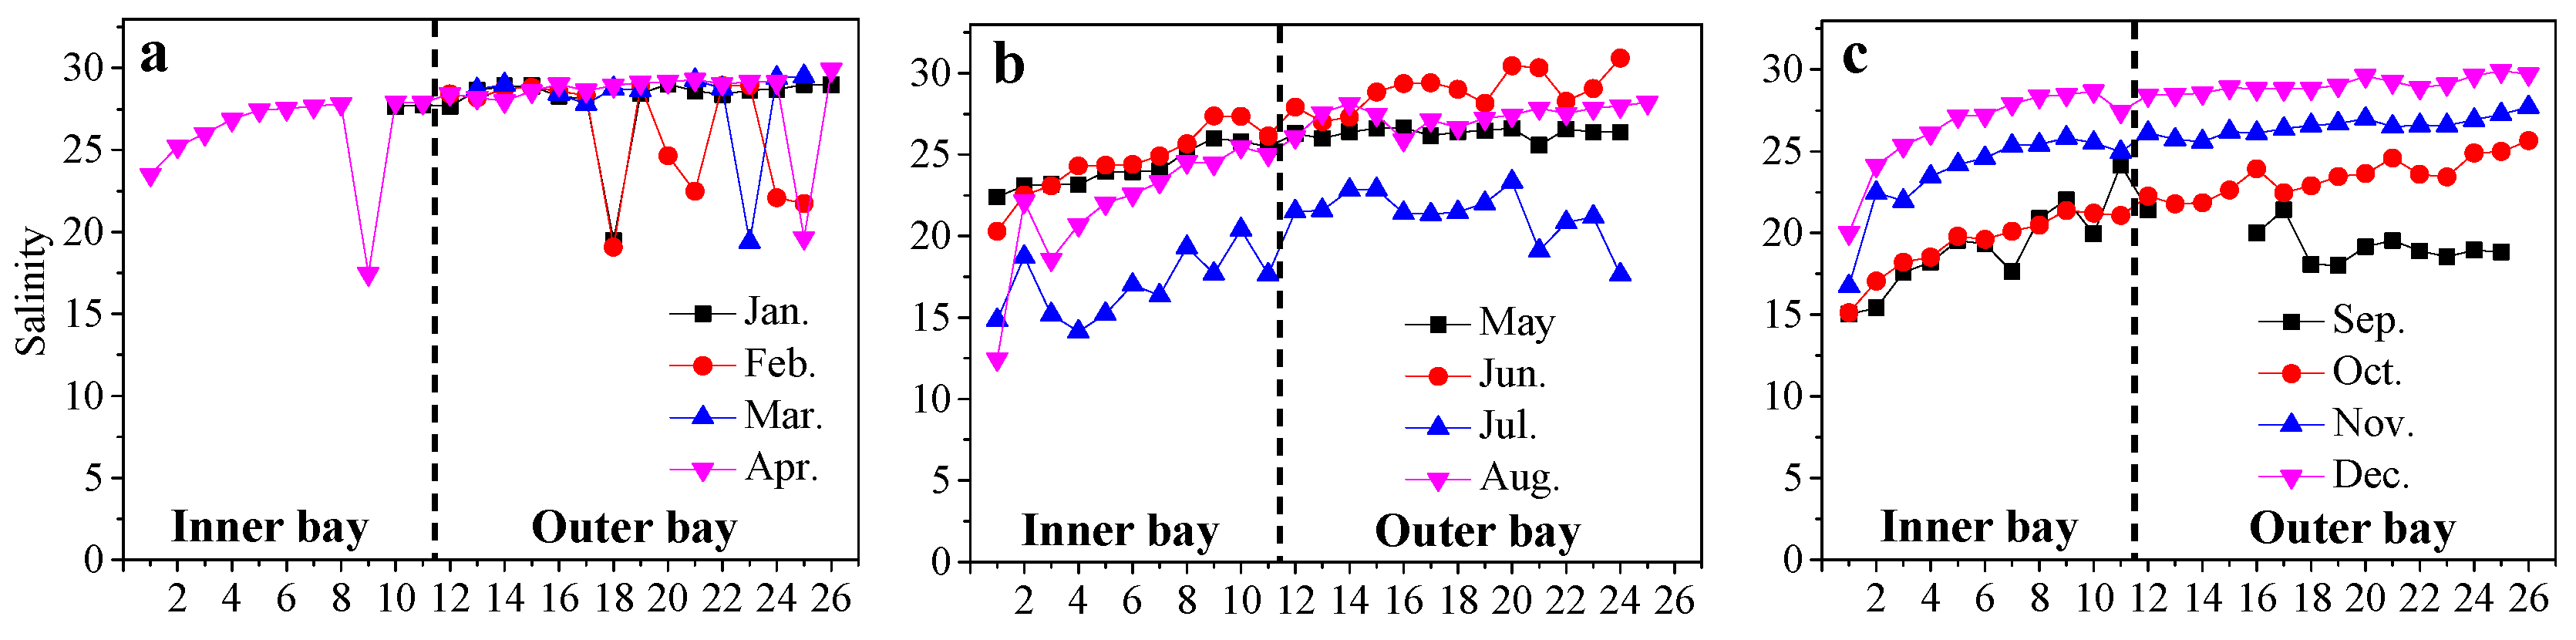
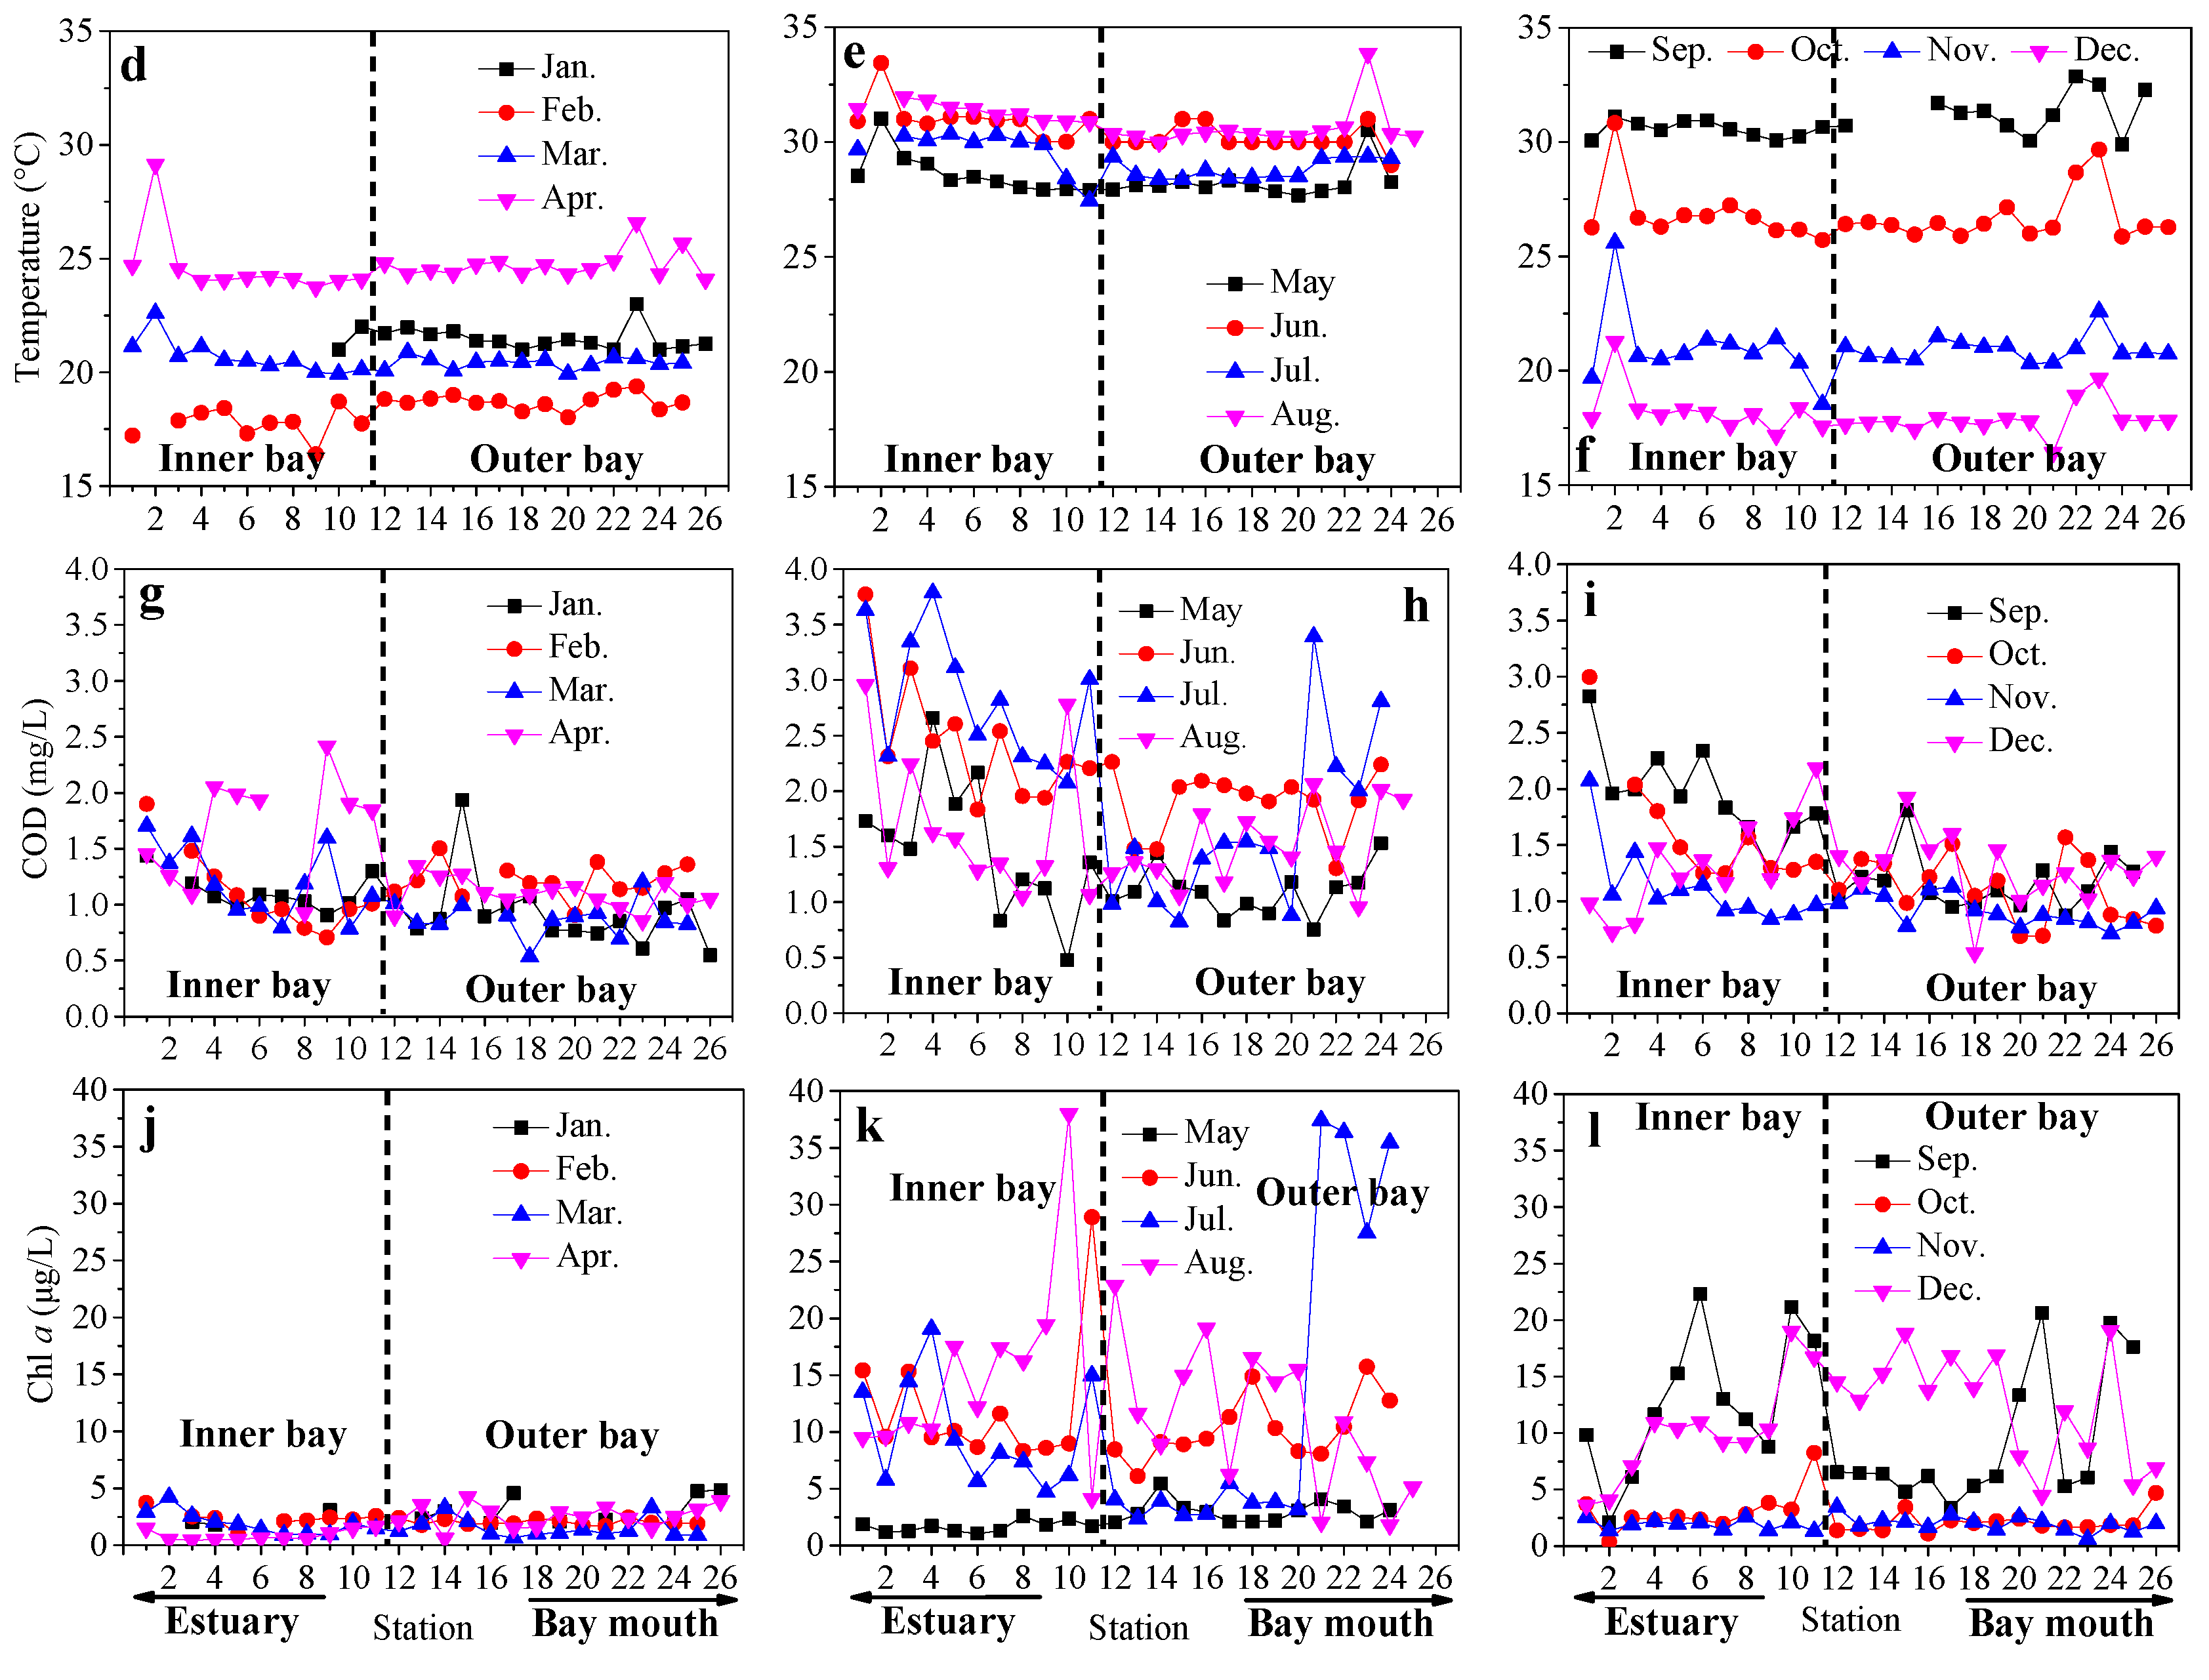
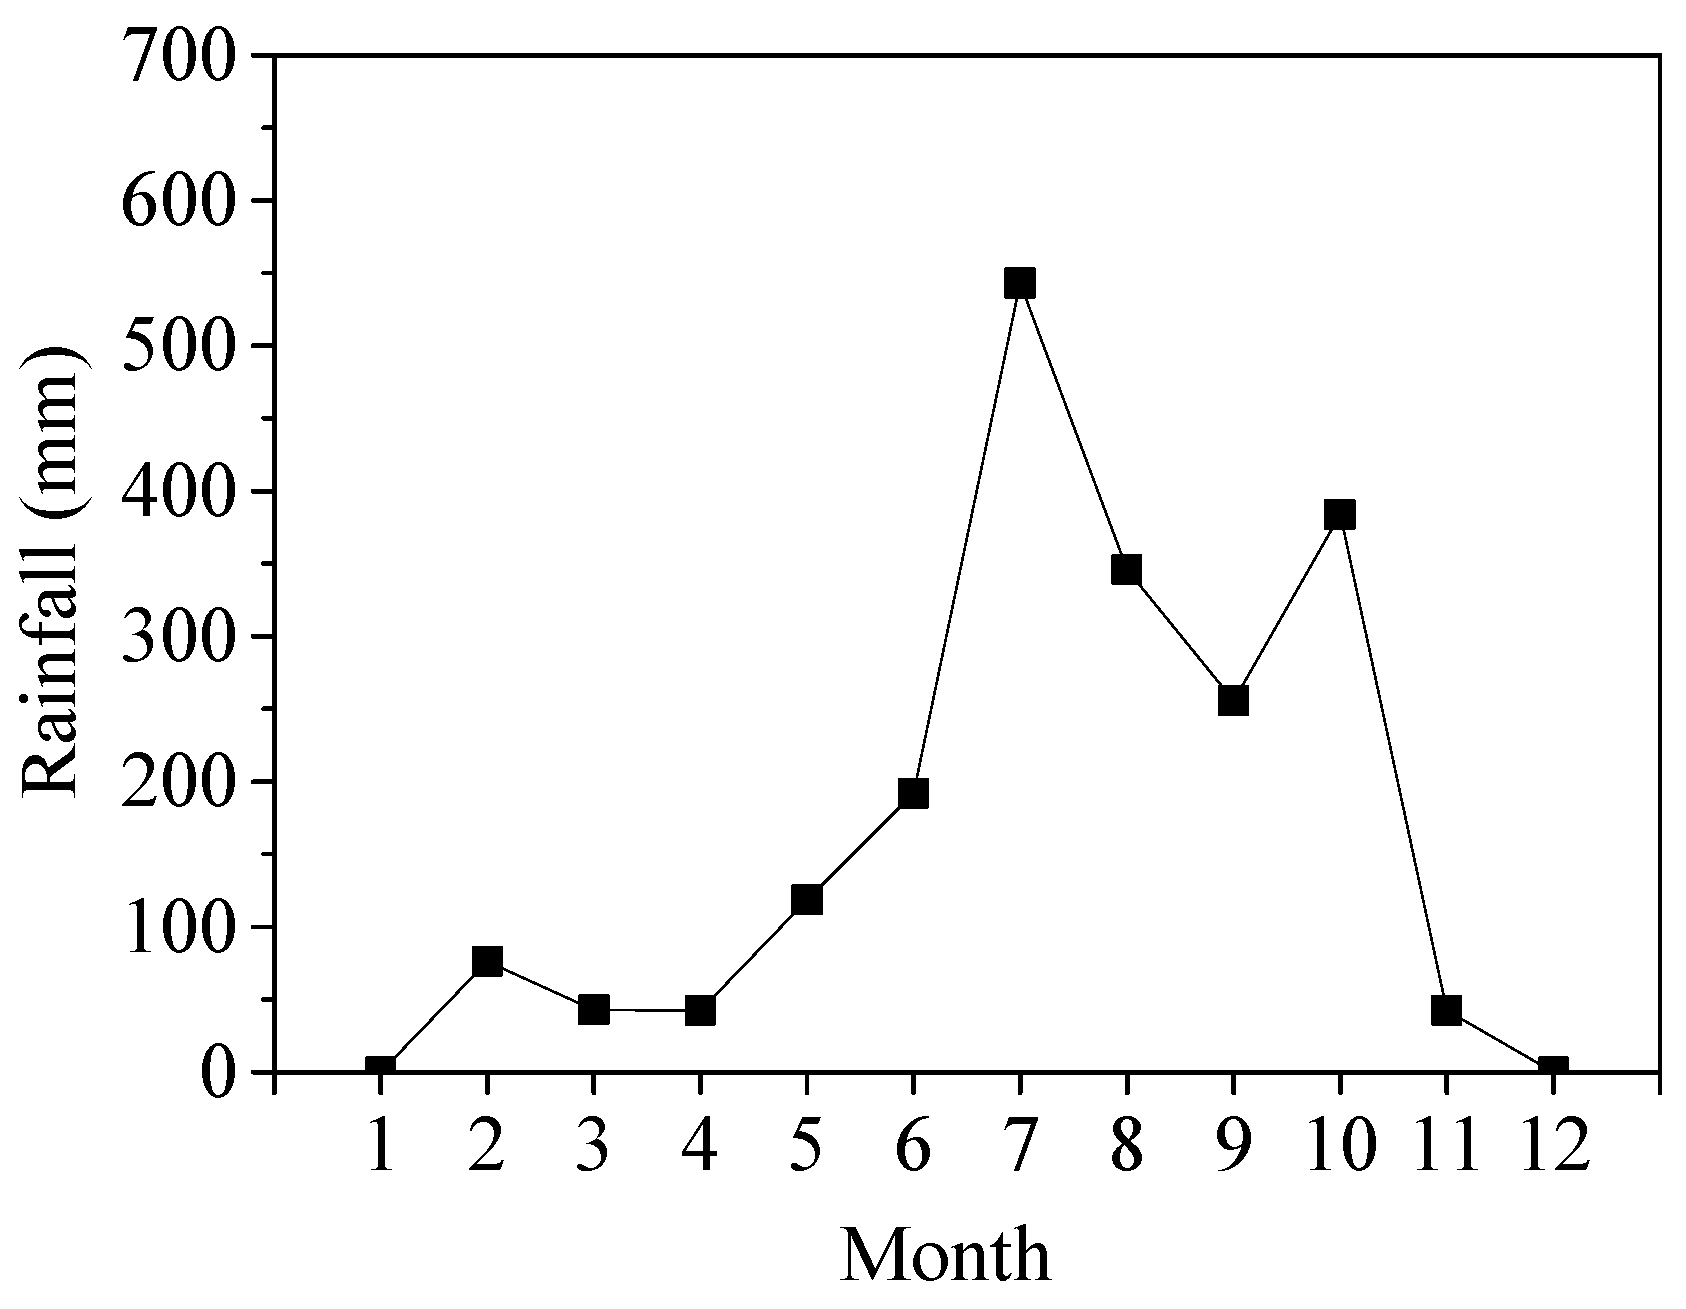
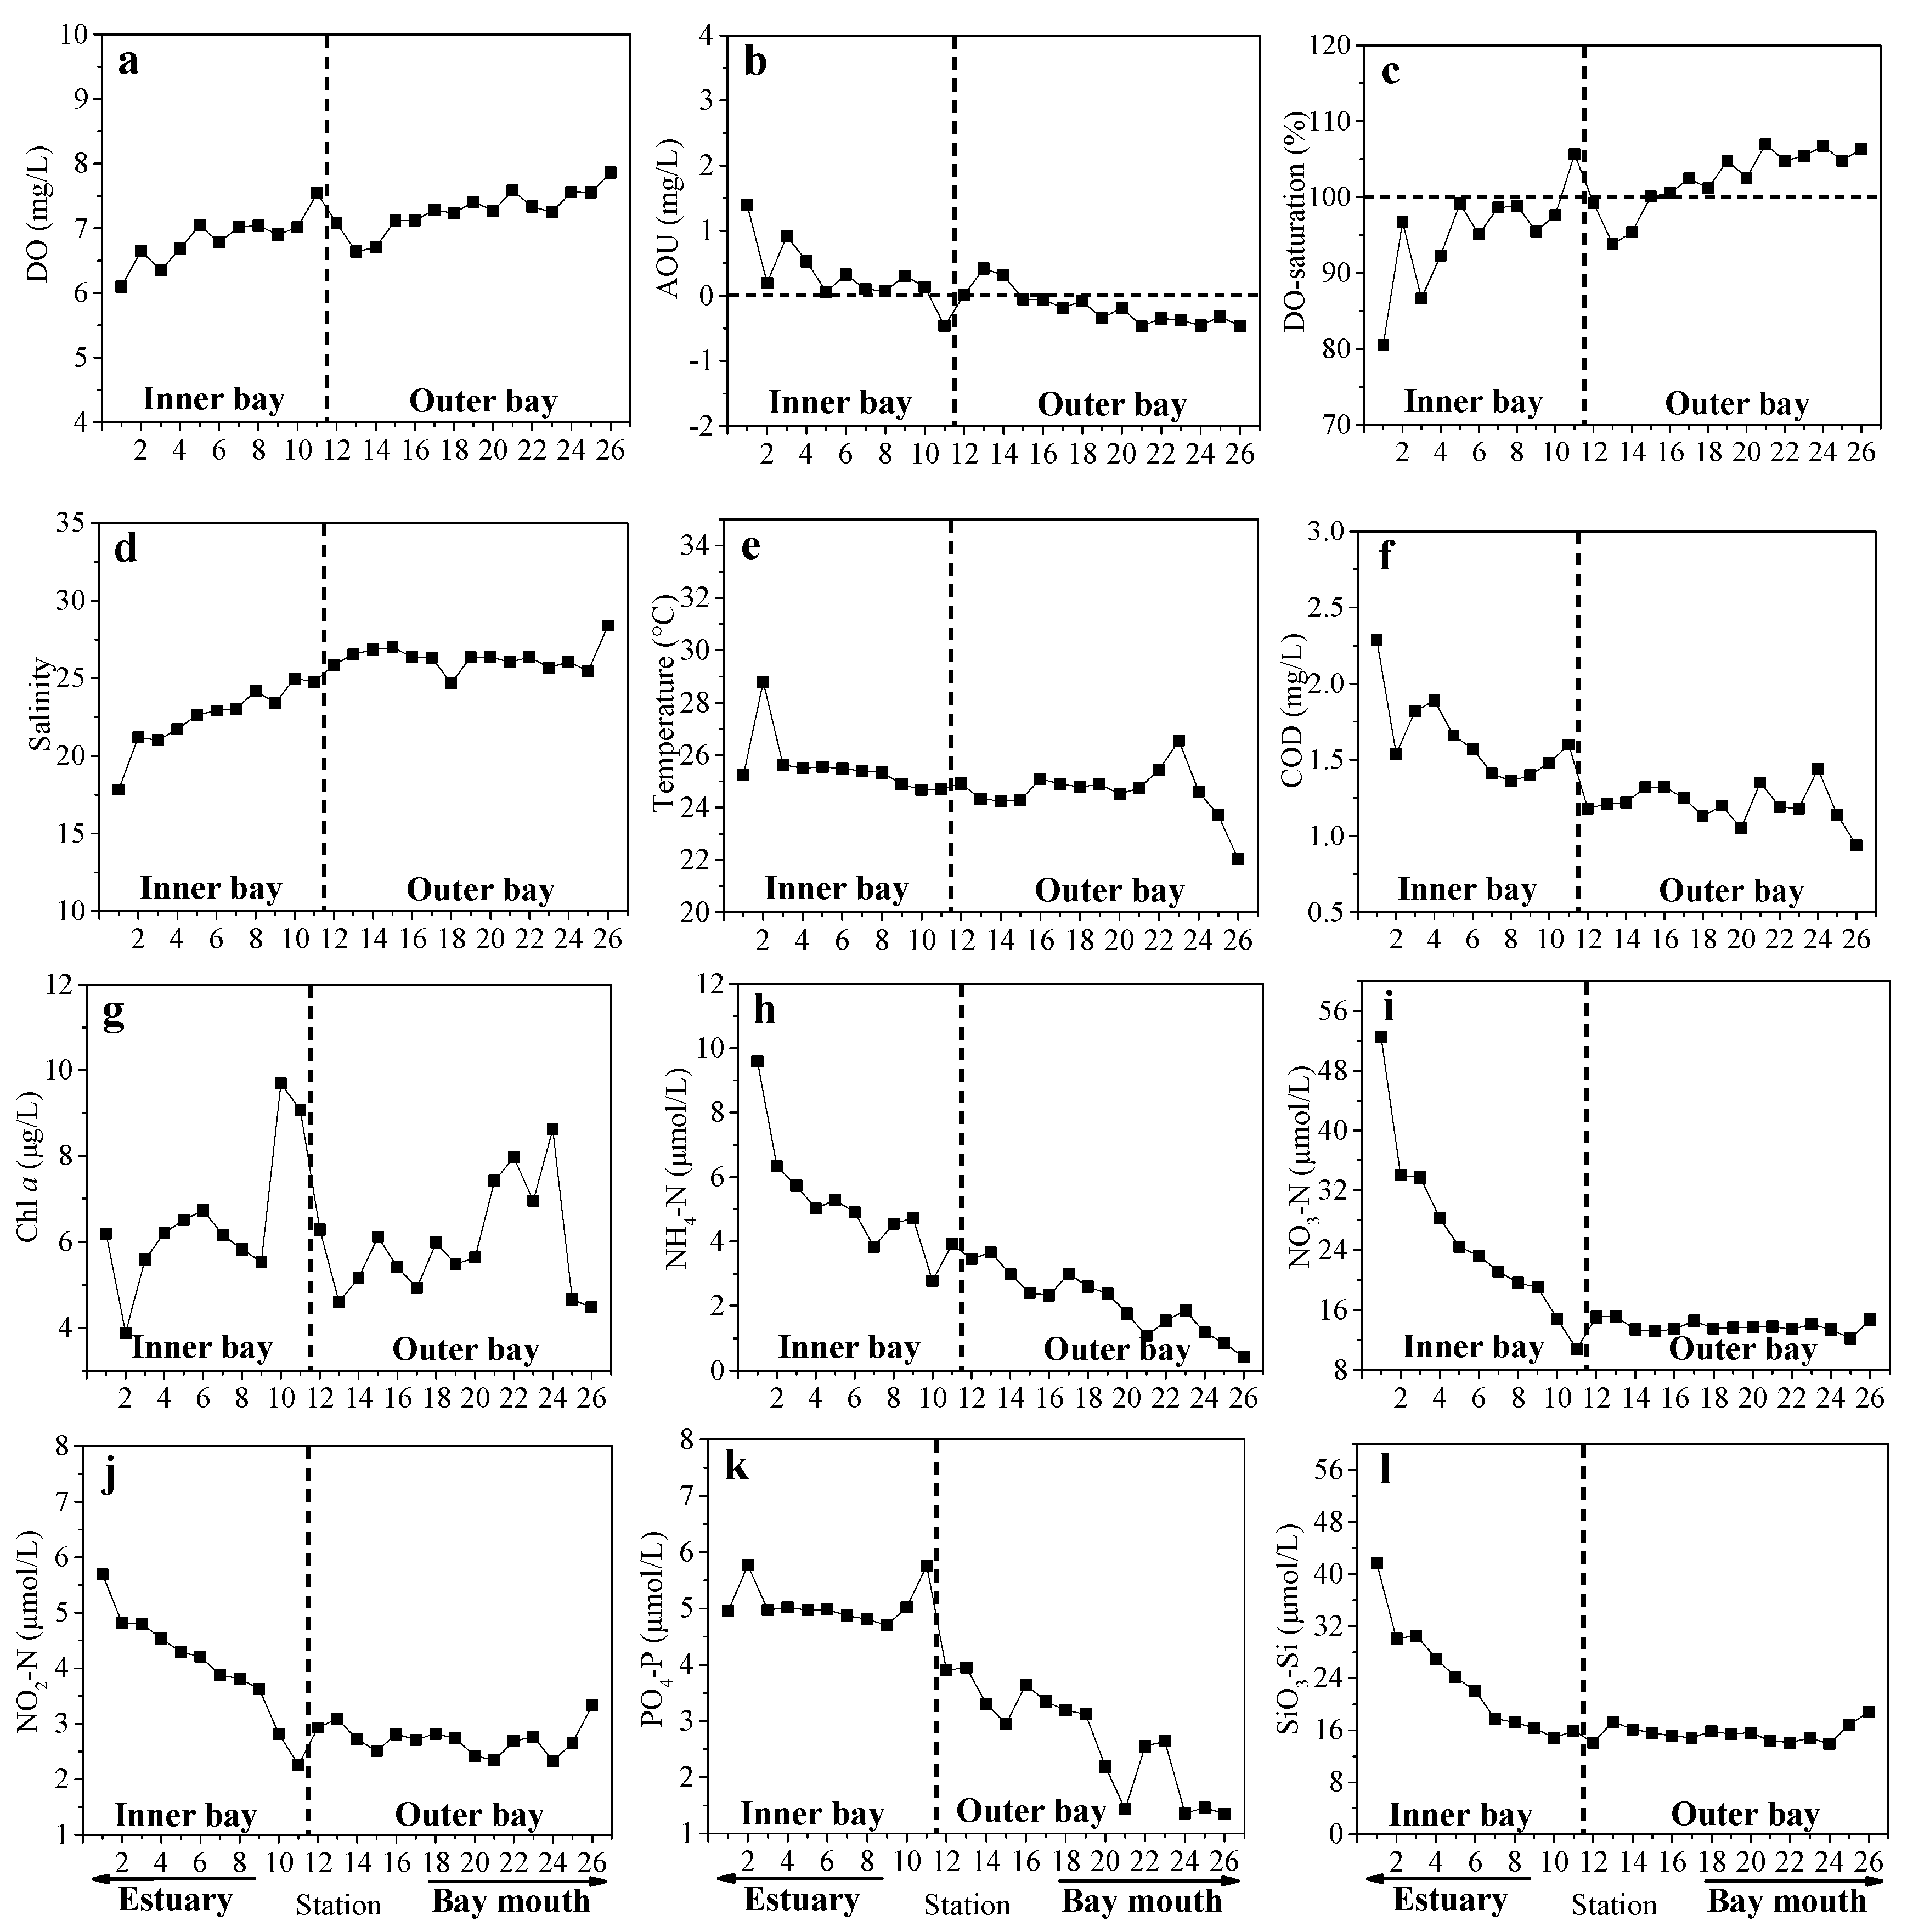
3.1. General Characteristics of Salinity, Rainfall, Temperature and COD

Figure 2 shows the spatial distributions of salinity, water temperature, COD and Chl a in each month. The salinity in ZJB varied from 12.4 to 30.9 during the sampling period (Figure 2a–c). Relatively low salinity usually occurred in the inner bay due to the discharge of the Suixi River (Figure 1; Figure 2a–c). The mixing of terrestrial water with seawater resulted in the increase of salinity from the inner bay to the bay mouth in most months (Figure 2a–c). The salinity anomaly at some stations may be related to the discharge from factories and sewage outlets around Zhanjiang Bay. Relatively low salinity was observed in July and September (average of 19.32 in July and average of 19.21 in September; Figure 2a–c), which may be related to the heavy rainfall in these two months. Figure 3 shows the temporal variation of rainfall in 2017 in ZJB. Clearly, high rainfall was observed in summer (June to August) and early and mid-autumn months (September and October). A significantly negative correlation was found between monthly average salinity and monthly rainfall (r = −0.693, p < 0.05, n = 12). This indicated that rainfall contributed much to the temporal variation of salinity in ZJB. Based on the spatial-temporal variations of salinity, we conclude that the influence of rainfall on ZJB was mainly through increasing river discharge.
The surface water temperature in ZJB exhibited no obvious spatial trend (Figure 2d–f). Relatively high water temperature was observed at Stations 2, 22 and 23 in most months. This may be related to the warm water discharged by the nearby industrial company (Figure 1). Excluding Station 23, the water temperatures in the inner bay were slightly higher than those in the outer bay in summer months (June to August), with an average of 30.6 °C in the inner bay and an average of 29.7 °C in the outer bay) (Figure 2e). In September (early autumn), water temperature in the outer bay was slightly higher than that in the inner bay (average of 30.6 °C in the inner bay and average of 31.3 °C in the outer bay) (Figure 2f). These spatial distribution patterns were related to the change of solar radiation. In summer months (June to August), the temperature of land runoff is higher than that of the ocean, because the land warms up faster than the ocean. Therefore, water temperature in the inner bay, which had relatively high percentages of water from land runoff, was higher than that in the outer bay. In September (early autumn) solar radiation decreases. The temperature of land decreases faster than that of the ocean, because the specific heat capacity of land is smaller than that of the ocean. Therefore, water temperature in the outer bay in September was slightly higher than that in the inner bay. The seasonal variations of water temperature were obvious. Surface water temperature in ZJB was higher in summer months and lower in winter months (Figure 2d–f).
COD is an effective indicator of organic matter content in water [16]. In most months, COD concentrations generally decreased seaward, indicating the influence of terrestrial input (Figure 2g–i). The COD concentrations were relatively high in the summer months (Figure 2g–i). A significantly positive correlation was found between monthly average COD and monthly rainfall (r = 0.699, p < 0.05, n = 12). This indicated that high rainfall could result in strong terrestrial runoff, which could bring large amounts of COD into the ZJB.

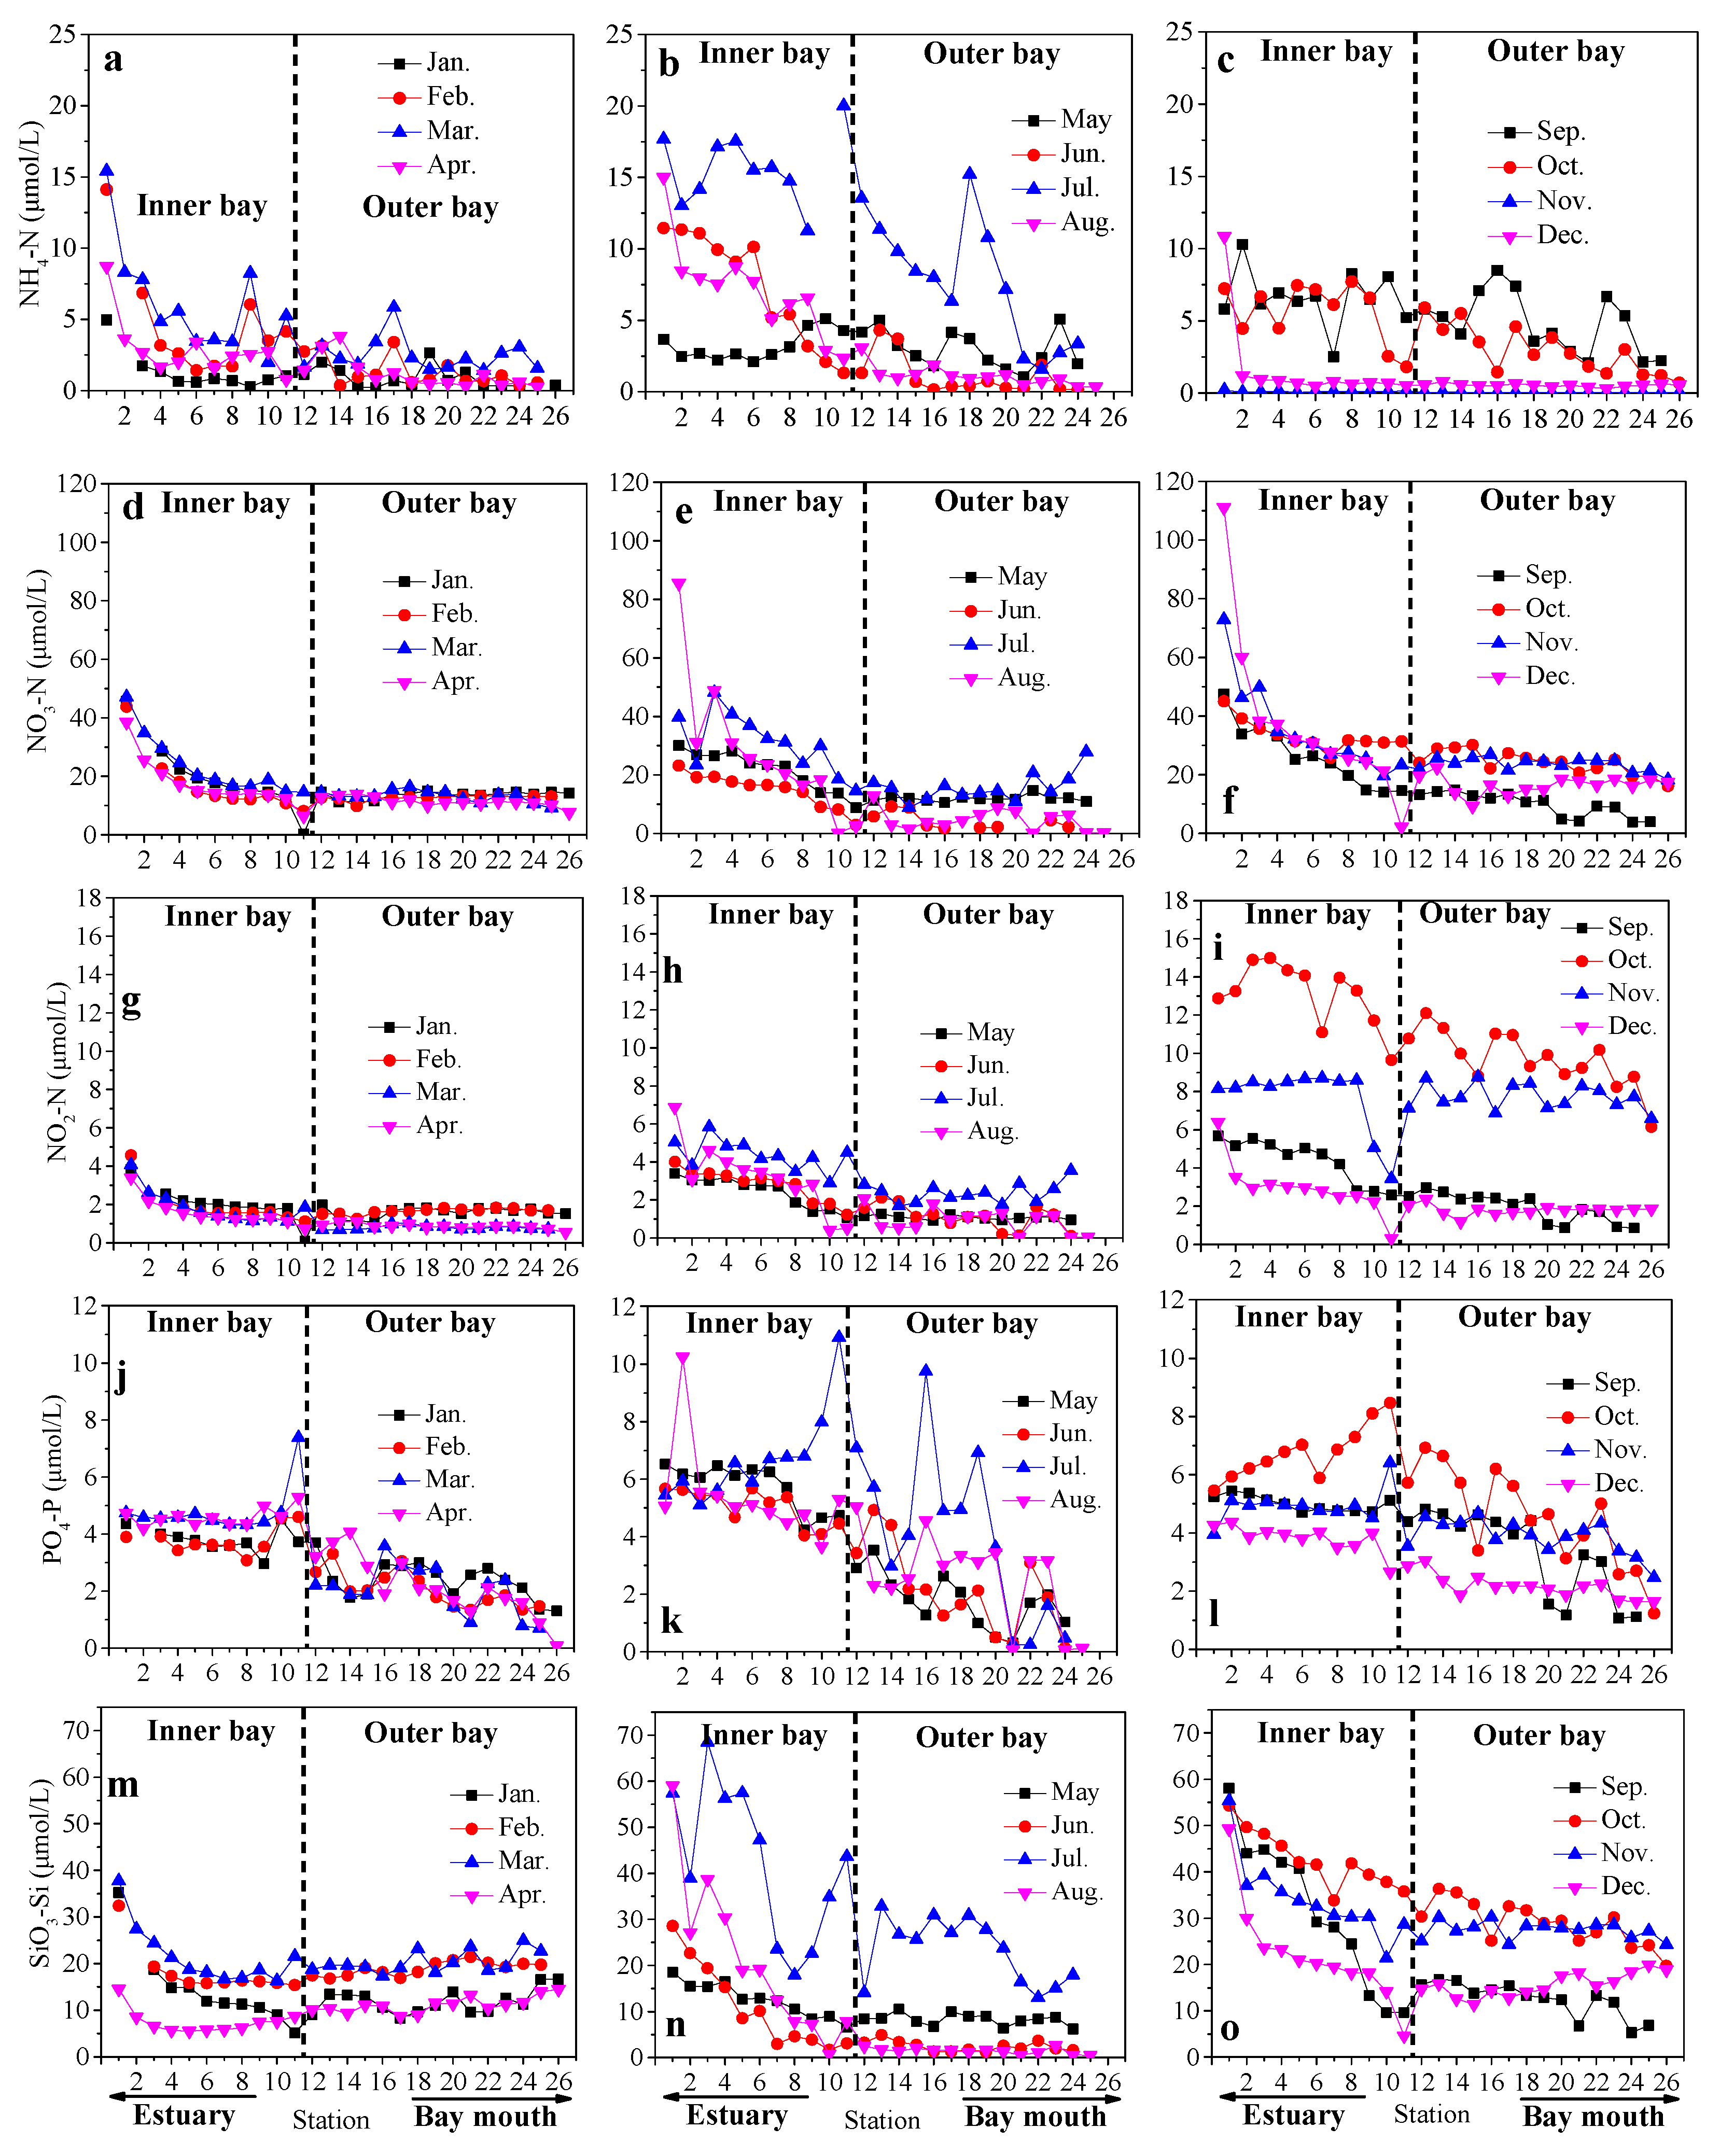
3.2. General Characteristics of Chl a and Nutrients

Chl a concentration is a good indicator of eutrophication level. No obvious spatial distribution pattern was found for Chl a in ZJB (Figure 2g–l). In the months of June, July, August, September and December, Chl a concentrations were generally higher than 3 μg/L (Figure 2g–l). In other months, Chl a concentrations were generally lower than 3 μg/L (Figure 2g–l). These results indicated that phytoplankton bloom in the surface water of ZJB occurred twice during the sampling period: once in summer and early autumn months and once in a winter month.
The distribution pattern of NH4-N, NO3-N, NO2-N, PO4-P and SiO3-Si were similar, generally decreasing from the Suixi River estuary to the ZJB mouth in most months (Figure 4). Terrestrial input contributed much to the spatial distribution pattern of these nutrients. Monthly average NH4-N was highest in July when the rainfall was highest (Table 1; Figure 3), indicating the strong influence of rainfall-induced terrestrial inputs. The monthly average NO2-N, NO3-N, PO4-P and SiO3-Si were not only high in July (mid summer), but also high in autumn months (September to November) (Table 1). This indicated that besides rainfall, other processes also contributed much to the temporal variation of these nutrients.

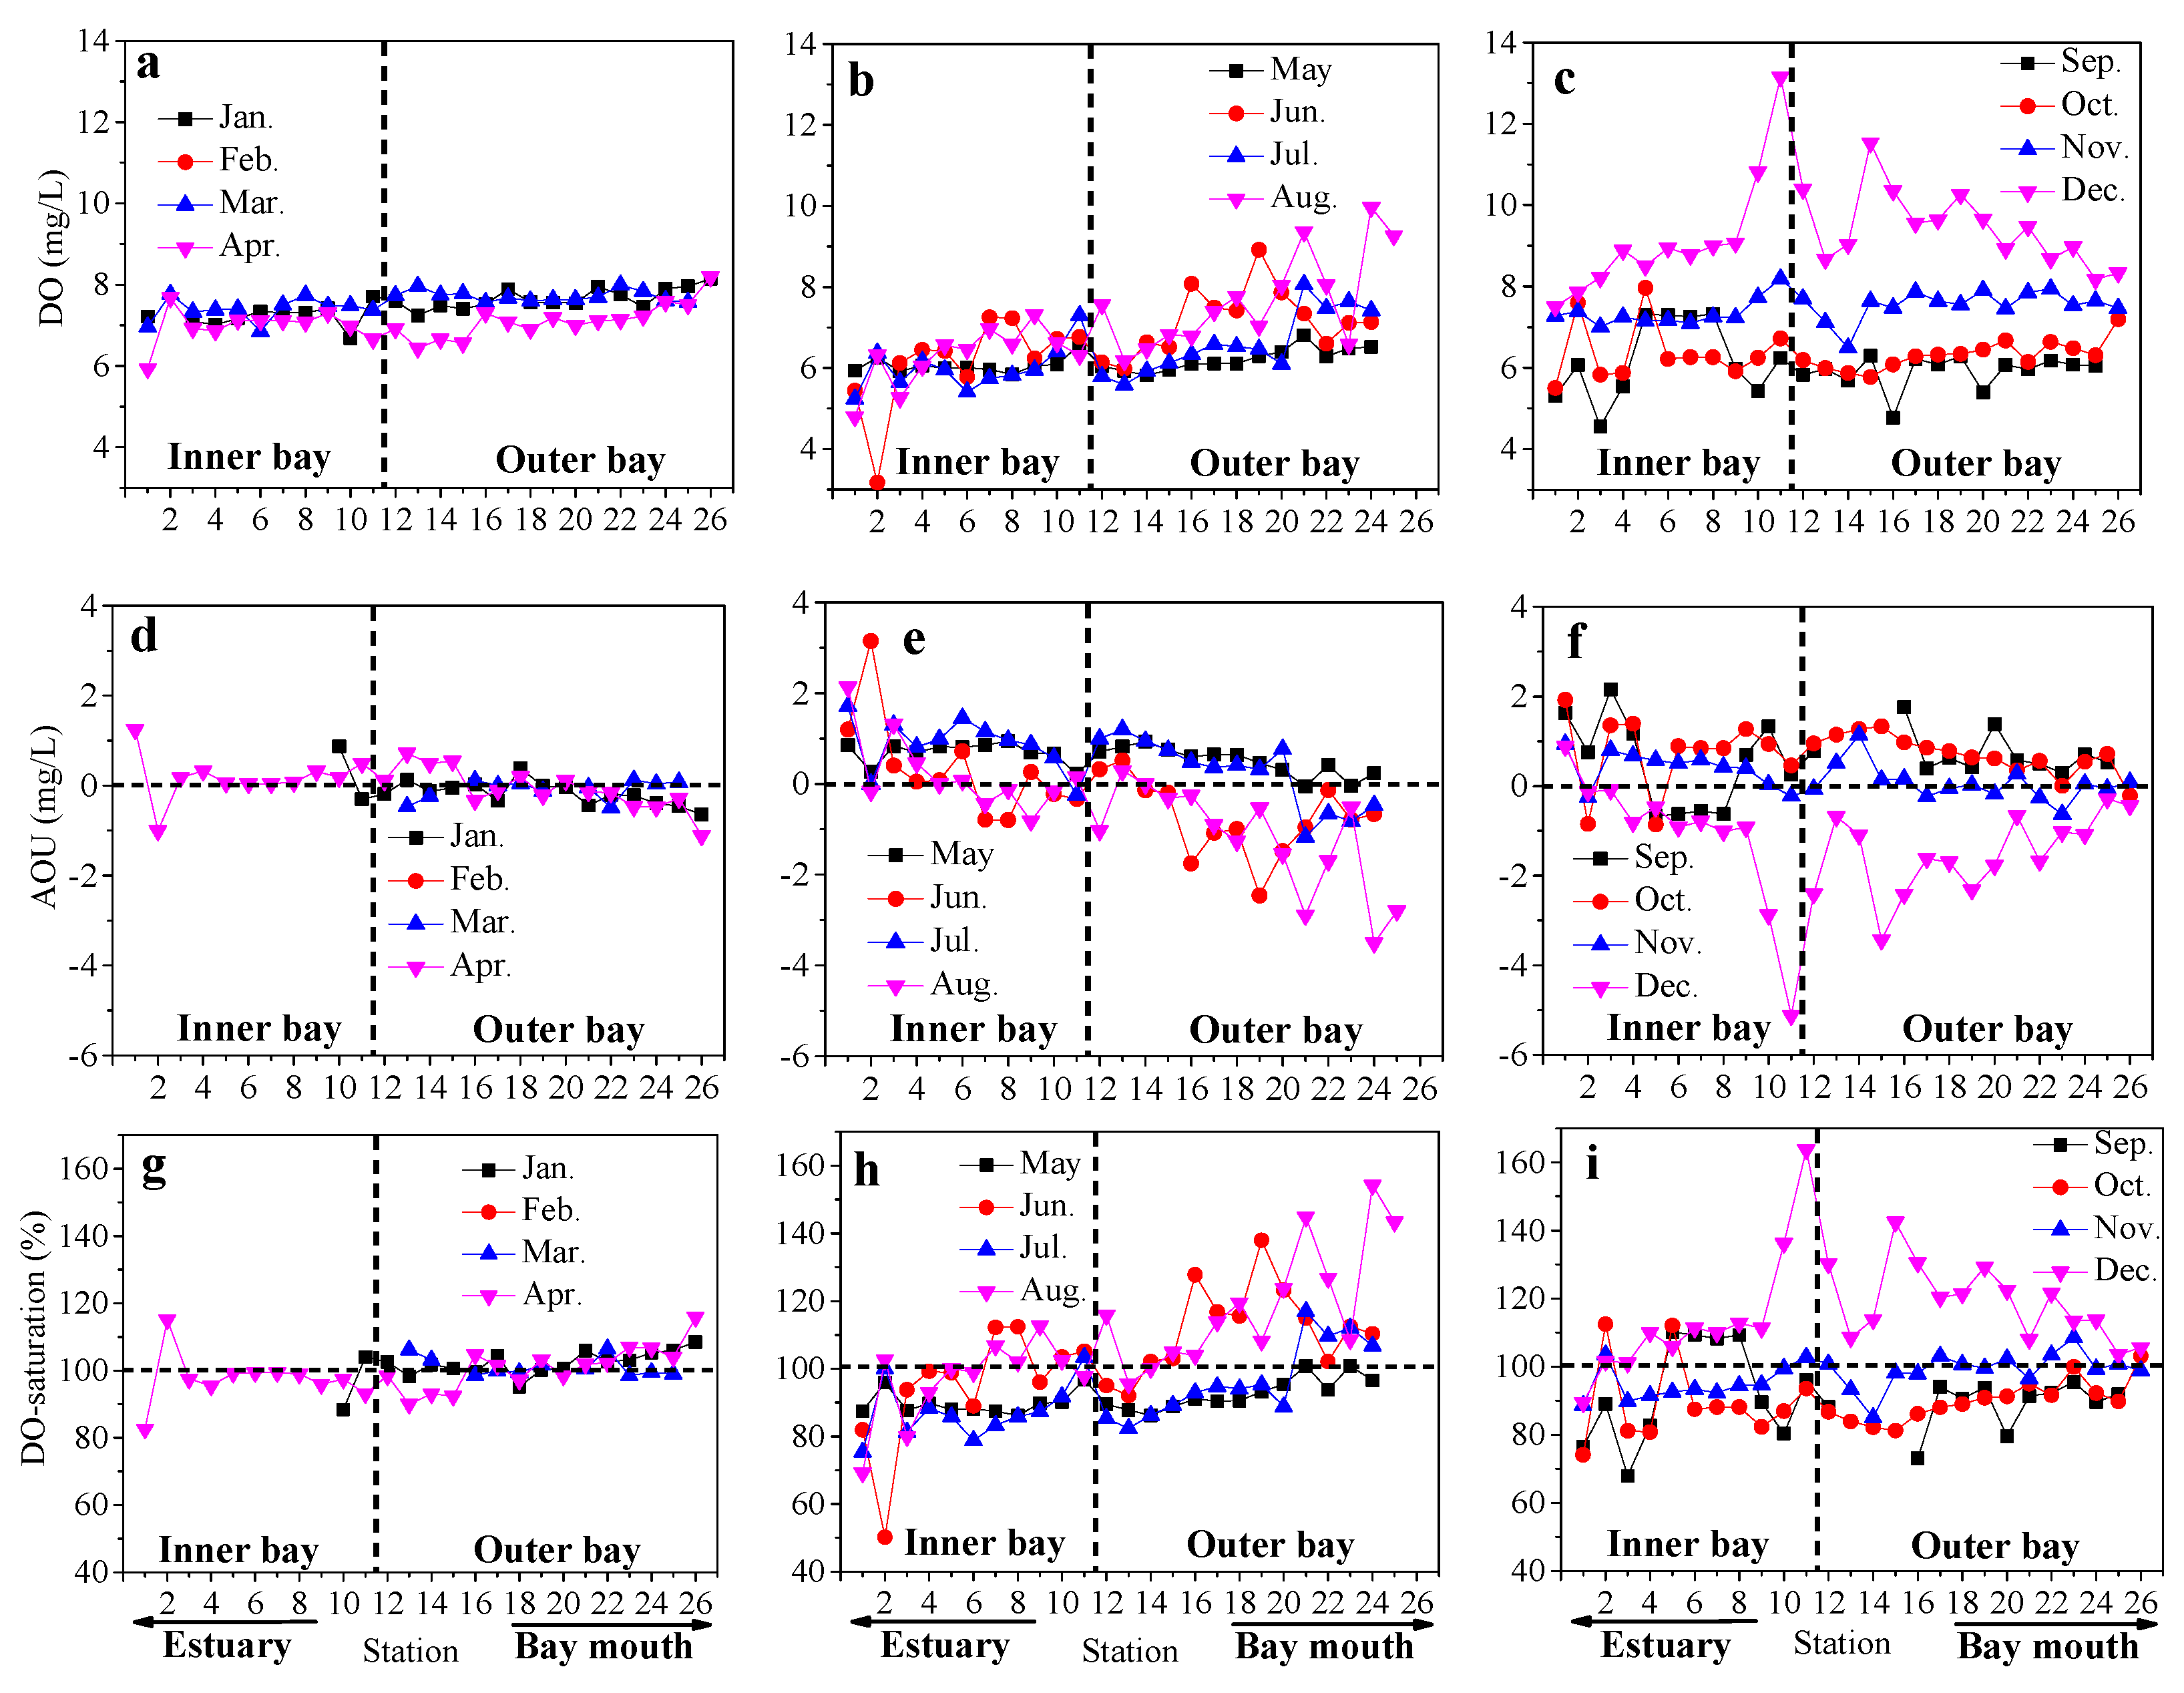
3.3. General Characteristics of DO, AOU and DO-Saturation

During the sampling period, hypoxia was not detected in the surface water of ZJB (Figure 5a–c). Overall, DO values in the surface water of ZJB were generally greater than 6.0 mg/L (a criteria for good water quality [17]), during most months, indicating a healthy water quality. However, low DO conditions (<6 mg/L) existed in the bay during summer and early autumn months (June to September) (Figure 5b,c), which indicates there is some concern for the water quality in ZJB. In most months, DO concentrations generally increased seaward (Figure 5a–c). The Corpus Christi Bay, Texas and the Deep Bay, Hong Kong experienced peaks in DO minimums in the summer months when the water temperature was high, because high water temperature is not conducive to the dissolution of oxygen [7,18]. Different from these two bays, the ZJB experienced peaks in DO minimums in late spring (May) and early autumn (September) (Table 1). High Chl a concentrations in summer months in the ZJB contributed much to that phenomenon, which is discussed in detail in Section 4.
AOU is widely used to infer the influence of biological activity [19]. A positive AOU indicates DO concentration lower than the saturation concentration of DO, while a negative AOU suggests DO supersaturation. The process of organic matter decomposition may result in positive AOU values. The process of phytoplankton primary production may induce negative AOU values. The AOU of surface water in ZJB showed more positive values in the inner bay and more negative values in the outer bay (Figure 5d–f). The highest monthly average AOU was observed in October (mid-autumn) and the most negative AOU was observed in December (winter) (Table 1). Organic matter decomposition and phytoplankton primary production contributed to these phenomena, which is discussed in detail in Section 4.
The DO-saturation values in the surface water of ZJB varied between 50.2% and 163.7%, with the highest value recorded at the area near to the Donghai Dam in December (Figure 1; Figure 5g–i). In most months, DO-saturation values generally increased seaward (Figure 5g–i). The monthly average DO-saturation value was highest in December (winter) and lowest in October (mid autumn) (Table 1). This indicated the influence of biological processes which will be further discussed below.

4. Discussion

There were marked spatial and seasonal variations in DO, AOU, DO-saturation, water temperature, salinity, nutrients, COD and Chl a (Figure 2, Figure 3, Figure 4 and Figure 5; Table 1; Section 3). It is important to explore the main factors controlling the dynamics of DO in the water of ZJB for future management.

4.1. Spatial Variations of DO and Its Influencing Factors

Figure 6 shows the spatial distributions of annual average values of related parameters. The lowest annual average DO, DO-saturation and salinity were observed at Station 1 which is near the estuary of Suixi River (Figure 1; Figure 6a,c,d). The highest annual average AOU, COD, NH4-N, NO3-N, NO2-N and SiO3-Si were also observed at Station 1 (Figure 6b,f,h,i,j,l). Seaward in the ZJB, the annual average DO, DO-saturation and salinity gradually increased and the annual average AOU, COD, NH4-N, NO3-N, NO2-N, PO4-P and SiO3-Si gradually decreased (Figure 1 and Figure 6), indicating that water mixing played an important role in determining the distribution of these parameters.
In addition to the physical regulating factor, biogeochemical processes also impacted the spatial pattern of DO in ZJB. In the inner bay, DO was unsaturated in most months due to the input of terrestrial water with already low DO concentrations and high COD concentrations (Table 2; Figure 1, Figure 2; Figure 5g–i), while in the outer bay, the months with unsaturated DO were relatively few (Table 3; Figure 5g–i). The summer months of June and August also had supersaturated DO in the outer bay (Table 3). Relatively high Chl a concentrations in these two months indicated that high primary production contributed much to the supersaturated DO in the outer bay (Table 3). However, in July and September, when the Chl a concentrations were still high, DO in the outer bay was unsaturated (Table 3). It should be noted that in these two months, the outer bay was dominated by low salinity water with high nutrient concentrations (Table 3). The water of the inner bay had relatively high nutrient concentrations and relatively low DO-saturation values and salinity (Table 2; Figure 2, Figure 4, Figure 5). This indicated that the unsaturated condition in the outer bay in July and September was a result of the dominance of low salinity water which had unsaturated oxygen. Increased terrestrial inputs resulting from heavy rainfall were responsible for the advection of low DO-saturation water from the inner bay to the outer bay.
The maximum annual average Chl a concentrations (>9 μg/L) were observed at stations (Stations 10 and 11) near the Donghai Dam (Figure 1; Figure 6g). This indicated that the water quality in this area was influenced by the construction of Donghai Dam. The study of Li [12] presented that the construction of the Donghai Dam induced longer residence time of water near this area. Zhang and Li [20] and Iriarte et al. [3] found that long residence time of water could result in higher primary production. The finding of the high Chl a concentrations near the Donghai Dam was in agreement with the suggestion by Zhang and Li [20] and Iriarte et al. [3]. The spatial distribution of salinity in September also showed the influence of the Donghai Dam. Figure 2b,c show the distribution of salinity in July, August and September. In July, the low salinity water (<20) was generally within the inner bay. In August, salinity at most stations increased compared with that in July, which may be caused by the relatively high water evaporation rate in this month. In September, most of the stations had salinity lower than 20 (Figure 2c). It should be noted that in September, the maximum salinity (24.16) was observed at Station 11, which was close to the Donghai Dam (Figure 1). This indicated that the high salinity water near the Donghai Dam had not been transported to the outer bay in September, which may probably be related to the Donghai Dam. In December, the highest DO concentration (13.15 mg/L) was observed at Station 11 near the Donghai Dam. A significantly positive correlation (r = 0.720, p < 0.001, n = 26) was found between DO and Chl a in this month. This indicated that the phytoplankton bloom near the Donghai Dam contributed much to the high DO concentration in this area in December.

4.2. Temporal Variations of DO and Its Influencing Factors

4.2.1. Temporal Variations of DO and Its Influencing Factors in Zhanjiang Bay

Seasonal variations in monthly average DO in ZJB were observed with relatively low concentrations in summer months (June to August) and relatively high concentrations in winter months (January, February and December) (Table 1). Monthly average DO in ZJB showed a significantly negative correlation with monthly average water temperature (Table 4). The main reason is that high (low) water temperature can result in the decrease (increase) of oxygen solubility in water. However, there were some months when monthly average DO did not decrease with the increase of water temperature. In June (early summer), the monthly average water temperature was 30.6 ± 0.8 °C, which was slightly higher than that in May (28.4 ± 0.8 °C) (Table 1). However, the monthly average DO in June (6.70 ± 1.08 mg/L) was higher than that in May (6.14 ± 0.25 mg/L). It should be noted that the monthly average Chl a concentration in June (11.20 ± 4.59 μg/L) was significantly higher than that in May (2.37 ± 1.04 μg/L). This indicated that phytoplankton production contributed much to the increase of DO in June. This conclusion could also be supported by the variations of AOU and DO-saturation between June and May. The monthly average AOU in June was negative (−0.25 ± 1.10 mg/L), while it was positive in May (0.59 ± 0.29 mg/L) (Table 1). The monthly average DO-saturation increased from 91.3% in May to 103.8% in June (Table 1). The bloom of phytoplankton in June produced much oxygen, leading to the increase of DO, DO-saturation and the decrease of AOU in this month.
In July (mid summer), the monthly average water temperature was comparable with that in June (early summer), while the monthly average DO and DO-saturation decreased and the AOU became positive (Table 1). The main reason is that much rainfall has occurred in this month. The rainfall of 543 mm in July was the highest during 2017 (Figure 3). Much rainfall could result in the increase of terrestrial inputs with already low DO and high organic matter (Section 4.1). Relatively high monthly average COD in July (Table 1) could also support this conclusion. Enhanced COD was responsible for the decrease of DO and DO-saturation and the increase of AOU. Heavy rainfall can lead to strong river inputs. The high rainfall in July could lead to much nutrients entering ZJB through terrestrial input, which could be seen from the increased nutrient concentrations in this month (Table 1). Due to the inputs of much nutrients and the degradation of organic matter during July, the growth of phytoplankton in August (late summer) was further stimulated, resulting in the highest monthly average Chl a concentration among the sampling period (Table 1). Though the monthly average water temperature increased in August compared with that in July, the monthly average DO concentration in this month still increased (Table 1), highlighting the importance of phytoplankton primary production [21].
In September (early autumn), the monthly average Chl a concentration decreased slightly compared with that in August (Table 1). The monthly average water temperature in September was comparable with that in August (Table 1). However, the monthly average DO concentration in this month decreased obviously compared with that in August (Table 1). The reason is that phytoplankton began to fade and organic matter decomposition rate increased in September. The increase of AOU and decrease of DO-saturation in September could support this conclusion (Table 1). Compared with the summer months (June to August), the Chl a concentrations and DO-saturation values decreased and AOU values were more positive in autumn months (September to November) (Table 1). This indicated that the influence of primary production decreased and organic matter decomposition became an important role in determining the seasonal variations of AOU and DO-saturation. Increased concentrations of most nutrients in autumn months (Table 1) could also indicate the influence of organic matter decomposition. We should also note that, the DO concentrations in October and November (mid and late autumn) increased compared with that in September (early autumn) (Table 1). This increase is resulted by the decreased water temperature in these two months (Table 1).
In December (early winter), the monthly average salinity was the highest during 2017 (Table 1); the water temperature was significantly low compared with those in summer and autumn months (June to November) (Table 1; Figure 2d–f). The monthly average DO in this month was obviously higher than those in summer and autumn months (Table 1). Low water temperature favors oxygen to dissolve in water, which was responsible for the high DO values in December. A phytoplankton bloom was also observed in this month, with the monthly average Chl a concentration about 6 times higher than that in November (Table 1). The phytoplankton bloom in December may be related to the high nutrient concentrations resulting from organic matter decomposition and vertical mixing of water during this period. Though the monthly average Chl a concentration in December was comparable with those in summer months (Table 1), the influences of organic matter decomposition and bacterial respiration in December were relatively small due to low water temperature and low COD concentrations in this month (Table 1) [6,22], leading to the highest DO-saturation values and the most negative AOU during the sampling period (Table 1).

4.2.2. Temporal Variations of DO and Its Influencing Factors in the Inner Bay and the Outer Bay

In the outer bay, the monthly average DO only had a significant negative correlation with monthly average water temperature (Table 4). This indicated that the temporal variation of DO in the outer bay was mainly controlled by water temperature. In the inner bay, the monthly average DO had significant negative correlations with monthly average water temperature, PO4-P and rainfall (Table 4). This indicated that, besides water temperature, other factors may be also responsible for the temporal variations of DO in the inner bay. For example, the highest monthly average water temperature in the inner bay occurred in August (late summer), while the lowest monthly average DO in this area occurred in July (mid summer) (Table 2). The highest monthly average COD in July in the inner bay contributed to that phenomenon (Table 2), because high concentrations of COD could consume much oxygen.
In the inner bay, the monthly average salinity reached a minimum in July when the rainfall was highest (Table 2; Figure 3). Different from the inner bay, the monthly average salinity in the outer bay reached a minimum in September (early autumn) (Table 3). This may indicate that the transportation of low salinity water from the inner bay to the outer bay needed about two months during this period. The transportation of water from the inner bay to the outer bay and the change of solar radiation made the spatial distribution pattern of water temperature in ZJB change (Section 3.1). High COD concentrations in the inner bay made the minimum DO occur in July (as discussed above). In the outer bay, COD concentrations were relatively low (Table 2; Table 3). The minimum monthly average DO occurred in the same month (September) with that of the maximum water temperature (Table 3). Therefore, the DO minimum in the inner bay and the outer bay occurring in different months was the combined effects of rainfall, river discharge, solar radiation and organic matter decomposition.
We also applied principal component analysis (PCA) to the data set composed of monthly average data of DO, DO-saturation and AOU and related physical (rainfall, salinity and temperature) and biochemical (COD, Chl a, NO3-N, NH4-N, NO2-N, SiO3-Si and PO4-P) parameters in both the inner bay and the outer bay to explore the relationships among them in more detail (Table 5).
In the inner bay, three principle components (PC1–PC3) were identified which accounted for 92.0% of the total data variance (Table 5). PC1 accounted for 53.9% of the data variance and had high positive loadings for rainfall, PO4-P, NH4-N, water temperature, AOU, COD and SiO3-Si, and high negative loadings for salinity, DO and DO-saturation. This component showed that rain-driven terrestrial discharge and organic matter decomposition played important roles in controlling the temporal variations of DO, AOU, and DO-saturation. In ZJB, high rainfall occurred in summer and autumn months when water temperature was high. High rainfall resulted in the input of terrestrial water with high COD and nutrient concentrations. The rainfall-induced terrestrial water also had low DO concentrations because water temperature in this period was high. High COD concentrations could consume much oxygen, which contributed to the increase of AOU and the decrease of DO-saturation. PC2 accounted for 21.9% of the data variance and had high positive loadings for NO3-N, NO2-N, SiO3-Si, and DO, and a high negative loading for temperature. This component showed that the influence of water temperature on DO prevailed over the influence of organic matter decomposition. PC3 accounted for 16.2% of the data variance and had high positive loadings for Chl a, DO-saturation and COD, and a high negative loading for AOU. This component indicated that phytoplankton primary production contributed to the increase of DO-saturation and decrease of AOU.
In the outer bay, three principle components (PC1–PC3) were identified and accounted for 89.5% of the total data variance (Table 5). PC1 accounted for 43.6% of the data variance and had high positive loadings for AOU, PO4-P, NO3-N, SiO3-Si, NO2-N, NH4-N and rainfall, and high negative loadings for DO-saturation, salinity and DO. Different from the PC1 for the inner bay, the PC1 for the outer bay did not show high loadings for COD and water temperature. This again indicated that organic matter decomposition was not that important for the temporal variation of AOU and DO-saturation in the outer bay compared with that in the inner bay. PC2 for the outer bay accounted for 30.7% of the data variance and had high positive loadings for water temperature, Chl a, COD, rainfall and NH4-N and high negative loadings for NO3-N, SiO3-Si and NO2-N. This component did not show high loadings for DO, AOU and DO-saturation. This may indicate that the influence of phytoplankton primary production on the temporal variations of DO, AOU and DO-saturation was cancelled out by the influences of organic matter decomposition and water temperature. PC3 for the outer bay accounted for 15.2% of the data variance and had high positive loadings for Chl a, PO4-P, DO and DO-saturation, and a high negative loading for AOU. This component indicated that phytoplankton production played an important role in controlling the temporal variations of DO, AOU and DO-saturation.

5. Conclusions

In the surface water of ZJB, there was a gradual increase of annual average DO and DO-saturation, and a gradual decrease in annual average NH4-N, NO3-N, NO2-N, PO4-P, SiO3-Si, COD and AOU from the inner bay to the bay mouth. This indicated the importance of water mixing in determining the distribution pattern of these parameters. Anthropogenic activities and terrestrial input brought much organic matter into the inner bay, resulting in generally unsaturated DO in this area. Heavy rainfall can lead to increased land runoff, which was responsible for the low DO-saturation values in the outer bay in July and September. The construction of the Donghai Dam resulted in the long residence time of water near the Donghai Dam, which contributed to the relatively high Chl a concentrations and DO-saturation values and relatively low AOU values in this area.
Though the water temperature in ZJB was relatively high in summer months, the lowest monthly average DO concentrations were observed in May and September. High Chl a concentrations in summer months contributed much to that phenomenon. High nutrient concentrations resulting from organic matter decomposition and vertical mixing of water may be related to the phytoplankton bloom in December. The monthly average Chl a in December was comparable with those in summer months, while the highest monthly average DO-saturation value and the most negative AOU were observed in December. The main reason is that the influences of organic matter decomposition and bacterial respiration in December were relatively small due to the low water temperature and low COD concentrations in this month. The DO minimum in the inner bay and the outer bay occurred in different months. Rainfall, river discharge, solar radiation and organic matter decomposition all contributed to that phenomenon. Overall, the spatial-temporal variations of DO in the surface water of ZJB were significantly influenced by anthropogenic activities and environmental changes.

Author Contributions

All authors contributed to the data assessment and analysis strategy. F.Z., F.C. and X.L. conceived and designed the study, and also wrote the manuscript. Q.Z., Y.M., and C.C. performed sample collection and contributed to the experiment and measurement. F.C. and Q.L. collaborated in discussing the manuscript and modifying the manuscript. S.Z. performed formal analysis and and edited the manuscript. All authors have read and agreed to the published version of the manuscript.

Funding

This research was co-supported by the Foundation for Young Talents in General Colleges and Universities of Guangdong Province (2019KQNCX044), the National Key Research and Development Plan (2016YFC1401403), the International Science and Technology Cooperation Project (GASI-IPOVAI-04), the Natural Science Foundation of Guangdong Province (2016A030312004 and 2016A030313754), the Project of Enhancing School with Innovation of Guangdong Ocean University (GDOU2016050260), and the Program for Scientific Research Start-up Funds of Guangdong Ocean University (R17058).

Acknowledgments

The assistance of Tieqiang Mao and Jiacheng Li in the sample collection is greatly appreciated.

Conflicts of Interest

The authors declare no conflict of interest.

References

  1. Best, M.A.; Wither, A.W.; Coates, S. Dissolved oxygen as a physico-chemical supporting element in the Water Framework Directive. Mar. Pollut. Bull. 2007, 55, 53–64. [Google Scholar] [CrossRef] [PubMed]
  2. Chen, X.F.; Shen, Z.Y.; Li, Y.Y.; Yang, Y. Tidal modulation of the hypoxia adjacent to the Yangtze Estuary in summer. Mar. Pollut. Bull. 2015, 100, 453–463. [Google Scholar] [CrossRef] [PubMed]
  3. Iriarte, A.; Villate, F.; Uriarte, I.; Alberdi, L.; Intxausti, L. Dissolved oxygen in a temperate estuary: The influence of hydro-climatic factors and eutrophication at seasonal and inter-annual time scales. Estuar. Coast. 2015, 38, 1000–1015. [Google Scholar] [CrossRef]
  4. Kemp, W.M.; Testa, J.M.; Conley, D.J.; Gilbert, D.; Hagy, J.D. Coastal hypoxia responses to remediation. Biogeosciences 2009, 6, 2985–3008. [Google Scholar] [CrossRef] [Green Version]
  5. Kim, H.; Takayama, K.; Hirose, N.; Onitsuka, G.; Yoshida, T.; Yanagi, T. Biological modulation in the seasonal variation of dissolved oxygen concentration in the upper Japan Sea. J. Oceanogr. 2019, 75, 257–271. [Google Scholar] [CrossRef]
  6. Xu, H.Z.; Liu, S.M.; Xie, Q.; Hong, B.; Zhou, W.H.; Zhang, Y.Y.; Li, T. Seasonal variation of dissolved oxygen in Sanya Bay. Aquat. Ecosyst. Health. 2016, 19, 276–285. [Google Scholar] [CrossRef]
  7. Xu, J.; Yin, K.D.; Lee, J.H.W.; Liu, H.B.; Ho, A.Y.T.; Yuan, X.C.; Harrison, P.J. Long-Term and Seasonal changes in nutrients, phytoplankton biomass, and dissolved oxygen in Deep Bay, Hong Kong. Estuar. Coast. 2010, 33, 399–416. [Google Scholar] [CrossRef] [Green Version]
  8. Ke, S.; Zhao, L.R.; Sun, S.L. Distribution characteristics and sources of PAHs in sea water of the land-based outlet of Zhanjiang Bay. Mari. Environ. Sci. 2014, 33, 71–77. (In Chinese) [Google Scholar]
  9. Lu, X.; Zhou, F.X.; Chen, F.J.; Lao, Q.B.; Zhu, Q.M.; Meng, Y.F.; Chen, C.Q. Spatial and seasonal variations of sedimentary organic matter in a subtropical bay: Implication for human interventions. Int. J. Env. Res. Pub. Health 2020, 17, 1362. [Google Scholar] [CrossRef] [PubMed] [Green Version]
  10. Chen, F.J.; Chen, C.Q.; Zhou, F.X.; Lao, Q.B.; Zhu, Q.M.; Zhang, S.W. Nutrients in atmospheric wet deposition in the Zhanjiang Bay. China Environ. Sci. 2017, 37, 2055–2063. (In Chinese) [Google Scholar]
  11. Cai, L.C. The spatial and temporal distribution of carbon isotope of suspended particulate matter and pollution source tracer in Zhanjiang Harbor. Master’s Thesis, Guangdong Ocean University, Zhanjiang, China, 2010. (In Chinese). [Google Scholar]
  12. Li, X.B. Research on the effects of Donghai Dam on the Hydrodynamic environment of Zhanjiang Bay. Master’s Thesis, Ocean University of China, Qingdao, China, 2008. (In Chinese). [Google Scholar]
  13. General Administration of Quality Supervision, Inspection and Quarantine of the People’s Republic of China. The Specification for Marine Monitoring—Part 4: Seawater Analysis (GB 17378.4–2007); Standards press of China: Beijing, China, 2007. (In Chinese) [Google Scholar]
  14. General Administration of Quality Supervision, Inspection and Quarantine of the People’s Republic of China. The Specification for Marine Monitoring—Part 7: Ecological Survey for Offshore Pollution and Biological Monitoring (GB 17378.7-2007); Standards press of China: Beijing, China, 2007. (In Chinese) [Google Scholar]
  15. Benson, B.B.; Krause, D. The concentration and isotopic fractionation of oxygen dissolved in freshwater and seawater in equilibrium with the atmosphere. Limnol. Oceanogr. 1984, 29, 620–632. [Google Scholar] [CrossRef]
  16. Kawabe, M.; Kawabe, M. Temporal and spatial characteristics of chemical oxygen demand in Tokyo Bay. J. Oceanogr. 1997, 53, 19–26. [Google Scholar] [CrossRef]
  17. Connell, D.W.; Miller, G.J. Chemistry and Ecotoxicology of Pollution: DW Connell and GJ Miller; Wiley-Interscience: New York, NY, USA, 1984. [Google Scholar]
  18. Applebaum, S.; Montagna, P.A.; Ritter, C. Status and trends of dissolved oxygen in Corpus Christi Bay. Environ. Monit. Assess. 2005, 107, 297–311. [Google Scholar] [CrossRef]
  19. Yuan, X.C.; Yin, K.D.; Harrison, P.J.; He, L.; Xu, J. Variations in apparent oxygen utilization and effects of P addition on bacterial respiration in subtropical Hong Kong Waters. Estuar. Coast. 2011, 34, 536–543. [Google Scholar] [CrossRef]
  20. Zhang, H.; Li, S. Effects of physical and biochemical processes on the dissolved oxygen budget for the Pearl River Estuary during summer. J. of Marine Syst. 2010, 79, 65–88. [Google Scholar] [CrossRef]
  21. Schlitzer, R.; Roether, W.; Oster, H.; Junghans, H.G.; Hausmann, M.; Johannsen, H.; Michelato, A. Chlorofluoromethane and oxygen in the Eastern Mediterranean. Deep-Sea Res. Part A 1991, 38, 1531–1551. [Google Scholar] [CrossRef]
  22. Revilla, M.; Iriarte, A.; Madariaga, I.; Orive, E. Bacterial and phytoplankton dynamics along a trophic gradient in a shallow temperate estuary. Estuar. Coast. Shelf Sci. 2000, 50, 297–313. [Google Scholar] [CrossRef]
Figure 1. Sampling stations in the Zhanjiang Bay. The sampling stations in the Zhanjiang Bay are dived into two groups: inner bay (Stations 1–11) and outer bay (Stations 12–26). R1 (▲) denotes the sampling site for rainfall. Company: Zhanjiang Electric Power Co., Ltd. Baosteel: Baosteel Zhanjiang Iron Steel Co., Ltd.
Jmse 08 00403 g001
Figure 2. Spatial variations of salinity (ac), temperature (df), chemical oxygen demand (COD) (gi) and chlorophyll a (Chl a) (jl) in different months.
Jmse 08 00403 g002aJmse 08 00403 g002b
Figure 3. Temporal variations of rainfall in Zhanjiang Bay.
Jmse 08 00403 g003
Figure 4. Spatial variations of NH4-N (ac), NO3-N (df), NO2-N (gi), PO4-P (jl), and SiO3-Si (mo) in different months.
Jmse 08 00403 g004
Figure 5. Spatial variations of DO (ac), AOU (df) and DO-saturation (gi) in different months.
Jmse 08 00403 g005
Figure 6. Spatial variations of annual average DO (a), AOU (b), DO-saturation (c), salinity (d), temperature (e), COD (f), Chl a (g), NH4-N (h), NO3-N (i), NO2-N (j), PO4-P (k) and SiO3-Si (l).
Jmse 08 00403 g006
Table 1. Monthly average dissolved oxygen (DO), apparent oxygen utilization (AOU), percent oxygen saturation (DO-saturation) and related parameters in the Zhanjiang Bay.
SeasonMonthST (°C)COD
(mg/L)
Chl a
(μg/L)
NH4-N
(μmol/L)
NO3-N
(μmol/L)
NO2-N
(μmol/L)
PO4-P
(μmol/L)
SiO3-Si
(μmol/L)
DO
(mg/L)
AOU
(mg/L)
DO-Saturation
(%)
WinterJan.28.0 ± 2.221.5 ± 0.60.96 ± 0.342.92 ± 1.161.04 ± 1.0315.88 ± 7.811.76 ± 0.632.95 ± 0.9212.86 ± 5.547.49 ± 0.34−1.12 ± 0.36101.6 ± 4.7
WinterFeb. 26.3 ± 3.518.3 ± 0.71.12 ± 0.352.15 ± 0.502.64 ± 3.0014.49 ± 6.801.75 ± 0.642.78 ± 1.0418.57 ± 3.46nanana
SpringMar.28.0 ± 2.920.5 ± 0.51.02 ± 0.301.68 ± 0.934.09 ± 3.1717.69 ± 8.431.27 ± 0.793.26 ± 1.6320.87 ± 4.507.57 ± 0.26−0.08 ± 0.22101.2 ± 2.9
SpringApr.27.3 ± 2.924.7 ± 1.11.33 ± 0.431.85 ± 1.181.94 ± 1.8013.95 ± 6.311.17 ± 0.583.20 ± 1.489.58 ± 2.787.06 ± 0.430.03 ± 0.5099.6 ± 7.1
SpringMay25.4 ± 1.428.4 ± 0.81.28 ± 0.482.37 ± 1.043.10 ± 1.1916.34 ± 6.691.70 ± 0.883.60 ± 2.2010.46 ± 3.406.14 ± 0.250.59 ± 0.2991.3 ± 4.3
SummerJun.27.0 ± 2.730.6 ± 0.82.15 ± 0.5111.20 ± 4.593.95 ± 4.2010.12 ± 7.081.89 ± 1.133.49 ± 1.886.36 ± 7.516.70 ± 1.09−0.25 ± 1.10103.8 ± 17.2
SummerJuly19.3 ± 2.829.2 ± 0.82.19 ± 0.9011.58 ± 11.3311.19 ± 5.4122.64 ± 10.833.29 ± 1.205.26 ± 2.7332.13 ± 15.576.33 ± 0.750.53 ± 0.7592.3 ± 10.86
SummerAug.25.0 ± 3.730.9 ± 0.81.59 ± 0.5112.90 ± 7.643.77 ± 3.7914.75 ± 19.271.91 ± 1.703.83 ± 2.1310.00 ± 14.777.06 ± 1.20−0.58 ± 1.24109.1 ± 19.0
AutumnSep.19.2 ± 2.031.0 ± 0.81.51 ± 0.5110.71 ± 6.215.61 ± 2.2017.05 ± 11.093.03 ± 1.554.07 ± 1.3920.77 ± 14.336.05 ± 0.710.61 ± 0.7790.9 ± 11.5
AutumnOct.21.7 ± 2.626.8 ± 1.21.31 ± 0.482.51 ± 1.504.09 ± 2.2527.95 ± 6.4811.15 ± 2.295.48 ± 1.7834.74 ± 8.766.35 ± 0.550.72 ± 0.6489.9 ± 9.0
AutumnNov.25.3 ± 2.221.0 ± 1.21.00 ± 0.271.94 ± 0.590.06 ± 0.0528.52 ± 11.607.71 ± 1.224.32 ± 0.7930.27 ± 6.487.46 ± 0.360.21 ± 0.4297.4 ± 5.5
WinterDec.28.0 ± 2.118.0 ± 0.91.30 ± 0.3611.49 ± 4.761.02 ± 2.0225.30 ± 20.792.29 ± 1.082.87 ± 0.9418.35 ± 9.909.32 ± 1.21−1.34 ± 1.23116.9 ± 15.3
na: not available.
Table 2. Monthly average DO, AOU, DO-saturation and related parameters in the inner bay (Stations 1–11).
SeasonMonthST (°C)COD
(mg/L)
Chl a
(μg/L)
NH4-N
(μmol/L)
NO3-N
(μmol/L)
NO2-N
(μmol/L)
PO4-P
(μmol/L)
SiO3-Si
(μmol/L)
DO
(mg/L)
AOU
(mg/L)
DO-saturation
(%)
WinterJan.27.7 ± 0.121.5 ± 0.71.01 ± 0.372.31 ± 0.701.29 ± 1.3519.32 ± 11.772.00 ± 0.913.81 ± 0.4414.31 ± 8.217.22 ± 0.270.29 ± 0.8396.2 ± 11.1
WinterFeb. na17.7 ± 0.71.10 ± 0.362.34 ± 0.724.53 ± 3.8316.98 ± 10.261.89 ± 0.983.79 ± 0.4818.04 ± 5.18nanana
SpirngMar.na20.7 ± 0.81.20 ± 0.331.92 ± 1.006.16 ± 3.7323.33 ± 10.151.87 ± 0.884.81 ± 0.8721.61 ± 6.377.39 ± 0.28nana
SpirngApr.25.9 ± 3.124.6 ± 1.51.69 ± 0.480.87 ± 0.472.93 ± 2.0917.47 ± 8.511.57 ± 0.714.61 ± 0.327.47 ± 2.616.98 ± 0.430.18 ± 0.5297.6 ± 7.5
SpirngMay24.2 ± 1.228.6 ± 0.91.50 ± 0.611.64 ± 0.493.24 ± 1.0421.52 ± 6.892.44 ± 0.825.76 ± 0.8212.59 ± 3.706.06 ± 0.200.70 ± 0.2489.7 ± 3.5
SummerJun.24.5 ± 2.131.0 ± 0.92.45 ± 0.5712.27 ± 6.077.30 ± 3.9214.81 ± 5.872.81 ± 0.845.06 ± 0.6310.98 ± 9.206.14 ± 1.130.34 ± 1.1194.7 ± 17.4
SummerJuly17.0 ± 2.029.6 ± 1.02.83 ± 0.599.92 ± 4.7815.67 ± 2.5330.88 ± 10.184.36 ± 0.806.70 ± 1.6242.58 ± 16.626.00 ± 0.560.87 ± 0.5887.4 ± 8.5
SummerAug.21.9 ± 3.831.3 ± 0.41.69 ± 0.6715.01 ± 8.887.15 ± 3.3727.64 ± 23.393.19 ± 1.795.42 ± 1.6920.88 ± 17.056.29 ± 0.720.22 ± 0.8396.8 ± 12.3
AutumnSep.19.1 ± 2.730.6 ± 0.41.95 ± 0.4112.69 ± 6.196.62 ± 1.9526.30 ± 10.574.41 ± 1.155.01 ± 0.2731.27 ± 16.096.21 ± 0.970.50 ± 1.0192.6 ± 15.0
AutumnOct.19.3 ± 2.026.9 ± 1.41.63 ± 0.553.09 ± 1.955.66 ± 2.0433.40 ± 5.0913.10 ± 1.676.78 ± 0.9342.76 ± 6.216.40 ± 0.760.75 ± 0.8889.7 ± 12.3
AutumnNov.23.7 ± 2.621.0 ± 1.71.12 ± 0.351.89 ± 0.460.10 ± 0.0535.35 ± 15.487.69 ± 1.754.94 ± 0.5934.08 ± 8.507.34 ± 0.340.41 ± 0.3994.8 ± 5.0
WinterDec.26.4 ± 2.618.2 ± 1.11.32 ± 0.4310.13 ± 4.621.67 ± 3.0537.30 ± 28.152.95 ± 1.423.83 ± 0.4622.00 ± 11.039.16 ± 1.57−1.11 ± 1.61113.9 ± 20.0
na: not available.
Table 3. Monthly average DO, AOU, DO-saturation and related parameters in the outer bay (Stations 12–26).
SeasonMonthST (°C)COD
(mg/L)
Chl a
(μg/L)
NH4-N
(μmol/L)
NO3-N
(μmol/L)
NO2-N
(μmol/L)
PO4-P
(μmol/L)
SiO3-Si
(μmol/L)
DO
(mg/L)
AOU
(mg/L)
DO-saturation
(%)
WinterJan.28.0 ± 2.421.5 ± 0.50.93 ± 0.323.12 ± 1.240.87 ± 0.7413.58 ± 1.241.60 ± 0.272.38 ± 0.6611.90 ± 2.597.66 ± 0.25−0.17 ± 0.23102.3 ± 3.4
WinterFeb.26.3 ± 3.518.7 ± 0.41.13 ± 0.362.02 ± 0.251.30 ± 1.0412.72 ± 0.881.65 ± 0.152.06 ± 0.6318.95 ± 1.48nanana
SpirngMar.28.0 ± 2.920.4 ± 0.30.87 ± 0.161.49 ± 0.852.46 ± 1.1713.25 ± 1.980.80 ± 0.112.05 ± 0.8620.29 ± 2.337.72 ± 0.14−0.08 ± 0.22102.3 ± 3.4
SpirngApr.28.3 ± 2.424.7 ± 0.61.10 ± 0.142.58 ± 1.001.17 ± 1.0711.37 ± 1.590.87 ± 0.142.16 ± 1.0611.13 ± 1.707.12 ± 0.43−0.07 ± 0.46101.1 ± 6.6
SpirngMay26.3 ± 0.328.2 ± 0.71.10 ± 0.222.98 ± 0.982.99 ± 1.3311.96 ± 0.991.08 ± 0.111.78 ± 0.958.29 ± 1.286.22 ± 0.280.49 ± 0.3192.7 ± 4.6
SummerJun.28.9 ± 1.230.2 ± 0.61.90 ± 0.3010.29 ± 2.761.11 ± 1.394.39 ± 2.961.11 ± 0.662.16 ± 1.492.44 ± 1.117.17 ± 0.82−0.75 ± 0.84111.8 ± 13.1
SummerJuly21.3 ± 1.528.8 ± 0.51.66 ± 0.7712.98 ± 14.927.74 ± 4.3815.67 ± 4.862.38 ± 0.534.04 ± 2.9323.28 ± 7.036.62 ± 0.780.24 ± 0.7796.5 ± 11.2
SummerAug.27.4 ± 0.730.6 ± 1.01.50 ± 0.3511.24 ± 6.351.11 ± 0.694.62 ± 3.680.91 ± 0.632.58 ± 1.561.45 ± 0.667.66 ± 1.17−1.21 ± 1.16118.8 ± 17.9
AutumnSep.19.3 ± 1.231.3 ± 1.01.16 ± 0.249.15 ± 5.974.81 ± 2.119.79 ± 4.031.94 ± 0.753.33 ± 1.4712.53 ± 3.695.92 ± 0.410.72 ± 0.4589.1 ± 6.8
AutumnOct.23.5 ± 1.226.7 ± 1.11.10 ± 0.292.09 ± 0.912.94 ± 1.6523.96 ± 4.019.72 ± 1.484.53 ± 1.6728.87 ± 4.706.31 ± 0.350.70 ± 0.4390.1 ± 6.0
AutumnNov.26.5 ± 0.620.9 ± 0.60.91 ± 0.131.98 ± 0.680.03 ± 0.0123.51 ± 2.357.72 ± 0.683.87 ± 0.6027.47 ± 1.887.55 ± 0.360.06 ± 0.4099.2 ± 5.2
WinterDec.29.1 ± 0.517.9 ± 0.71.29 ± 0.3112.49 ± 4.770.54 ± 0.1116.49 ± 3.121.80 ± 0.252.17 ± 0.4115.67 ± 2.519.44 ± 0.91−1.51 ± 0.88119.0 ± 10.9
na: not available.
Table 4. Pearson’s correlation coefficient between monthly average DO and related parameters in Zhanjiang Bay, inner bay and outer bay.
LocationTCODChl aNH4-NNO3-NNO2-NPO4-PSiO3-SiRainfall
Zhanjiang Bay−0.823 b−0.3880.052−0.5570.258−0.188−0.583−0.094−0.613 a
Innder bay−0.888 c−0.589−0.176−0.5700.405−0.154−0.703 b−0.134−0.669 a
Outer bay−0.732 b−0.0440.256−0.5980.022−0.205−0.3790.076−0.525
Bold values indicate significant correlations at p < 0.05; a 0.01 < p < 0.05; b 0.001 < p < 0.01; c p < 0.001.
Table 5. Loadings of environmental variables on principle components for the monthly average data in the inner bay and the outer bay.
VariablesInner BayOuter Bay
PC1PC2PC3PC1PC2PC3
DO−0.8360.4220.303−0.753−0.3890.477
AOU0.7860.149−0.5750.886−0.063−0.447
DO-saturation−0.8090.1600.541−0.8840.1000.429
Rainfall0.9400.1360.2320.5560.6860.365
S−0.910−0.3190.150−0.837−0.3860.040
T0.822−0.4530.1180.3060.862−0.198
COD0.723−0.3640.433−0.1920.8100.397
Chl a0.315−0.1490.857−0.2810.7100.547
NH4-N0.855−0.1280.4080.6590.5490.021
NO3-N0.0280.9350.2640.574−0.7020.377
NO2-N0.3840.768−0.3220.694−0.4510.423
PO4-P0.8990.223−0.1800.814−0.0580.513
SiO3-Si0.5790.7810.0670.685−0.5550.389
Total Variance53.9%21.9%16.2%43.6%30.7%15.2%
Cumulative Variance53.9%75.8%92.0%43.6%74.3%89.5%
Bold values indicate strong loadings.

