Real-World Exhaust Emissions of Diesel Locomotives and Motorized Railcars during Scheduled Passenger Train Runs on Czech Railroads


1
Department of Automobile, Combustion Engine and Railway Engineering, Faculty of Mechanical Engineering, Czech Technical University of Prague, 160 00 Prague, Czech Republic
2
Department of Vehicles and Engines, Technical University of Liberec, 46117 Liberec, Czech Republic
3
Department of Vehicle Technology, Faculty of Transportation Sciences, Czech Technical University in Prague, 110 00 Prague, Czech Republic
4
Department of Vehicles and Ground Transport, Faculty of Engineering, Czech University of Life Sciences, 165 21 Prague, Czech Republic
*
Author to whom correspondence should be addressed.
Atmosphere 2020, 11(6), 582; https://doi.org/10.3390/atmos11060582
Submission received: 17 April 2020
/
Revised: 27 May 2020
/
Accepted: 28 May 2020
/
Published: 2 June 2020
(This article belongs to the Special Issue Ambient Air Quality in the Czech Republic)
Abstract
:The paper summarizes exhaust emissions measurements on two diesel-electric locomotives and one diesel-hydraulic railcar, each tested for several days during scheduled passenger service. While real driving emissions of buses decrease with fleet turnaround and have been assessed by many studies, there are virtually no realistic emissions data on diesel rail vehicles, many of which are decades old. The engines were fitted with low-power portable online monitoring instruments, including a portable Fourier Transform Infra Red (FTIR) spectrometer, online particle measurement, and in two cases with proportional particle sampling systems, all installed in engine compartments. Due to space constraints and overhead electric traction lines, exhaust flow was computed from engine operating data. Real-world operation was characterized by relatively fast power level transitions during accelerations and interleaved periods of high load and idle, and varied considerably among service type and routes. Spikes in PM emissions during accelerations and storage of PM in the exhaust were observed. Despite all engines approaching the end of their life, the emissions per passenger-km were very low compared to automobiles. Tests were done at very low costs with no disruption of the train service, yielded realistic data, and are also applicable to diesel-hydraulic units, which cannot be tested at standstill.

1. Introduction
The Czech Republic, with 9567 km of active railroad lines [1], has one of the highest density railroad infrastructures in the world, on both per area (over 12 km per 100 km2) and per capita (over 9 km per 10,000 inhabitants) bases. Of these, about two thirds (6330 km) have electric traction lines (significant systems 3 kV DC and 25 kV 50 Hz) and one third (3237 km), mostly local lines with minimal traffic, rely on independent traction provided (except for historical trains using steam engines and battery powered locomotives in industrial yards) by diesel locomotives and railcars [1]. In 2018, railroads in the Czech Republic transported 190 million passengers, accounting for 10,292 million (or about 1010) passenger-kilometers (pkm) [2], roughly 1000 km per year per capita. There are 104 registered railroad operators [1] for freight and passenger transport; of these, state-run Czech Railways (ČD) account for about 90% of the passenger transport. In 2018, Czech Railways transported 179 million passengers (8225 million pkm), with a 2018 total of 2.58 million dispatched passenger trains and a total distance traveled of 124 million train-kilometers, at a mean train occupancy of 30% [3]. The company had 293 electric locomotives, 309 electric units, 215 diesel locomotives, 696 diesel railcars and units, and 2210 cars in passenger service in 2018, with additional 692 locomotives used in cargo service. The Czech Ministry of Transport register shows a total of 843 electric, 1120 diesel, and 36 steam locomotives, with diesel locomotives representing about one quarter of the total rated power [4]. In 2018, 78,000 t of diesel fuel were consumed on Czech railroads [5] (including passenger and freight services and construction and maintenance work), corresponding, at 30–35% electric power generating efficiency, to 11–13% of the primary energy used on railroads.
Railroads have been both praised for their superior fuel efficiency compared to other means of transport and criticized for using diesel locomotives with several decades old engines, which were not subject to any emissions standard. Rail engine emissions standards were introduced in Europe relatively late in 2004 (Directive 2004/26/EC), and the exhaust emissions from locomotive diesel engines have not been as scrutinized as those of their on-road counterparts. On the other hand, compared to motor vehicle engines, locomotive engines are often conservatively rated, operate at relatively constant load with no abrupt transients, and release their exhaust about 4 m above railroad tracks, allowing for more separation from nearby citizens. With Czech cities, and most other cities in Europe, suffering from high concentrations of nitrogen oxides (NOx) and particulate matter (PM), with an annual toll of premature deaths in Europe of about 0.1% of the population [6] and associated economic damages of outdoor air pollution of about 5% of the Gross Domestic Product [7], and with diesel engines being one of the key sources of both NOx and PM, the question of emissions is a legitimate one.
Unfortunately, there are very limited data available on the emissions performance of rail vehicles, especially when it comes to their typical operation, which may differ from the test conditions of laboratory and rail yard tests.
Most diesel locomotives use electric power transmission: A diesel engine drives a direct current (DC) generator or an alternator with a semiconductor rectifier. The generated electric power is transmitted to direct (DC) or alternating current (AC) traction motors driving individual axles. In the Czech Republic, DC generators and DC traction motors are used. At higher currents, the torque of a DC traction series motor is approximately proportional to the motor current. The maximum traction motor current is an important locomotive design parameter, as it reflects the maximum torque on the driven wheels, and the maximum force exerted on the train. The current is regulated indirectly by regulating generator voltage, taking into the account the back-induced voltage on the traction motor, which is approximately proportional to the motor speed, and the traction motor impedance. At any given power output, the voltage increases and the current decreases with the rotational speed. On most locomotives, the maximum power output is limited at lower speeds by the maximum traction motor current, and at higher speeds by the rated maximum power.
Typically, the diesel engine rpm and torque and the generator voltage and current are controlled automatically, with the only user-selectable input being the desired power output. While some newer systems allow for continuous regulation of the power output, most traditional systems use eight discrete power levels, called notches (from notches on early control levers).
In theory, the acceleration of a train from a standstill therefore proceeds at maximum traction force up to a certain speed, and, beyond this speed, at maximum power. The engineer typically progresses through higher notches as the train accelerates. This is, however, not always readily apparent, as the control system increases the engine power gradually. The engineers thus often do not wait for the transition to the current notch setting to be completed before selecting a higher notch. The highest notch setting used during the acceleration often depends on the elevation profile of the track, the posted speed of the track, and the total weight of the train. The full locomotive power is utilized on the mainline rail with average or heavier trains, but rarely with short trains or on slower regional lines.
The traditional method of measuring emissions on a diesel-electric locomotive relies on stationary operation of the locomotive, where the diesel engine drives the generator, which is disconnected from the traction motors, and generated electrical power is directed to a load bank consisting of water-cooled resistors. The engine is then operated at discrete points. For example, the method prescribed by the U.S. Regulations [8,9] mandates operation at low and normal idle, followed by operation at notches 1–8. Emissions are measured during steady-state operation at each of the regimes with instrumentation typically located outside of the locomotive [10,11,12,13,14,15,16,17]. The measured emissions at each point are then aggregated into a weighted average by assigning a weight to each operating point.
This method does not necessarily represent realistic operation due to some simplifications. First, the procedure does not account for transient emissions during simultaneous acceleration of the engine and its transition to a higher load, which were visually observed by the authors on other locomotives, and which can account for a significant fraction of total PM emissions [18]. Second, the prescribed procedure may not properly account for the fraction of particulate matter which is retained in the engine and in the exhaust system at idle [19,20], and thus is not accounted for during idle, and is released after the transition of the engine to higher loads, with the levels gradually decreasing, and since the measurement is not started immediately after the change of the operating regime, it is not fully accounted for at higher loads either. Third, the prescribed procedure is markedly different from the typical operation of a passenger train locomotive, characterized by a relatively fast transition from lower to higher notches during acceleration. Fourth, the load bank procedure cannot be used with a diesel-hydraulic drivetrain, a widely used type of propulsion primarily on diesel rail units both in Czech Republic and in the rest of Europe [16,21].
As an alternative, on-track measurements using simple portable monitoring systems developed by the first author based on repair grade gas analyzers [22] and light scattering particle monitors [23] have been used in the Czech Republic [21,24] and the U.S. [25,26]. Another alternative to detailed tests of a relatively small number of vehicles is the remote sensing approach [27] allowing the measurement of a larger number of locomotives during passage through or near the measurement point [28,29].
This study sought to provide a realistic insight into the exhaust emissions from diesel locomotives and rail vehicles on Czech railroads, reviewing and reanalyzing data from several relevant monitoring campaigns conducted during real operation (analogous to real driving emissions of highway vehicles) with portable on-board emissions monitoring systems mounted on the tested machine.
The primary goal of this study was to characterize the emissions from diesel railcars and locomotives on Czech railroads under conditions relevant to normal, typical operation. This goal was motivated by the need to characterize the operating patterns and emissions of diesel-powered rail vehicles, in order to evaluate the potential for the utilization of advanced fuels, implementation of retrofits, and emissions benefits associated with redirecting a portion of transit long-haul truck traffic to rail.
The secondary goal of this study was to develop a methodology for practical measurement of exhaust emissions of in-use rail vehicles powered by internal combustion engines, preferably during their actual regular operation. This part was, in addition, motivated by the need to develop and demonstrate a suitable approach to measure real-world emissions on larger non-road engines (one possible definition is engines with rated power greater than 560 kW) using simple to install, robust on-board monitoring systems. Finally, the study was also motivated by the desire to demonstrate the suitability of a portable Fourier Transform Infra Red (FTIR) analyzer as a universal instrument for measurement of gaseous pollutants, including greenhouse gases and reactive nitrogen species that could be relevant to modern aftertreatment systems and advanced fuels.
2. Experimental
2.1. Rail Vehicles
The test rail vehicles, shown on a photograph in Figure 1, were a 749 series ČKD diesel-electric locomotive, a 754 series ČKD diesel-electric locomotive (both ČKD Praha, Czechoslovakia), and an 854 series diesel railcar (Vagónka Studénka, Czechoslovakia, now Škoda Vagónka a.s., Studénka, Czech Republic).
The 749 series is a four-axle, 75-t diesel-electric locomotive, made at ČKD Praha in 1968. It has one main engine, an inline, four-stroke, six-cylinder turbocharged diesel engine with four valves per cylinder, a bore of 310 mm, stroke of 360 mm, and displacement of 163 dm3 (liters), with rated power of 1100 kW at 750 rpm. The fuel is delivered by cam-driven unit injectors. The engine is coupled with a direct-current traction generator, a 3000 V direct-current generator for electrical heating of the railcars, a 120 V DC generator for the locomotive electrical system, an air compressor for brakes and accessories, and hydraulic motors for accessories, such as cooling fans. The traction generator supplies electric power to four traction motors, one at each driven axle.
The 754 series is a four-axle, 74-t diesel-electric locomotive, made at ČKD Praha in 1979, with an original twelve-cylinder turbocharged K 12 V 230 DR diesel engine (ČKD Praha) with a displacement of 129.5 dm3 and a rated power of 1460 kW at 1100 rpm. The fuel is delivered by cam-driven unit injectors. The engine is coupled with a 1100 kW DC traction generator directly feeding four DC traction motors, one at each axle. The engine also powers a 300 kW 3000 V DC auxiliary power generator for passenger car heating, air compressor, and various accessories.
The 854 series is a four-axle, 56-t diesel railcar with a rated capacity of 108 passengers, made at Vagónka Studénka in 1968. The railcar was originally fitted with a ČKD KS 12 V 170 DR engine coupled with a Praga hydrodynamic transmission with a torque converter. In 2004, the railcar was retrofitted with a Caterpillar 3412 E DI-TA turbocharged twelve-cylinder 29 dm3 engine, derated to 588 kW at 1460 rpm to maintain compatibility with the original transmission. The railcar is typically coupled with 1–3 non-motorized trailing cars depending on the anticipated travel demand.
2.2. Route and Testing Procedures
All three vehicles were, at the respective time of the tests, based at the depot Praha–Vršovice and used on scheduled service on Praha–Turnov–Tanvald line. The diesel-electric locomotives were used primarily on express service. The 854 railcar was used for both express and local service on Praha–Turnov segment in configurations comprising of none, one, two or three non-motorized trailing cars.
The Tanvald route (depicted in Figure 2 left) features runs from the Prague main station on a main line corridor with 3 kV direct current (DC) traction lines, and after about 7 km, separates from the mainline and steadily climbs from Prague onto a mid-country plateau. From Turnov, the track runs along the Jizera river gorge, and terminates with a steep climb along the Kamenice gorge into Tanvald, a small city in the Jizera mountains. The route is typically served by diesel units with 2–4 cars, with larger five-car trains operated on weekends due to tourist traffic.
The 749 locomotive was also temporarily used on the Praha–České Budějovice line. The Praha–Zdice–Písek–České Budějovice (displayed on map as Figure 2 right) line is a regional line through rolling country, with the first part to Zdice and last part to České Budějovice being part of main-line corridors with 3 kV DC (Prague region) and 25 kV, 50 Hz (České Budějovice region) traction lines [30]. This line is of regional significance; most of the through traffic uses the electrified Praha–Tábor–České Budějovice line.
It should be noted that, on all lines, at the end of the line, the locomotive was decoupled from the train, driven on a parallel track to the other side of the railcars, and coupled on the railcar on the opposite end. This is the normal procedure for nearly all Czech trains, and for this reason, all locomotives and railcars can be driven in either direction from either end of the train. For this reason, both cabins and the passageway through the engine compartment have to remain clear during operation. In addition, the doors between the engine compartment and the cabins need to remain closed for fire safety and noise protection reasons.
The engines were instrumented during scheduled maintenance at the locomotive depot, allowing for about half a day installation time. The instruments were operated continuously during the regular service and were removed several days later during a short refueling and maintenance visit to the depot. During the service, a test engineer was riding either in the momentarily vacant train engineer cabin or as a passenger on the train, periodically checking on the instruments at turnarounds or during longer stops.
2.3. Test Equipment
Emissions were measured with a home-made monitoring system constructed by the first author, utilizing components typical for a BAR 97 standard [32] garage-grade five-gas analyzer and a laser light scattering instrument (modified model 8587A, TSI, St. Paul, MN, USA), sampling raw, undiluted exhaust, reheated prior to its introduction into the analytical part of the instrument to approximately 50 °C to prevent condensation of the water vapor. A parallel line was coupled to an inline heater and a proportional sampling system collecting particles on a filter for gravimetric measurement of total particle mass.
The gas analyzer employed a non-dispersive infra-red (NDIR) cell (modified version of Andros 6500, Lumasense, CA, USA, approved to BAR 97 standard) to measure the concentrations of hydrocarbons (HC. 0–10,000 ppmC), carbon monoxide (CO, 0–10%), and carbon dioxide (CO2, 0–16%), and an electrochemical cell to measure nitric oxide (NO, 0–5000 ppm). None of the engines were equipped with any exhaust aftertreatment device; therefore, concentrations of NO2 in excess of several percent of the total NOx were not expected, and not measured. Gas analyzers normally require periodic zeroing and are subject to drifts caused by deposition of organic materials and water in the sample cell and by other factors. For this reason, two analyzers were often used in parallel [10,33]. Advances in analyzer technology, optimization of the warm-up procedure, addition of a reference channel, and extensive characterization of the analyzer in the laboratory have allowed for the use of a single analyzer without zeroing, with verification of the zero level at approximately 3-h intervals at each endpoint of the route.
The intake air mass flow was estimated using the speed-density method from the known engine displacement, the assumed engine volumetric efficiency, the engine rpm from the signal obtained from the locomotive control system (749 series) or directly measured by an optical sensor (754 and 854 series), and temperature and pressure of the charge in the intake manifold were measured by sensors inserted into a spare port in the intake manifold. This method was described in [34] and was reported to have a reasonable accuracy for road vehicle engines [23,33]. None of the engines used exhaust gas recirculation, so no compensation for the volume of the recirculated gas was necessary.
Analogous home-made and commercially produced monitoring systems have been used for on-road studies over the last two decades and have undergone extensive comparison testing. As a part of instrument validation for a California roadside truck study [35], total NOx and CO2 were measured by the portable system (using calculated exhaust flow) and by a laboratory (using a full-flow dilution tunnel) on a light duty diesel truck over multiple transient cycles driven multiple times. The correlation of total emissions per test (for the three monitoring systems, slopes were 1.05–1.06 for NOx and 0.94–0.96 for CO2, Pearson’s R2 coefficients were 0.991–0.997 for NOx and 0.990–0.998 for CO2). A similar comparison using three full-size diesel pickup trucks and a greater range of test cycles has shown a greater variance [34], approximately up to 15–20% for NOx, and, in most cases, approximately 20–30% for PM (quantitative data not given). As the total mass emissions per cycle are influenced by the concentration measurements, exhaust flow inference, and synchronization between concentration and exhaust flow data, a good agreement between the instruments on mass emissions over a transient cycle was taken as a validation of concentration and exhaust flow computations.
The monitoring system used here was tested at the state certification laboratory TUV-SUD Auto in Prague on a Euro 3 Iveco Tector highway diesel engine during both steady-state and transient tests. The intake air mass flow and the concentrations of CO, CO2, and NOx were comparable with the laboratory measurements (correlation of second-by-second data over European Transient Cycle: intake air flow, slope 0.986, R2 = 0.961; CO2, slope 0.964, R2 = 0.956; NOx, slope 0.949, R2 = 0.73; CO, slope 0.932, R2 = 0.627), except for the slower response for NOx, especially during decreasing concentrations, and for CO at very low concentrations (below about 0.02%).
The monitoring system has also undergone extensive comparison testing at the departmental engine laboratory on a Zetor 1505 tractor engine with a mechanically controlled inline injection pump and no aftertreatment, certified to approximately 4 g/kWh NOx and 0.3 g/kWh PM. The laser scattering method, when used with raw, undiluted exhaust, pumped at a relatively fast rate, reheated to prevent condensation of water in the instrument, provided a reading that was, during comparison tests, mostly within 20–25% of PM mass [36] when running on diesel fuel. However, previous experience of the first author [34] as well as of others [37] with this method and theoretical considerations of the density [38] and fractal dimension [38,39] all suggest that the light scattering instrument reading might be reasonably proportional to the mass concentration of PM, but not necessarily at a unity slope. Therefore, the PM measurements were calibrated with parallel gravimetric measurements during steady-state operation. For the 749 series tests, the gravimetric sampling system was analogous to the first part of the field PM measurement system described in CARB Method 5 [40] (without the second part consisting of impingers), working with undiluted exhaust, and was operated at 45–50 °C, a common temperature for diesel particulate measurement, and an allowed temperature under Method 5. Fluorocarbon coated borosilicate glass 47 mm diameter PallFlex T60A20 filters, conditioned and weighted prior to and twice after the testing using standard vehicular PM emissions measurement procedures [41], were used. For subsequent tests, proportional sampling system developed by the authors (description and validation in [42]) was used.
On the 854 series, a portable FTIR analyzer (modified I-series, MIDAC, Irvine, California, USA), was used to measure spectra in mid-infrared region (4000–650 cm−1) at 0.5 cm−1 optical resolution. The instrument uses a Michelson interferometer, zinc selenide optics, and mercury cadmium telluride detector cooled by liquid nitrogen, all housed in airtight enclosure, and a custom 6 m path length optical cell heated to 121 °C. The spectra were then interpreted for greenhouse gases CO2, CH4, and N2O, as well as CO, NO, NO2, ammonia, and formaldehyde, with quantitative assessment of the presence of additional compounds present at higher concentrations. The analysis was validated during laboratory and on-road tests of passenger cars [43]. In addition, on the 854 series, a commercial portable particle number monitoring instrument (NanoMet3, Matter Engineering, Switzerland), compliant with the EU requirements for solid particle number portable emissions monitoring systems (see [44] for review and uncertainty analysis), was used to measure non-volatile particle number concentrations. The instrument also reported the mean particle diameter and the total particle mass concentration. The FTIR and the NanoMet were supplied with a sample line operated at 150 °C.
On the two diesel-electric locomotives, analog voltage signals of the engine rpm and voltage and current on the traction generator were extracted from the locomotive control system and logged by a galvanically separated analog-to-digital converter. On the 854 series motor car, engine output power was inferred from the fuel consumption, calculated from total carbon exhaust emissions, and from brake-specific fuel consumption data provided by the manufacturer.
The position and speed of the locomotive was measured by a GPS receiver mounted on the side of the roof of the locomotive. The GPS was operational through most of the route, excluding tunnels and deep river gorges.
The overall uncertainty of the measurements (measured emissions vs. actual emissions from the measured unit at the time of the measurement) was estimated to be within 5% for concentrations of NOx, CO, and CO2; within 20–25% for PM and PN concentrations; within 2% for engine rpm, intake manifold pressure, and temperature; within 5% for measured power output; within 5–10% for the computed exhaust flow; within 10–15% for measured emissions of NOx, CO2, and fuel consumption; and within 30% for emissions of particulate matter (number and mass).
2.4. Installation and Exhaust Sampling
Before the tests, several visits to the depot were made to plan the test, consisting of a physical inspection of the locomotive, discussions with the depot personnel including a locomotive control system specialist and a train engineer, securing a permit for up to two researchers to be present on the locomotive, and an introductory trip in the locomotive on both lines by the third author, during which operation and track conditions were noted.
This preparation revealed several severe restrictions placed on the instrumentation, with the most severe one imposed by the presence of 3 kV or 25 kV traction lines directly above the exhaust stack. To prevent damage to the instruments or even a fault current through the locomotive chassis caused by an excessive proximity of the sampling system with the traction line, a well-secured sampling system which does not protrude upwards more than several cm was needed. Another critical condition was that the train service must not be delayed or disrupted.
The locomotives have cabins on both ends, with the rear-facing cabin theoretically offering sufficient room for placement of the instrumentation. The locomotive direction is, however, reversed in both Tanvald and České Budějovice, and during switching of the trailing cars at Praha hl.n. (Prague main station) and at Praha–Vršovice station. In addition, for security reasons, the door between the cabin and the engine compartment has to be closed during the operation, not allowing for easy passage of sample lines or electrical cables between the engine compartment and the cabin. The cabins are connected by a walkway on one side of the main engine, which has to remain passable for the engineer.
Attempts were made to use ports in the exhaust system, but these were well rusted-in, and could not be removed without the danger of breaking the bolt. Combined with the hazards posed by tree branches on the sides of the locomotive, and the absence of a roof opening into the cabin and of a passage between the cabin and the engine room, the conditions mandated a very frugal, simple, and robust installation of the sampling system, and placement of the monitoring system in the corner of the engine room opposite of the passageway, on the alternator side (Figure 3, Figure 4 and Figure 5).
These conditions dictated the choice of the monitoring system. Raw, undiluted exhaust was sampled by three separate 6 mm internal diameter copper probes, bent during installation to face into the stack, and directed along and grounded to the stack rim, on the roof, through a handle on the roof, and transitioning into 6 mm internal diameter conductive flexible polymer lines, leading through a crack in the partially open and secured engine compartment roof hatch into the engine control room, and along the roof of the control room to the instrument. On the 854 series, the sampling line was heated to 150 °C and heavily insulated.
The choice of electric power supply at the locomotive—110 V DC used in the locomotive electrical system, 3000 V DC for heating, and variable voltage from the traction generator—did not readily offer an option for powering of the instrumentation, which was supplied from two 12 V, 60 Ah absorbed gel mat, starved-electrolyte lead-acid deep-cycle batteries, except for the 854 series tests, where four 13.3 V, 90 Ah LiFeYPo traction batteries and a 2 kW inverter/charger were used due to heated sampling train. Prior to the tests, the power consumption of all components was strictly minimized to allow for 4–8 h of runtime on a single charge, with recharging wherever possible at end stations and overnight.
The instrumentation was galvanically separated from the locomotive, except for static charges dissipated through the conductive sampling lines (<106 Ohm/m) to the probes, which were grounded to the locomotive chassis. This setup was also selected to minimize a possible damage to the instrument from the presence of the traction lines.
3. Results
For a representative Praha–Tanvald run of the 749 locomotive, the running speed and power are plotted in the upper part, and the measured concentrations of CO, NO, and PM in the lower part, of Figure 6. Throughout the work, “power” denotes electrical power transmitted from the generator to the traction motors, which was the only kind of power that could be effectively measured.
The verification of the PM measurement by simultaneous gravimetric sampling took place during periods over which steady state operation was anticipated during this run. Nine filters were used: two served as a blank, two were damaged during handling in the moving locomotive, and five used for measurements. The PM concentrations determined from the filter measurements are plotted in Figure 7 and are overlaid on the continuous PM concentrations measurement by the nephelometer. It should be noted that each measurement uses a different axis, with nephelometer measurements being 65% higher than the gravimetric ones. The filter mass was not corrected for background concentrations, as undiluted exhaust was used. The change of the mass of two “blank” filters was within 2 µg.
Analogous plots are given for the Praha–České Budějovice run in Figure 8. In Figure 6 and Figure 8, it is apparent that the engine alternates between idle and a higher load level, given by the track profile and the mass of the train. The “higher load level” was higher on the Praha–Tanvald line, a hilly route traveled with a five-car train, and lower on the Praha–České Budějovice line, a nearly level line run with only two cars. The cumulative distributions of the locomotive power for both lines are given in Figure 9.
The transition from idle to a higher load is in several steps of a relatively short duration, with higher power levels selected as soon as the train speed becomes sufficient to keep the traction motor current below the maximum limit. The transition from a higher load level to idle is instantaneous. The track speed and the traction motor power and current are plotted for a typical acceleration to a higher cruising speed in Figure 10 (left), and to a lower speed in Figure 10 (right). Figure 10 also demonstrates the relationship between track speed and traction motor voltage, current, and power, discussed in the introduction.
As apparent in Figure 6, Figure 8, and Figure 10, the only operating points where the emissions were somewhat stabilized were idle and full-load (notch 8) accelerations of one to several minutes in duration. Even there, the values were far from stable. At idle, the combustion chamber gradually cooled down and the particle concentrations increased, while NOx concentrations decreased. The opposite trend was apparent after a transition to notch 8, with additional increases in particle concentration due to the reentrainment of previously deposited semivolatile particulate matter in the exhaust system [20]. For three selected longer uninterrupted accelerations at notch 8, the concentrations of particulate matter and NOx are shown in Figure 11. It is apparent that in none of the cases a steady-state value is reached. However, all type approval and in-use tests use steady-state values obtained at stabilized operation at a given notch. For comparison with legislative tests, stabilized values can be reasonably inferred by extrapolation of computed regression lines, as shown in Figure 11 along with regression equations obtained by an iterative process discussed in [45]. Such inference has, however, little relevance to the real world emissions, as it is not apparent that such steady-state values are reached during normal operation. For the same reason, modeling emissions by recording the notch used and assigning a corresponding steady-state emissions factor to the respective time period is of limited relevance.
The engine in the diesel-hydraulic railcar showed somewhat different operating characteristics. The control of the power output is continuous, and the engine is either at idle or within a relatively narrow working range of the rpm. Figure 12a shows the morning operation of the 854 railcar, consisting of switching at the depot and traveling to the station at 6:50–7:20, a local service from Praha to Mladá Boleslav from 7:35 to 9:20 in 1 + 1 configuration (854 + 1 trailing car), followed by switching to 1 + 0, a short local run, and a local run to Turnov. Fuel consumption in kg/h and track speed in km/h is shown on the right axis in the upper portion of the graph, while the lower portion of the graph shows particulate matter concentrations in the exhaust and PM mass emissions rates on the left axis.
The same variables are plotted in Figure 12b for the afternoon express service Turnov–Praha in 1 + 3 configuration (854 + 3 trailing cars, 14:30–17:30), followed by a local service from Praha to Mladá Boleslav in a 1 + 2 configuration (17:40–19:40), followed by a short local service there and a return trip, during which the measurements were terminated at an intermediate stop shortly after 21:00.
It is apparent that particulate matter emissions were high after a cold start (details in Figure 13a) and also after a transition to a high load for some period after the cold start or a longer idle, and there were moderate spikes following a transition from idle to a load. The fuel consumption at load was relatively steady, and ranged about 50–110 kg/h depending mostly on the number of trailing cars coupled to the 854 and on the track profile (track speed and incline). This fuel consumption corresponds to an engine-out power of slightly over 200 kWh to slightly over 500 kWh, or about 35–90% of the engine rated power. This pattern of the fuel consumption being more or less the same for most of the periods under load corresponding to the train engineers making a deliberate decision about the target power output depending on the total mass of the train, leading to comparable acceleration rates among train configurations. There is a lack of “steady-state“ operation: the train is accelerated at a pre-determined power to the desired speed (either the posted track speed or a speed chosen by the engineer), after which the train coasts down with the engine at idle until either another acceleration is commanded or the train approaches a station (see Figure 13b for detail of a local run). On the 854 railcar, braking is done by pneumatically controlled friction brakes; newer railcars use, in addition, a retarder built into the hydrodynamic transmission. Diesel-electric locomotives and railcars use electrodynamic braking, where electric power generated in traction motors is dissipated in resistor banks on the roof of the locomotive. The avoidance of fractional engine loads at cruise is beneficial to the fuel economy. It should also be noted that the engine is shut off for safety reasons during coupling and decoupling of the railcars, and also for fuel efficiency reasons during longer stops (over tens of minutes), unless the engine has been operated at a high load, in which case it is left idling to allow for removal of the heat from the engine compartment through cooling and active ventilation. The fuel consumption at idle (596–602 rpm) ranged from 3.4 to 5.6 kg/h, with variations attributed to accessory loads (alternator and air compressor supplying the whole train, cooling fan and cooling pumps of the engine).
PM and NOx emission rates as a function of the instantaneous fuel consumption are plotted in Figure 14. The slope of the graphs represents fuel-specific emissions (in grams per kg fuel). In addition, as engine power is nearly a linear function (with a non-zero offset) of the fuel consumption [46], brake-specific emissions in g/kWh may be inferred from the slope. Unfortunately, the slope is not linear and is not uniform. Higher PM is apparent during cold engine operation and during transients, but also, higher engine loads are characterized by—compared to medium loads—relatively lower PM and relatively higher NOx. The simultaneous relative increase in NOx and a relative decrease in PM resembles a typical shift along the diesel engine NOx–PM curve, and therefore appears to be a result of engine calibration, not necessarily applicable to rail engines in general.
The emissions, fuel consumption, and traction power (electric power delivered to traction motors, only available on 749), averaged over a line and expressed per km driven, are provided in Table 1. The 749, on its return to Prague, was stopped in Všetaty (near Prague) due to a temporary track closure, and sent back to Tanvald on another service, changing places with a train scheduled on the same run 2 h earlier, leading to gaps in data due to insufficient battery voltage. For express trains running from Praha to Tanvald, separate sums are shown for the Praha–Turnov segment and for the slow, mountainous Turnov–Tanvald segment. For the 854 railcar, different configurations were separated to allow for an assessment of train weight.
The fuel consumption and emissions at idle are given in Table 2. As the engine provides power for both traction and auxiliary services, which on electric locomotives also includes electric heating of cars (trailing cars for 854 use auxiliary diesel-fired heaters), the auxiliary loads can be considerable. For 749 and 754, electric heating increased, on average, the fuel consumption by 22 kg/h, and NOx emissions by 1.5–2.1 kg/h (depending on the engine temperature), calculated as the difference between the idle power consumption during periods with heating and during periods near the end of the run when the heating was not active. Much smaller variations are attributable to automatic operation of the air compressor and the auxiliary cooling fans. It should be noted that, on many mechanically controlled diesel engines with constant static injection timing, NOx per kg fuel increases with decreasing engine rpm, due to start of the combustion occurring earlier on a crank angle position basis. The electric heating power consumption is a function of the number of the railcars in the train, the setting of the heaters, and the temperature inside of the railcars.
To allow for comparison with other studies and to aid in calculations, the emission totals for each rail vehicle expressed in g/kg fuel are given in Table 3. To allow for comparison on per-ton and per-passenger bases, emissions per kilometer per ton (tkm) and per kilometer per seat (skm) are given in Table 4. The emissions per kilometer per passenger (pkm, not given in the table) can be obtained by dividing skm with the occupancy rate. The mean occupancy rate declared by Czech Railways (ČD) is 30%, which is in agreement with unofficial estimates by train conductors that about 70 people travel on a three-car (railcar plus two trailing cars) train with 168 seats. On regional and local trains, the total train capacity is approximately double the seating capacity. Typically, the minimum train capacity is contracted with the regional or state government, and additional capacity is added based on group reservations and anticipated travel demand.
4. Discussion
4.1. Feasibility of the Approach
The results suggest that, while measurements on a moving locomotive are technically very challenging, they are very feasible, and offer a very realistic image of the actual emissions, which vary greatly depending on the operating patterns of a given locomotive. Calibration of real-time PM measurement via laser light scattering by gravimetric method was found to be useful and can be recommended for applications where steady-state engine operation can be achieved, or with a proportional PM sampling system, as the intake air mass flow can be calculated online. Knowledge and careful consideration of the local operating environment—usual daily routines of the locomotives and train crews, sources of power and data, safety considerations including prohibited or non-feasible locations for instruments, cables or sample lines, the presence of overhead lines and clearance margins overall, and access to the instruments during testing—were found to be essential during the design and implementation of the test.
The PM emissions were found to be remarkably low for the decades old locomotive engines. It is, however, expected that the gradual engine deterioration was somewhat counteracted by improvements in the diesel fuel quality over the last four decades and by good maintenance practices. The engine in the 749 was part of an engine family originally developed as a marine engine with a conservative power rating, was known for its durability and reliability, and has outlived many successor models. Numerous visual observations of opacity levels of locomotives by the first author during regular travel suggest that at least the PM emissions vary among locomotives. The tested locomotive belonged to the large “cleaner” group, from which visible smoke was seldom observed, as opposed to a relatively small number of “high emitters”. This distribution is analogous to on-road vehicles, where few high emitters are responsible for a disproportionately high fraction of the total emissions. The measured values therefore do not necessarily represent the “average” locomotive, but more likely the emissions levels achieved (and achievable) with good maintenance practices.
The operating patterns were found to vary greatly from the prescribed test cycles. This was not as much the case with the cumulative distribution of engine load, which varied with route and train mass, but showed a good resemblance with the load distribution in stationary tests. On the Prague to Tanvald route, approximately 46% of time was spent at idle and approximately 18% at full load (notch 8), compared to 50.5% at idle and 16.2% at notch 8 specified for line-haul locomotive tests in the U.S. legislation [47]. The major difference was, however, in the sequencing of the operation points. While the test procedures generally start at idle and progress in steps to the full load, the real-world conditions exhibit much faster progressions to a higher load, and relatively short stays, of up to several minutes, at any given load setting. In addition, emission spikes during transients, and artifacts of PM storage during low-load operation during switching prior to the Praha to Tanvald run, were readily observable. It is possible that with a high fraction of organic carbon in the PM due to the introduction of biofuels and/or frequent operation at idle and low loads, the effects of the particle deposition and reentrainment phenomena may be of such magnitude that steady PM levels might seldom be reached during real-world operation.
Given the large difference in test cycle and real-world operating conditions, the test cycles may also be prone to “cycle beating”, a questionable but in recent history not uncommon practice of carelessly or even deliberately “tuning” the engine control unit so that the emissions are higher during real-world operation than during the prescribed test cycles [32,48,49,50,51,52,53].
The entire testing was accomplished without taking the locomotive out of service, without requesting unscheduled operation, and with minimal extra effort and expenses incurred by Czech Railways (ČD), which were limited primarily to logistics and initial technical advice. The presence of the test apparatus did not interfere with train operation. The locomotive was returned to the depot at the end of each test day, but the test apparatus, weighing less than 14 kg without batteries (FTIR and NanoMet additional 40 kg), could have been removed at any place en route without overhead traction lines. Aside from the gravimetric measurements, it is anticipated that the presence of technicians on the locomotive might not be necessary during routine testing. At the same time, first-hand observations by the authors were found to be quite valuable in understanding the context of the data collected. It is the opinion of the first author that many emissions studies could be greatly improved just by understanding and taking into account the processes involved, which is not an easy task given the highly interdisciplinary nature of the subject.
From the exposure and emissions hot-spots perspective, of highest relative concern appears to be emissions during the departure from the station, although it can be argued that, even there, the exhaust is dispersed well away from people compared to the case of highway vehicles. From the regional emissions perspective, the operation of the train is very efficient, and, due to very conservative engine ratings and relatively infrequent transients compared to road vehicles, the overall emissions can be very low when divided among the number of passengers, and in most cases lower than for cars and buses even with old locomotives. Additional data are, of course, needed to quantify such statements.
The use of FTIR and NanoMet is believed to be of key significance for new technologies and fuels, and was tested here despite higher power consumption and mass compare to the simpler monitoring system, which was capable of providing comparable NO readings. Potent greenhouse gases methane (from gaseous fuels) and nitrous oxide (from NOx aftertreatment) and key reactive nitrogen species (including, but not limited to, NO, NO2, and ammonia) can be readily measured with FTIR. NanoMet allows for measurement of very small particles at low concentrations. The prime reason these instruments were included was to test their response in the specific conditions of the locomotive engine room. The infrared spectra were additionally evaluated for noise around 4 µm (2500 cm−1) region showing virtually no absorption during exhaust measurements. The operation of both FTIR and NanoMet was flawless, suggesting that this combination can be used in future locomotive studies.
4.2. Comparison with Other Published Data
Graver et al. [54] and Frey et al. [55] (only relative data are reported in [54], figures used here calculated from data given in [55]) reported the fuel consumption of a three-car train on the 278 km Piedmont (Charlotte to Raleigh) route in North Carolina as 531–713 kg, or about 1.5–1.9 g/km. The Piedmont route trains, however, operated at higher average (about 90 km/h) and maximum (127 km/h) speeds, compared to the track speeds of 80 or 100 km/h, and even lower in river gorges and other areas with poor visibility, in this study. The fuel-specific emissions of NOx (55–64 g/kg) were comparable to this study (48–75 g/kg), while PM emissions (1.6–1.8 g/kg based on data taken from Table 9.1 in [55]; similar ratio is in Table 8.5 in [55]) were higher than measured here (0.16–0.65 g/kg).
The fuel consumption reported in this study is similar to 3–5 mL (cm3) per gross ton-km reported by Johnson et al. [28], while NOx emissions are about double (48–75 g/kg) compared to those (28 ± 14 g/kg) measured by Johnson et al., while PM emissions observed here (0.16–0.65 g/kg) are considerably lower than those (1.1 ± 0.5 g/kg) measured in [28]. One possible reason is that the runs here were all on ultra low sulfur diesel fuel, while the authors of [28] reported emissions of SO2 of (1.4 ± 0.4) g·kg−1, corresponding to thousands of ppm of S in the fuel. Another possible reason could be the difference in the combustion timing among the engines. Higher NOx and lower PM observed in this study for both ČKD engines may possibly be attributable to earlier start of combustion compared to engines tested in [28], many of which probably were, unlike the old ČKD engines in 749 and 754, subject to U.S. Tier 0–2 standards. This has not been verified as actual injection timing was not found for any of the engines discussed. Another possible reason is the inclusion of high emitters: Graver et al. [54] and this study used several specimens with advance permission of the owner, making an inclusion of a high emitter unlikely, while Johnson et al. [28] tested a higher number of locomotives. A difference between this study and that in [55] could be the calibration of the light scattering sensor for the specific aerosol. In [55], a multiplication factor of five compared to (an undisclosed) calibration of the unit was used. In this study, light scattering measurement used on 749 and 854 was calibrated by the gravimetric method, with differences in both direction (under- and over-statement) on the order of tens of percent.
An older Czech study [56] states the 2004 passenger load and energy consumption of 5030 million passenger-kilometers and 1428 TJ for electric traction and 1560 million pkm and 1171 TJ for diesel traction, corresponding to energy intensity of 79 Wh/pkm for electric traction and 209 Wh/pkm for diesel traction (at 35% mean combined efficiency of diesel engine and generator, this translates to 73 Wh/pkm traction power and fuel consumption of 18 g/pkm). The mean emissions for diesel traction were reported as 1.2 g/tkm NOx and 80 mg/tkm PM and 0.60 g/pkm NOx and 46 mg/pkm PM. At 30% occupancy, the NOx values are in agreement, while the measured PM values are about an order of magnitude lower.
The current emissions factors used in the national inventory, the latest ones dating to 2006, were 33.9 g/kg for NOx and 2.62 g/kg for particulate matter (total, not PM2.5 or PM10) [57]. Another source states NOx emissions factors of 42.3 g/kg NOx [58], a value adopted from heavy-duty highway engines due to lack of data for rail engines. It is apparent, from comparison with Table 2, that the results obtained here show considerably higher NOx emissions and considerably lower PM emissions than estimated in the emissions inventory.
The European Environmental Agency, in a recent (2019) document, uses Tier 1 emissions (rail vehicle without closer specification of model, type, and operating conditions) of 52.4 g/NOx, 1.52 g/kg total PM, 1.44 g/kg PM10, and 1.37 g/kg PM2.5. Tier 2 emissions (rail vehicle of known type without close specifications of size, age, and operating conditions) for line-haul locomotives are 63 g/kg NOx and 1.1 g/kg PM2.5, and those for railcars are 39.9 g/kg NOx and 1 g/kg PM2.5 [59].
4.3. Mitigation Options
It is apparent from the data that a considerable portion of energy is expended to accelerate the train, some of which may be recovered if electrodynamic braking and on-board electric power storage is used. Battery storage may also allow for a smaller engine to be used. Not considering the Ceske Budejovice run where only two railcars were pulled, and excluding switching operation, the average utilization of engine power on the 749 and 754 was (very roughly) around 20% of the rated power. The engines can therefore be replaced with engines analogous to higher-power heavy-duty trucks, in the mid-hundreds of kW range, equipped with standard diesel aftertreatment (oxidation catalyst, particle filter, and NOx reduction catalyst), a larger battery bank, and the necessary power electronics. For the North Carolina Dept. of Transportation Piedmont service described in [44], the average engine load was somewhere (very roughly) around 1 MW, or about 40%, not offering much benefit in terms of improved brake-specific efficiency, but possibly in terms of recuperating kinetic energy lost during braking.
The emissions associated with generation of electric power for railcar heating are relatively very high, and could be mitigated by using electric power at the depot and at the end stations, a practice already being implemented over time where feasible.
Due to the passenger loads on non-electrified tracks being relatively low (relative to the mainline rail in the Czech Republic), it is expected that diesel locomotives will be replaced by railcars and units, reducing the mass of the train. The reason the 854 railcar did not show substantial fuel economy benefits over locomotive driven trains is the rather low efficiency of the hydraulic power transmission, causing a higher fuel consumption per ton-km compared to the locomotives, as shown in Table 3.
4.4. Are Old Diesel Locomotives Eco-Friendly Compared to Cars?
At roughly 4 g of fuel per ton-km, the fuel consumption per ton is nearly an order of magnitude lower compared to passenger cars. On the other hand, the vehicle mass per passenger, considering about 30% occupancy rates of both cars and trains, is 2–3 times higher for rail vehicles than for automobiles. However, the train is, overall, several times more fuel efficient than a car. Considering the 30% occupancy of both, cars and trains can be roughly compared on a per-seat basis. The per-seat emissions of NOx measured here, about 0.25 g per seat and km, are tens of percent higher compared to an average European diesel automobile, Euro 2–5, with slightly under 1 g/km NOx. The PM emissions of about 2 mg per seat and km represent the lower end of the range for diesel engines without a particle filter (which account for about half of the diesel automobiles and for about one third of all automobiles being driven on Prague roads). It should also be noted that, on automobiles, NOx and PM emissions typically increase with the severity of congestion, and their exhaust is released in the streets in the immediate vicinity of other people, while many fewer people are expected to receive a “direct hit” by locomotive exhaust. The emissions of some of the oldest rail engines operating in a relatively inefficient regional service can therefore be classified as “not that bad” compared to not-so-old cars when it comes to NOx and PM, and superior even to new automobiles on a greenhouse gas emissions basis. Of course, NOx and PM can be readily reduced by exhaust aftertreatment, replacement of the engine, or replacement of the whole vehicle. In terms of transition to electric power, replacement of the diesel engine with a MWh-sized battery bank, which would be charged from overhead traction lines or a limited number of fixed charging stations, seems much closer to today’s reality than a similar switch in the general car fleet. Already, the incremental increase in ridership on the electric-powered trains among Prague, Brno, and Ostrava, the three largest Czech cities, by far surpasses the travel by all electric cars in the country.
5. Conclusions
Exhaust emissions of particulate matter, nitrogen oxides, and other pollutants from two diesel-electric locomotives and one diesel-hydraulic railcar were measured during regular scheduled passenger service. Low-power portable emissions monitoring instruments were installed during scheduled maintenance into engine compartments and were sampling raw exhaust from the stack. Due to space constraints and overhead electric traction lines, exhaust flow was computed from engine operating data.
The chosen approach was found to be feasible, the instruments worked well, and realistic data was obtained at reasonably cost and at no disruption to the train operation. The use of a NanoMet3 to measure non-volatile particle number concentrations and a portable FTIR capable of measuring a wide range of gaseous pollutants demonstrates that such instrumentation could be used to test newer engines with advanced exhaust aftertreatment. Tests were done at very low costs with no disruption of the train service, yielded realistic data, and are also applicable to diesel-hydraulic units which cannot be tested at standstill.
Real-world operation was characterized by relatively fast power level transitions during accelerations and interleaved periods of high load and idle, and varied considerably among service type and routes. Spikes in PM emissions during accelerations and storage of PM in the exhaust were observed. On all three engines, all near the end of their useful life, NOx emissions were 48–75 g per kg fuel and PM emissions were 0.16–0.65 g per kg fuel (averages over several hours of service). Relative to other published data and emission factors used in models, NOx emissions were comparable or slightly higher, while PM emissions were considerably lower. Despite all engines approaching the end of their life, NOx and PM emissions per passenger-km were very surprisingly low compared to those from European diesel automobiles (Euro 2–5 without a particle filter, but also the Czech “fleet average”).
Similar approach can probably be used on other non-road engines, including large engines over 560 kW used on railroads, inland waterways, construction sites, and in stationary applications. Such engines are difficult and in many cases nearly impossible to test in laboratory or in a stationary mode.
Author Contributions
Conceptualization, M.V.-L. and J.J.; methodology, all; software, M.V.-L.; validation, M.V.-L. and M.P.; formal analysis, M.V.-L. and M.P.; investigation, all; instrumentation design, M.V.-L.; installing instruments and running experiments, all; resources, all; data curation, M.V.-L. and M.P.; writing—original draft preparation, M.V.-L.; writing—review and editing, all; visualization, M.V.-L. and M.P.; supervision, all; project administration, all; and funding acquisition, M.V.-L. and J.J. All authors have read and agreed to the published version of the manuscript.
Funding
FTIR acquisition and development—EU project MEDETOX—Innovative Methods of Monitoring of Diesel Engine Exhaust Toxicity in Real Urban Traffic (LIFE10 ENV/CZ/651); NanoMet3 acquisition—Czech Ministry of Education CZ.1.05/2.1.00/19.04.08.; 749 tests—no external funding; 854 tests—LIFE10 ENV/CZ/651; 754 tests—Student Grant Competition of the Czech Technical University in Prague, grant number 16/106/OHK2/1T/16; and ex-post validation, new analysis and writing—EU project uCARe, You can also reduce emissions, H2020 project No. 815002.
Acknowledgments
The 749 tests were done on a volunteer basis, following up on J.J. request for emissions estimates and M.V. proposal to determine emissions by direct measurements. Jaroslav Opava (Czech Technical University in Prague) was M.S. thesis supervisor of J.J. and arranged for load bank tests (not reported on here), which led to the on-track tests. In addition to all authors performing the measurements, Luboš Dittrich and Michael Fenkl (Technical University of Liberec) helped with 749 and 854 tests, and Vít Beránek (Czech Technical University in Prague) helped with 754 tests. Michal Strapko (Czech Technical University in Prague) helped with electrical wiring of sensors and battery pack. Numerous technicians and train engineers from the Czech Railways (ČD) locomotive depot in Prague provided useful information and help during planning, installation, and measurements.
Conflicts of Interest
The authors declare no conflict of interest. The funders had no role in the design of the study; in the collection, analyses, or interpretation of data; in the writing of the manuscript, or in the decision to publish the results.
References
- Mašková, K. Economy of Railway Transport from the Point of View of the Client. Master’s Thesis, Czech Technical University, Prague, Czech Republic, 2019. [Google Scholar]
- Ministry of Transport of the Czech Republic. Quarterly Rail Transport Report for 2018; Ministry of Transport of the Czech Republic: Prague, Czech Republic, 2019.
- Czech Railways. 2018 Annual Report; Czech Railways: Prague, Czech Republic, 2019. (In Czech) [Google Scholar]
- SYDOS (Office of Transport Statistics). Rail Vehicles; Czech Ministry of Transport: Prague, Czech Republic, 2019.
- SYDOS (Office of Transport Statistics). Energy Consumption in the Rail Sector; Czech Ministry of Transport: Prague, Czech Republic, 2019.
- European Environment Agency (EEA). Air Quality in Europe—2018 Report; EEA: København, Denmark, 2018; ISBN 978-92-9213-990-2. [Google Scholar]
- World Bank and Institute for Health Metrics and Evaluation. The Cost of Air Pollution: Strengthening the Economic Case for Action; World Bank and Institute for Health Metrics and Evaluation: Washington, DC, USA, 2016. [Google Scholar]
- U.S. Federal Government. Title 40, Part 92, Section 124 and 131, Title 40, Parts 85, 86 and 92, Title 40, Parts 1065 and 1033. In U.S. Code of Federal Regulation; Federal Chronicle Office (United States): Washington, DC, USA, 1938. [Google Scholar]
- U.S. Locomotive Emissions Standards. Available online: http://www.dieselnet.com/standards/us/loco.php (accessed on 17 April 2020).
- Frey, H.C.; Choi, H.W.; Kim, K. “Measurement of the energy use and emissions of passenger rail locomotives using a portable emission measurement system,” paper 2009-A-243-AWMA. In Proceedings of the 102nd Annual Conference and Exhibition, Air & Waste Management Association, Detroit, MI, USA, 16–19 June 2009. [Google Scholar]
- Fritz, S.G. Evaluation of Biodiesel Fuel in an EMD GP38-2 Locomotive. Report by Southwest Research Institute for National Renewable Energy Laboratory, Golden, CO, Contract No. DE-AC36-99-GO10337, Document No. NREL/SR-510-33436. 2004. Available online: http://www.nrel.gov/docs/fy04osti/33436.pdf (accessed on 17 April 2020).
- Federal Railroad Administration; U.S. Department of Transportation. Locomotive Exhaust Emissions. Research Results RR 09-18 September 2009. Available online: http://www.fra.dot.gov/downloads/research/rr0918.pdf (accessed on 17 April 2020).
- Transport Canada. Locomotive Emissions Monitoring Program 2007. Available online: http://www.tc.gc.ca/eng/programs/environment-ecofreight-about-voluntary-racemissions2007-5-341.htm (accessed on 17 April 2020).
- BNSF Railway Company; Union Pacific Railroad Company; The Association of American Railroads and California Environmental Associates. An Evaluation of Natural Gas-Fueled Locomotives. Report 2007. Available online: http://www.arb.ca.gov/railyard/ryagreement/112807lngqa.pdf (accessed on 17 April 2020).
- Honc, R.L.; Fritz, S.G.; Osborne, D.T.; Grisier, R.; Carpenter, S. Exhaust emissions and fuel consumption of a railpower RP20BD switcher locomotive. In Proceedings of the 2009 Spring Technical Conference of the ASME Internal Combustion Engine Division; ICES: Toronto, ON, Canada, 2009; pp. 379–387. [Google Scholar]
- Savant, A.A.; Nigam, A.; Miller, J.W.; Johnson, K.C.; Cocker, D.R. Regulated and non-regulated emissions from in-use diesel-electric locomotives. Environ. Sci. Technol. 2007, 41, 6074–6083. [Google Scholar] [CrossRef]
- Evaluation of Emissions and Performance of NJ Transit Diesel Locomotives with B20 Biodiesel Blends. Available online: http://www.nj.gov/dep/oce/biodiesel_njtransit_summary.pdf (accessed on 17 April 2020).
- Yanowitz, J. Particulate matter emissions during transient locomotive operation: Preliminary study. J. Air Waste Manag. Assoc. 2003, 53, 1241–1247. [Google Scholar] [CrossRef] [PubMed] [Green Version]
- Johnson, J.E.; Kittelson, D.B. Deposition, diffusion, and adsorption in the diesel oxidation catalyst. Appl. Catal. B Environ. 1996, 10, 117–137. [Google Scholar] [CrossRef]
- Vojtisek-Lom, M.; Pechout, M.; Dittrich, L.; Beranek, V.; Kotek, M.; Schwarz, J.; Vodicka, P.; Milcova, A.; Rossnerova, A.; Ambroz, A.; et al. Polycyclic aromatic hydrocarbons (PAH) and their genotoxicity in exhaust emissions from a diesel engine during extended low-load operation on diesel and biodiesel fuels. Atmos. Environ. 2015, 109, 9–18. [Google Scholar] [CrossRef]
- Vojtisek-Lom, M.; Jirků, J.; Opava, J. Measurement of exhaust emissions of railroad locomotives using an on-board system. In Proceedings of the 14th ETH Conference on Combustion Generated Nanoparticles, Zurich, Switzerland, 1–4 August 2010. [Google Scholar]
- Vojtisek-Lom, M.; Cobb, J.T., Jr. Measurement, variance and reduction of real-world emissions of 20 dedicated CNG vans. In Proceedings of the 1998 91st Annual Meeting & Exposition of the Air & Waste Management Association, San Diego, CA, USA, 14–18 June 1998. Code 49496. [Google Scholar]
- Vojtisek-Lom, M.; Allsop, J. Development of Heavy-Duty Diesel Portable, On-Board Mass Exhaust Emissions Monitoring System with NOx, CO2 and Qualitative PM Capabilities; SAE Technical Paper 2001-01-3641; SAE International: Warrendale, PA, USA, 2001. [Google Scholar] [CrossRef]
- Vojtisek-Lom, M.; Jirků, J. Operating History Artifacts of Large Engine Particulate Matter Emissions Measurement. In Proceedings of the ASME 2012 Internal Combustion Engine Division Spring Technical Conference, ASME 2012 Internal Combustion Engine Division Spring Technical Conference, Torino, Italy, 6–9 May 2012; pp. 101–110. [Google Scholar]
- Graver, B.M.; Frey, H.C. Comparison of locomotive emissions measured during dynamometer versus rail yard engine load tests. Transp. Res. Rec. 2013, 2341, 23–33. [Google Scholar] [CrossRef]
- Graver, B.M.; Frey, H.C. Comparison of over-the-rail and rail yard measurements of diesel locomotives. Environ. Sci. Technol. 2015, 49, 13031–13039. [Google Scholar] [CrossRef]
- Popp, P.J.; Bishop, G.A.; Stedman, D.H. Remote Sensing of Railroad Locomotive Emissions: A Feasibility Study; The Federal Highway Administration: Washington, DC, USA, 1999.
- Johnson, G.R.; Jayaratne, E.R.; Lau, J.; Thomas, V.; Juwono, A.M.; Kitchen, B.; Morawska, L. Remote measurement of diesel locomotive emission factors and particle size distributions. Atmos. Environ. 2013, 81, 148–157. [Google Scholar] [CrossRef] [Green Version]
- Krasowsky, T.; Daher, N.; Sioutas, C.; Ban-Weiss, G. Measurement of particulate matter emissions from in-use locomotives. Atmos. Environ. 2015, 113, 187–196. [Google Scholar] [CrossRef]
- Base Map: Czech Republic Railroad Map. Available online: http://mapa.rychnovsky.cz/CD.gif (accessed on 17 April 2020).
- Map Server. Available online: http://www.mapy.cz (accessed on 17 April 2020).
- Bureau of Automotive Repair. Available online: www.bar.ca.gov (accessed on 25 May 2020).
- Vojtisek-Lom, M.; Fenkl, M.; Dufek, M.; Mares, J. Off-Cycle, Real-World Emissions of Modern Light-Duty Diesel Vehicles; SAE Technical Paper Series; Paper No. 2009-24-0148; Society of Automotive Engineers: Warrensdale, PA, USA, 2009. [Google Scholar]
- Vojtisek-Lom, M.; Cobb, J.T. Vehicle mass emissions measurement using a PorTable 5-Gas exhaust analyzer and engine computer data. In Proceedings of the EPA/A&WMA Emission Inventory Meeting; IEIC: Research Triangle Park, NC, USA, 1997. [Google Scholar]
- Vojtisek-Lom, M.; Lambert, D.; Wilson, P. Real-World Emissions from 40 Heavy-Duty Diesel Trucks Recruited at Tulare, CA Rest Area, SAE Technical Paper 2002-01-2901. Available online: https://doi.org/10.4271/2002-01-2901 (accessed on 17 April 2020).
- Vojtíšek-Lom, M.; Pechout, M.; Blažek, J.; Moc, L.; Hlavenka, T. Effects of Current and Prior Operating Conditions on Particulate Matter Emissions from a Diesel Engine Operated on Heated Rapeseed Oil, SAE Technical Paper 2009-01-1913. 2009. Available online: https://doi.org/10.4271/2009-01-1913 (accessed on 17 April 2020).
- Moosmueller, H.; Arnott, W.P.; Rogers, C.F.; Bowen, J.L.; Gillies, J.A.; Pierson, W.R.; Collins, J.F.; Durbin, T.D.; Norbeck, J.M. Time resolved characterization of diesel particulate emissions. 1. instruments for particle mass measurements. Environ. Sci. Technol. 2001, 35, 781–787. [Google Scholar] [CrossRef]
- Maricq, M.M.; Xu, N. The effective density and fractal dimension of soot particles from premixed flames and motor vehicle exhaust. Aerosol Sci. 2004, 35, 1251–1274. [Google Scholar] [CrossRef]
- Di Stasio, S. Optics of fractal structures. In Proceedings of the GAeF-Meeting 2008 on Light Scattering: Mie and More; GAeF: Karlsruhe, Germany, 2008. [Google Scholar]
- Determination of Particulate Matter Emissions from Stationary Sources. California Air Resources Board Test Method 5. Available online: http://www.arb.ca.gov/testmeth/vol1/m_5.pdf (accessed on 17 April 2020).
- European Parliament. European Parliament Directives 2004/26/ES and 97/68/ES; European Parliament: Brussels, Belgium, 2004. [Google Scholar]
- Vojtisek, M.; Pechout, M. Assessment of a low-cost portable proportional exhaust sampling system for gravimetric particulate matter emissions measurement. J. Middle Eur. Constr. Des. Cars 2013, 11, 22–28. [Google Scholar] [CrossRef]
- Suarez-Bertoa, R.; Mendoza-Villafuerte, P.; Riccobono, F.; Vojtisek, M.; Pechout, M.; Perujo, A.; Astorga, C. On-road measurement of NH 3 emissions from gasoline and diesel passenger cars during real world driving conditions. Atmos. Environ. 2017, 166, 488–497. [Google Scholar] [CrossRef]
- Giechaskiel, B.; Bonnel, P.; Perujo, A.; Dilara, P. Solid particle number (SPN) portable emissions measurement systems (PEMS) in the European legislation: A review. Int. J. Environ. Res. Public Health 2019, 16, 4819. [Google Scholar] [CrossRef] [PubMed] [Green Version]
- Vojtíšek-Lom, M. Inference of steady-state non-road engine exhaust emissions values from non-stabilized data. SAE Tech. Pap. Ser. 2012. [Google Scholar] [CrossRef]
- Thompson, G.J.; Clark, N.; Gautam, M.; Carder, D.K.; Lyons, D.W. Inference of torque and power from heavy-duty diesel engines for on-road emissions monitoring. SAE Tech. Pap. Ser. 2002. [Google Scholar] [CrossRef]
- U.S. Federal Government. Title 40: Protection of the environment, volume 1033: Control of emissions from locomotives, section 1033.530: Duty cycles and calculations. In United States Code of Federal Regulation; Federal Chronicle Office (United States): Washington, DC, USA, 1938. [Google Scholar]
- Kågeson, P. Cycle-Beating and the EU Test Cycle for Cars; European Federation for Transport and Environment (T&E): Brussels, Belgium, 1998. [Google Scholar]
- Kelly, N.A.; Groblicki, P.J. Real-world emissions from a modern production vehicle driven in los angeles. Air Waste 1993, 43, 1351–1357. [Google Scholar] [CrossRef]
- Weiss, M.; Bonnel, P.; Hummel, R.; Provenza, A.; Manfredi, U. On-road emissions of light-duty vehicles in Europe. Environ. Sci. Technol. 2011, 45, 8575–8581. [Google Scholar] [CrossRef]
- Weiss, M.; Bonnel, P.; Kühlwein, J.; Provenza, A.; Lambrecht, U.; Alessandrini, S.; Carriero, M.; Colombo, R.; Forni, F.; Lanappe, G.; et al. Will Euro 6 reduce the NOx emissions of new diesel cars?—Insights from on-road tests with Portable Emissions Measurement Systems (PEMS). Atmos. Environ. 2012, 62, 657–665. [Google Scholar] [CrossRef]
- Degraeuwe, B.; Weiss, M. Does the New European Driving Cycle (NEDC) really fail to capture the NOX emissions of diesel cars in Europe? Environ. Pollut. 2017, 222, 234–241. [Google Scholar] [CrossRef]
- Suarez-Bertoa, R.; Valverde, V.; Clairotte, M.; Pavlovic, J.; Giechaskiel, B.; Franco, V.; Kregar, Z.; Astorga, C.; Ricardo, S.-B.; Victor, V.; et al. On-road emissions of passenger cars beyond the boundary conditions of the real-driving emissions test. Environ. Res. 2019, 176, 108572. [Google Scholar] [CrossRef]
- Graver, B.M.; Frey, H.C.; Hu, J. Effect of biodiesel fuels on real-world emissions of passenger locomotives. Environ. Sci. Technol. 2016, 50, 12030–12039. [Google Scholar] [CrossRef] [PubMed]
- Frey, H.C.; Rastogi, N. Evaluation of Locomotive Emissions Reduction Strategies; North Carolina Department of Transportation Project No. 2016–20, Report No. FHWA/NC/2016-20; North Carolina State University: Raleigh, NC, USA, 2018. [Google Scholar]
- Zeman, J. Energy and environmental performance of transport modes in the Czech Republic. Vědeckotechnický Sborník ČD 2007, 23, 1–16. (In Czech) [Google Scholar]
- Špička, L.; (Center for Transport Research, Brno, Czech Republic). Personal Communication, 2020.
- Dufek, J.; Huzlík, J.; Adamec, V. Stanovení Emisí Látek Znečišťujících Ovzduší z Dopravy. (Development of Emissions Factors for Air Pollutants from Transport); Contract No. CE 801/210/09; Center for Transport Research: Brno, Czech Republic, 2006. (In Czech) [Google Scholar]
- Norris, J.; Ntziachristos, L.; Samaras, Z.; Zierock, K.-H. Railways. In EMEP/EEA Air Pollutant Emission Inventory Guidebook; European Environmental Agency: København, Denmark, 2019. [Google Scholar]
Figure 1.
Test vehicles: (a) ČKD Series 749 diesel-electric locomotive, ČKD; (b) Vagónka Sduténka diesel railcar series 854 with hydraulic power transmission; and (c) ČKD 754 Series diesel-electric locomotive.
Figure 1.
Test vehicles: (a) ČKD Series 749 diesel-electric locomotive, ČKD; (b) Vagónka Sduténka diesel railcar series 854 with hydraulic power transmission; and (c) ČKD 754 Series diesel-electric locomotive.

Figure 2.
Test routes marked on the Czech railroad network (top) [30] and on cartographical maps (bottom) with associated elevation profiles (source: [31]) with highlighted operated routes and marked major points: Praha–Tanvald (left): 2, Vsetaty; 3, Mlada Boleslav; and 4, Turnov; Praha–Ceske Budejovice (right): 2, Zdice; 3, Pisek.

Figure 3.
ČKD Series 749 diesel-electric locomotive: ČKD K 6 S 310 DR engine (left); locomotive controls (middle); and portable emissions monitoring system (right).
Figure 3.
ČKD Series 749 diesel-electric locomotive: ČKD K 6 S 310 DR engine (left); locomotive controls (middle); and portable emissions monitoring system (right).

Figure 4.
ČKD Series 754 diesel-electric locomotive tests: heated sampling line (top left); cabin door detail (top right); portable emissions monitoring system (bottom left); ČKD K 12 V 230 DR engine (bottom right).
Figure 4.
ČKD Series 754 diesel-electric locomotive tests: heated sampling line (top left); cabin door detail (top right); portable emissions monitoring system (bottom left); ČKD K 12 V 230 DR engine (bottom right).

Figure 5.
Series 854 diesel-hydraulic railcar tests: installation of the sampling line (left); sampling probe (middle); and portable emissions monitoring system (right).
Figure 5.
Series 854 diesel-hydraulic railcar tests: installation of the sampling line (left); sampling probe (middle); and portable emissions monitoring system (right).

Figure 6.
Measured values of running speed and generator power output (top); and concentrations of NOx, PM, and CO in the exhaust (bottom) of the ČKD 749 diesel-electric locomotive pulling a five-car, 297 t passenger train on the Praha–Tanvald line along a foothills route.
Figure 6.
Measured values of running speed and generator power output (top); and concentrations of NOx, PM, and CO in the exhaust (bottom) of the ČKD 749 diesel-electric locomotive pulling a five-car, 297 t passenger train on the Praha–Tanvald line along a foothills route.

Figure 7.
Comparison of particulate matter concentrations measured dynamically by light scattering with gravimetric measurements conducted during steady-state operation at idle and high load.
Figure 7.
Comparison of particulate matter concentrations measured dynamically by light scattering with gravimetric measurements conducted during steady-state operation at idle and high load.

Figure 8.
Measured values of running speed and generator power output (top); and concentrations of NOx, PM, and CO in the exhaust (bottom) of the ČKD 749 diesel-electric locomotive pulling a two-car, 160-t passenger train on the Praha–České Budějovice line.
Figure 8.
Measured values of running speed and generator power output (top); and concentrations of NOx, PM, and CO in the exhaust (bottom) of the ČKD 749 diesel-electric locomotive pulling a two-car, 160-t passenger train on the Praha–České Budějovice line.

Figure 9.
Cumulative distribution of locomotive generator output for the Praha–Tanvald line per schedule and with rides to/from depot and shunting cars at endpoints, and for major incline sections of this line along river gorges, and for Praha–České Budějovice line.
Figure 9.
Cumulative distribution of locomotive generator output for the Praha–Tanvald line per schedule and with rides to/from depot and shunting cars at endpoints, and for major incline sections of this line along river gorges, and for Praha–České Budějovice line.

Figure 10.
Generator voltage, current and power, running speed, and concentrations of NOx, CO, and PM during an acceleration of the five-car train from a station to high speed (left) and to a lower speed (right).
Figure 10.
Generator voltage, current and power, running speed, and concentrations of NOx, CO, and PM during an acceleration of the five-car train from a station to high speed (left) and to a lower speed (right).

Figure 11.
Estimate of steady-state notch 8 concentrations of PM (left) and NO (right) by extrapolation (described in [45]) of measured data.
Figure 11.
Estimate of steady-state notch 8 concentrations of PM (left) and NO (right) by extrapolation (described in [45]) of measured data.

Figure 12.
Track speed, fuel consumption, and particulate matter emissions from an 854 series railcar during (a) morning and (b) afternoon service on local and express trains on the Praha–Turnov line.
Figure 12.
Track speed, fuel consumption, and particulate matter emissions from an 854 series railcar during (a) morning and (b) afternoon service on local and express trains on the Praha–Turnov line.

Figure 13.
Track speed, fuel consumption, and particulate matter emissions from an 854 series railcar, showing: (a) cold start and switching at the depot; and (b) local service.
Figure 13.
Track speed, fuel consumption, and particulate matter emissions from an 854 series railcar, showing: (a) cold start and switching at the depot; and (b) local service.

Figure 14.
Emission rates from an 854 series railcar: (a) particulate matter; and (b) nitrogen oxides.
Figure 14.
Emission rates from an 854 series railcar: (a) particulate matter; and (b) nitrogen oxides.


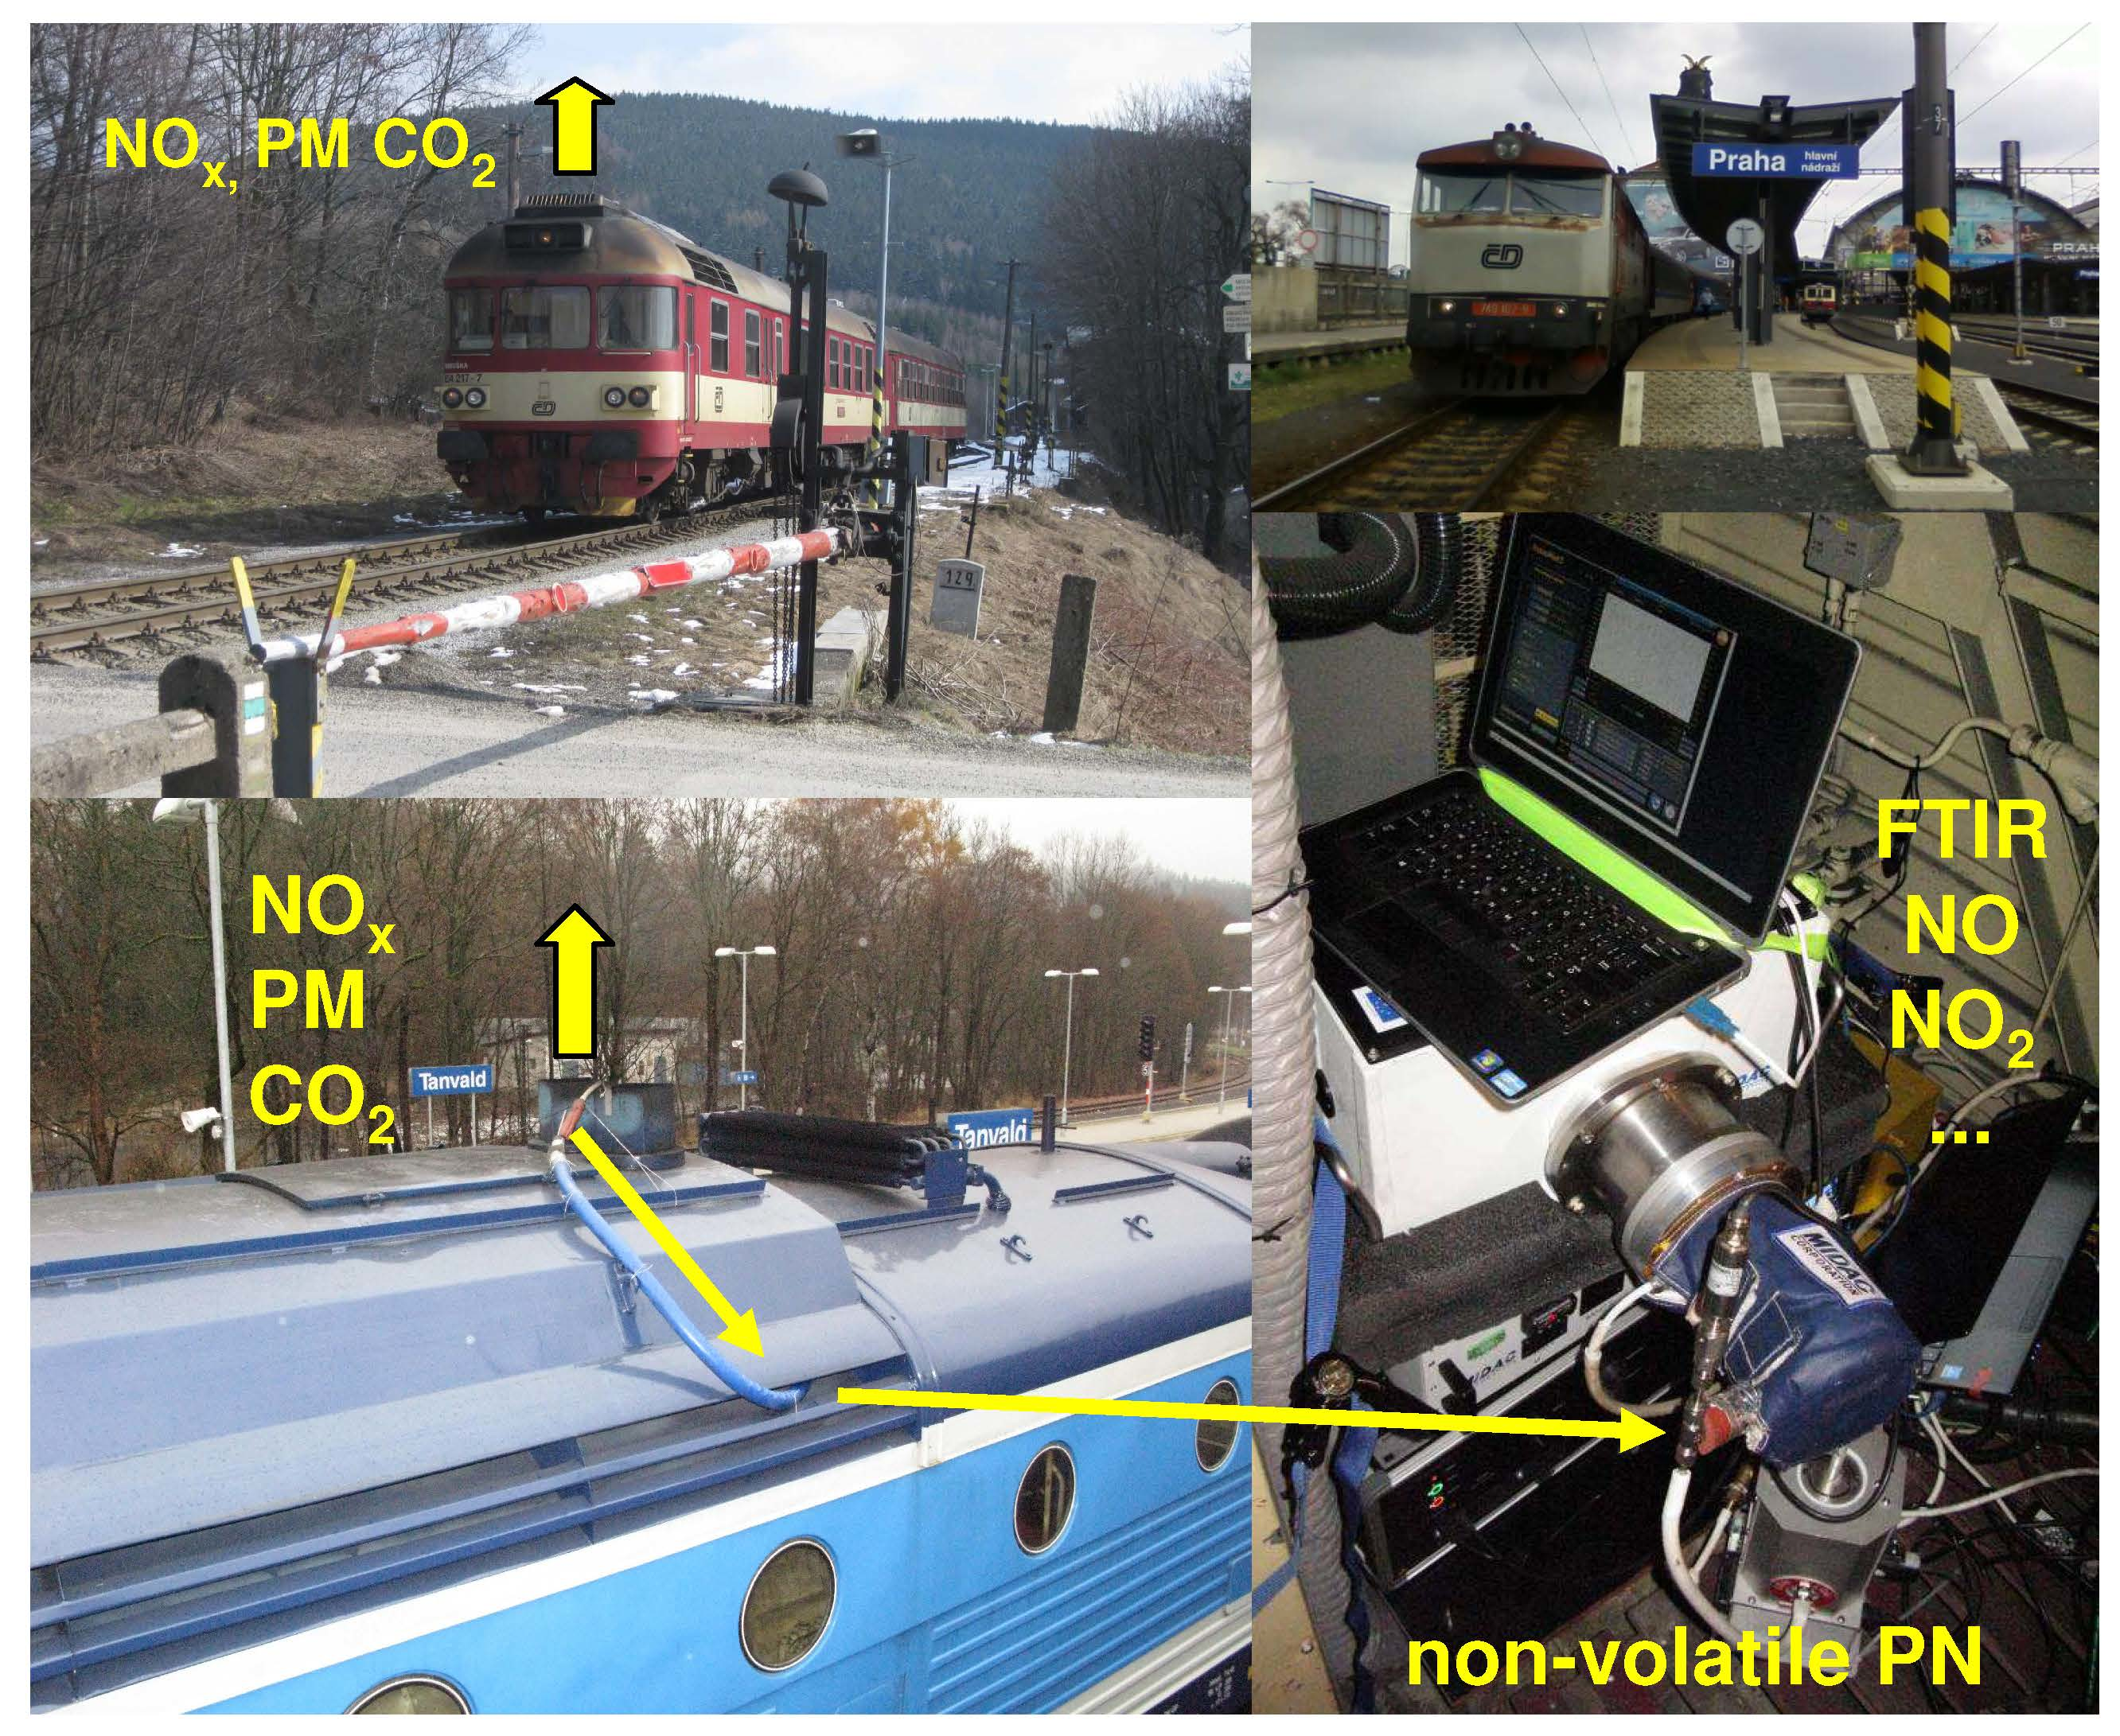
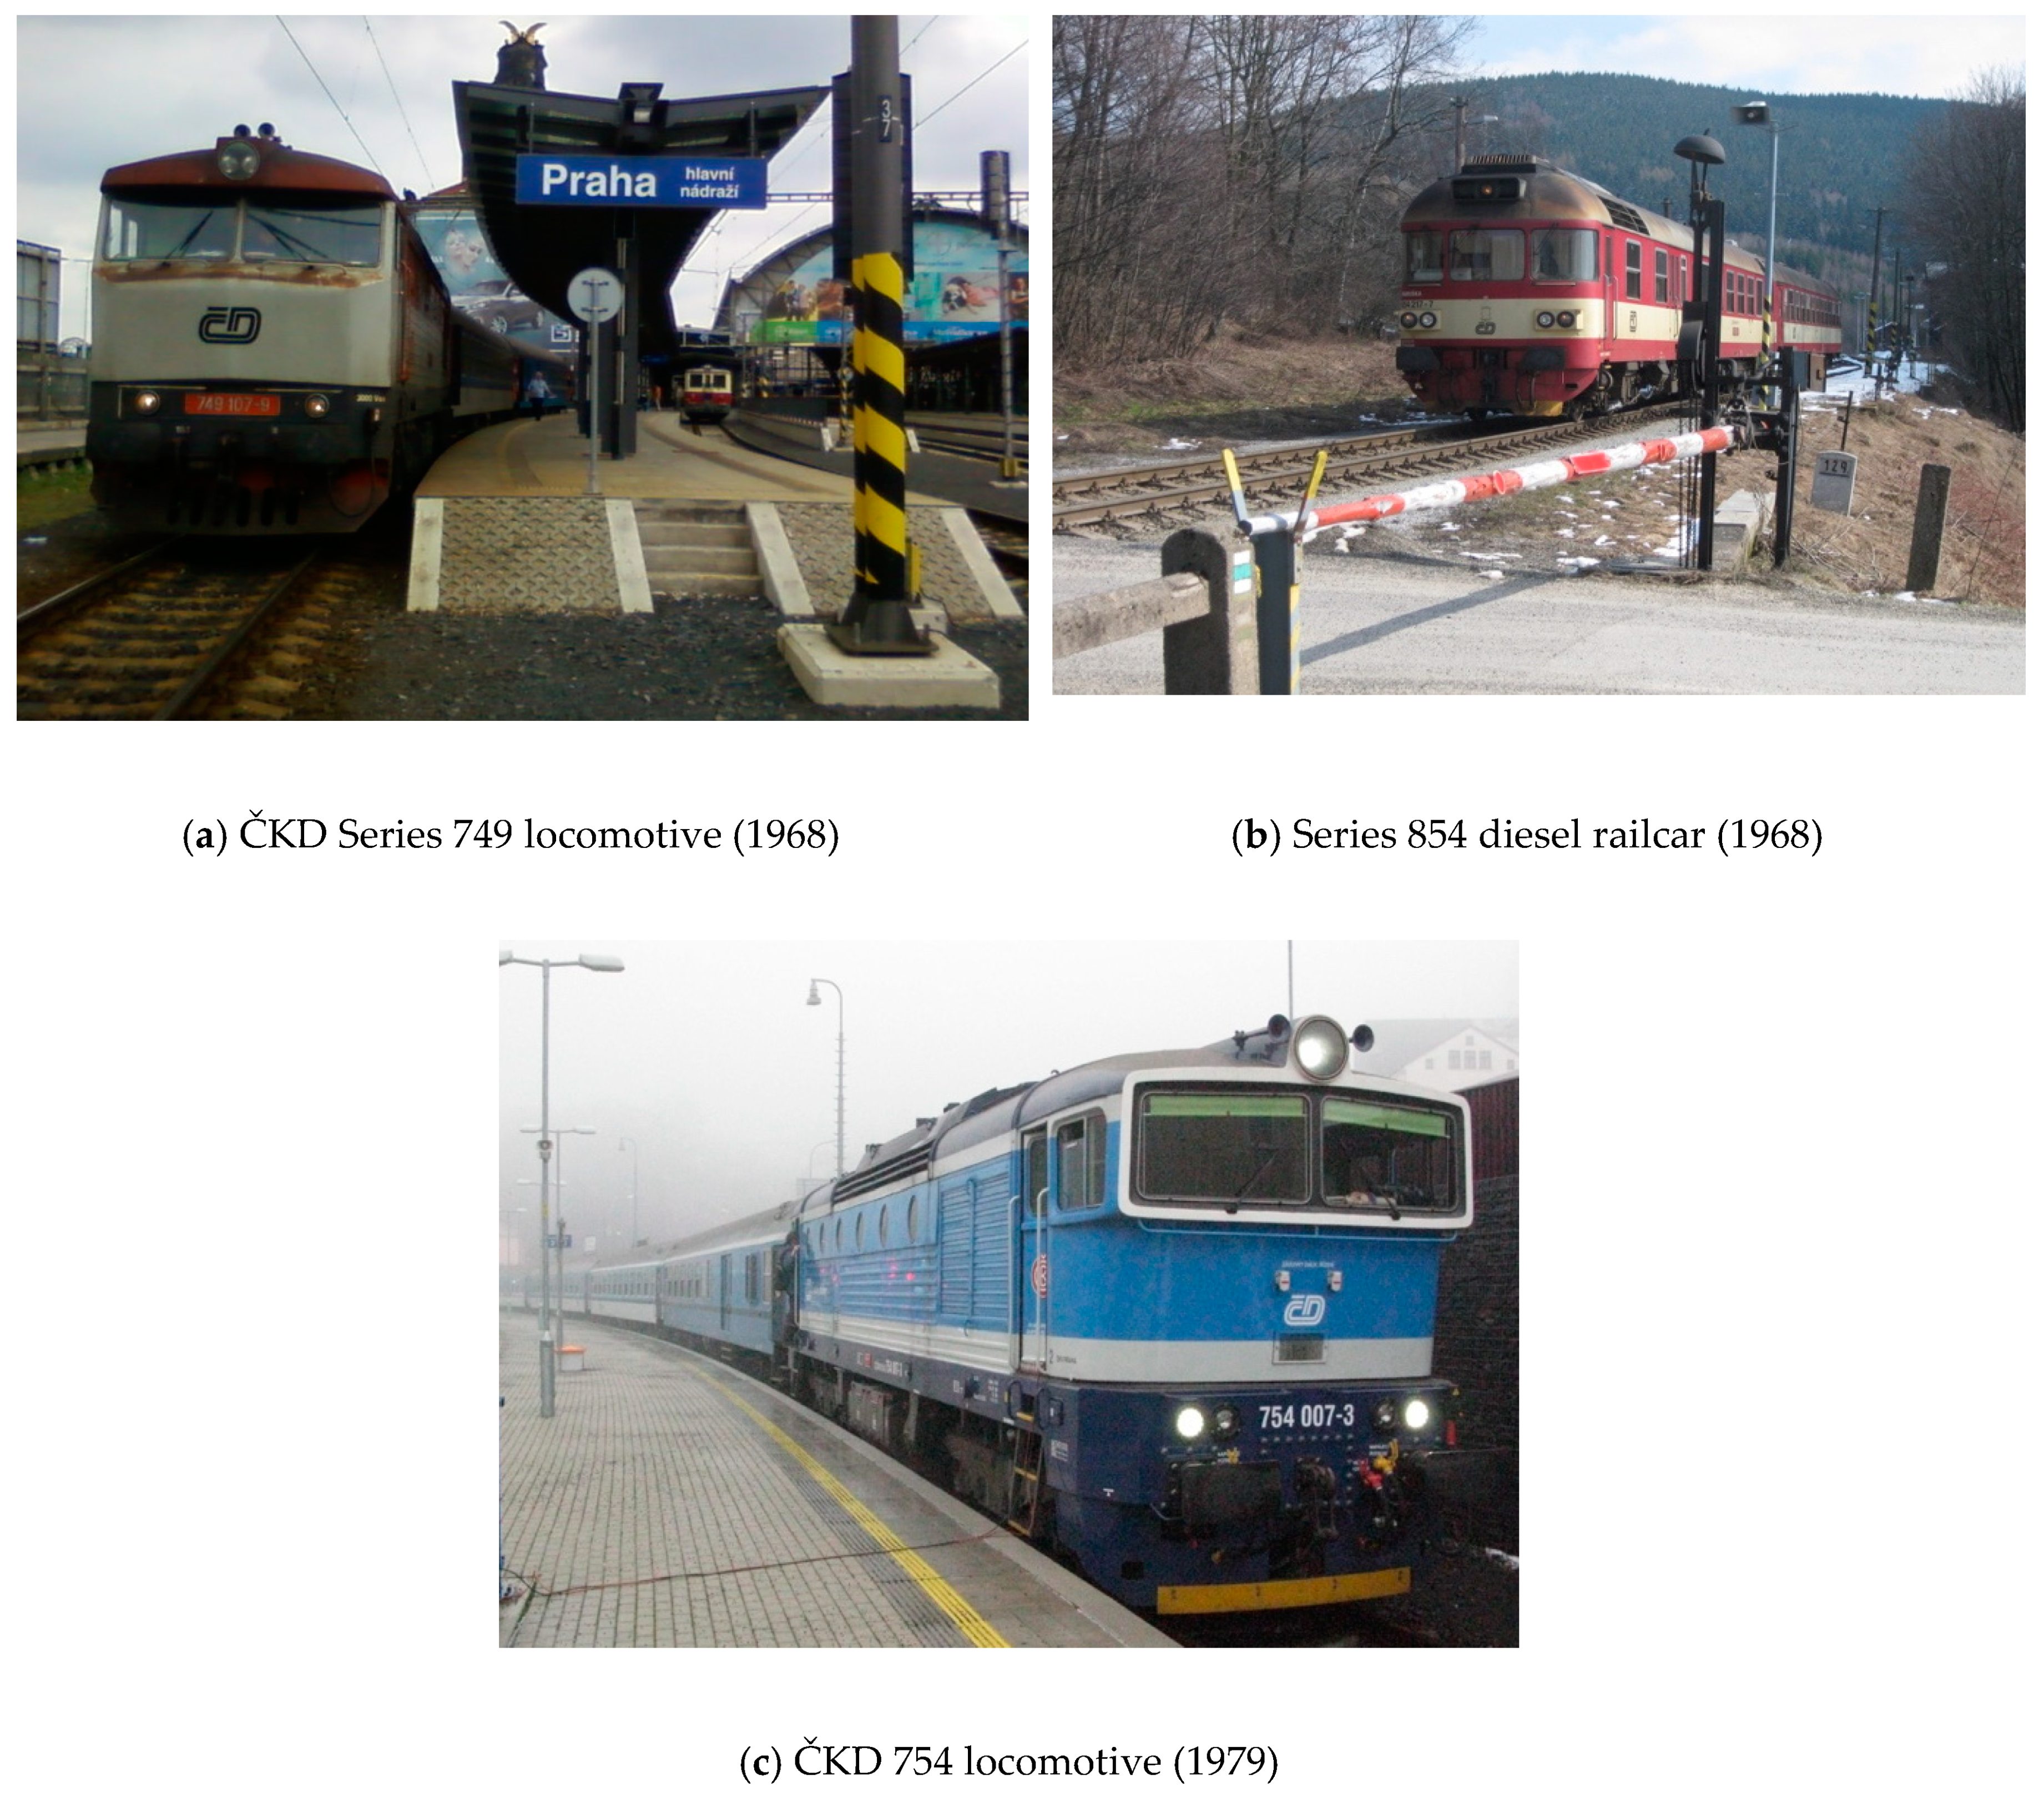
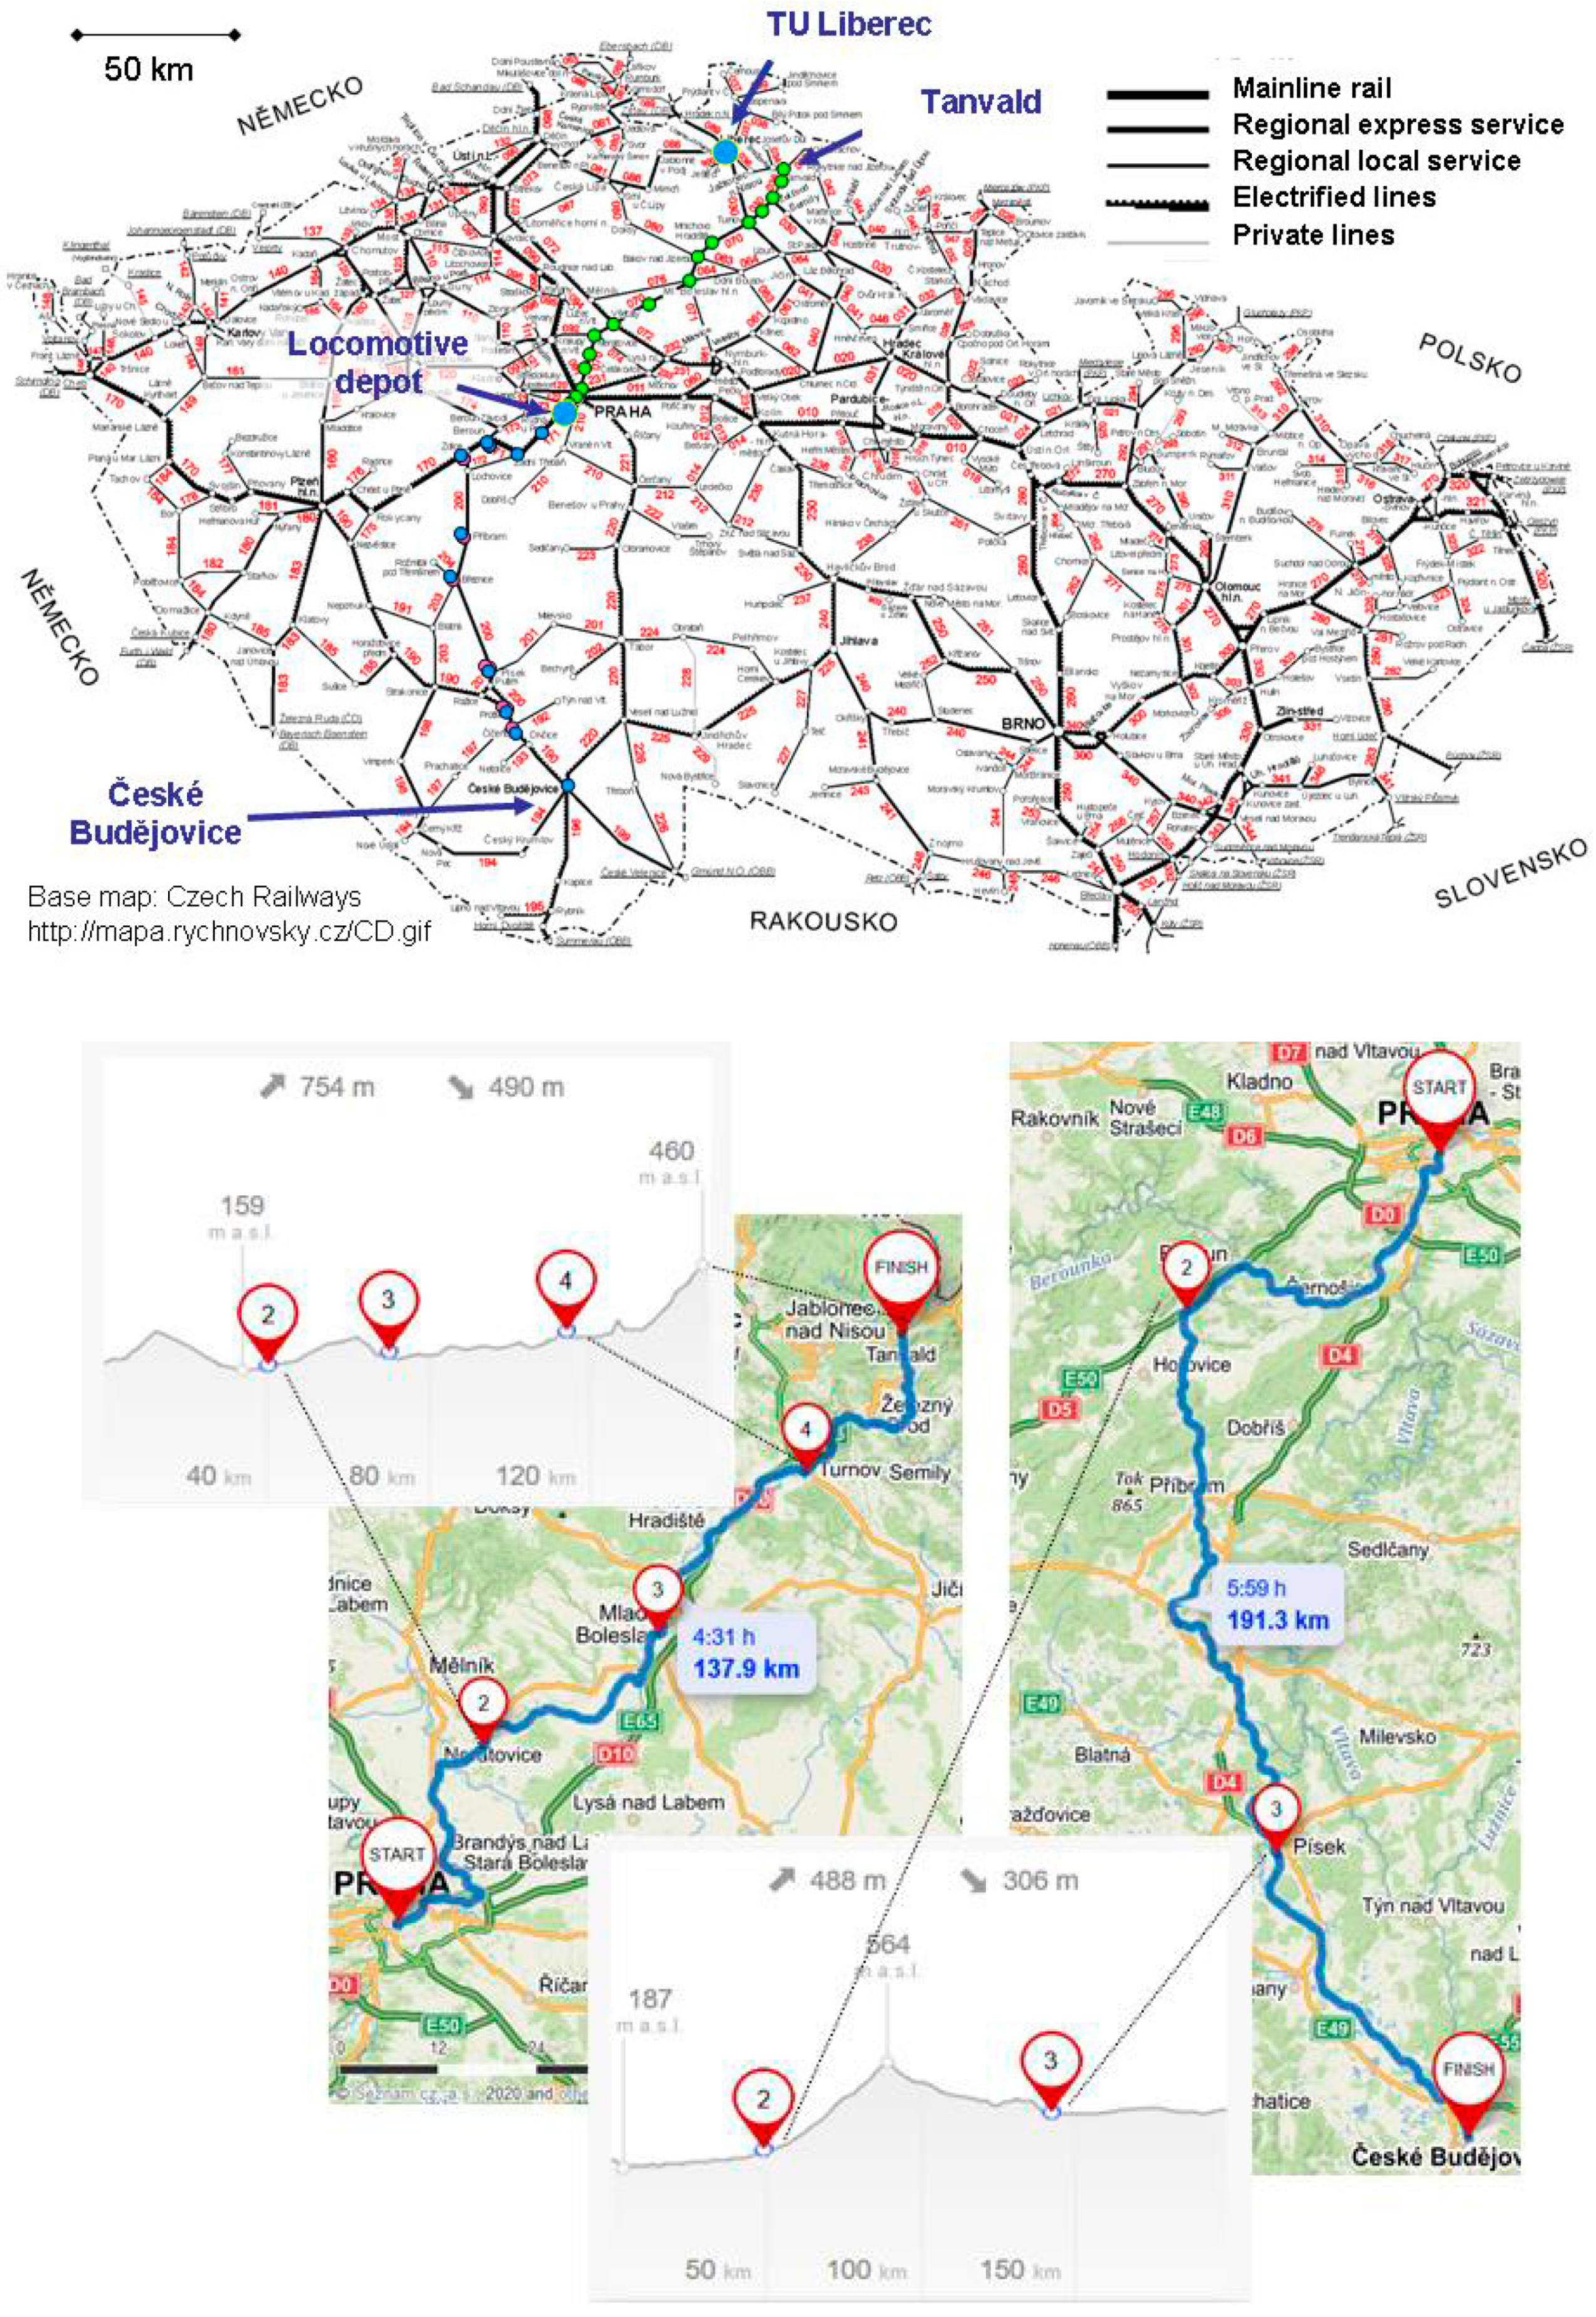
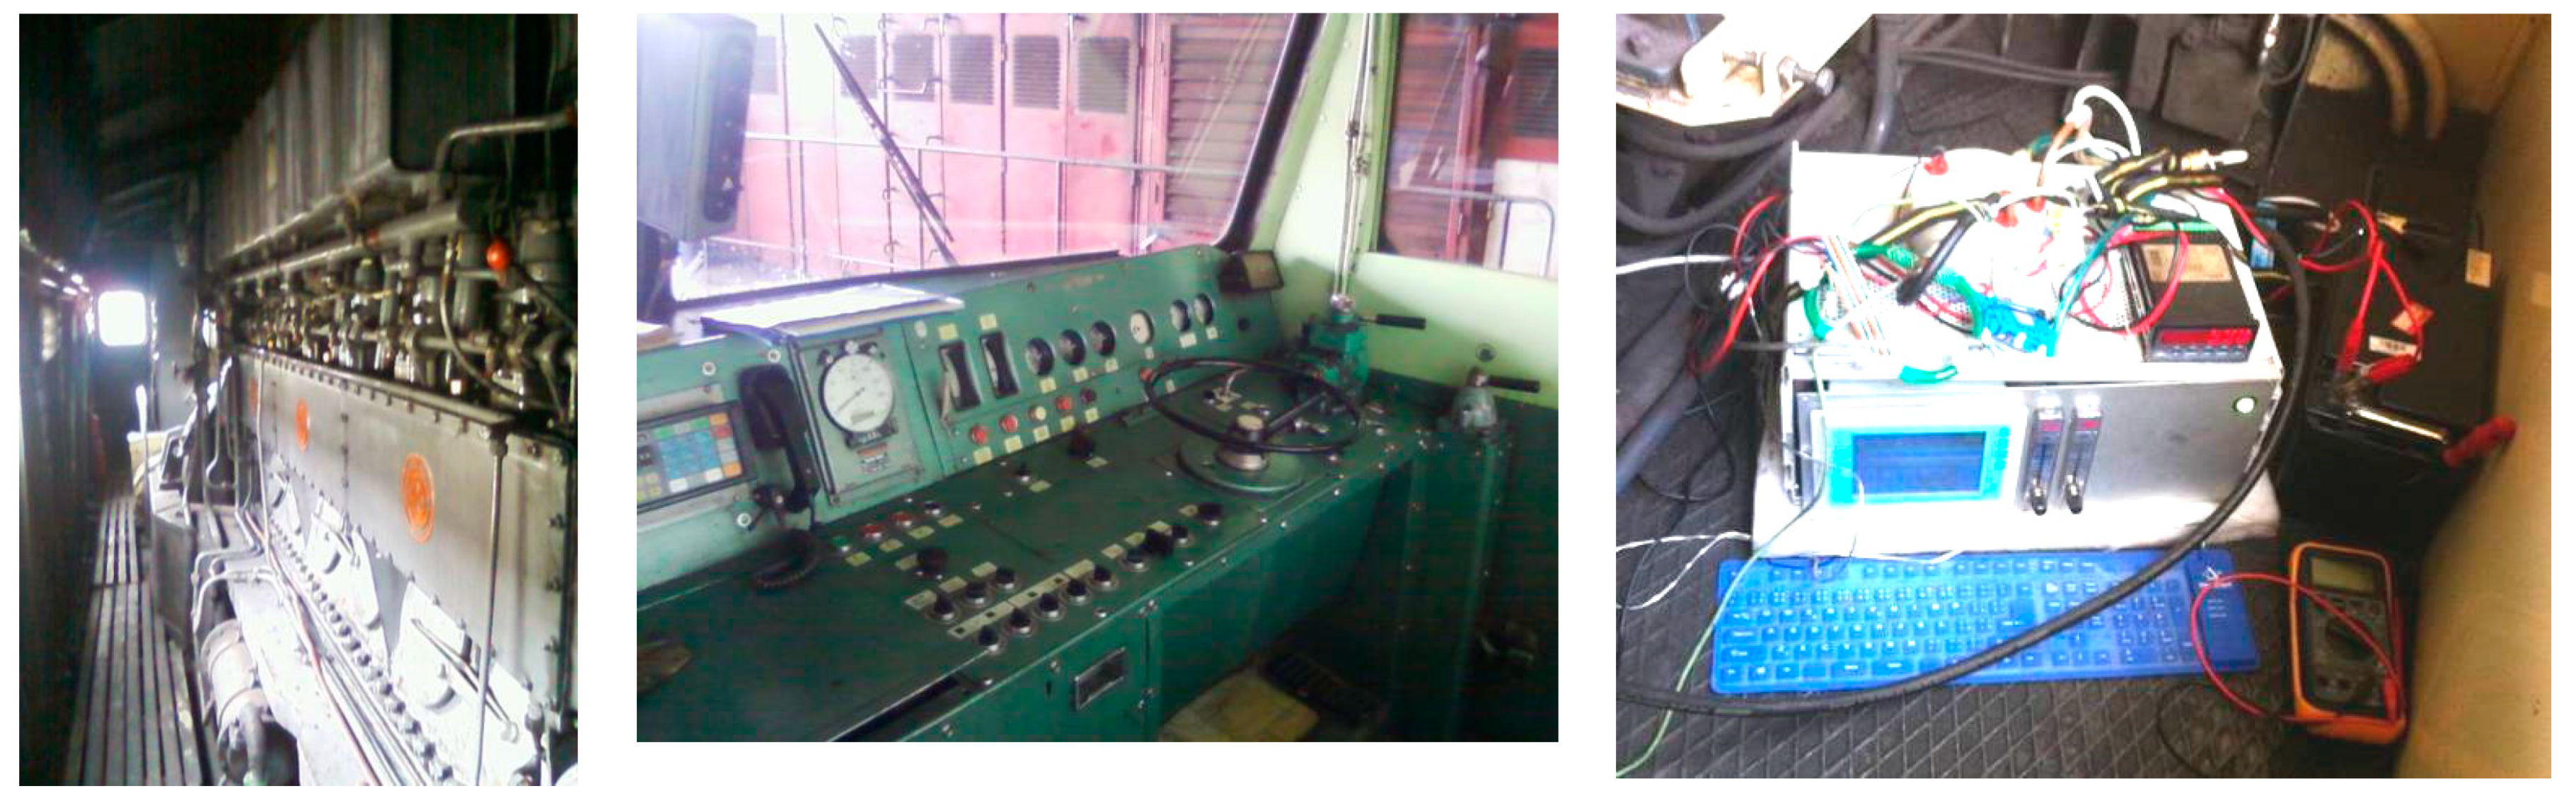
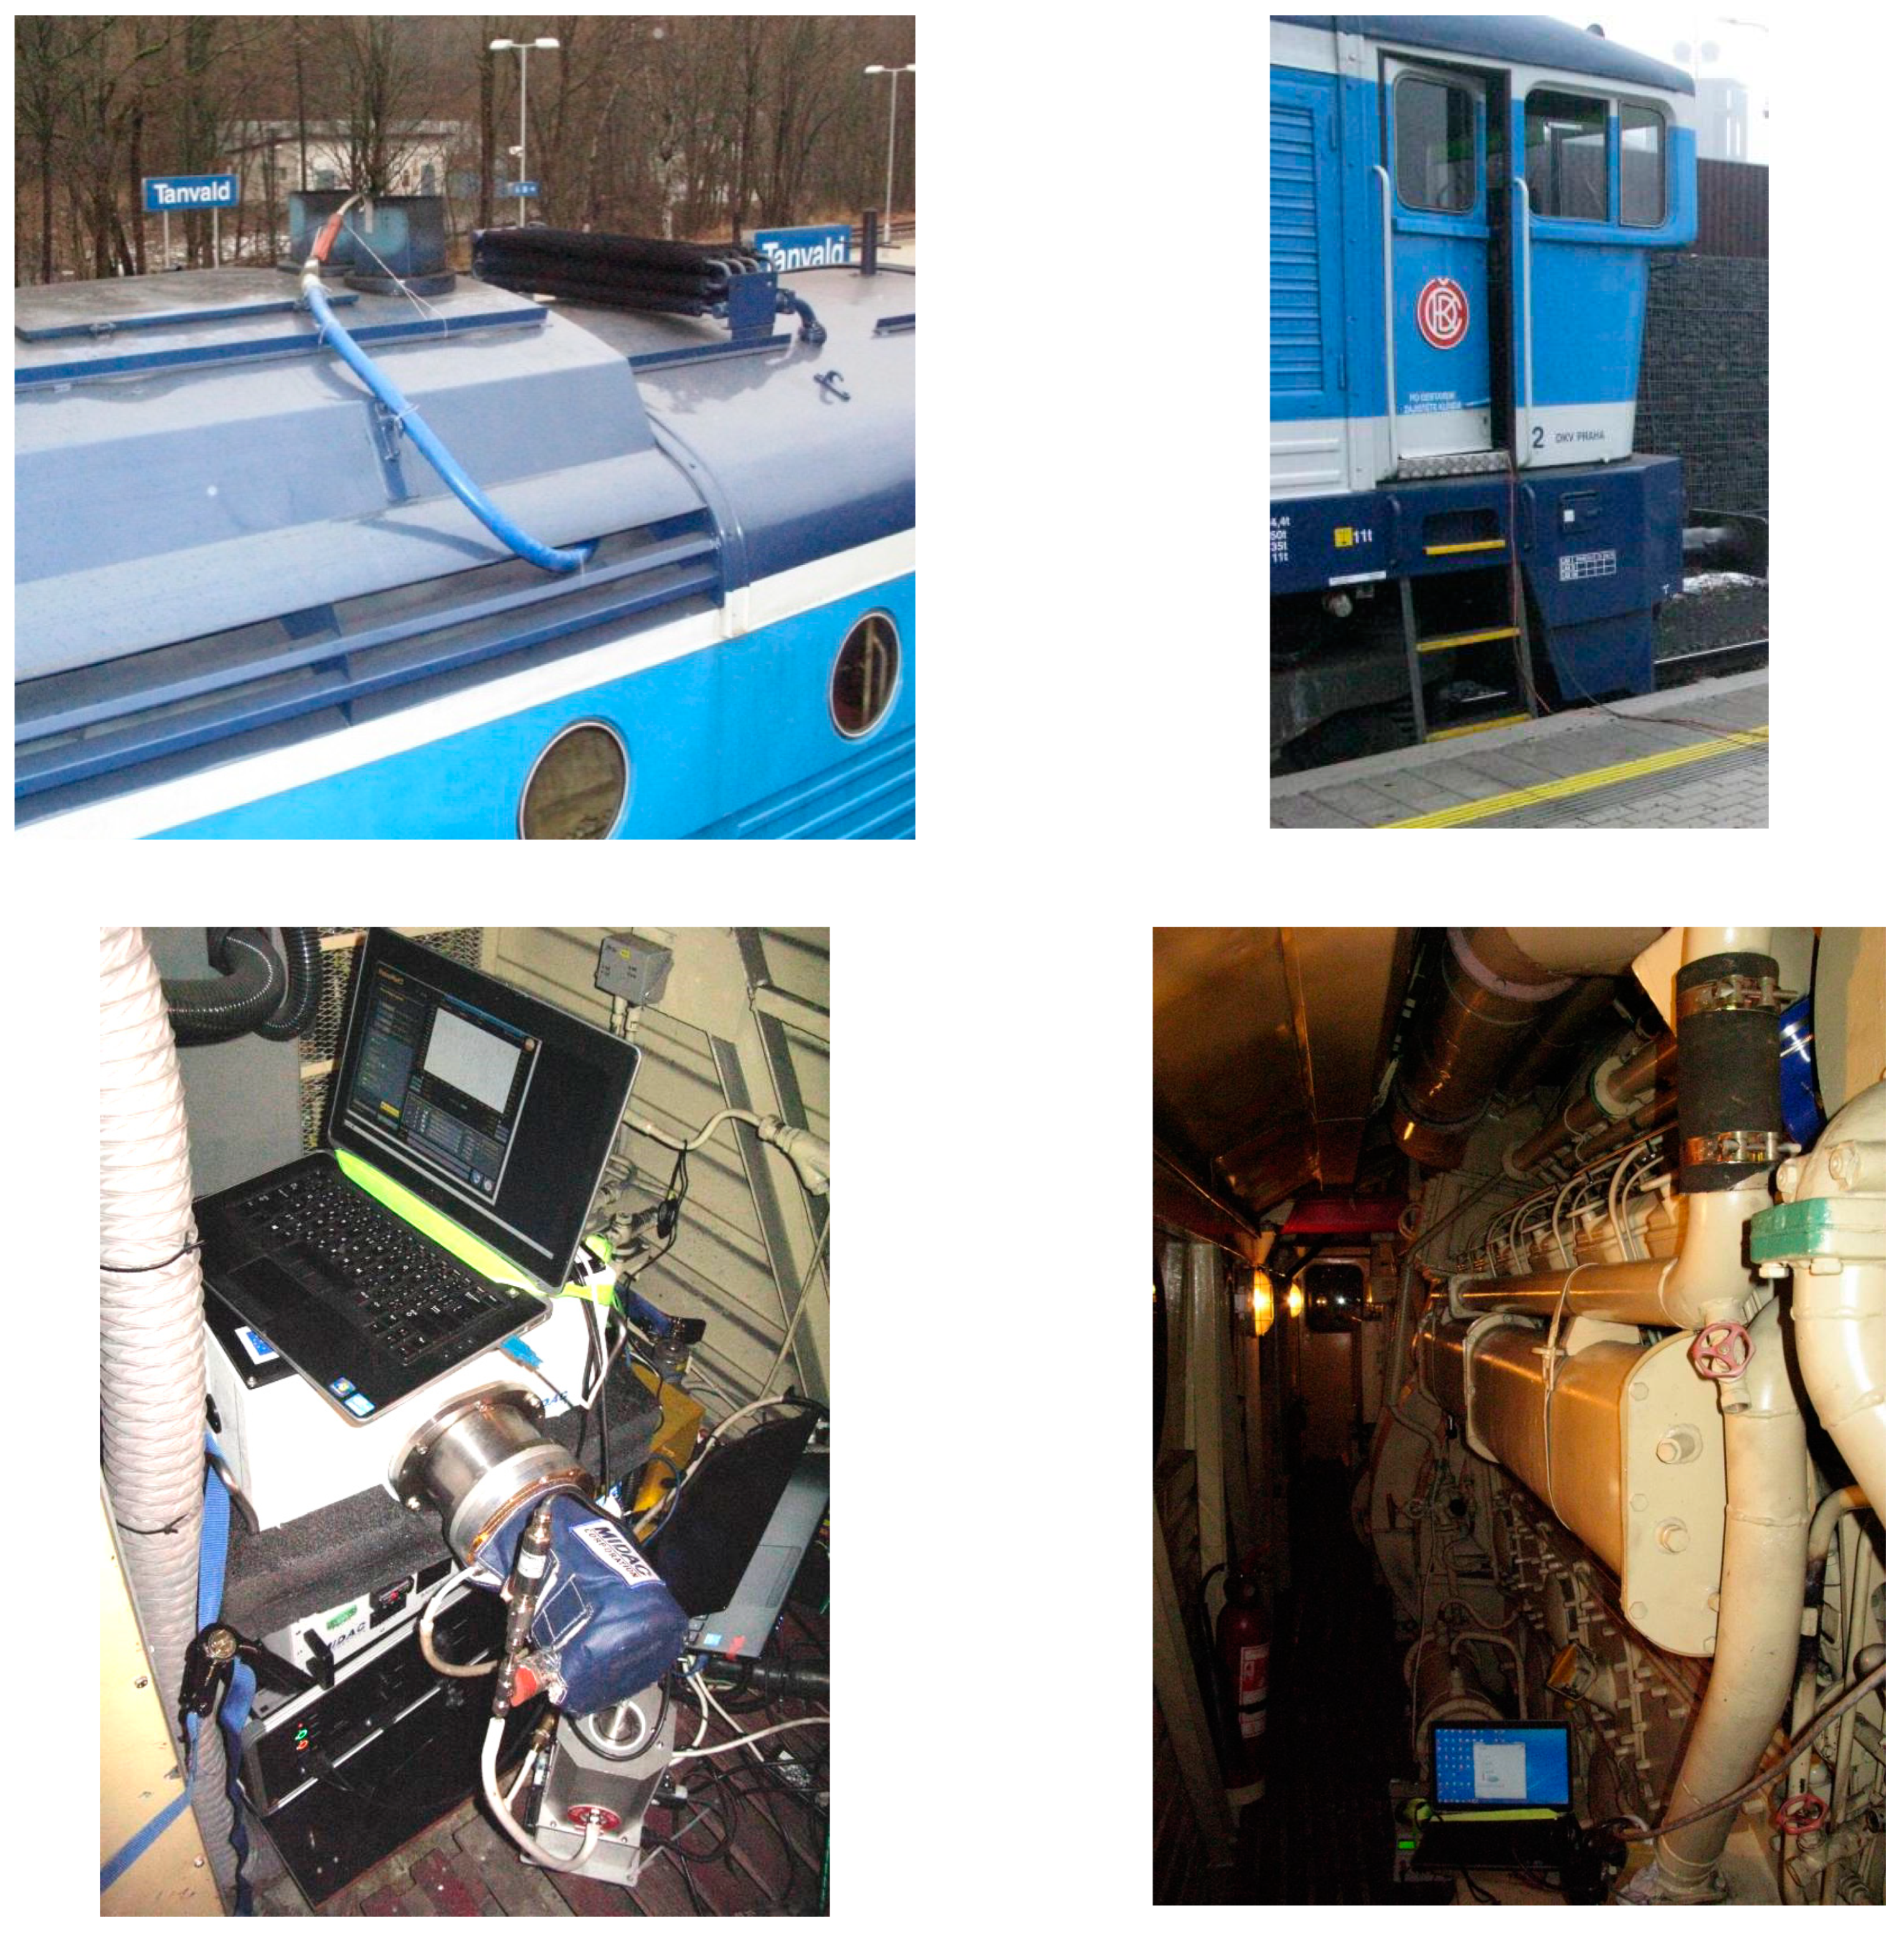
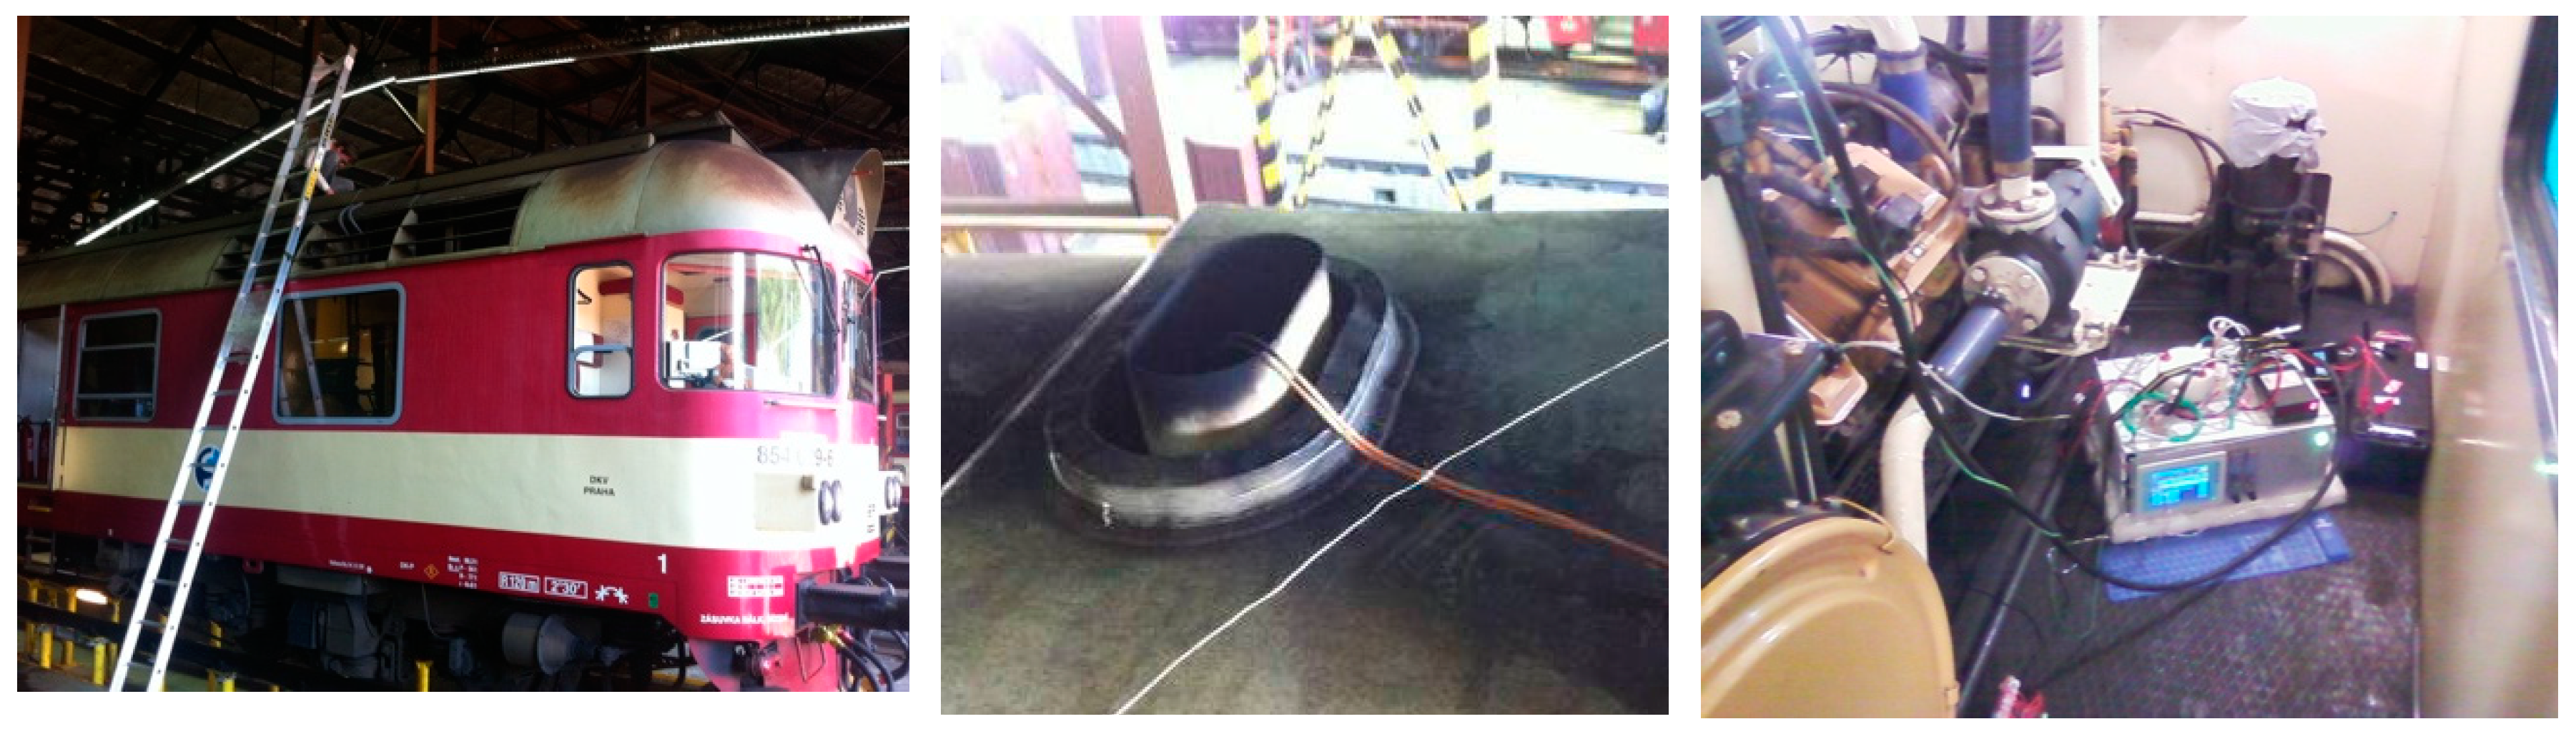
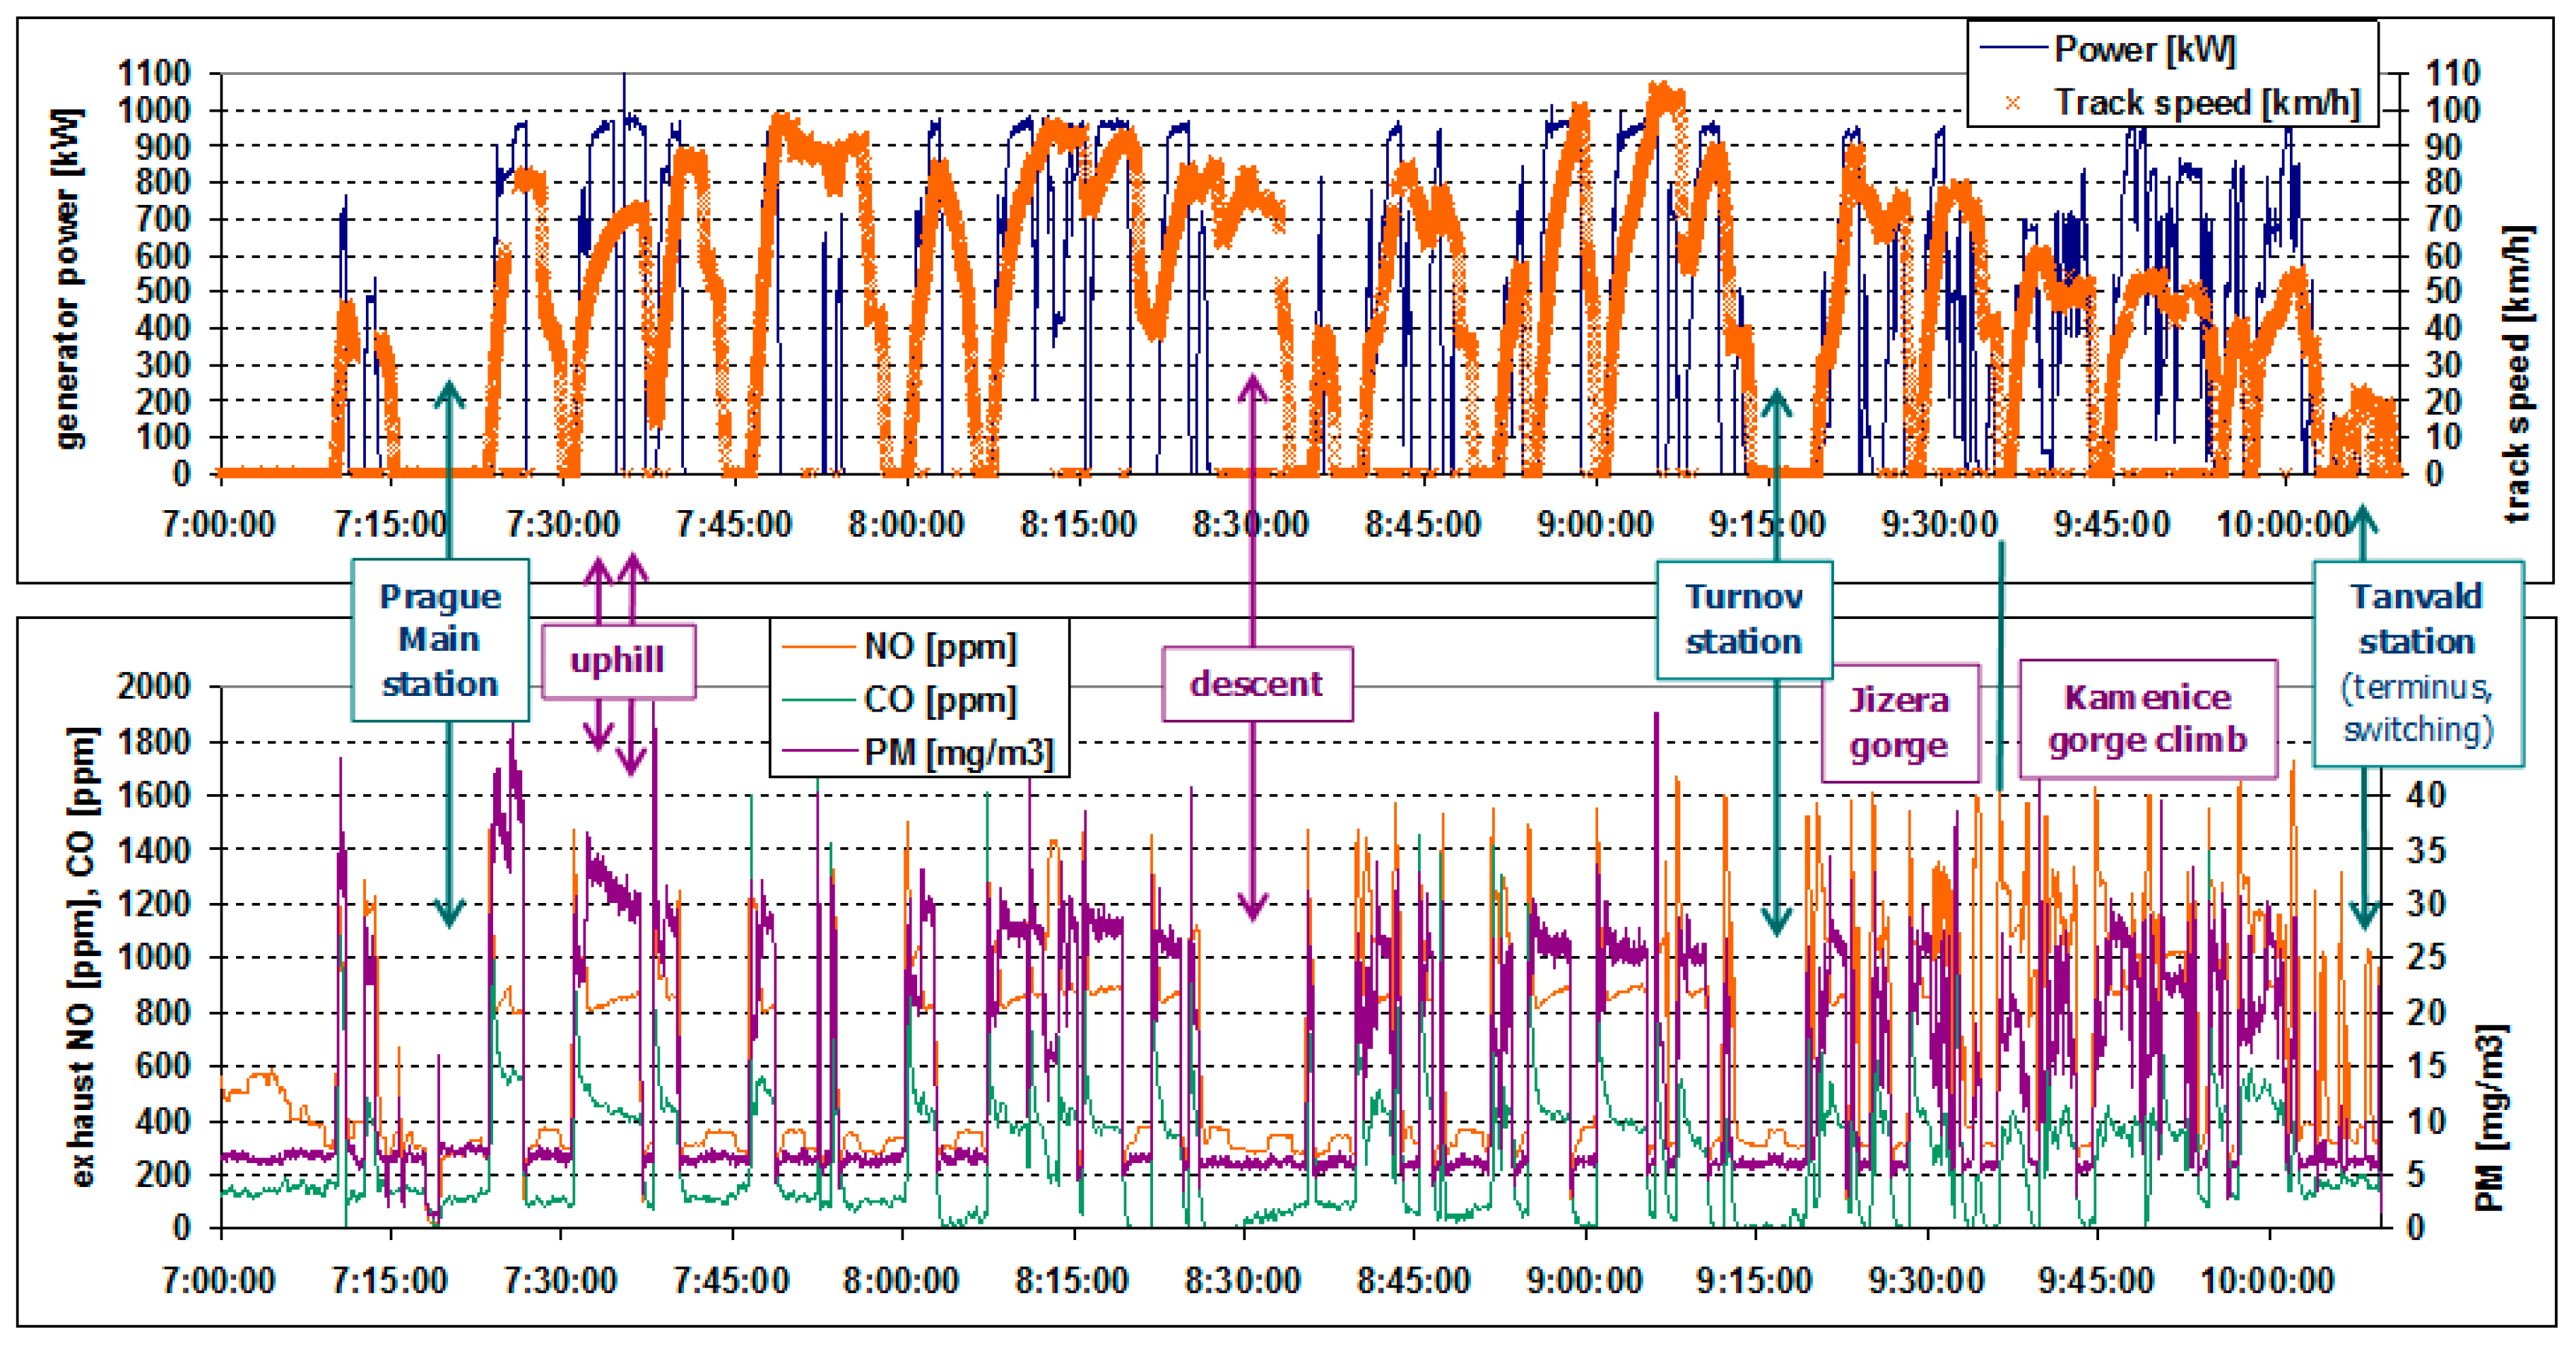
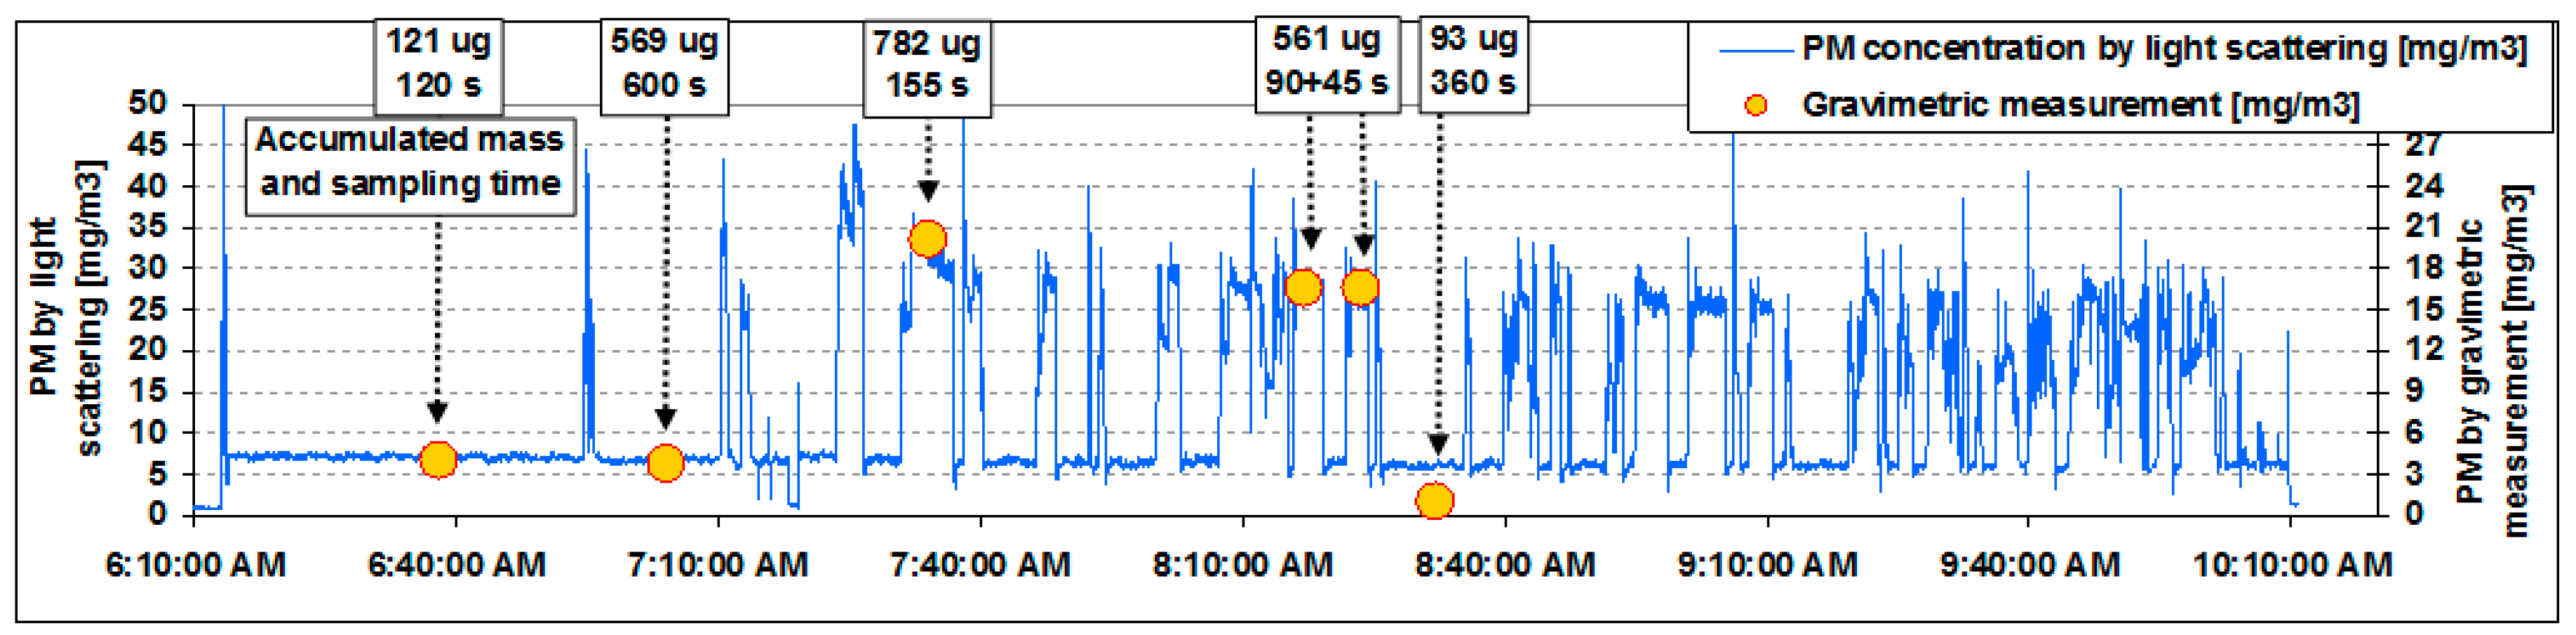
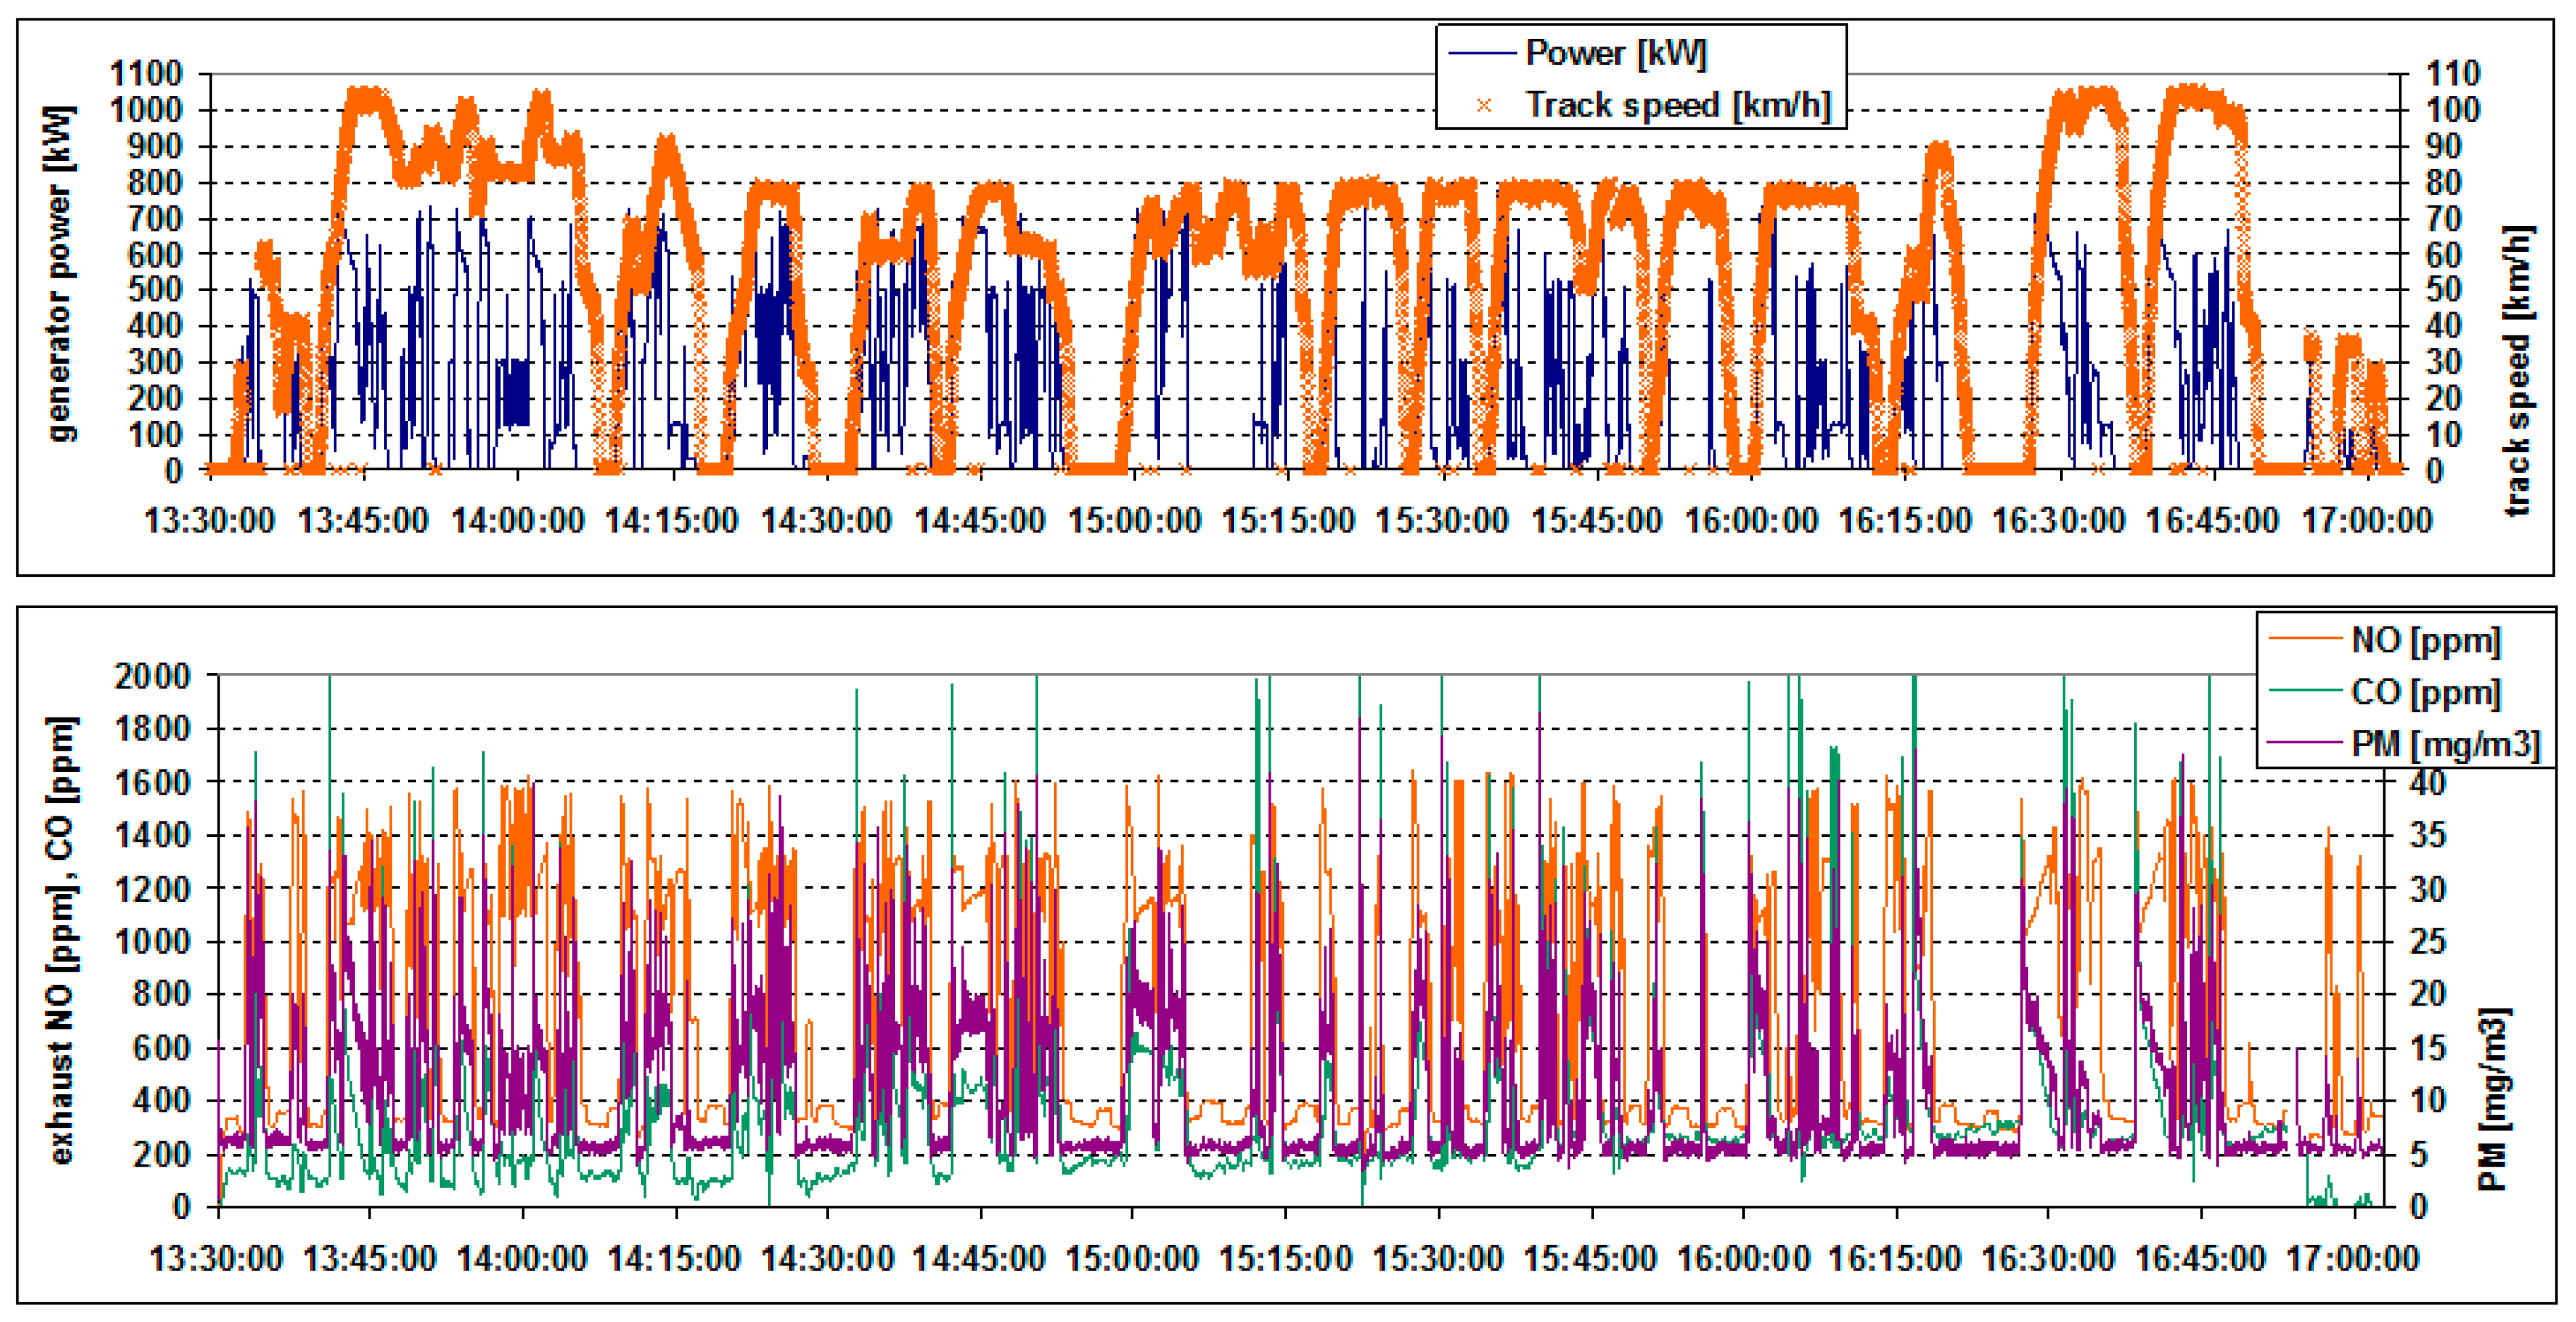
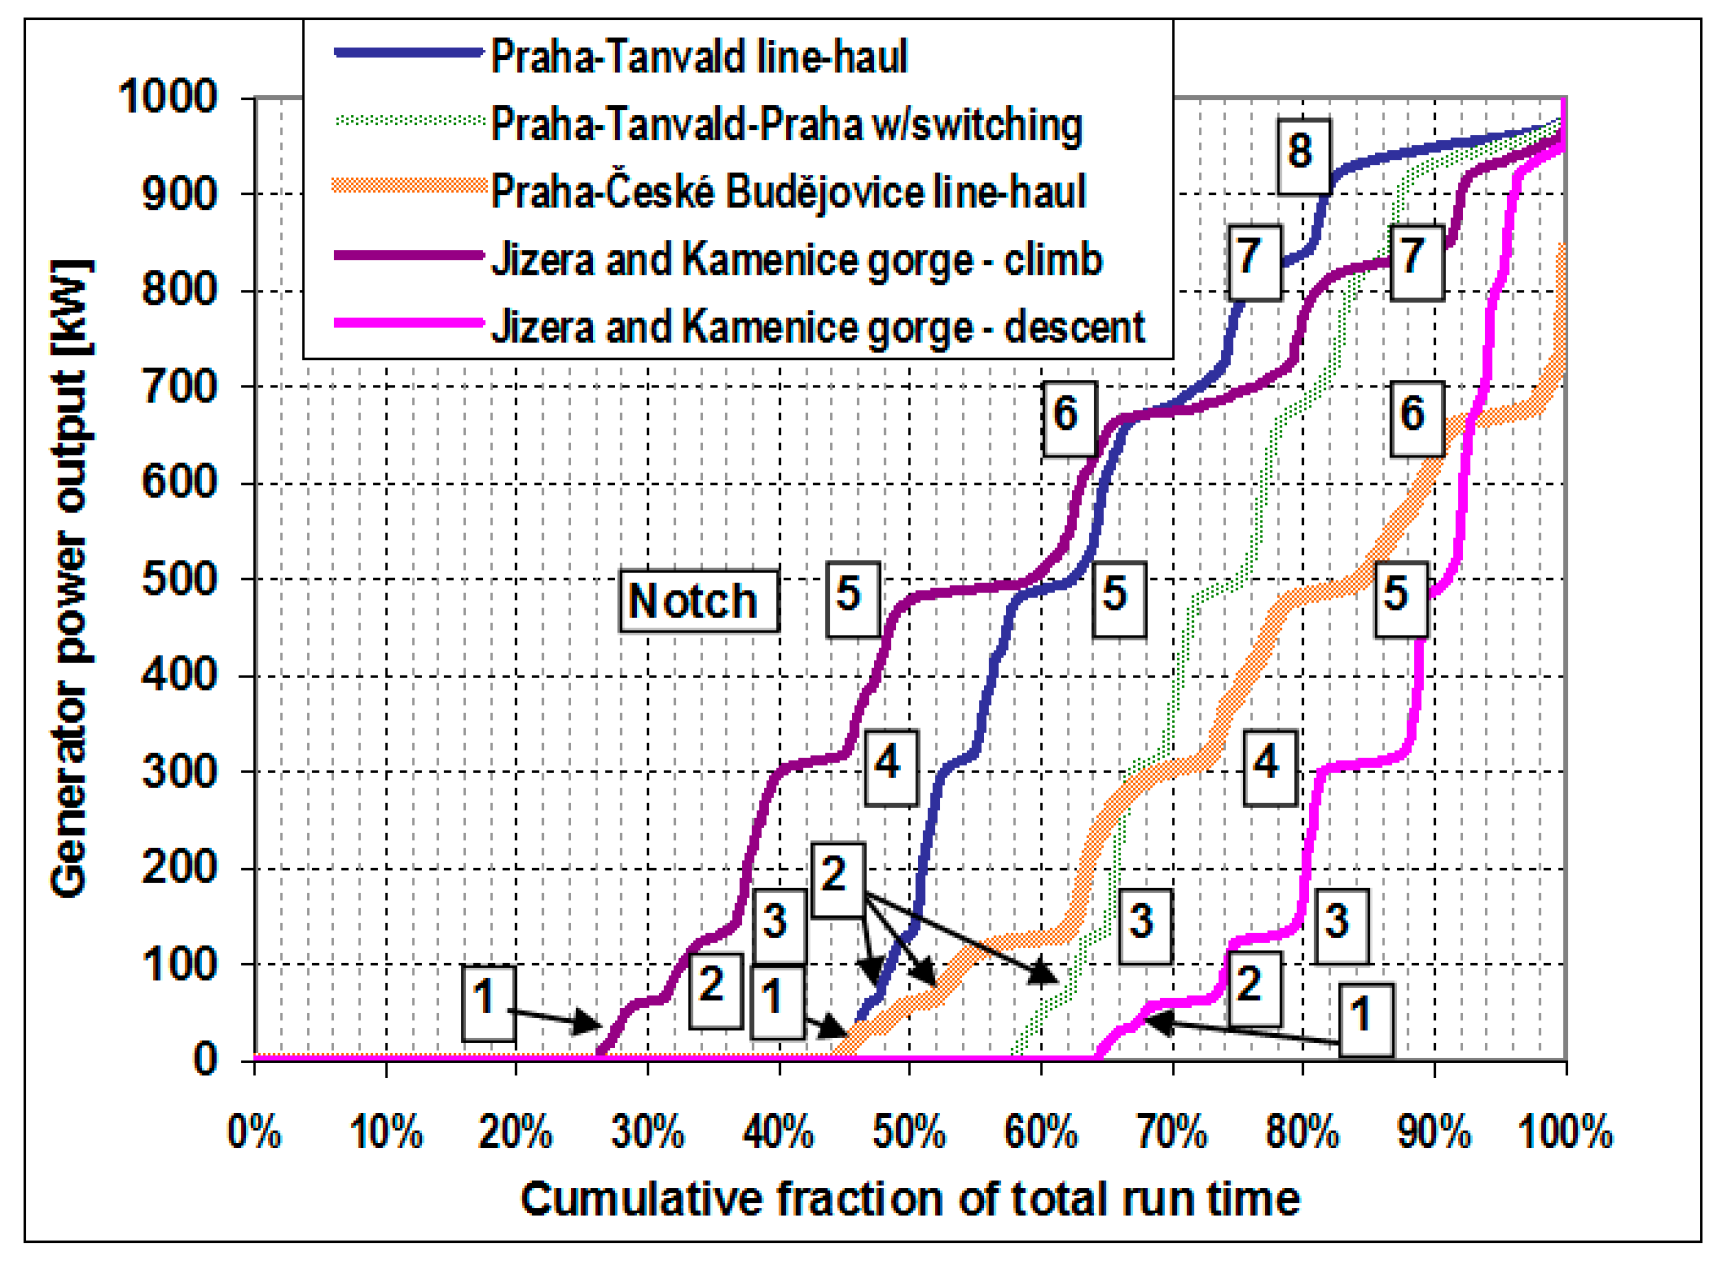
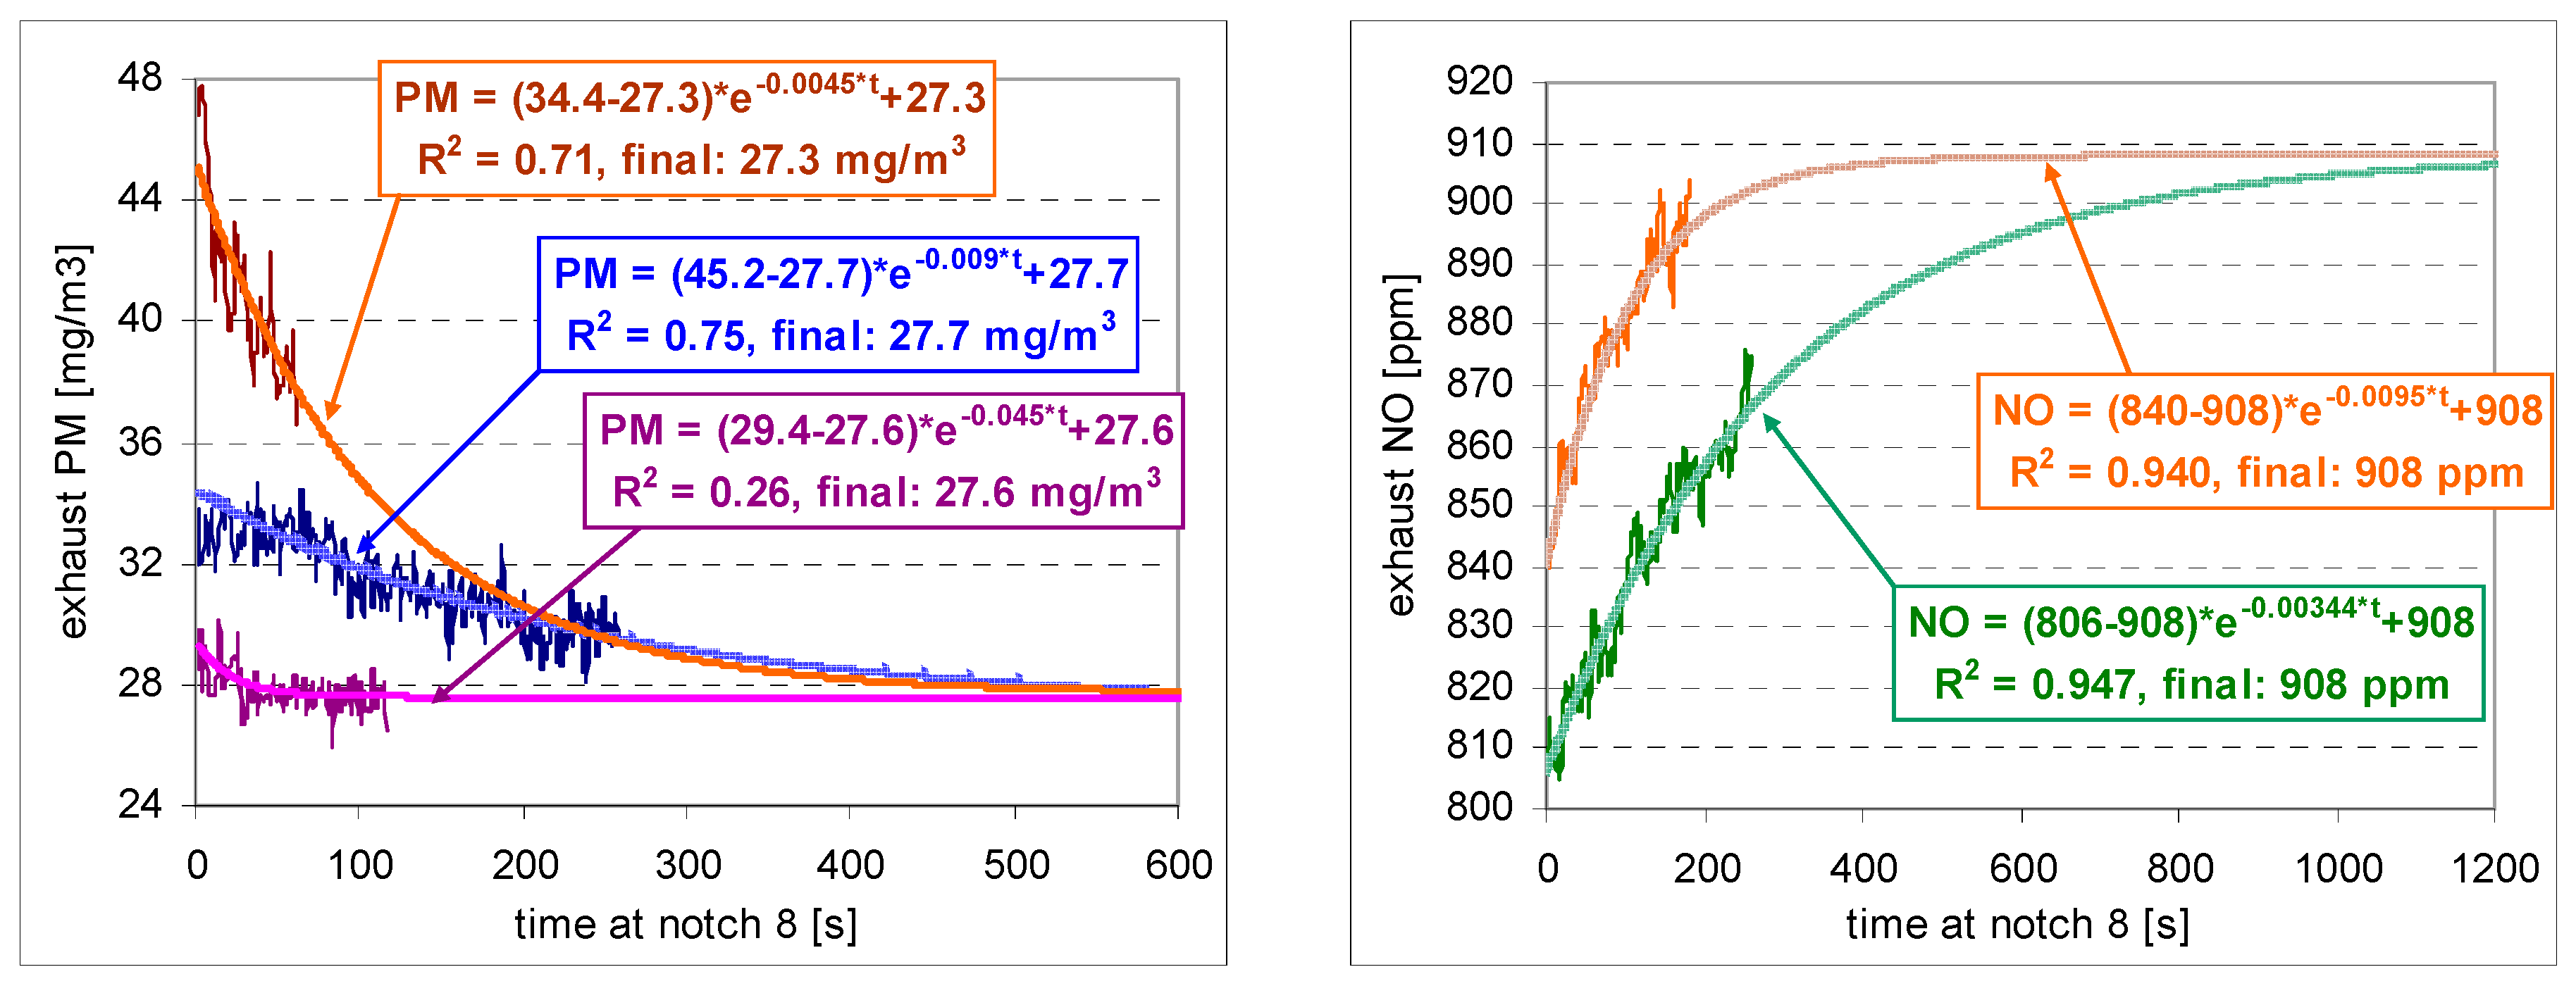
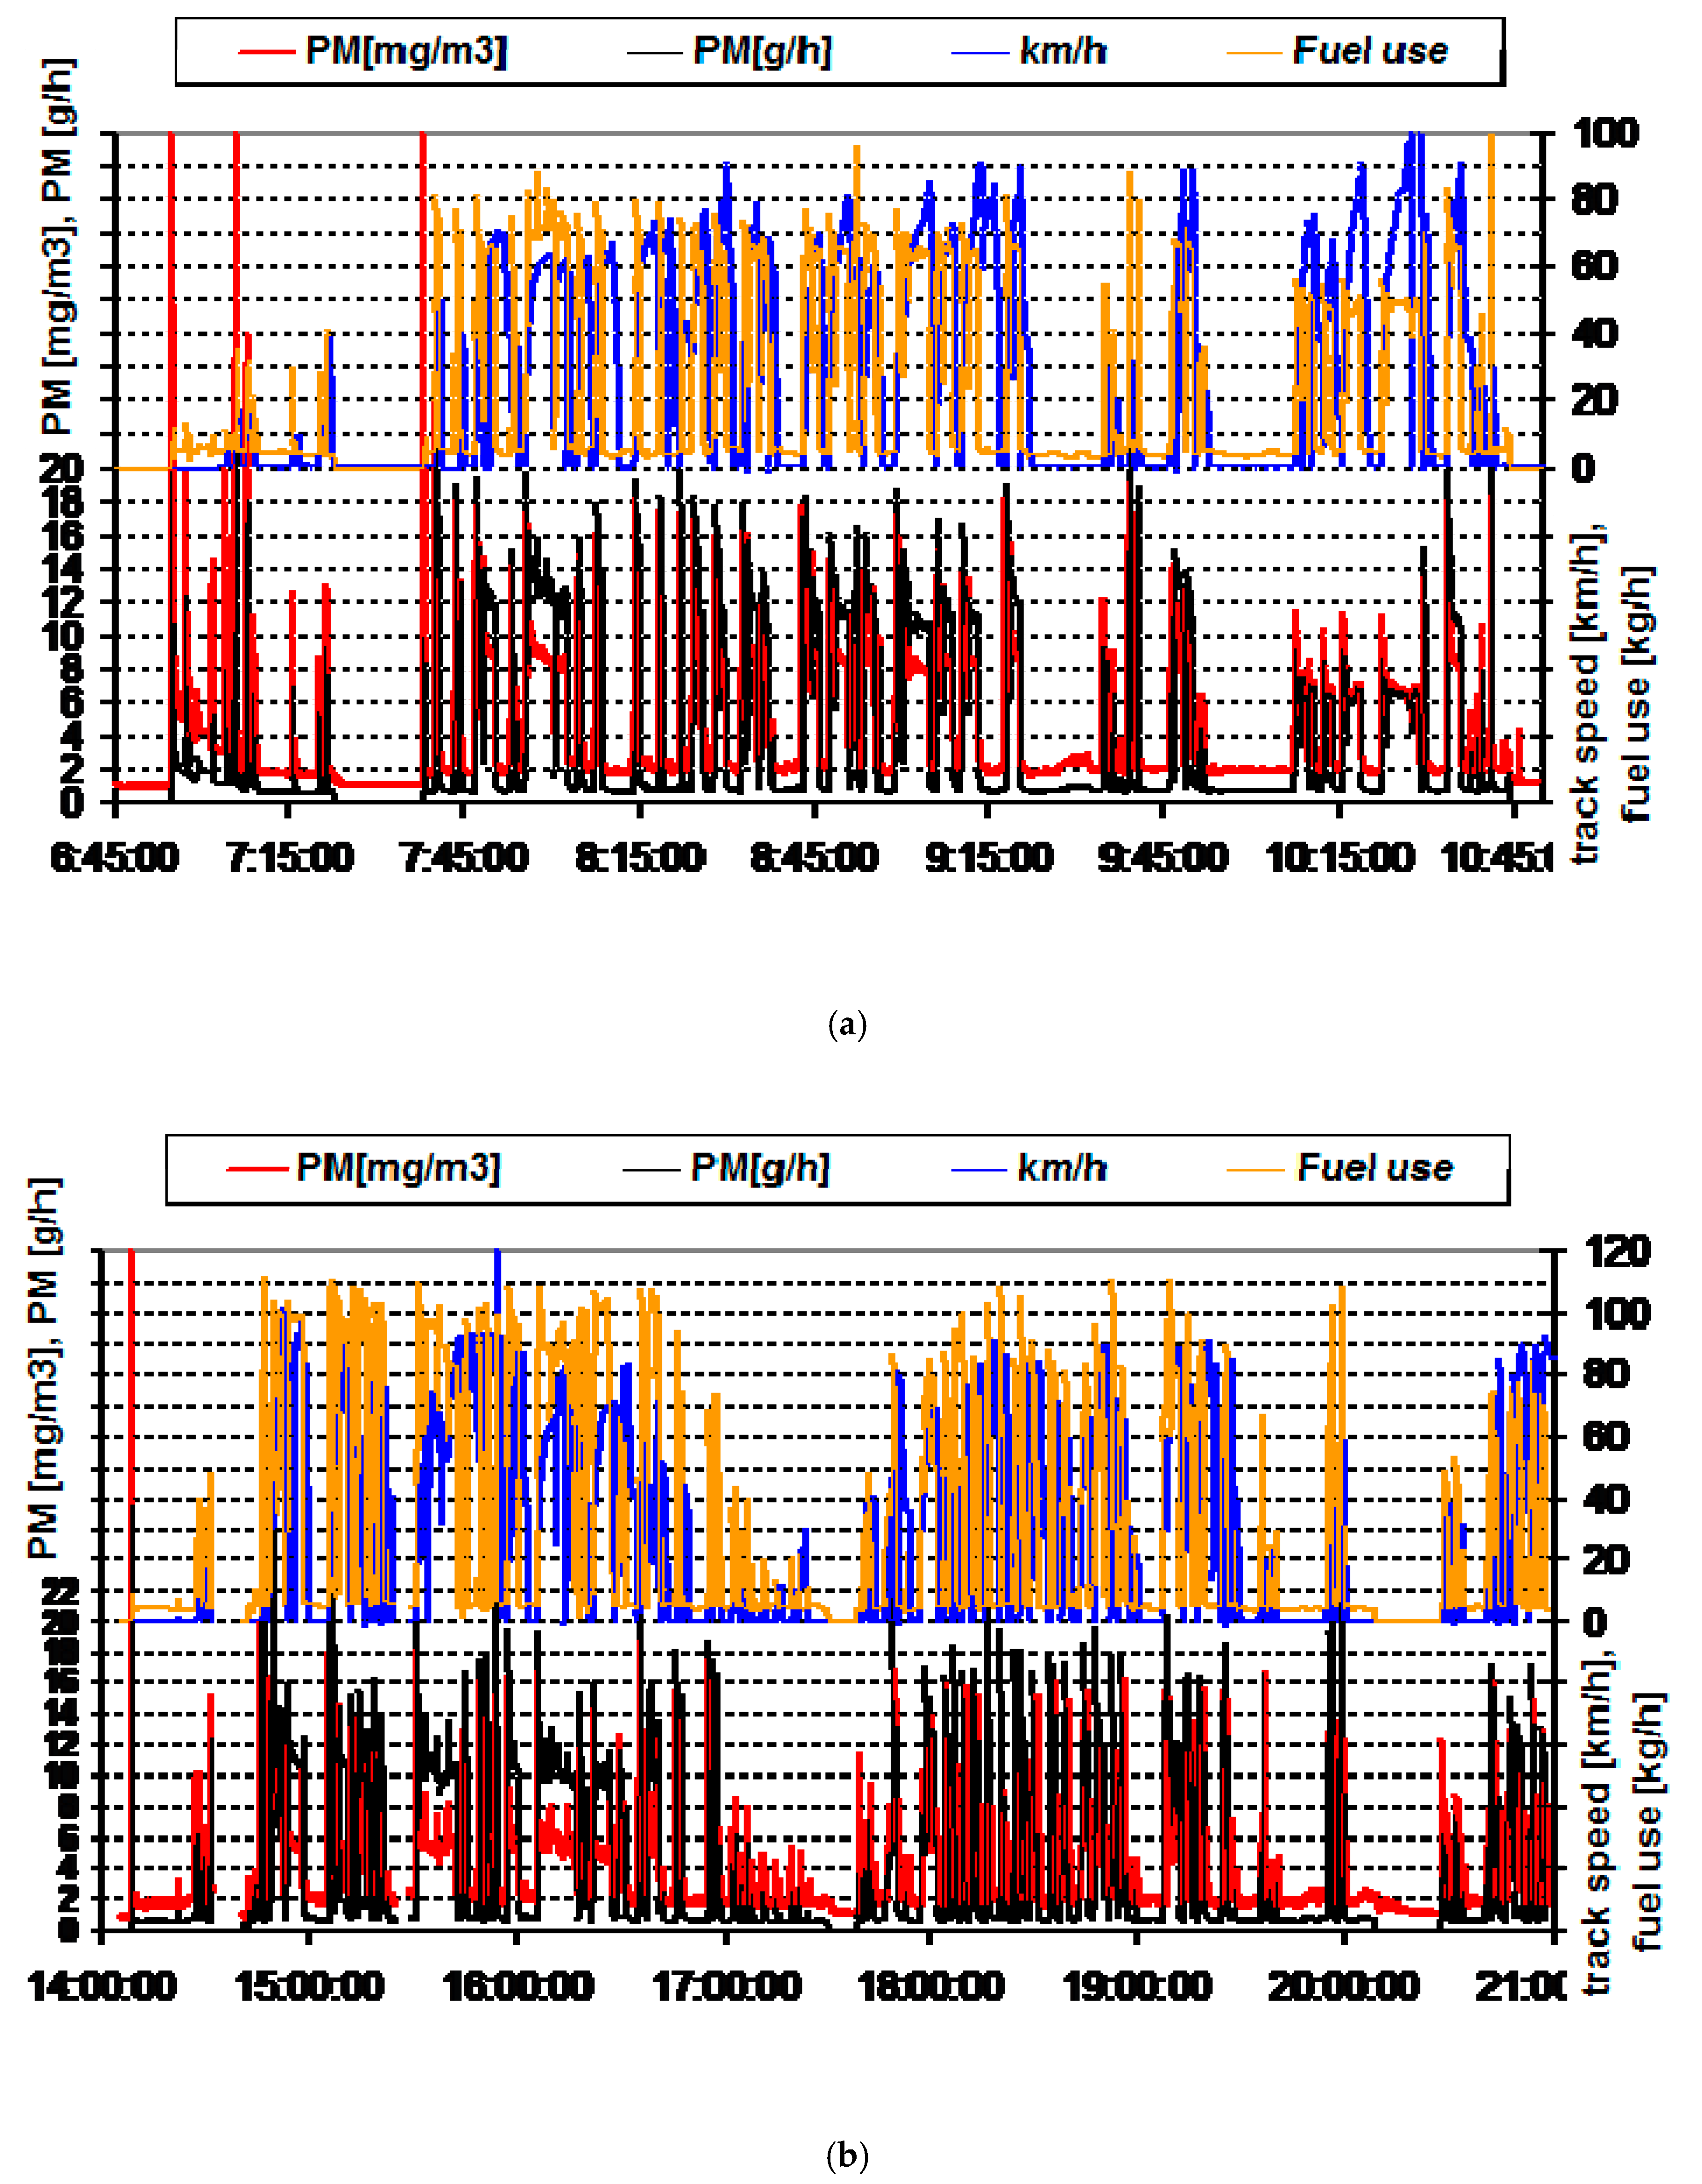
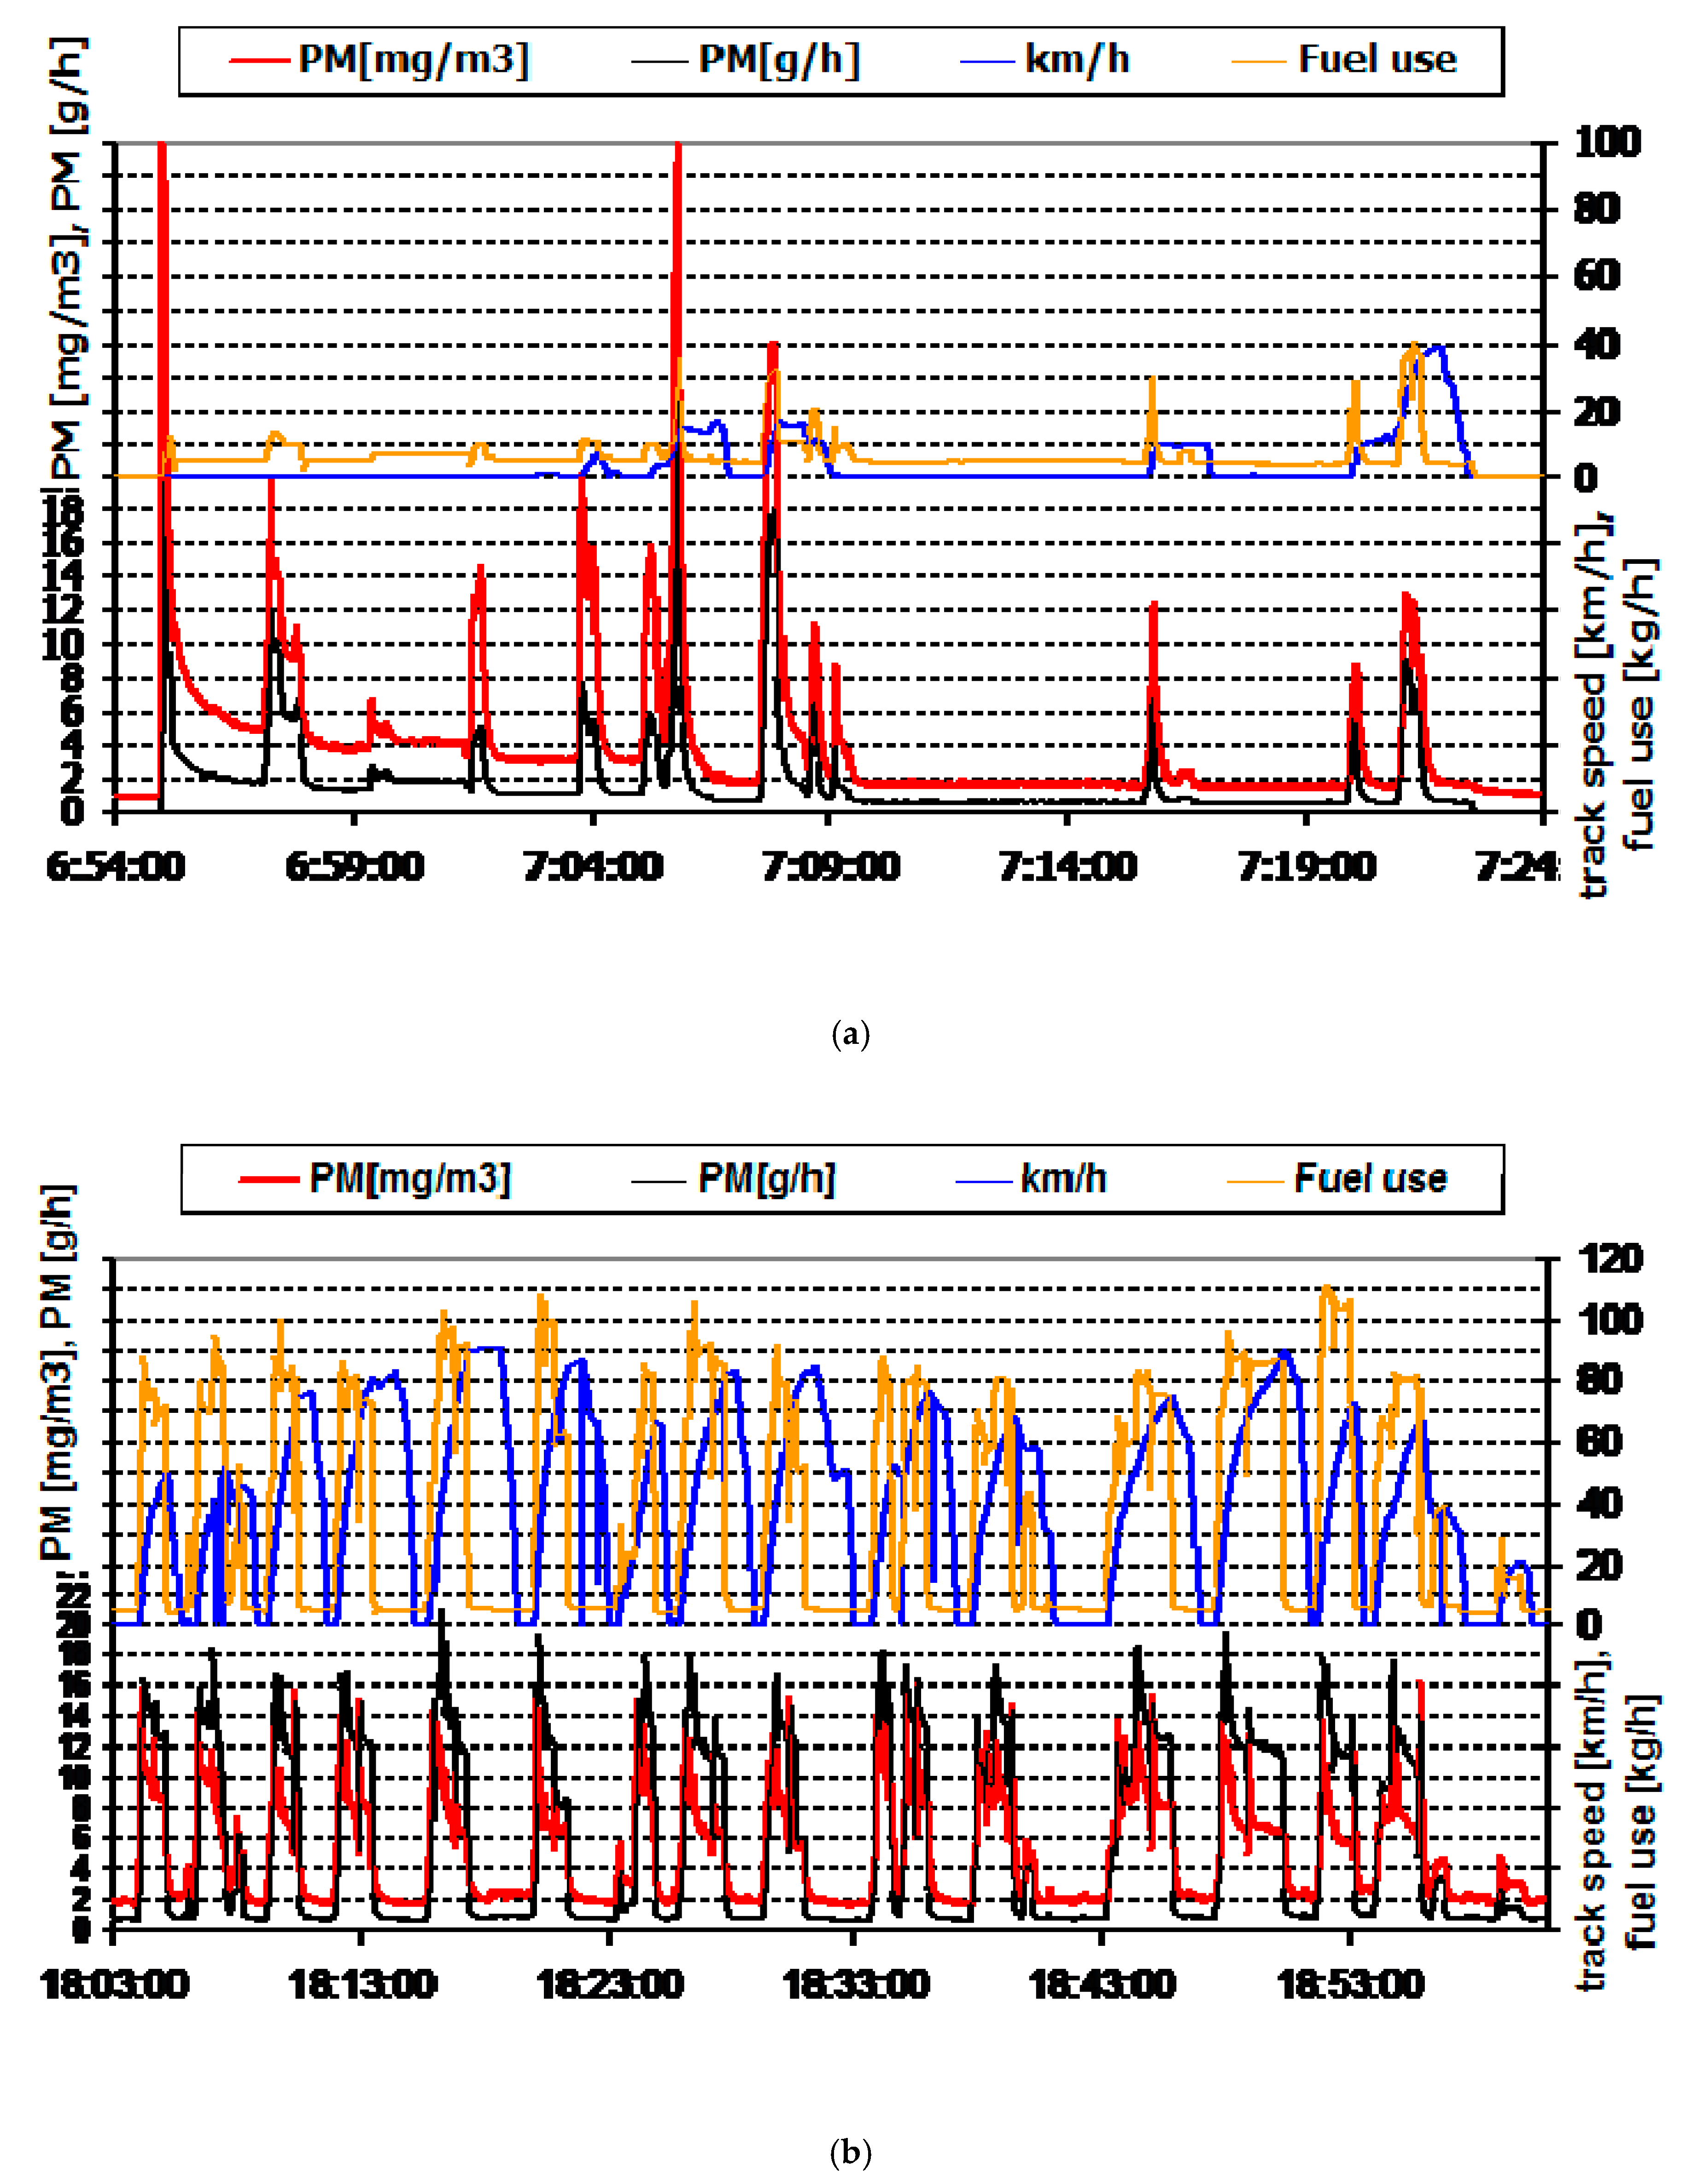
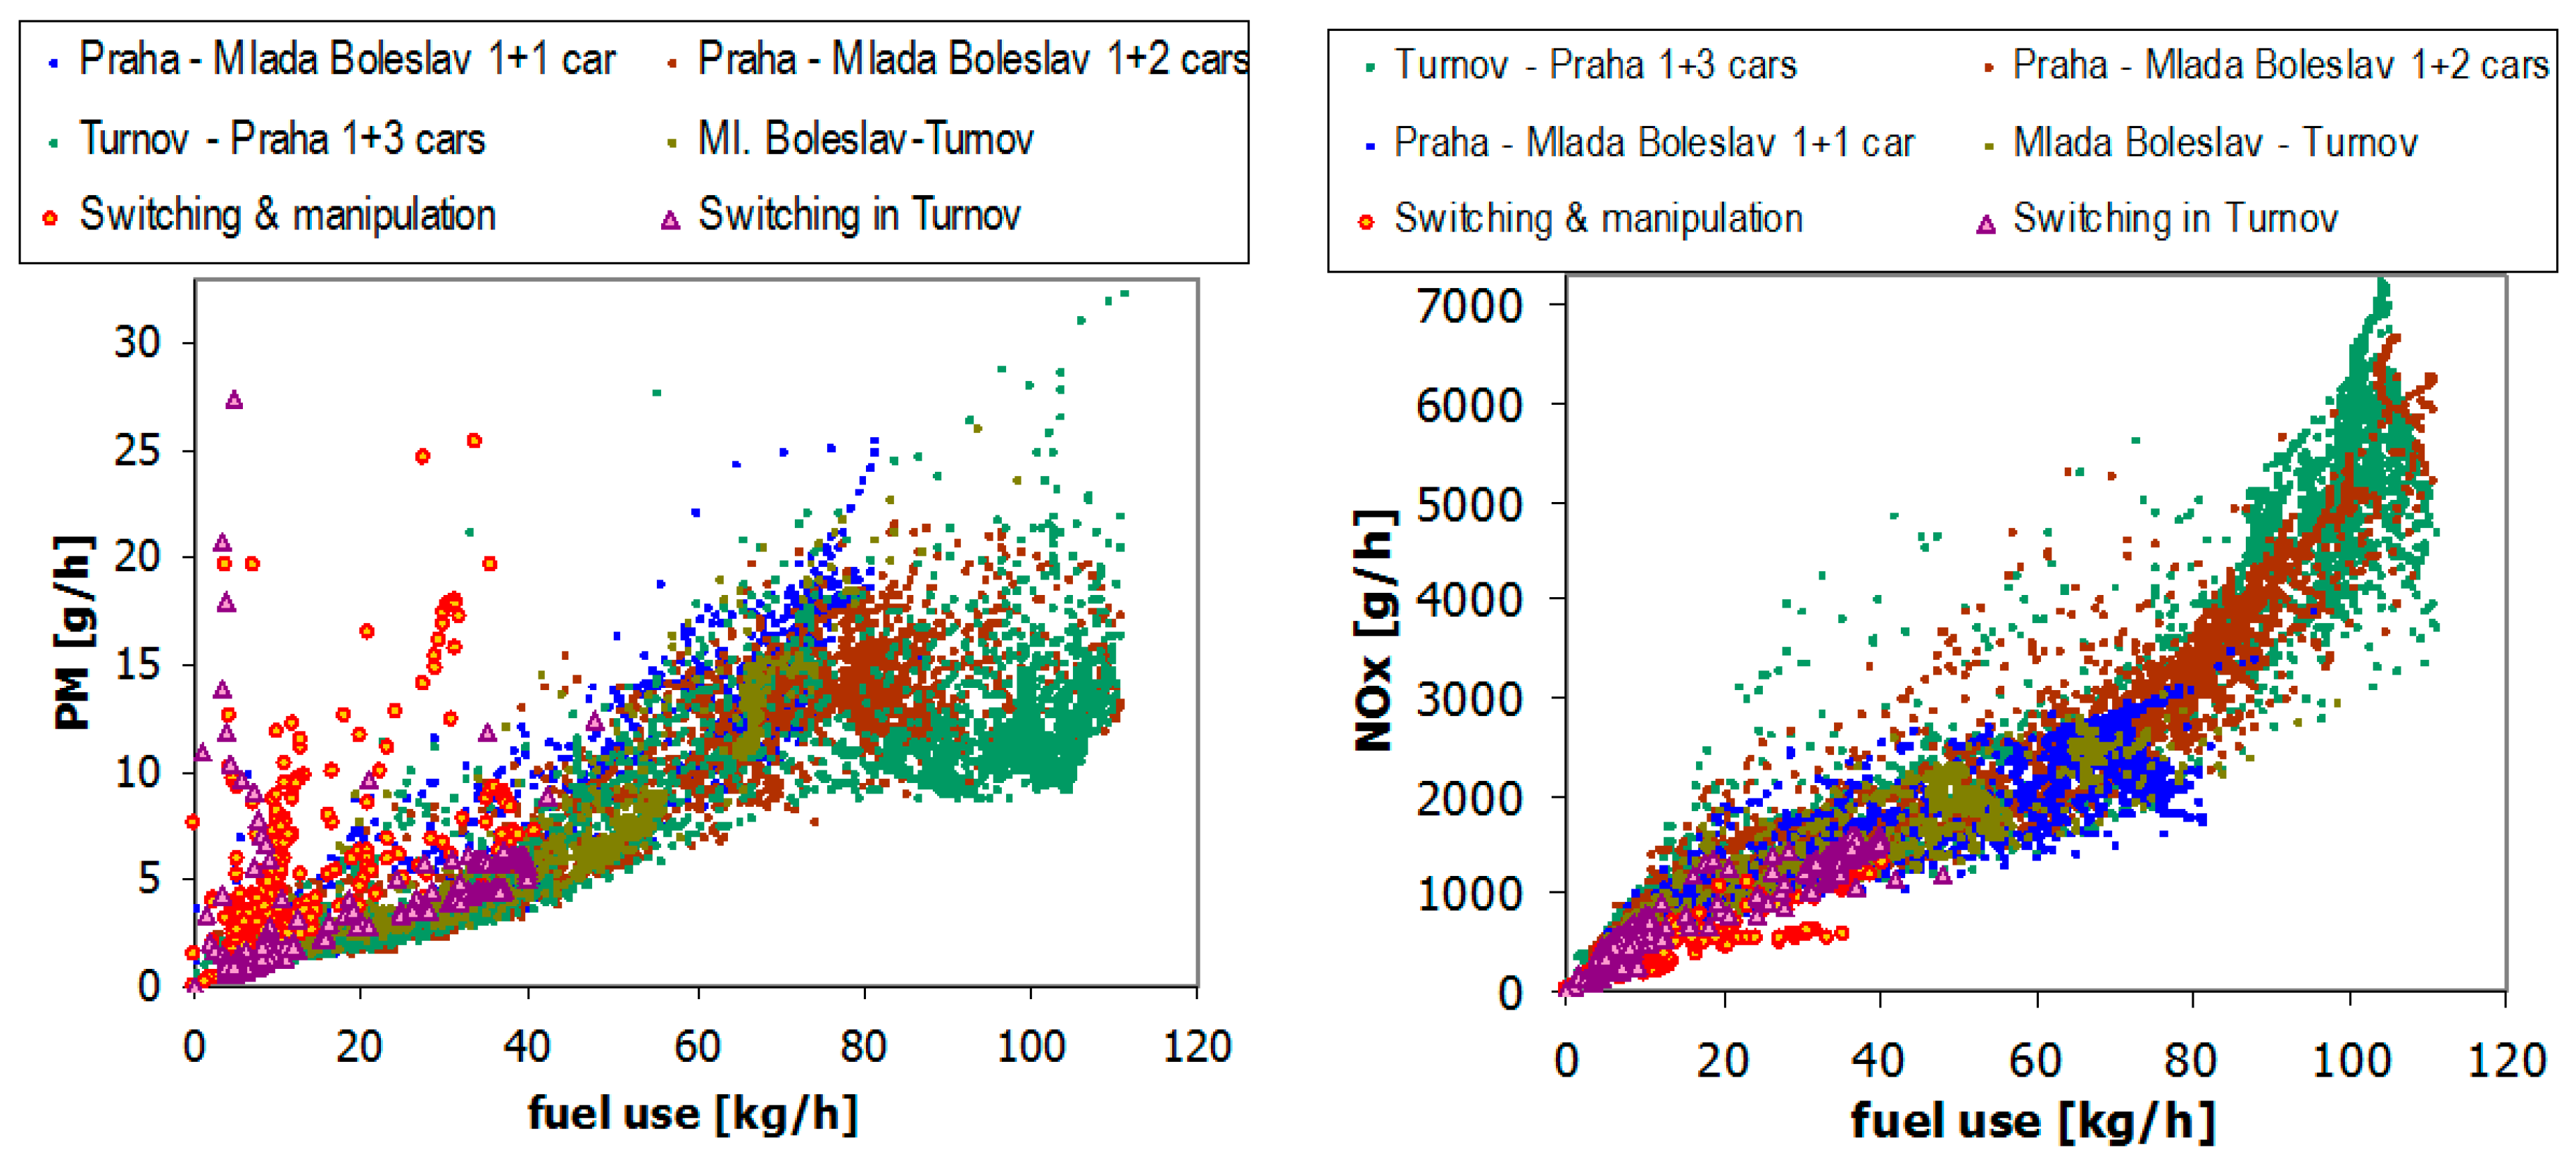
Table 1.
Fuel consumption and emissions.
| 749 Praha–Tanvald, 5 cars, 280 t | Fuel kg/km | NOx g/km | PM g/km | CO g/km | Traction kWh/km |
|---|---|---|---|---|---|
| Praha–Turnov | 1.55 | 79 | 1.05 | 22 | 6.79 |
| Turnov–Tanvald | 2.36 | 142 | 1.36 | 32 | 10.85 |
| Praha–Tanvald | 1.79 | 98 | 1.15 | 98 | 7.78 |
| Tanvald–Turnov | 0.95 | 75 | 0.65 | 34 | 5.29 |
| Turnov–Vsetaty | 0.86 | 53 | 0.55 | 19 | 3.96 |
| Vsetaty–Turnov | 1.06 | 65 | 0.59 | 21 | 4.37 |
| Praha–Tanvald–Vsetaty | 1.39 | 80 | 0.90 | 24 | 6.34 |
| Praha–Ceske Budejovice, 2 cars, 160 t | 0.81 | 61 | 0.41 | 15 | 3.50 |
| 754 Praha–Tanvald, 4 cars, 231 t | Fuel kg/km | NOx g/km | PM g/km | CO g/km | PN #/km |
| Praha–Turnov | 1.33 | 83 | 0.60 | 23 | 7.8 × 10¹³ |
| Turnov–Tanvald | 1.74 | 124 | 0.94 | 30 | 1.0 × 10¹³ |
| Praha–Tanvald | 1.44 | 93 | 0.67 | 25 | 8.4 × 10¹³ |
| Tanvald–Turnov | 1.01 | 71 | 0.44 | 14 | 5.2 × 10¹³ |
| Turnov–Praha | 1.02 | 64 | 0.43 | 14 | 5.6 × 10¹³ |
| Tanvald–Praha | 1.01 | 66 | 0.44 | 14 | 5.6 × 10¹³ |
| Tanvald–Turnov | 0.91 | 57 | 0.32 | 14 | 5.2 × 10¹³ |
| Turnov–Praha | 1.11 | 67 | 0.49 | 16 | 6.3 × 10¹³ |
| Tanvald–Praha | 1.07 | 64 | 0.45 | 16 | 6.0 × 10¹³ |
| Praha–Tanvald–Praha average | 1.22 | 79 | 0.56 | 19 | 7.0 × 10¹³ |
| 854 Praha–Turnov, 0–3 cars | Fuel kg/km | NOx g/km | PM g/km | CO g/km | |
| Depot operation, switching | 1.76 | 77 | 0.53 | 22.4 | |
| Praha–Mlada Boleslav local 1+1 | 0.78 | 31 | 0.15 | 8.9 | |
| Mlada Boleslav–Turnov 1+0 | 0.71 | 33 | 0.11 | 9.7 | |
| Turnov–Praha express 1+3 | 1.04 | 55 | 0.14 | 5.9 | |
| Praha–Mlada Boleslav local 1+2 | 0.89 | 42 | 0.14 | 9.5 | |
| 854—average for all operation | 0.89 | 43 | 0.14 | 8.2 |
Table 2.
Fuel consumption and emissions during idling.
| Vehicle and Conditions | Fuel kg/h | NOx g/h | PM g/h | PN #/h | CO g/h |
|---|---|---|---|---|---|
| 749—cold, with car heating | 31 | 2238 | 14 | 380 | |
| 749—first station (semi-cold) | 8.3 | 733 | 8.3 | 189 | |
| 749—warm | 8.2 | 875 | 7.9 | 21 | |
| 754—cold, with car heating | 34 | 2819 | 5.1 | 1.0 × 10¹⁵ | 421 |
| 754—warm | 12 | 718 | 1.3 | 1.2 × 10¹⁵ | 370 |
| 854—average for all operation | 4.0 | 261 | 0.68 | 101 |
Table 3.
Emissions per kg fuel.
| Emissions per kg Fuel | NOx g/kg | PM g/kg | CO g/kg | BSFC g/kWh | PN #/kg |
|---|---|---|---|---|---|
| 749 Praha–Tanvald–Vsetaty | 58 | 0.65 | 17 | 219 | |
| 749 Praha–Ceske Budejovice | 75 | 0.51 | 19 | 231 | |
| 754 Praha–Tanvald–Praha | 65 | 0.46 | 16 | 5.7 × 10¹³ | |
| 854 average all operation | 48 | 0.16 | 9 |
Note: BSFC, brake-specific fuel consumption.
Table 4.
Fuel consumption and emissions per ton-km and per seat-km.
| Emissions per ton-km | Tons | Fuel g/tkm | NOx g/tkm | PM mg/tkm | CO g/tkm | Traction Wh/tkm | PN #/tkm |
|---|---|---|---|---|---|---|---|
| 749 Praha–Tanvald–Vsetaty | 280 | 5.0 | 0.29 | 3.2 | 0.09 | 23 | |
| 749 Praha–Ceske Budejovice | 160 | 5.1 | 0.38 | 2.6 | 0.09 | 22 | |
| 754 Praha–Tanvald–Praha | 231 | 5.3 | 0.34 | 2.4 | 0.08 | 3.0 × 10¹¹ | |
| 854 Praha–Mlada Bol. local | 100 | 7.8 | 0.31 | 1.5 | 0.09 | ||
| 854 Mlada Boleslav–Turnov | 56 | 12.7 | 0.59 | 2.0 | 0.17 | ||
| 854 Turnov–Praha express | 232 | 4.5 | 0.24 | 0.6 | 0.04 | ||
| 854 Praha–Mlada Bol. local | 144 | 6.2 | 0.29 | 1.0 | 0.07 | ||
| Emissions per seat and km | Seats | Fuel g/skm | NOx g/skm | PM mg/skm | CO g/skm | Traction Wh/skm | PN #/skm |
| 749 Praha–Tanvald–Vsetaty | 360 | 3.9 | 0.22 | 2.5 | 0.07 | 18 | |
| 749 Praha–Ceske Budejovice | 160 | 5.1 | 0.38 | 2.6 | 0.09 | 22 | |
| 754 Praha–Tanvald–Praha | 280 | 4.4 | 0.28 | 2.0 | 0.07 | 2.5 × 10¹¹ | |
| 854 Praha–Mlada Bol. local | 108 | 7.2 | 0.29 | 1.4 | 0.09 | ||
| 854 Mlada Boleslav–Turnov | 48 | 14.8 | 0.69 | 2.3 | 0.20 | ||
| 854 Turnov–Praha express | 268 | 3.9 | 0.21 | 0.5 | 0.02 | ||
| 854 Praha–Mlada Bol. local | 188 | 2.5 | 0.22 | 0.7 | 0.05 |
Note: Train mass obtained from the train engineer’s records. Passenger occupancy is not known; mean occupancy on Czech Railways is around 30%, a number not visibly inconsistent with the observations by the authors.
© 2020 by the authors. Licensee MDPI, Basel, Switzerland. This article is an open access article distributed under the terms and conditions of the Creative Commons Attribution (CC BY) license (http://creativecommons.org/licenses/by/4.0/).
Share and Cite
MDPI and ACS Style
Vojtisek-Lom, M.; Jirků, J.; Pechout, M. Real-World Exhaust Emissions of Diesel Locomotives and Motorized Railcars during Scheduled Passenger Train Runs on Czech Railroads. Atmosphere 2020, 11, 582. https://doi.org/10.3390/atmos11060582
AMA Style
Vojtisek-Lom M, Jirků J, Pechout M. Real-World Exhaust Emissions of Diesel Locomotives and Motorized Railcars during Scheduled Passenger Train Runs on Czech Railroads. Atmosphere. 2020; 11(6):582. https://doi.org/10.3390/atmos11060582
Chicago/Turabian StyleVojtisek-Lom, Michal, Jonáš Jirků, and Martin Pechout. 2020. "Real-World Exhaust Emissions of Diesel Locomotives and Motorized Railcars during Scheduled Passenger Train Runs on Czech Railroads" Atmosphere 11, no. 6: 582. https://doi.org/10.3390/atmos11060582
Note that from the first issue of 2016, this journal uses article numbers instead of page numbers. See further details here.