Decay Kinetics of CeF3 under VUV and X-ray Synchrotron Radiation
by
 , ,
, ,
Irina Kamenskikh
1,*, 
Evgeny Tishchenko
1,
Marco Kirm
2,
Sergey Omelkov
2,
Andrei Belsky
3 and
Andrey Vasil’ev
4 1
Faculty of Physics, Lomonosov Moscow State University, Leninskie Gory 1(2), 119991 Moscow, Russia
2
Institute of Physics, University of Tartu, W. Ostwald str. 1, 50411 Tartu, Estonia
3
CELIA, CNRS-CEA-University of Bordeaux, 33405 Talence, France
4
Skobeltsyn Institute of Nuclear Physics, Lomonosov Moscow State University, Leninskie Gory 1(2), 119991 Moscow, Russia
*
Author to whom correspondence should be addressed.
Symmetry 2020, 12(6), 914; https://doi.org/10.3390/sym12060914
Submission received: 7 May 2020
/
Revised: 16 May 2020
/
Accepted: 18 May 2020
/
Published: 2 June 2020
(This article belongs to the Special Issue Advances in Synchrotron and Undulator Radiation Studies)
Abstract
:Characteristic dimensions and evolution times of regions of secondary electronic excitations created by the interaction of ionizing radiation with matter cannot be measured directly. At the same time these are essential parameters both for engineering of nanostructured composite materials defining optimal layer thickness and nanoparticles radii and for the development of optimized scintillators. The paper demonstrates how such spatial and temporal data can be extracted from luminescence decay kinetics excited by vacuum ultraviolet (VUV) and X-ray photons at modern sources of synchrotron radiation MAX IV and PETRA III. Specific features of energy-band structure of self-activated crystal CeF3 are discussed, and its potential for a super-fast detection of ionizing radiation evaluated. Diffusion-controlled dipole–dipole interaction of Frenkel excitons is demonstrated to account well for the luminescence non-exponential decay kinetics providing information on the scales of excited regions created by photons of different energy. For 20 eV photons the radius of excited regions is estimated to be 10 nm, and for 200 eV photons it increases to 18 nm. Effective radius of excited regions of complicated shape created by 19 keV is as large as 80 nm and the diffusion length of Frenkel excitons over radiative time is 14 nm.
1. Introduction
Evolving and emerging applications based on wide bandgap materials put forward new requirements to the existing information on their luminescence decay kinetics. For example, to achieve a very high time resolution while determining the moment of interaction of a high-energy quantum with media scintillators with a fast rise-on front of decay are needed because these materials emit a large portion of photons within the first few picoseconds. In medical applications, positron-emission tomography can achieve spatial resolution of a few millimetres using time-of-flight approach if scintillators with decay times of the order of 10 picoseconds are found [1,2]. A similar exceptional time resolution is essential for the calorimeters of future supercolliders of very high luminosity in high-energy physics [2]. Super-high time resolution is also important for monitoring radiation generated by free electron lasers. On the other hand, availability of reliable data on luminescence decay kinetics in a wide time range, which extends from picoseconds to several values of characteristic radiation time of specific emission centres (hundreds of nanoseconds or even beyond) is necessary for the elucidation of fundamental processes forming kinetics of scintillation response [3] and improvement of characteristics of known scintillator materials. As an example, we can mention a substantial improvement of the energy resolution achieved by modern methods of big data treatment accompanied by genetic algorithms, when digital treatment of each scintillation pulse is performed [4,5,6,7]. All these define persistent interest to the investigation of luminescence kinetics of various type of emission centres.
Due to their wide energy spectrum and well-defined time structure, synchrotron radiation (SR) sources play a special role in the understanding of the origin of luminescent response of crystals to ionizing radiation. Continuous SR spectrum from the visible range to hard X-rays can be used to create selectively controlled number of electronic excitations using chosen energy of excitation. Their spatial distribution in excited regions (clusters of excitations) can be similar to that in the tracks created by ionizing particles and it defines the kinetics of scintillation response [3]. Time structure of new generation SR sources is excellent for the study of luminescence kinetics: bunches from 100 femtosecond to 100 picosecond duration have a well-defined time separation typically in the range of hundreds of nanoseconds and a small jitter practically unreachable for laser systems, in particular in the short-wavelength range. We should mention a special role of the SUPERLUMI station (DORIS, DESY) in the research of relaxation and energy transfer processes in wide gap solids (including luminescence kinetics studies), e.g., studies intrinsic excitations in rare gas solids [8] and Ce doped scintillators [9]. Recently experimental stations were developed for time-resolved luminescence studies of solids at the P23 beamline of PETRA III storage ring at DESY in Hamburg, FinEstBeAMS and FemtoMAX beamline at MAX IV in Lund.
CeF3 crystal, which was one of the candidates for the scintillator of the calorimeter of LHC supercollider in CERN is discussed in this paper. Luminescence of excitons in the cerium subsystem of this self-activated material has an intrinsic origin. Due to this fact, the time required for the energy transfer of hot electronic excitation to the emission centres is minimal: not so many intermediate stages are involved in this process, making this crystal attractive for fundamental investigations of fast relaxation processes. In the past, CeF3 luminescence was extensively studied in [10,11,12,13,14,15], however these papers do not provide explanation for its non-exponential scintillation response.
The structure of the paper is as follows. In Section 2, experimental procedures are described. Section 3 deals with the electronic structure of CeF3, and Section 4 presents experimental results of luminescence lifetime measurements for the excitation in the region of exciton absorption, VUV and X-ray range. Based on the results a model is proposed describing the formation of luminescence kinetics with the account for the quenching of electronic excitations created by individual photons. This model fits well both the initial part of the kinetics and the profile in the whole range providing the possibility to evaluate interaction of electronic excitations in this crystal.
2. Materials and Methods
The luminescence decay kinetics of CeF3 crystal as model system was investigated at three different beamlines of two facilities: FinEstBeAMS undulator beamline [16] located at the 1.5 GeV storage ring of the MAX IV synchrotron facility (Lund, Sweden) [17] for the energy range 4.5–1300 eV; hard X-rays P23 beamline [18] of 6 GeV PETRA III storage ring at DESY (Hamburg, Germany) and FemtoMAX [19]—a femtosecond X-ray beamline at the MAX IV short-pulse facility (Lund, Sweden). Our time-resolved luminescence experiments were pioneering commissioning research at all three setups and demonstrated their excellent potential.
At FinEstBeAMS photoluminescence endstation [17] an Andor Shamrock SR-303i spectrometer was used in luminescence analysis in photon counting mode by a Hamamatsu R3809U-50 MCP-PMT detector. Luminescence from samples is collected by a fiber, which is coupled to the spectrometer. The fiber (2 m fused silica) adversely influenced the time resolution due to dispersion and introduction of delayed reflections, but collected enough light for high quality time-resolved photoluminescence spectroscopy. The MCP-PMT signals were processed by an ORTEC 9327 constant fraction discriminator and timed by the Cronologic xTDC4 time-to-digital converter with 13 ps bin width. The start signal for the xTDC4 was delivered from the bunch marker, which divided the master frequency of the synchrotron (approx. 100 MHz) by 512 to prevent TDC overload. The instrumental time response function of the system was recorded as the time profile of excitation pulse at 5.7 eV, and its width is dominated by synchrotron bunch length (typically 170 ps FWHM). The plane grating primary monochromator in the grazing incidence geometry provides excitation in the range 4.5–1300 eV. Photons are generated by elliptically polarizing undulator source. Decay kinetics were studied in a single bunch operation mode (pulse width typically160–180 ps FWHM with 320 ns interval between bunches) of the 1.5 GeV storage ring.
At the P23 beamline a custom-built endstation for luminescence measurements was mounted in the experimental hutch. The PETRA III was operating in a 40-bunch mode (bunch width ~100 ps FWHM, interbunch period 192 ns). The actual time resolution (instrumental response function, IRF) of the whole system depends on the electron bunch length and bunch-to-bunch stability; in the 40-bunch mode an excellent 105 ps FWHM of IRF was achieved in our study. The sample was mounted in a Janis VPF-800 vacuum cryostat, wherefrom luminescence from the sample was focused onto an input slit of Andor Kymera 328i UV-visible spectrometer by a lens collimator. The MCP-PMT, signal processing and the time-correlated single photon counting (TCSPC) system was identical to that used at the FinEstBeAMS experiment. Unlike FinEstBeAMS, P23 beamline cannot be tuned to provide light detectable by MCP-PMT, therefore different approach was used for recording the IRF. Namely, the time profile of hot intraband luminescence (IBL) from Li2MoO4 crystal was recorded instead. The IBL presumably has decay time about one picosecond [20], which is much shorter than the bunch duration. Li2MoO4 is convenient because at T = 295 K it features practically no other types of luminescence except IBL, and was successfully used for IRF recording for pulsed X-ray setups before [21].
FemtoMAX [19] beamline features pulsed 100-fs X-ray excitation in a 1.8–20 keV energy range. For current experiment 10 keV photon energy was selected at 2 Hz pulse repetition rate, which can be upgraded in the future. The pulse width defines the ultimately achievable time resolution as 100 fs, however there are no photodetectors currently available, which could approach such value. The current experiments were performed using the Hamamatsu R3809U-50 MCP-PMT operated in a photon counting mode with a transit time spread of 25 ps FWHM. The sample was mounted on the rotatable sample holder in the air-filled experimental chamber with a kapton foil window for X-ray input. On the same chamber, sealed for external light, the MCP-PMT was mounted perpendicular to X-ray beam direction. No focusing optics was used in luminescence collection in front of the detector. Glass filters can be used for luminescence selection, however in this experiment no filter was used. The output of the MCP-PMT was boosted by an SHF 100 APP broadband preamplifier (12 GHz, 19 dB) and digitized by the Lecroy Labmaster 10-36Zi oscilloscope (36 GHz, 80 Gs/s) with the input bandwidth limited to 13 GHz. The trigger for the oscilloscope was a signal induced by electron beam in the radio frequency antenna located near the short pulse facility undulator, which generates X-ray pulses at 2 Hz due to a linac operation rate.
After each X-ray excitation pulse from the undulator a waveform containing several emitted single photon peaks correlated with the trigger event was obtained. Each waveform was processed in the LabView package by its built-in Peak Detector Virtual Instrument (VI), which detected photon timestamps (i.e., their time of arrival). Therefore, after each X-ray pulse multiple luminescence photons were detected, significantly speeding up the data accumulation process as compared to a traditional TCSPC technique, which becomes obsolete at 2 Hz repetition rate. To prevent overflow conditions, the whole traces containing photon peaks with very high amplitude or successive peaks too close together were discarded. The amount of discarded traces was about 5%. The decay curve was obtained by accumulating photon timestamps over 39,924 excitation pulses (6-h period), and plotting them on a histogram with 12.5 ps bin width (equal to oscilloscope sampling period). Similar to P23 experiment, the time profile of hot intraband luminescence (IBL) from Li2MoO4 was recorded as IRF.
3. Results
3.1. Energy Band Structure of CeF3
The energy band structure of a wide bandgap insulator CeF3 having a rare-earth element as an inherent constituent of the host lattice is quite specific [10]. Let us compare it with the band structure of lanthanum fluoride, which is a typical ionic crystal with a forbidden energy gap of 10 eV. Its valence band is formed by 2p states of fluorine and the bottom of the conduction band by 5d states of lanthanum. The main difference of the electronic structure of CeF3 from that of LaF3 is defined by the presence of a 4f electron. At the fundamental absorption threshold the transitions from the valence 2pF− band to 5d lanthanum states are observed. If such transitions were localized they could be considered as charge transfer transitions with the creation of La2+ and F0 entities. Something like this occurs at the energies just below Eg. In LaF3 doped by cerium, 4f level of Ce3+ is located 3–4 eV above the top of the valence band. When cerium is a dopant, absorption of photons with the energy 3–5 eV (depending on the matrix) results in electron transition 4f → 5d in Ce3+, leaving cerium in trivalent state until the photon energy is sufficient for the electron transfer to the conduction band, i.e., approaching 5d states of La2+ (producing the excess of an electron in the conduction band and a lack of an electron at cerium 4f shell). Cerium ionization creates a state e(5dLa2+) + Ce4+ ion. If we increase cerium concentration up to 100%, the bottom of the conduction band will be composed of cerium 5d states. At the same time, cerium being present in each elementary cell forms a band of 4f 1 states filled by one electron per 14 existing states. The width of this band is very small due to small overlap of spatially confined 4f wavefunctions of cerium ions. Electrons cannot move along this band since moving an electron from one cerium ion to another one would create a state 4f 2, the energy of which is several electronvolts higher than that of 4f 1. Excitations created in the region of Ce3+ 4f → 5d transitions can be treated as Frenkel excitons, such excitations localized on individual Ce3+* ions can hop from one ion to another due to dipole–dipole interaction. Ionization of the 4f Ce3+ state results in the e(5dCe2+) + Ce4+ states. The transitions from the valence band formed by 2pF− to cerium 5d states create excitonic states or separated electron-hole pairs e(5dCe2+) + h(F0) with the energy about 10 eV, which are similar to the electron states in LaF3. Oscillator strength for these transitions is one and a half orders of magnitude larger than that for the transitions in the cerium ion 4fCe3+ → 5dCe3+ owing to a good overlap of fluorine 2p and cerium 5d wavefunctions and respective absorption coefficient reaches the values around 106 cm−1, typical for excitonic states. At the same time absorption coefficient in the cerium ion is only a few times 104 cm−1 [10]. Due to relatively low mobility of Frenkel excitons across cerium subsystem due to a strong electron-phonon coupling, thus the absorption spectrum of CeF3 in the region 5–6 eV looks like similar to the absorption of isolated cerium ions in hosts with low cerium site symmetry—it can be described by five Gaussians. Likewise the emission spectrum of Frenkel excitons in CeF3 is similar to the spectrum of cerium as an activator; it consists of two overlapping luminescence bands originating from the lowest 5d (1) Ce3+ exited state to the spin-orbit split ground state doublet 2F5/2 and 2F7/2 of Ce3+. From this perspective electronic structure of CeF3 (as well as of other compounds with cerium as a host constituent) can be considered as a superposition of LaF3 states with the states of cerium subsystem. In particular, such a system has two types of excitons. Undoubtedly, these two subsystems are interconnected since anion exciton e(5dCe2+) + h(F0) can easily transfer its energy through dipole–dipole interaction to an adjacent cerium ion, this would result in the ionization of cerium with further recombination of the state e(5dCe2+) + Ce4+ by the capture of an electron to an empty 5d level of Ce4+ with the creation of Ce3+* (Frenkel exciton). That is why luminescence of anion exciton is not observed in this system. In this regard, electron-hole pair energy transfer, when the holes belong to the fluorine valence band, occurs with a minimal delay unlike the case of relatively long migration of electronic excitations in crystals with cerium as an activator with the concentration less than a portion of a percent. In the latter type of luminescent crystals, the migration manifests as a build-up part of luminescence kinetics with characteristic time that rarely drops below 100 ps [22], setting the limit for time resolution of scintillators based on such systems. If cerium is a natural constituent of the host long build-up of the luminescence can be avoided.
Some other consequences can be derived as well from the electronic structure described above. Let us consider relaxation of high-energy excitations. High concentration of cerium increases the probability of impact mechanism of its excitation and ionization. In most of the crystals multiplication of electronic excitations (creation of more than one electron-hole pair after the absorption of a single photon due to inelastic scattering of primary photoelectron with high kinetic energy) stops, when kinetic energy of the electron above the top of a conduction band becomes less than forbidden energy gap. This is reflected by the fact that electron energy loss function , which is proportional to the imaginary part of dielectric function (and hence to the absorption coefficient) turns into zero at the energies below forbidden energy gap. In CeF3, electrons with kinetic energy above Eg–10 eV can create additional electronic excitations in the anion subsystem of the crystal (with the hole in the valence band) while those with kinetic energy from 5 to 10 eV can excite or ionize cerium subsystem with direct energy transfer to excited cerium states. Due to this option multiplication of electronic excitations starts not from the photon energy of 2Eg–20 eV, as normally observed in most of wide bandgap crystals with a narrow valence band, but from the energy as low as 15 eV. Such processes have been identified and investigated in detail in alkali halides doped with Tl+ by various methods [23].
3.2. Experimental Results
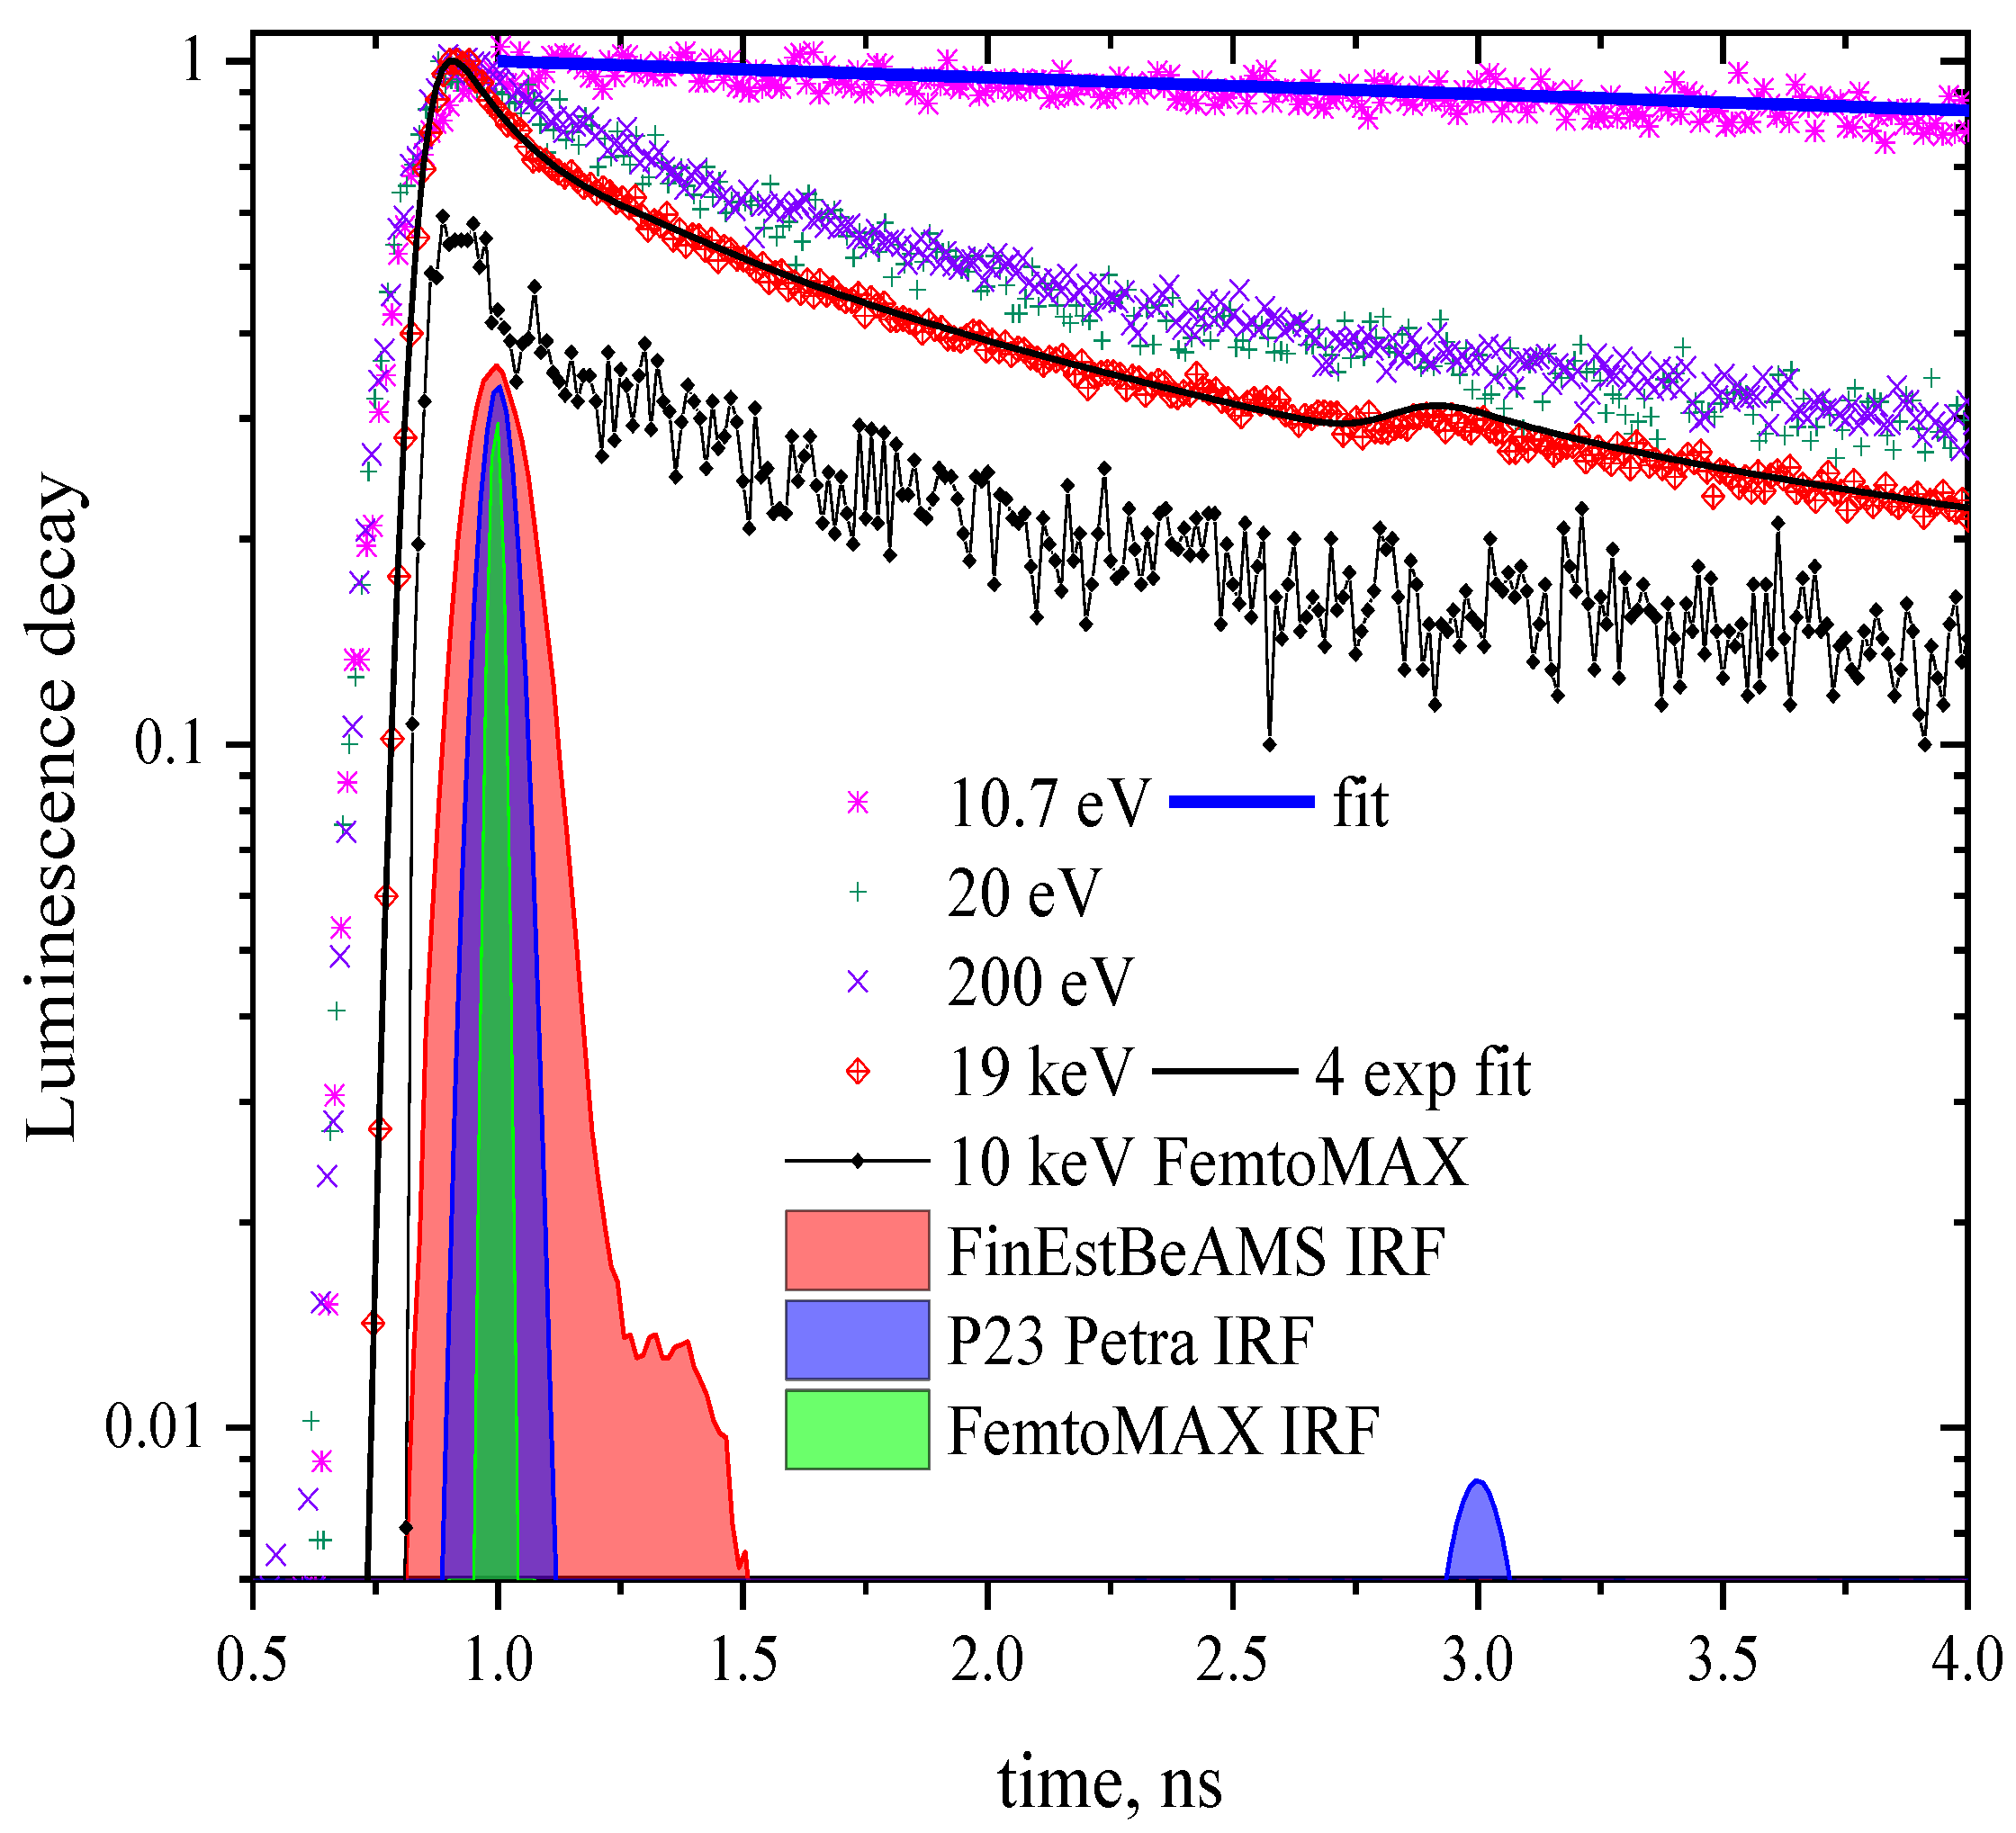
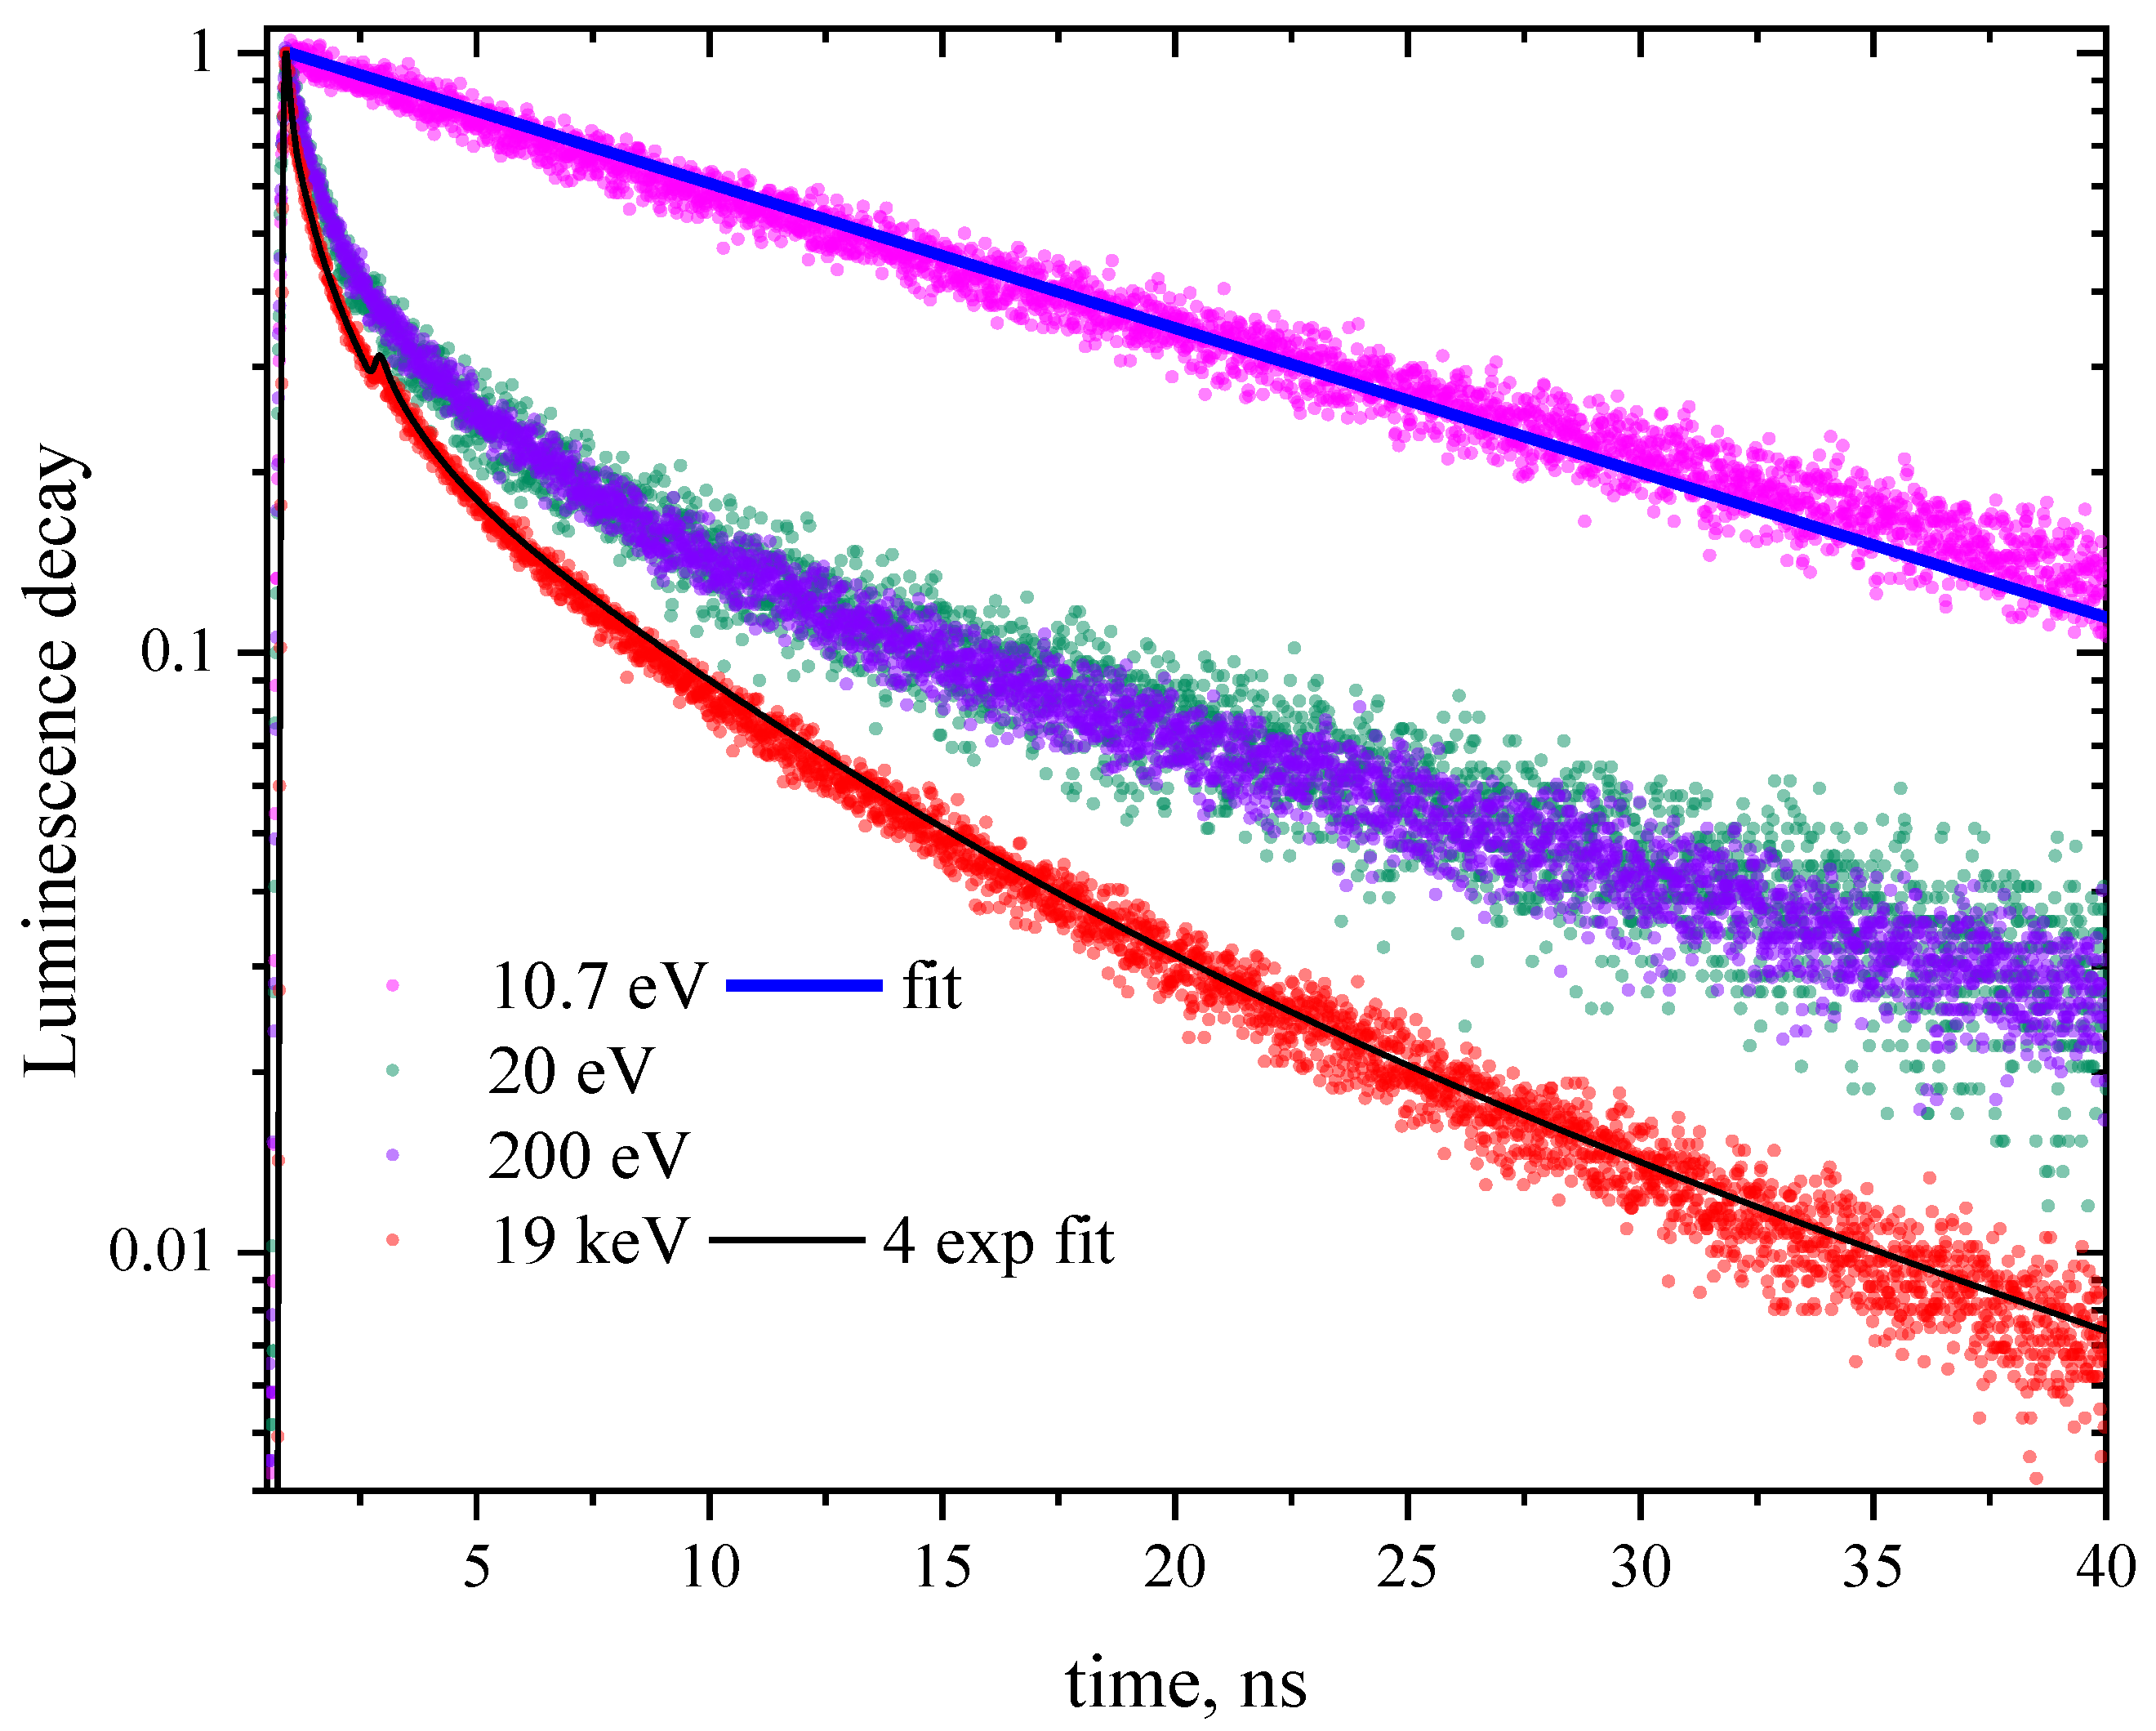
Luminescence decay kinetics of CeF3 measured for excitation energies 10.7, 20, 200 eV (emission 300 nm at FinEstBeAMS), 10 keV (200–800 nm emission range at FemtoMAX) and 19 keV (emission 300 nm at P23 Petra) are presented in Figure 1. All the curves are non-exponential. This non-exponential dependence of the intensity on time is only slightly pronounced for the excitation energy 10.7 eV. Photons of such energy can create only one electronic excitation with a hole in the anion subsystem. The non-exponentiality becomes more pronounced with the photon energy, when it becomes sufficient for the creation of several electronic excitations by inelastic electron scattering of hot electrons and/or Auger processes. These recent results are in agreement with the results of earlier studies [10,11,12,15].
Luminescence kinetics excited by 10.7 photons is fairly well fitted by a single-exponential curve with a radiative time of 18 ns. Excitation with by higher energy photons yields significantly non-exponential decay kinetics. As shown in Figure 1, to fit kinetics excited by 19 keV photons (black curve) a sum of four exponentials with characteristic times of 150 ps (3%), 1 ns (15%), 6 ns (46%), and 18 ns (36%) is required. A value of 18 ns is a characteristic radiative time of cerium 5d → 4f transition in CeF3, while three other values do not have a distinct physical meaning serving just for parameterization of the curve. For other excitation energies they would be different except 18 ns. Thus this multi-exponential approach is valuable only for “digitizing” the curves but provides no input for understanding energy transfer and transformation processes in the excited regions.
4. Discussion
Analysis of the profile of these decay curves allows to extract information on the interaction of electronic excitations in CeF3 crystal not available from any other techniques. Non-exponentiality of decay kinetics can have several origins [24]. As described above the creation of excited cerium states (the “source” of radiative transitions) in cerium concentrated systems is a rapid process that is why to simplify the analysis we can consider an instantaneous creation of a single or several electronic excitations by a photon.
Two main processes of radiative decay of electronic excitations created in the region of fundamental absorption are manifested as the non-exponentiality of luminescence kinetics. The first one is known as surface quenching and refers to the interaction with the defects located on the surface. Excitons can also decay while interacting with defects or other excitons. Schematically the former interaction can be described as a dipole–dipole exciton energy transfer to a defect with further annihilation of the exciton; the excited defect after that can relax either radiatively or non-radiatively. The probability of such energy transfer has a steep dependence on the distance between the donor (exciton in our case) and the acceptor (excited defect state) described by , where is radiative lifetime of the exciton and is dipole–dipole interaction radius, i.e., the radius for which the rate of the energy transfer equals to the rate of the radiative process. Sixth order of the radius is proportional to the overlap integral of the exciton emission spectrum and defect absorption. Normally this radius does not exceed 2 nm. Such interaction induces changes in the decay kinetics described as:
where is the concentration of the quenchers, . As mentioned above, Frenkel excitons in CeF3 are mobile and the process of energy transfer is a diffusion-controlled one. Dipole–dipole energy transfer to a defect occurs when the exciton enters the region of interaction with the defect. In this case the kinetics of the process is described by complicated interpolation formulas [25]:
where:
These solutions were used in [26,27,28]. Kinetics depends on the ratio of the diffusion length (i.e., the propagation of the excitation with diffusion coefficient in radiative time ) and the radius of dipole–dipole interaction . If the diffusion length is small as compared to , kinetics is described by Equation (1). In the case of a large diffusion coefficient D the kinetic becomes single-exponential , where the effective capture radius equals to . The most widespread manifestation of this type of interaction is the so-called surface quenching, when the defects (acceptors) are located on the surface, hence the higher the absorption coefficient, the more pronounced is the non-exponentiality. For the case of CeF3 at 10.7 eV excitation we see it as a weak non-exponentiality in the beginning of the decay process, the rest of the curve is well fitted by a single exponential with = 18 ns (Figure 1).
The second type of quenching originates from the interaction between Frenkel excitons. As a result of such interaction one Frenkel exciton represented by a cerium ion excited from 4f state to the lowest 5d state disappears, the electron returns to the 4f state, and the energy is transferred to the second excited cerium ion Ce3+*, which is ionized with the formation of e(5dCe2+) + Ce4+ state. This process is energy-allowed as the energy separation between the excited 5d level and the bottom of the conduction band is smaller than the energy of the transition of excited cerium to the ground state. After ionization the electron from the conduction band can return to the ionized cerium ion forming an excited state Ce3+* again, or it can be trapped by a defect. Trapped electrons will be responsible for the slow luminescence component with characteristic time larger than . Thus the interaction Ce3+* + Ce3+* results in less than one excited cerium from two initial excitations. The yield of excitons in this reaction will be noted as . This quenching mechanism is similar to the quenching observed at high excitation densities in other systems with excitonic luminescence, e.g., CdWO4 [29]. Luminescence quenching in such systems was observed in luminescence z-scan experiments using harmonics of a femtosecond laser [28,30,31,32] and is well-described by the following formula:
where is the maximal concentration of excitations at the initial moment, , —error function, is polylogarithm function. This formula was derived in an assumption that the distribution of electronic excitations in space is defined by the cross-section of the laser beam having Gaussian profile with the dispersion , which is incident normally to the crystal with the absorption coefficient k: . We assume that the concentration of excitations is evolving according to the equation:
where describes the rate of binomial recombination depending on time. In the case of dipole–dipole interaction , other types of interaction are described in [33]. In the case of diffusion-controlled dipole–dipole transfer, this coefficient equals [28]:
The diffusion coefficient is doubled in this formula as both reagents (excitons) are mobile. In the general case, .
In the case of excitation by a relatively weak photon flux of synchrotron radiation, the regions occupied by the excitations created by individual photons do not overlap. In each of these regions, the number of excitations N is proportional to the photon energy : , where is the mean energy required for the creation of one electron-hole pair, which is normally supposed to be between two to three values of forbidden energy gap Eg. In the case of CeF3 due to the special features of the band structure described above and the possibility of impact creation of excitations in the f-d cerium subsystem this energy is substantially less, thus photons of 20 eV energy can create two–three excitations of Ce3+*. Due to the mobility of hot electrons and holes, these excitations are spread over a certain region in space. For high photon energies (tens and hundreds of keV) the shapes of these regions are quite complicated and we can speak about tracks of ionizing particles with fractal structure (see, e.g., [6,7]). For the photon energy of 10 keV the track length is comparable with the thermalization length of the excitations and for the sake of simplicity we can consider spherical excited regions created by VUV and X-ray photons. In this case, , where . If the time of smearing of such a distribution is small in comparison with the radiative time, we can consider it to be constant, then we can use the approach used for the description of z-scan experiments for kinetics averaging. Thus the formula for kinetics can be written as follows:
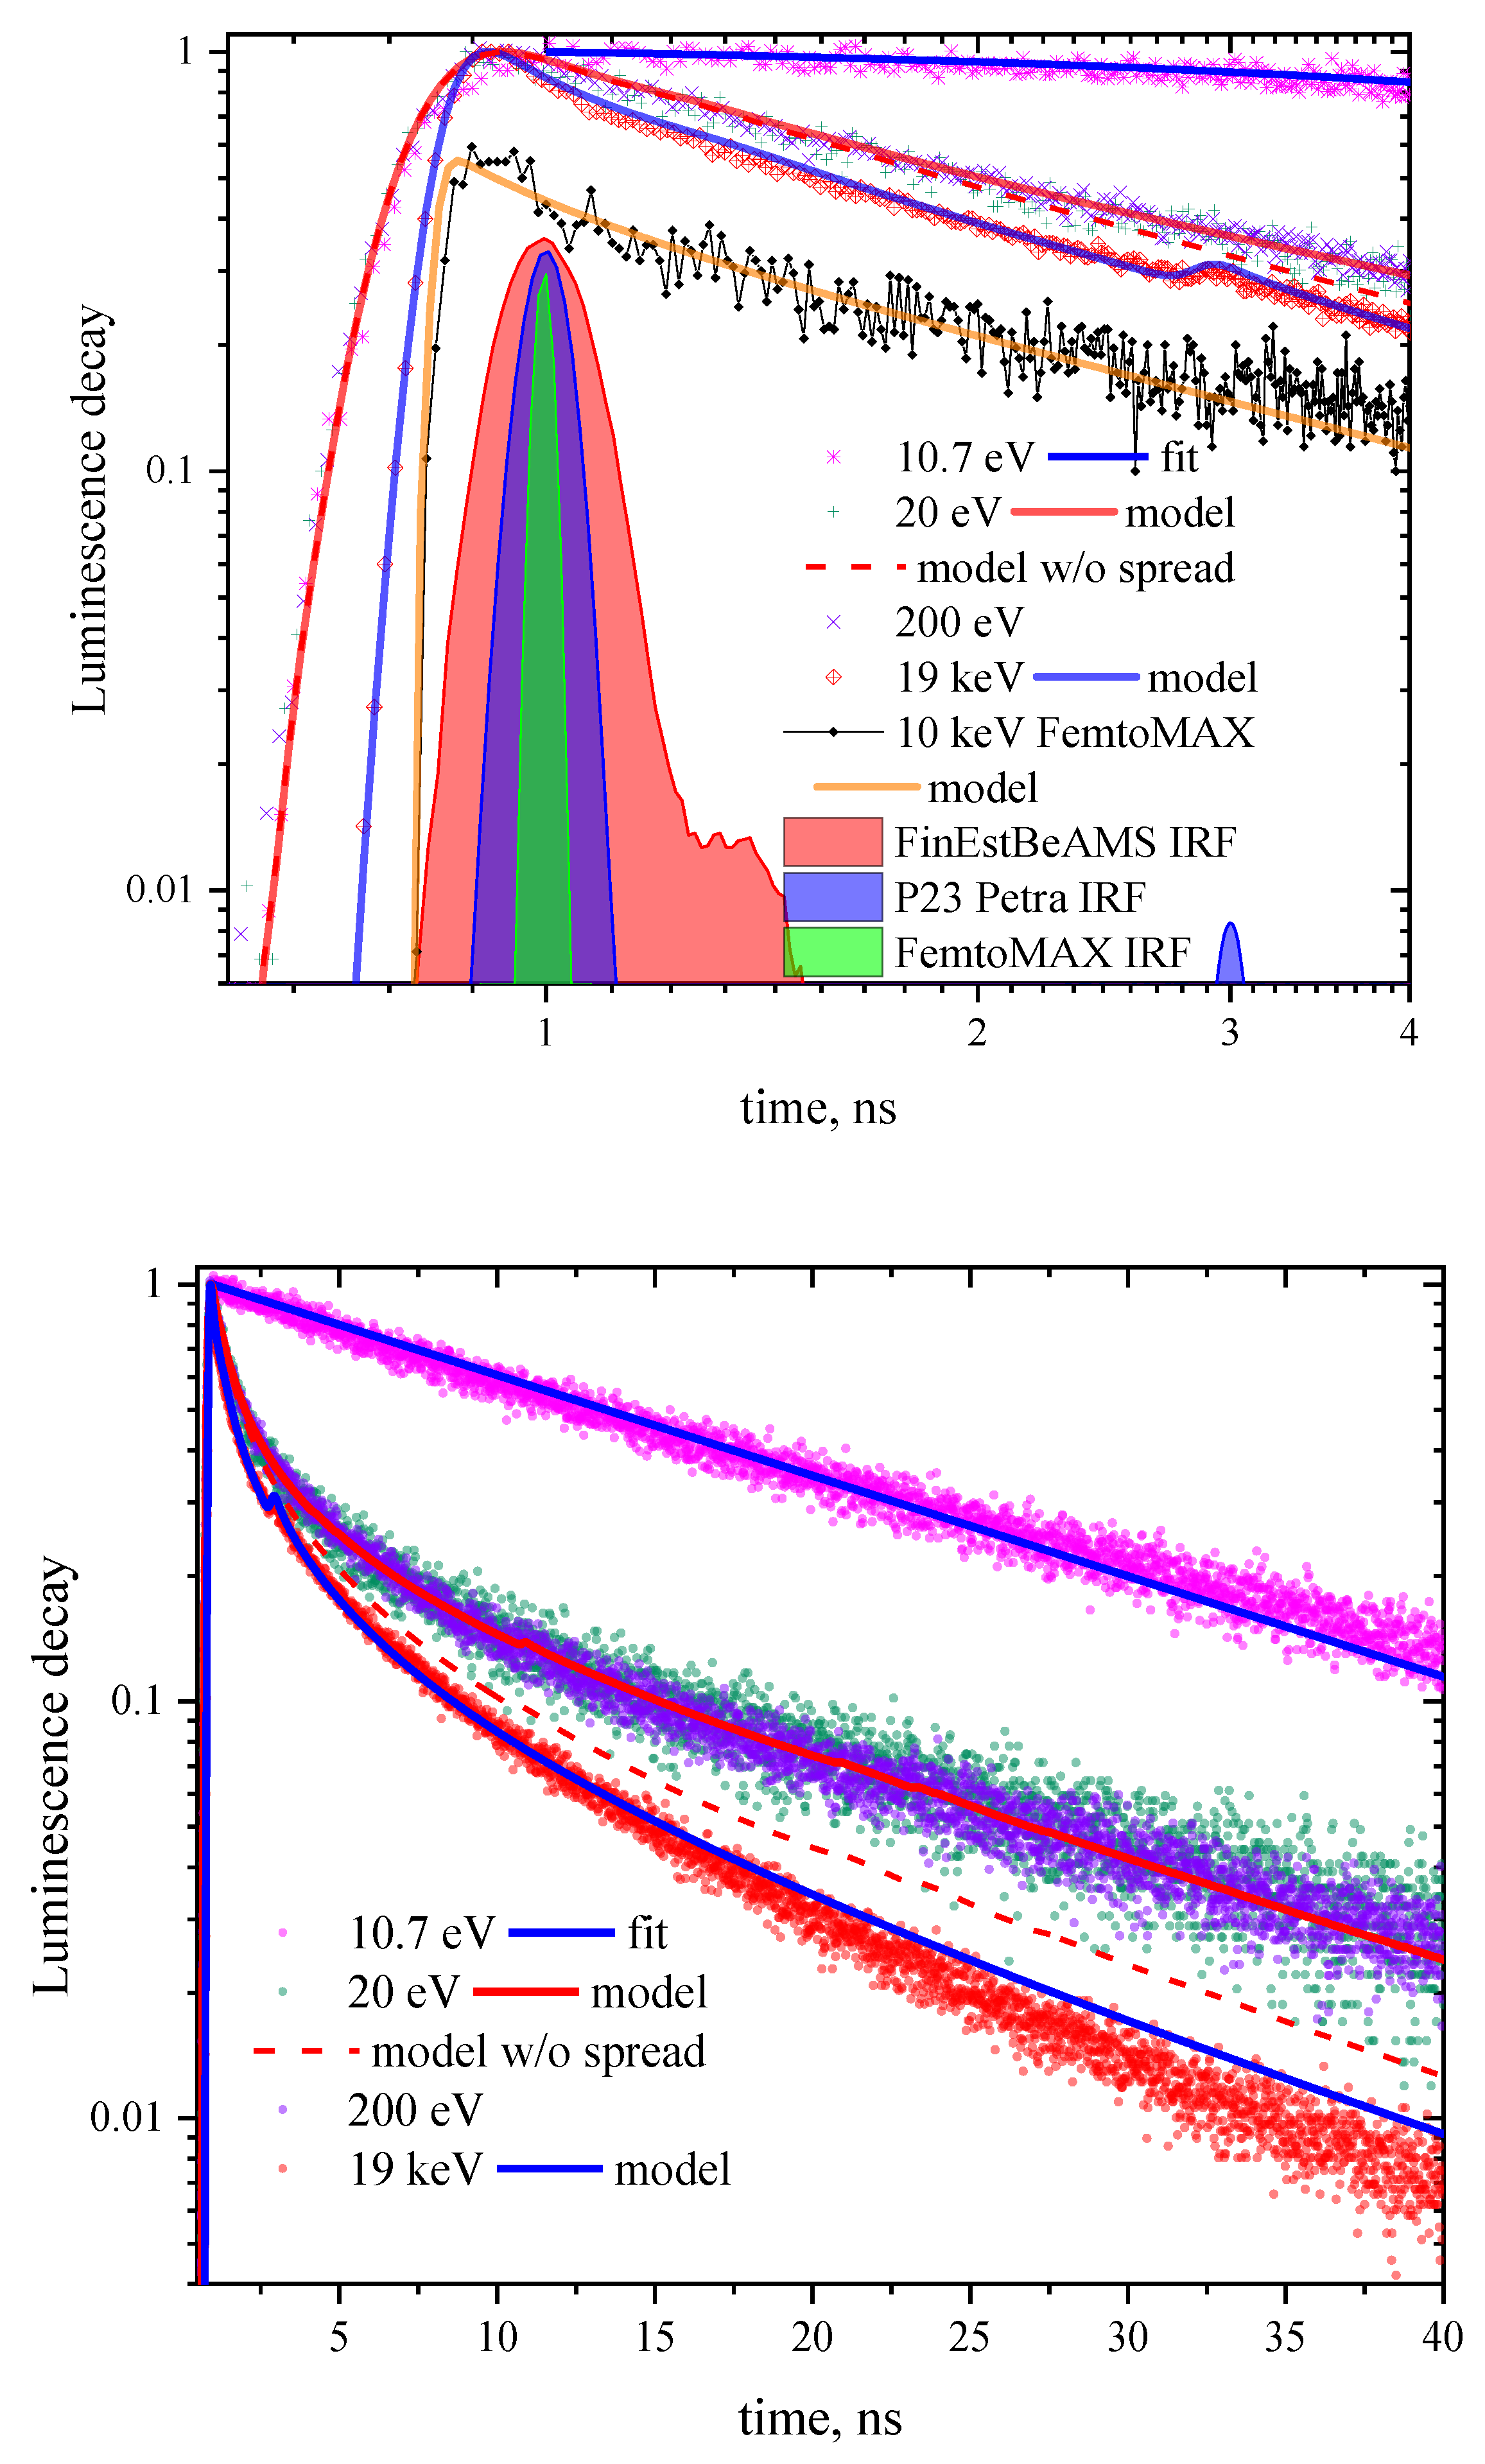
with a different index of the polylogarithm. To account for Frenkel exciton diffusion the formulas described in [28] for diffusion-controlled dipole–dipole transfer should be used. These formulas can reproduce experimental luminescence decay kinetics excited by X-rays. For this evaluation we assume that interaction of two excitons yields an exciton with the probability = 0.5, is about 10 eV. In this case the number of excitations created by one photon equals to ~2000. The best fit shown in Figure 2 by the blue curve is achieved for , . For the dipole–dipole interaction radius equal to 2 nm the diffusion length can be evaluated to 14 nm, and nm. In reality, the tracks created by the absorption of X-ray photons are not spherical, they have fractal-type structure with fractal dimensions less than 2 [6,7], their length is defined by the path of the primary photoelectron created by X-ray photon, which for the energy of 19 keV is approximately 1000 nm. The volume of such track can be compared to the volume used for the simulation giving the radius if cylindrical track of the order of 25 nm. Simulation result does not reproduce the profile of the experimental curve perfectly due to the complicated track geometry, which in CeF3 fluctuates from one track to another [7].
Using these formulas for the kinetics excited by VUV radiation faces certain difficulties, because the parameter , which defines the ratio of diffusion length and dipole–dipole interaction radius should not depend on the excitation photon energy. The initial region of kinetics excited in the VUV is described well, however at longer times the kinetics approaches exponential profile with characteristic time . This can be explained by the fact that when the number of excitations N created by a single photon is small as well as the radius of the excited region its dynamics is described not by Equation (5), but with an equation accounting for diffusion:
which leads to smearing of the excited region and hence the decrease of quenching. Experimental kinetics excited by VUV becomes exponential at , that is at times when the diffusion length is added to the radius of the excited region. This assumes that initially the radius of excited region created by VUV photons is smaller than the diffusion length. We can rewrite the Equation (8) for diffusion-controlled dipole–dipole transfer in dimensionless view (, , ) in spherical coordinates as:
with the initial condition:
Equation (10) can be solved numerically, after that the kinetics can be estimated as:
Thus, simulated kinetics with the account for diffusion-controlled smearing of the excited region is shown in Figure 2 by the red solid curve. It fits well the kinetics excited by both 20 and 200 eV photons. The mean number of excitations created by 20 eV photons equals to three (including impact creation of excited and ionized cerium states), and by 200 eV photons according to the evaluated is in the order of 20. This simulation shows that 20 eV photon creates excited region of the radius (i.e., about 10 nm for dipole–dipole interaction radius equal to 2 nm), and for 200 eV photon this radius is about 18 nm. Simulated curve for 200 eV is not shown in Figure 2 since it is very close to that for 20 eV. Instead, a curve for 20 eV calculated using Equation (7) is presented without the account for the extension of the excited region within the radiative time, it reproduces experimental kinetics at small time values rather well. It is clearly seen that at longer times the results of the model with constant radius of excited region differ substantially from the latter model.
Description of kinetics used in this case taking into account the convolution with the apparatus function defined by the profile of the synchrotron radiation pulse as well as PMT and electronics apparatus response reproduces the front of the pulse quite well (Figure 2, top panel). This confirms that there is a fast energy transfer from hot electrons to the cerium f–d subsystem with a delay less than 20 ps as was described above. The time resolution of 38 ps allows to start resolving initial scintillation rise-on part of FemtoMAX kinetics. The exponential fitting yields the rise-on time constant of <10 ps, which cannot be considered an accurate estimation being significantly smaller figure than the time resolution, but confirms the fast energy transfer assumption. To study the rise-on part of the kinetics in detail sources based on high-order harmonic generation with ultra-short pulses are required and such measurements are envisaged.
5. Conclusions
Modern synchrotron radiation sources of III–IV generations, combined with precise scintillation timing measurement techniques, allow for recording the profiles of luminescence kinetics with unprecedented precision. One of the fields, which benefits from such precision is the study of dynamics of electronic excitations in solids. Such parameters as dimensions of excited regions as a function of excitation energy and typical evolution times can be derived from the profiles of luminescence kinetics. Detailed simulation of track structure can potentially improve the accuracy of the model further, providing independent estimations of dimensions of excited regions. The obtained data on charge carrier dynamics in scintillating materials provides a step towards comprehensive theoretical understanding of scintillation mechanism, potentially yielding faster and more efficient radiation detectors for medical tomography, high-energy physics and other areas of scintillator applications.
Author Contributions
Conceptualization, A.V. and A.B.; methodology, A.V. and S.O.; formal analysis, E.T.; investigation, I.K., S.O., and M.K.; resources, M.K.; data curation, E.T.; writing—original draft preparation, A.V., I.K., and S.O.; writing—M.K. and E.T.; funding acquisition, I.K. and M.K. All authors have read and agreed to the published version of the manuscript.
Funding
The synchrotron radiation research at MAX IV (Lund) and PETRA III, DESY leading to this result has been supported by the project CALIPSO plus under the Grant Agreement 730872 from the EU Framework Programme for Research and Innovation HORIZON 2020. Researchers from Tartu were supported by the ERDF funding in Estonia granted to the Center of Excellence TK141 “Advanced materials and high-technology devices for sustainable energetics, sensorics and nanoelectronics” (project No. 2014-2020.4.01.15-0011), Estonian Research Council grant PRG-629.
Acknowledgments
We would like to thank beamline staff for their valuable contribution to our research. Namely, we are grateful to the teams lead by A. Kotlov (P66) and D. Novikov (P23) at DESY, R. Pärna (FinEstBeAMS) and J. Larsson (FemtoMAX) at MAX IV Laboratory. The authors are particularly thankful to A. Krasnikov (University of Tartu) for his invaluable support during experiment at P23 beamline.
Conflicts of Interest
The authors declare no conflict of interest.
References
- Lecoq, P. Pushing the limits in time-of-flight PET imaging. IEEE Trans. Radiat. Plasma Med. Sci. 2017, 1, 473–485. [Google Scholar] [CrossRef]
- Lecoq, P.; Korzhik, M.; Vasil’ev, A. Can transient phenomena help improving time resolution in scintillators? IEEE Trans. Nucl. Sci. 2014, 61, 229–234. [Google Scholar] [CrossRef]
- Korzhik, M.; Tamulaitis, G.; Vasil’ev, A.N. Physics of Fast Processes in Scintillators; Springer Nature Switzerland AG: Cham, Switzerland, 2020. [Google Scholar] [CrossRef]
- Wolszczak, W.; Dorenbos, P. Shape of intrinsic alpha pulse height spectra in lanthanide halide scintillators. Nucl. Instrum. Methods Phys. Res. A 2017, 857, 66–74. [Google Scholar] [CrossRef]
- Wolszczak, W.; Dorenbos, P. Time-resolved gamma spectroscopy of single events. Nucl. Instrum. Methods Phys. Res. A 2018, 886, 30–35. [Google Scholar] [CrossRef] [Green Version]
- Gektin, A.V.; Vasil’ev, A.N. Scintillator energy resolution and a way to improve it by kinetic waveform analysis. Radiat. Meas. 2019, 122, 108–114. [Google Scholar] [CrossRef]
- Gektin, A.; Vasilev, A.; Suzdal, V.; Sobolev, A. Energy resolution of scintillators in connection with track structure. IEEE Trans. Nucl. Sci. 2020. [Google Scholar] [CrossRef]
- Kirm, M.; Vielhauer, S.; Zimmerer, G.; Kisand, V.; Sombrowski, E.; Steeg, B. Prompt and delayed secondary excitons in rare-gas solids. Low Temp. Phys. 2003, 29, 822. [Google Scholar] [CrossRef] [Green Version]
- Belsky, A.; Ivanovskikh, K.; Vasil’ev, A.; Joubert, M.F.; Dujardin, C. Estimation of the electron thermalization length in ionic materials. J. Phys. Chem. Lett. 2013, 4, 3534–3538. [Google Scholar] [CrossRef]
- Auffray, E.; Baccaro, S.; Beckers, T.; Benhammou, Y.; Belsky, A.N.; Borgia, B.; Boutet, D.; Chipaux, R.; Dafinei, I.; de Notaristefani, F.; et al. Extensive studies on cef3 crystals, a good candidate for electromagnetic calorimetry at future accelerators. Nucl. Instrum. Methods Phys. Res. A 1996, 383, 367–390. [Google Scholar] [CrossRef] [Green Version]
- Pedrini, C.; Moine, B.; Bouttet, D.; Belsky, A.N.; Mikhailin, V.V.; Vasil’ev, A.N.; Zinin, E.I. Time-resolved luminescence of CeF3 crystals excited by X-ray synchrotron radiation. Chem. Phys. Lett. 1993, 206, 470–474. [Google Scholar] [CrossRef]
- Pedrini, C.; Belsky, A.N.; Vasil’ev, A.N.; Bouttet, D.; Dujardin, C.; Moine, B.; Martin, P.; Weber, M.J. Fluorescence properties of CeF3 and some other cerium doped crystals and glasses under VUV and X-ray synchrotron excitation. Mater. Res. Soc. Symp. Proc. 1994, 348, 225–234. [Google Scholar] [CrossRef]
- Belsky, A.N.; Glukhov, R.A.; Martin, P.; Mikhailin, V.V.; Pedrini, C.; Vasil’ev, A.N. VUV excitation of intrinsic luminescence of ionic crystals with complicated band structure. Simulation. J. Lumin. 1997, 72, 96–97. [Google Scholar] [CrossRef]
- Glukhov, R.A.; Belsky, A.N.; Vasil’ev, A.N.; Pedrini, C. Simulation of energy conversion and transfer in CeF3 after VUV photon absorption. J. Alloys Compd. 1998, 275, 488–492. [Google Scholar] [CrossRef]
- Terekhin, M.A.; Kamenskikh, I.A.; Makhov, V.N.; Kozlov, V.A.; Munro, I.H.; Shaw, D.A.; Gregory, C.M.; Hayes, M.A. Luminescence quenching studies of CeF3 and CeF3-LaF3 by mean of nanosecond time-resolved VUV spectroscopy. J. Phys. Condens. Matter 1996, 8, 497–504. [Google Scholar] [CrossRef]
- Pärna, R.; Sankari, R.; Kukk, E.; Nõmmiste, E.; Valden, M.; Lastusaari, M.; Kooser, K.; Kokko, K.; Hirsimäki, M.; Urpelainen, S.; et al. FinEstBeaMS—A wide-range Finnish-Estonian beamline for materials science at the 1.5 GeV storage ring at the MAX IV laboratory. Nucl. Instrum. Methods Phys. Res. A 2017, 859, 83–89. [Google Scholar] [CrossRef] [Green Version]
- Pankratov, V.; Pärna, R.; Kirm, M.; Nagirnyi, V.; Nõmmiste, E.; Omelkov, S.; Vielhauer, S.; Chernenko, K.; Reisberg, L.; Turunen, P.; et al. Progress in development of a new luminescence setup at the FinEstBeAMS beamline of the MAX IV laboratory. Radiat. Meas. 2019, 121, 91–98. [Google Scholar] [CrossRef]
- P23 In-situ and Nano X-ray Diffraction Beamline. Available online: https://photon-science.desy.de/facilities/petra_iii/beamlines/p23_in_situ_and_nano_x_ray_diffraction/index_eng.html (accessed on 1 May 2020).
- Enquist, H.; Jurgilaitis, A.; Jarnac, A.; Bengtsson, Å.; Burza, M.; Curbis, F.; Isaksson, L.; Kotur, M.; Kroon, D.; Lindau, F.; et al. FemtoMAX—An X-ray beamline for structural dynamics at the short-pulse facility of MAX IV. J. Synchrotron Radiat. 2018, 25, 570–579. [Google Scholar] [CrossRef]
- Omelkov, S.; Nagirnyi, V.; Gundacker, S.; Spassky, D.; Auffray, E.; Lecoq, P.; Kirm, M. Scintillation yield of hot intraband luminescence. J. Lumin. 2018, 198, 260–271. [Google Scholar] [CrossRef]
- Turtos, R.M.; Gundacker, S.; Omelkov, S.; Auffray, E.; Lecoq, P. Light yield of scintillating nanocrystals under X-ray and electron excitation. J. Lumin. 2019, 215, 116613. [Google Scholar] [CrossRef]
- Gundacker, S.; Turtos, R.M.; Auffray, E.; Lecoq, P. Precise rise and decay time measurements of inorganic scintillators by means of X-ray and 511 keV excitation. Nucl. Instrum. Methods Phys. Res. A 2018, 891, 42–52. [Google Scholar] [CrossRef]
- Feldbach, E.; Kamada, M.; Kirm, M.; Lushchik, A.; Lushchik, C.; Martinson, I. Direct excitation of impurity ions by hot photoelectrons in wide-gap crystals. Phys. Rev. B 1997, 56, 13908–13915. [Google Scholar] [CrossRef]
- Belsky, A.N.; Glukhov, R.A.; Kamenskikh, I.A.; Martin, P.; Mikhailin, V.V.; Munro, I.H.; Pedrini, C.; Shaw, D.A.; Shpinkov, I.N.; Vasilev, A.N. Luminescence quenching as a probe for the local density of electronic excitations in insulators. J. Electron Spectros. Relat. Phenomena 1996, 79, 147–150. [Google Scholar] [CrossRef]
- Yokota, M.; Tanimoto, O.J. Effects of Diffusion on Energy Transfer by Resonance. J. Phys. Soc. Jpn. 1967, 22, 779–784. [Google Scholar] [CrossRef]
- Weber, M.J. Multiphonon Relaxation of Rare-Earth Ions in Yttrium Orthoaluminate. Phys. Rev. B 1973, 8, 54–64. [Google Scholar] [CrossRef]
- Onderisinova, Z.; Kucera, M.; Hanus, M.; Nikl, M. Temperature-dependent nonradiative energy transfer from Gd3+ to Ce3+ ions in co-doped LuAG: Ce, Gd garnet scintillators. J. Lumin. 2015, 167, 106–113. [Google Scholar] [CrossRef]
- Spassky, D.; Vasil’ev, A.; Belsky, A.; Fedorov, N.; Martin, P.; Markov, S.; Buzanov, O.; Kozlova, N.; Shlegel, V. Excitation density effects in luminescence properties of CaMoO4 and ZnMoO4. Opt. Mater. 2019, 90, 7–13. [Google Scholar] [CrossRef]
- Kirm, M.; Nagirnyi, V.; Feldbach, E.; De_Grazia, M.; Carre, B.; Merdji, H.; Guizard, S.; Geoffroy, G.; Gaudin, J.; Fedorov, N.; et al. Exciton-exciton interactions in CdWO4 irradiated by intense femtosecond vacuum ultraviolet pulses. Phys. Rev. B 2009, 79, 233103. [Google Scholar] [CrossRef]
- Laasner, R.; Fedorov, N.; Grigonis, R.; Guizard, S.; Kirm, M.; Makhov, V.; Markov, S.; Nagirnyi, V.; Sirutkaitis, V.; Vasil’ev, A.; et al. Band tail absorption saturation in CdWO4 with 100 fs laser pulses. J. Phys. Condens. Matter 2013, 25, 245901. [Google Scholar] [CrossRef]
- Belsky, A.; Fedorov, N.; Gridin, S.; Gektin, A.; Martin, P.; Spassky, D.; Vasil’ev, A. Time-resolved luminescence z-scan of CsI using power femtosecond laser pulses. Radiat. Meas. 2019, 124, 1–8. [Google Scholar] [CrossRef]
- Grim, J.Q.; Ucer, K.B.; Burger, A.; Bhattacharya, P.; Tupitsyn, E.; Rowe, E.; Buliga, V.M.; Trefilova, L.; Gektin, A.; Bizarri, G.A.; et al. Nonlinear quenching of densely excited states in wide-gap solids. Phys. Rev. B 2013, 87, 125117. [Google Scholar] [CrossRef]
- Vasil’ev, A.N. From luminescence non-linearity to scintillation non-proportionality. IEEE Trans. Nucl. Sci. 2008, 55, 1054–1061. [Google Scholar] [CrossRef]
Figure 1.
CeF3 luminescence kinetics at different excitation energies (specified in the legend). The top panel shows the profiles of the bunches of three different experimental setups used for the convolution of the simulated decay curves. Lower panel: The blue curve is a single exponential with radiative time 18 ns convoluted with the bunch of FinEstBeAMS; the black curve is a sum of four exponentials with decay times 150 ps (3%), 1 ns (15%), 6 ns (46%), and 18 ns (36%) convoluted with the bunch of P23. An additional peak at ~3 ns in the bunch profile of PETRA III is due to a spurious bunch.


Figure 2.
CeF3 luminescence kinetics and bunch time profiles (panel layout is the same as in Figure 1) with the simulation results using the Equations (7) and (11) on two time scales. Dashed curve corresponds to the model without diffusion which causes extension of the excited region.
Figure 2.
CeF3 luminescence kinetics and bunch time profiles (panel layout is the same as in Figure 1) with the simulation results using the Equations (7) and (11) on two time scales. Dashed curve corresponds to the model without diffusion which causes extension of the excited region.

© 2020 by the authors. Licensee MDPI, Basel, Switzerland. This article is an open access article distributed under the terms and conditions of the Creative Commons Attribution (CC BY) license (http://creativecommons.org/licenses/by/4.0/).
Share and Cite
MDPI and ACS Style
Kamenskikh, I.; Tishchenko, E.; Kirm, M.; Omelkov, S.; Belsky, A.; Vasil’ev, A. Decay Kinetics of CeF3 under VUV and X-ray Synchrotron Radiation. Symmetry 2020, 12, 914. https://doi.org/10.3390/sym12060914
AMA Style
Kamenskikh I, Tishchenko E, Kirm M, Omelkov S, Belsky A, Vasil’ev A. Decay Kinetics of CeF3 under VUV and X-ray Synchrotron Radiation. Symmetry. 2020; 12(6):914. https://doi.org/10.3390/sym12060914
Chicago/Turabian StyleKamenskikh, Irina, Evgeny Tishchenko, Marco Kirm, Sergey Omelkov, Andrei Belsky, and Andrey Vasil’ev. 2020. "Decay Kinetics of CeF3 under VUV and X-ray Synchrotron Radiation" Symmetry 12, no. 6: 914. https://doi.org/10.3390/sym12060914
Note that from the first issue of 2016, this journal uses article numbers instead of page numbers. See further details here.